This document is available in alternative formats, such as Braille, large print, digital (on disk or by email) upon request, and on the Shire’s website at http://www.dandaragan.wa.gov.au
[2015 / 2016 ANNUAL REPORT] Jurien Bay Administration Centre | 69 Bashford Street | JURIEN BAY WA 6516
PO Box 676 | JURIEN BAY WA 6516 | Phone 08 9652 0800 | Fax 08 9652 1310 | Email: [email protected] | Website: www.dandaragan.wa.gov.au | Office Hours: 8.00
am - 5.00 pm Monday to Friday

ANNUAL REPORT 2015/16
Page 1 of 108

ANNUAL REPORT 2015/16
Page 2 of 108
TABLE OF CONTENTS
COUNCILLORS .................................................................................................. 3
STAFF AND REMUNERATION ........................................................................ 5
PRESIDENT’S REPORT .................................................................................... 6
CHIEF EXECUTIVE OFFICERS REPORT ......................................................... 8
DEPUTY CHIEF EXECUTIVE OFFICER REPORT ......................................... 11
EXECUTIVE MANAGER INFRASTRUCTURE REPORT .............................. 20
EXECUTIVE MANAGER CORPORATE & COMMUNITY SERVICES REPORT ............................................................................................................ 34
COMPETITIVE NEUTRALITY......................................................................... 45
NATIONAL COMPETITION POLICY & STATE RECORDS ACT ................ 46
AUDIT REPORT ............................................................................................... 47
FINANCIAL REPORT ....................................................................................... 49

ANNUAL REPORT 2015/16
Page 3 of 108
COUNCILLORS
Cr Leslee Holmes - President
PO Box 245 CERVANTES WA 6511 Ph: 0408 419 468
Email: [email protected] Expiry of Term: 2019
Cr Darren Slyns - Deputy President PO Box 869 JURIEN BAY WA 6516
Ph: 0407 420 126 Email: [email protected]
Expiry of Term: 2017
Cr Wayne Gibson PO Box 717 JURIEN BAY WA 6516
Ph: 0428 653 002 Email: [email protected]
Expiry of Term: 2019
Cr Kaye McGlew PO Box 63 DANDARAGAN WA 6507
Ph: 0428 555 536 Email: [email protected]
Expiry of Term: 2019
Cr Mike Sheppard PO Box 390 JURIEN BAY WA 6516
Ph: 0439 177 222 Email: [email protected]
Expiry of Term: 2017
Cr Judy Kulisa PO Box 854 JURIEN BAY WA 6516
Ph: 0411 243 423 Email: [email protected]
Expiry of Term: 2017

ANNUAL REPORT 2015/16
Page 4 of 108
COUNCILLORS continued…
C r Dahlia Richardson PO Box 7 BADGINGARRA WA 6521
Ph: 0428 529 046 Email: [email protected]
Expiry of Term: 2019
Cr Peter Scharf PO Box 298 JURIEN BAY WA 6516
Ph: 0449 735 722 Email: [email protected]
Expiry of Term: 2019
RETIRED COUNCILLORS
Cr Tim Bailey 197 Zendora Road JURIEN BAY WA 6516
Cr Lawrie Short PO Box 36 DANDARAGAN WA 6507
Cr David Kent PO Box 371 JURIEN BAY WA 6516

ANNUAL REPORT 2015/16
Page 5 of 108
STAFF AND REMUNERATION
TONY NOTTLE Chief Executive Officer
IAN RENNIE Deputy Chief Executive Officer
SCOTT CLAYTON Executive Manager Corporate &
Community Services
GARRICK YANDLE Executive Manager Infrastructure
SALARY RANGE 2016
$100,000 - $109,999 1
$110,000 - $119,999 2
$120,000 - $129,999 0
$130,000 - $139,999 0
$140,000 - $149,999 0
$150,000 - $159,999 0
$160,000 - $169,999 1
Full time equivalent employees 48

ANNUAL REPORT 2015/16
Page 6 of 108
PRESIDENT’S REPORT 2015 / 2016
Having only been elected to the position of Shire President in October 2015, I certainly thank my fellow Councillors for their support in representing them as their leader. I also take this opportunity to sincerely thank Councillor Wayne Gibson for his dedication and commitment to the President’s role during the previous 2.5 years. He certainly led the Council during a busy period for the Shire where major Infrastructure projects were planned and completed. His leadership and compassion were greatly appreciated by all. Over the previous year our Shire has seen an ongoing commitment to the delivery of key infrastructure projects including: Opening and operation of the Jurien Bay Visitors Information and Civic
Centre Completion of the sealed link between Brand Highway and Indian Ocean
Drive along Mimegarra Road Completion of the Jurien Bay Infill Sewer Project Stages 1A & 1B Commencement of the Jurien Bay Foreshore Extension of Dobbyn Park Council is well aware of the need for small business and tourism to thrive within our Shire while exploiting our comparative advantages such as our relatively close proximity to Perth, diverse region and stunning natural assets. The private industry has also seen the benefits of investing in our Shire with key projects commencing which include: Commencement of the multi-million dollar upgrade of the Cervantes
Pinnacles Caravan Park Significant upgrade of the Jurien Bay Tourist Park Construction of the new Sandpiper Motel has commenced Carpenter Beef continue to work towards the completion of the Cataby
Abattoir Construction and operation of AAA Egg Free Range Egg Farm at Hill
River Upgrade and redevelopment of the Lobster Shack, Cervantes Our Council continues to plan for our future with each elected member taking on specific portfolios within the Shire. Key portfolios include aged care, tourism development, agribusiness, roads and key infrastructure, community facilities, recreation and engagement.

ANNUAL REPORT 2015/16
Page 7 of 108
I would like to thank my fellow Councillors, and in particular my Deputy President, Cr Darren Slyns, for their support and commitment to Council and the community. I also would like to thank our Chief Executive Officer, Mr Tony Nottle, and the staff for their guidance and contribution to the Shire of Dandaragan throughout the year in review. And finally, I would like to thank you, the community for your ongoing interest in the towns and the Shire that we live in and encourage you all to continue your involvement in the groups, organisations and businesses within our area. I commend the 2015 / 2016 Annual Report to you.
Cr Leslee Holmes PRESIDENT
Member of Moore, Mr Shane Love MLA, presents Caitlin Porteous with the Young Citizen of the Year Award 2015

ANNUAL REPORT 2015/16
Page 8 of 108
CHIEF EXECUTIVE OFFICER’S REPORT 2015 / 2016
Last year, the Shire of Dandaragan undertook its biggest infrastructure project ever, with the construction of the Jurien Bay Visitors Information and Civic Centre (JBVICC). Following on from this significant milestone saw the completion of the Jurien Bay Infill Sewer Project which was officially opened in June this year. This project was a result of the SuperTowns planning and funding that will assist in the further development of Jurien Bay as a sub-regional centre for our region. I certainly take this opportunity to thank all of those involved with the development and delivery of this project, in particular our Executive Manager of Infrastructure Garrick Yandle, who managed the project from start to finish. The Ordinary Election in October 2015 saw an expansion of Councillor representation across the Shire and an injection of new ideas and enthusiasm into the Council Chamber. The new Council also elected its first female President in Councillor Leslee Holmes as well as new Deputy President Councillor Darren Slyns. I congratulate both Councillors Holmes and Slyns on their new role at the Dandaragan Shire Council. Under this new leadership team, Council undertook its major review of the Shire’s Community Strategic Plan “in house” and held a number of community consultation sessions out in the community. The result is a finalised realistic plan that will guide the Shire over the next 10 years. The community provided essential feedback into what is important to them, what the community needed, but also with a realistic viewpoint about what we can afford. The community established Key Priorities for the Shire of Dandaragan which included:
• Ownership of Badgingarra Research Station and development of a viable regional waste facility
• Representation on Council Planning and land availability for health precinct and further residential development
• Planning for the development of aged care facilities close to medical services
• Actively engage with Federal and State Governments on their respective Roads and Mobile Blackspot Programs
• Provide and manage road and bridge networks for safe and efficient vehicle movement
• Lobby for improved mobile phone capacity of existing towers • Advocate the viable use of aquifers in agricultural and horticultural areas

ANNUAL REPORT 2015/16
Page 9 of 108
• Tourism and marketing with a focus on promotion and product development based on natural assets
The Shire has continued to expand its Community Services through a variety of ways including the continuation of the Leeuwin Scholarship, Community Grants Scheme, hosting of the Regional Club Development Officer Scheme and youth initiatives. The 2016 “Spray the Grey” was an outstanding success with locals, regular visitors and holiday makers all enjoying the festivities and youth focused activities. Our Shire directly employs over 60 people and approximately a further 20 people employed indirectly through regular contracts for services. I take this opportunity to thank all of those at the Shire of Dandaragan for the continued commitment to providing services to our communities. Staffing
Our staffing has remained relatively stable in comparison with previous years. This is quite pleasing considering the increased workload with statutory changes and legislative requirements, as well as the increased level of infrastructure projects that have been taken on “in-house”. As part of our Strategic Community Plan, Goal 5 (Build a proactive leading local government) has a key performance indicator of staff turnover rate. The past four years have shown an improvement in this area. Our senior management team has continued to remain stable with Ian Rennie (DCEO/Development Services), Scott Clayton (Corporate & Community
0%
5%
10%
15%
20%
25%
30%
35%
40%
2011/2012 2012/2013 2013/2014 2014/2015 2015/2016
Employee Turnover %

ANNUAL REPORT 2015/16
Page 10 of 108
Services) and Garrick Yandle (Infrastructure Services), leading our teams with dedication, commitment and passion within the Shire structure. Budget Initiatives As with previous years, Council continues to implement a number of initiatives to assist in the growth and development of the Shire. Some of these included: Discount for users of the Jurien Bay Airstrip (JBA) – total discount $28,018 Free use of the JBVICC for educational purposes
Budget Incentive / Initiative Value of discount
Landing Fees waived to encourage use of the JBA
$28,018
Central West Men’s Shed (Cervantes) waiver of annual rates
$3,024
Waiver of charges to JBDHS for use of Education / Conference Centre
$6,220
I certainly encourage you all to read the Annual Report for 2015/16 and reflect on another successful year for the Shire of Dandaragan.
Tony Nottle CHIEF EXECUTIVE OFFICER
Royalties for Regions Jurien Bay Sewerage Project (Stage 1B)
ANNUAL REPORT 2015/16
Page 11 of 108
DEPUTY CHIEF EXECUTIVE OFFICER REPORT 2015 / 2016
The areas covered by this report include the following: Planning Building Environmental Health Emergency Services Ranger Services
There has been a number of staff who have carried out various duties within Development Services during the year as follows: Deputy Chief Executive Officer, Mr Ian Rennie Manager Planning, Mr David Chidlow Planning Officer, Mrs Barbara Macaulay ceased her employment with the
Shire in July 2015. Manager Building Services, Mr Will George Principal Environmental Health Officer, Mr Dennis Gillam was employed in
this role from April 2015 to January 2016. Following Dennis’ leaving, the Shire contracted Mr Bass Sahar to full this role temporarily until such time as the recruitment process was finalised and in May 2016 Mr Felix Neuweiler commenced in this position.
Community Emergency Services Coordinator, Mr Matt Dadd Senior Ranger, Mr Terry Sims Ranger, Ms Rosalyn Edwards Council Secretary / Personal Assistant, Mrs Robyn Headland Development Services Administration Officer, Ms Trevena Taylor
The following is a brief summary of some of the projects undertaken and issues faced in the Development Services department..
BUILDING STATISTICS 2015 / 2016
SUMMARY BUILDING STATISTICS 2015 / 2016
Class 1 Residences 52 $15,363,632
Outbuildings / Garages 39 1,168,710
Patio / Pergola / Carports 23 176,782
Swimming Pools 4 $81,750

ANNUAL REPORT 2015/16
Page 12 of 108
Additions 10 $313,264
Office / Commercial Sheds etc 7 $3,285,000
Fit-outs / Occupancy 5 $60,200
Fences 7 $55,170
Re-roof / Lean-to / Verandahs 8 $65,950
Storage Sheds / Units / Temporary Camps 3 $2,921,750
Communication Towers 1 $21,750
Miscellaneous 1 $500
Total $23,514,458
52
39
23
4
10
7
5
7 8
3
1 1
CONSTRUCTION TYPE YEAR 2015-2016 Class 1 Residences
Outbuildings / Garages
Patio / Pergola / Carports
Swimming Pools
Additions
Office / Commercial Sheds etc
Fit-outs / Occupancy
Fences
Re-roof / Lean-to / Verandahs
Storage Sheds / Units / Temporary Camps
Communication Towers
Miscellaneous
ANNUAL REPORT 2015/16
Page 13 of 108
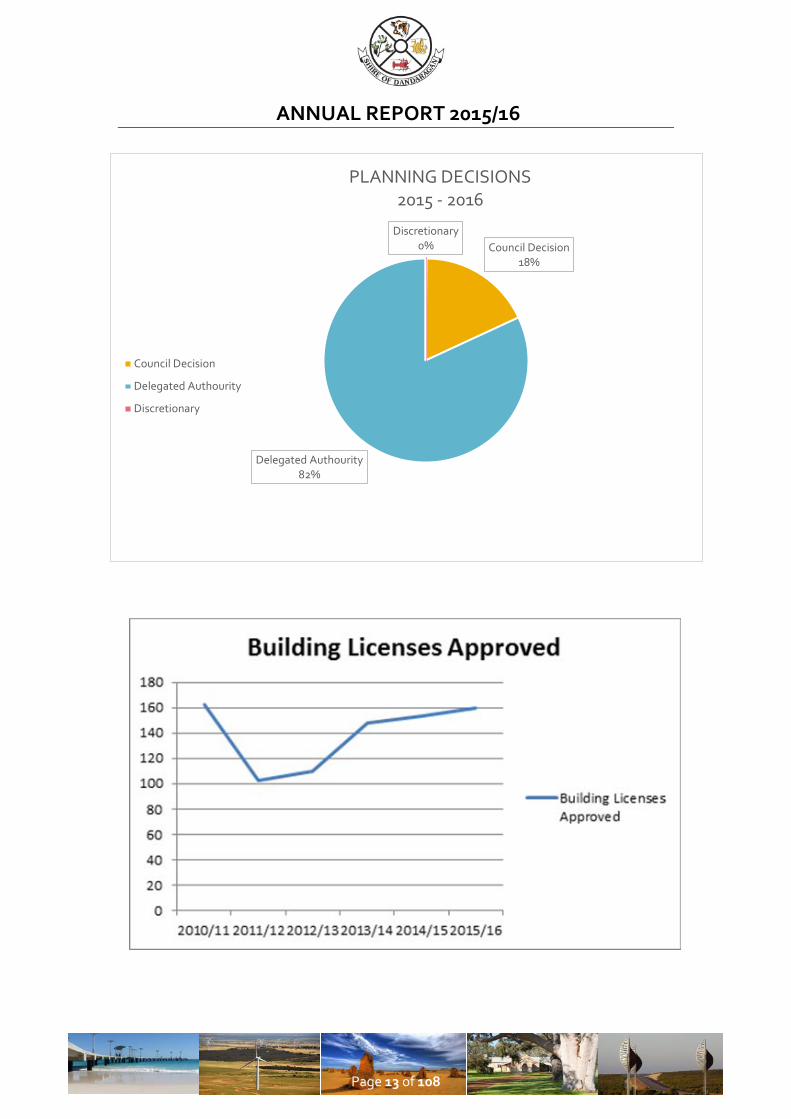
Council Decision 18%
Delegated Authourity 82%
Discretionary 0%
PLANNING DECISIONS 2015 - 2016
Council Decision
Delegated Authourity
Discretionary

ANNUAL REPORT 2015/16
Page 14 of 108
BUILDING REPORT The items of the Capital Works Budget Sheet for the 2015/2016 financial year have involved a number of project completions and ongoing project commitments. The Jurien Community Recreation Centre re-roof and toilet upgrade project was delayed by difficulties in finding price competitive and available tiling contractors. The Shire of Dandaragan Administration building extensions and refurbishment work was completed relatively smoothly and almost within the financial year period with a short overlap from the suppliers to complete their installation work. The Jurien Community Recreation Centre kitchen refurbishment, in line with Council’s Policy for kitchen refurbishment, was completed satisfactorily and has been in operation for normal community use since completion of the work. There were a reduced number of budget carry-overs from the last financial year into the current period which has removed quite a few obstacles to completing the current budgeted work schedules.

ANNUAL REPORT 2015/16
Page 15 of 108
Community education following the introduction of Bushfire Attack Level assessments (BAL) introduced by the Department of Planning and the Department of Fire and Emergency Services (DFES), has progressed well and community preparedness to provide the required assessments has become well understood. Just as for the new building legislation introduction, the adjustment to the builder and general community in understanding of the need for a Fire Intensity projection, determined for each individual site resulting from the BAL assessment, will be an ongoing community education concern for Shire Development Services staff into the future. BUSHFIRE PLANNING The State Government introduced bushfire planning reforms which were announced in 2015. The package of landuse planning reform documents include the: Gazetted State Planning Policy No. 3.7: Planning in Bushfire Prone Areas
(SPP 3.7); Guidelines for Planning in Bushfire Prone Areas (the Guidelines), Planning Bulletin No 111/2015 Planning in Bushfire Prone Areas; and Fact Sheets to assist in understanding the implementation of these
reforms. Both the Manager Planning Services and Manager Building Services completed the Bushfire Attack Level (BAL) Level One in order to assess development applications in bushfire prone Areas. MAJOR PLANNING APPROVALS During the 2015 / 2016 Financial Year, Council approved or reapproved a number of major Development Applications including the following: Two storey motel (31 room) development on Lot 103 Cnr Murray Street
and Sandpiper Street, Jurien Bay. Renewal of planning approval for the establishment of the Joanna Plains
Peaker Project on Lot 3907 Brand Highway, Cataby. Planning approval for chalets and all of Stage One development for the
RAC Cervantes Holiday Park Lot 229 Aragon Street. Planning approval for small scale Workforce Accommodation
(backpackers) comprising two transportable units at Lot 2991 Woodbine Road, Regans Ford.
SUBDIVISION Council advised the Western Australian Planning Commission conditional support for the proposed application for amalgamation of Lot No’s 8, 9, 10, 11, 362 Madrid Street, Cervantes

ANNUAL REPORT 2015/16
Page 16 of 108
COASTAL HAZARD RISK MANAGEMENT AND ADAPTION PLANNING The project undertaken aims to assist the Shires of Gingin and Dandaragan to develop risk mitigation strategies for coastal settlements that are or are predicted to come under pressure from coastal development and change associated with coastal erosion and inundation, and to integrate these strategies into relevant planning instruments. The draft Dandaragan Coastal Hazard Risk Management and Adaption Planning report was presented to Council and referred to the Department of Planning for comment. The Department of Planning requested further information and consultation be undertaken, recognising that the report is breaking new ground and evolving as knowledge increases. Progress on the finalisation of the report continues and it is expected to be completed in the 2016/2017 financial year. LOCAL PLANNING SCHEME NO 7, AMENDMENT NO 28 Scheme Amendment No 28 dealt with merging Local Planning Scheme No.7 provisions with the Planning and Development (Local Planning Schemes) Amendment Regulations 2015. The amendment was determined to be a simple amendment and did not require community consultation. Council resolved to adopt the Amendment and to request Final Approval from the Minister for Planning. ROAD CLOSURES Council agreed to close an area of Talavera Road Reserve (18m wide and 300m in length) on the southern side of Reserve 30838, for amalgamation into the Reserve after having considered all submissions received. The approval of the Minister for Lands was requested in accordance with Section 58 of the Land Administration Act 1997. Council agreed to permanently close an area of Road Reserve on the corner of Aragon Street and Talavera Road that generally comprises the existing Memorial Park for creation of a new Reserve vested to the Shire of Dandaragan for the purposes of “Memorial Park” after having considered all submissions received. The approval of the Minister for Lands was requested in accordance with Section 58 of the Land Administration Act 1997. POLICY AMENDMENTS Council amended the policy relating to Outbuildings and Temporary Accommodation in Rural Residential and Special Use – Rural Development Zones to permit outbuildings up to 300m2 to be approved under delegation if

ANNUAL REPORT 2015/16
Page 17 of 108
there are no objections from neighbours and some minor amendments to definitions. LOCAL DEVELOPMENT PLAN Council advertised the proposed Local Development Plan for Lot 62 Roberts Street, Jurien Bay by publishing a notice of the proposed plan in a newspaper circulating in the Scheme area and on the Council website, including a statement that submissions may be made to the local government by 12 August 2016. DISABILITY SERVICES REPORT
Council continues to be conscious of the need to provide accessible facilities and events. In accordance with the Shire of Dandaragan’s 2012 - 2017 Disability Access and Inclusion Plan (DAIP) the Shire ensures that new buildings and landscaping comply with the latest standards. Existing Shire facilities are gradually upgraded to ensure that they can be enjoyed by everyone. The DAIP is regularly reviewed by staff and listed actions are progressively implemented. ENVIRONMENTAL HEALTH The Shire undertakes a range of actions designed to maintain and protect public health. During the year, more than 200 risk assessments of caravan parks, public pools, recreational waters, food businesses and public buildings were carried out to ensure legislative requirements were being adhered to. In addition, the Shire responded to nearly 100 service requests on a range of issues including noise, pests, food, waste water and other general health issues. EMERGENCY SERVICES The 2015/2016 financial year provided a busy year for the Volunteer Bushfire Brigades within the Shire of Dandaragan. Local volunteers from the Shire of Dandaragan responded to 15 reported fires. One of the most significant fires was the Meadows Road fire that started on the evening of 26 January 2016 (Australia Day). This fire burnt out over 28,000 Hectares and caused the evacuation of the Grey Community and closed the Indian Ocean Drive for a period of four days. Local and external fire fighters spent 12 days on the fire ground before it was declared safe. Local bush fire volunteers also provided assistance with fires across the Midwest Gascoyne and Southwest of the State over the past 12 months. Two deployments to the Shire of Carnarvon were required over a 10 day period. The large Shire of Waroona fire saw two separate deployments to form Strike

ANNUAL REPORT 2015/16
Page 18 of 108
Teams. This included four 4x4 Broadacre fire appliances and five fast attack fire appliances and a total of 18 personnel within each deployment. The financial year saw the Local Government Grants Scheme provide funding to complete the internal fitout of the Badgingarra Fire Station and electrical wiring of the Canover Fire Station, totalling $36,000. Bushfire brigade volunteers have really embraced fire training provided by Department of Fire and Emergency Services, with a strong contingent attending a wide range of strategic training to better assist their brigades and support the Shire of Dandaragan and the community. RANGER SERVICES
The 2015/2016 rural aerial firebreak inspections were carried out with the assistance of Chief Bushfire Control Officer, Mr Richard Allen and Fire Control Officer, Mr Bruce Cook. Follow up on ground inspections were carried out by Shire Rangers. A number of infringements were issued along with a number of work orders which were issued as part of an education program. The Shire is confident this education program will continue to assist in compliance next year.
LOCALITY NO. OF INFRINGEMENTS
Residential (Jurien Bay) 47
Residential (Cervantes) 11
Residential (Dandaragan) 3
Special Use (Jurien Bay) 15
Rural-Residential (Jurien Bay) 8
Rural (Dandaragan) 2
TOTAL 86
LOCALITY NO. OF WORK ORDERS Jurien Bay (Urban) 5
Jurien Bay (Rural-Residential) 34
Cervantes (Urban) 13
Cervantes (Rural) 1
Dandaragan (Rural) 10
Dandaragan (Rural-Residential) 2
Badgingarra (Rural) 4
Regans Ford (Rural) 2
TOTAL 71

ANNUAL REPORT 2015/16
Page 19 of 108
During the summer months of November through to February the main activity for Ranger Services is fire control. The months following reflect an increase in the amount of tourists in the Shire and the focus for Ranger Services moved toward customer education and monitoring camping areas. One area of particular emphasis has been the use of off road vehicles and dog control. The Easter and Anzac weekends saw an increase in off road vehicle queries.
Dogs have not been a major concern in the Shire. Rangers have attended a small number of dog attacks which were resolved through education of the owners and conciliation with both parties. Owners were happy to comply with fences and confinement of their dogs. It has become apparent that there are some pet owners who allow their dogs to wander at large early in the day and Rangers have now commenced early morning patrols to deter this practice. It was apparent over the summer period off road vehicles are a large problem in particular for the communities of Cervantes and Jurien Bay over the holiday weekends. By putting up extra signage we hope the town sites of Cervantes and Jurien will have minimal traffic and offenders in the future. Whilst the Shire of Dandaragan has some beautiful camping areas it is apparent that more policing and control is required. The grants that the shire has received to redevelop Sandy Cape with additional toilet blocks, shelters and barbeques has helped, also the free camping areas within the shire
Ian Rennie DEPUTY CHIEF EXECUTIVE OFFICER

ANNUAL REPORT 2015/16
Page 20 of 108
EXECUTIVE MANAGER INFRASTRUCTURE REPORT 2015 / 2016 The Infrastructure Department is responsible for all operational staff, with crews based in Jurien Bay and Dandaragan. These crews are responsible for the maintenance and development of the Shire’s roads, footpaths, storm water infrastructure, parks and gardens, sporting fields, and the four landfill sites. GENERAL WORKS Crews have been busy throughout the year carrying out regular maintenance of the Shire’s Infrastructure assets. The Jurien Bay Crew is responsible for all aspects associated with Parks and Gardens within each of the four Shire towns, as well as the urban streets. This includes maintenance of the foreshore areas and swales within Beachridge. The Dandaragan Crew is responsible for all aspects associated with road maintenance including maintenance grading, roadside spraying and slashing, culvert cleaning, and pavement repairs. The crew operates two maintenance graders and a road patrol truck which manage road maintenance across gravel roads, sealed roads and town streets within the Shire. Where necessary the crews share equipment and resources. Where required the Shire also uses local contractors from our tender panel to undertake tasks surplus to our resources or requiring a specific skillset. PERSONNEL The 2015 / 2016 financial year saw a consolidation of the recent management position changes within the Infrastructure Department. The infrastructure leadership positions are as follows: Executive Manager Infrastructure – Garrick Yandle Jurien Bay Operations Supervisor (Parks and Gardens) – Troy Wright Dandaragan Operations Supervisor (Works) – Paul Woolstencroft Engineering Technical Officer – James Morrison (departed in September
2015) Infrastructure Asset Coordinator – Angus Padfield (commenced in January
2016) Reticulation Fitter – Geoff Beale Leading Hand (Parks and Gardens) – Shaun Lyons Leading Hand (Final Trim Grader Driver) – William Sturges (was on long
service leave for 6 months from January 2016 – June 2016, during this time his role was undertaken by a contractor with assistance from various other
ANNUAL REPORT 2015/16
Page 21 of 108
crew members as required). Mechanic – David Taylor. The Infrastructure team also continues to manage the four landfill facilities within the Shire through a combination of staff and local contractors. As part of our continuing commitment to staff training and development, the Infrastructure staff undertook a number of training courses throughout the year. These included: Troy Wright and Paul Woolstencroft - WA Local Government Supervisors
Association Conference – August 2015 Shaun Lyons - Playground Inspection Course - September 2015 Bush Fire training - November 2015 First Aid Courses – February 2016 LGIS “Working Well” – general staff – March 2016 LGIS “Operational Leadership” - Supervisors and Coordinators – March
2016 LGIS “At the Coal Face” – All staff – March 2016 LGIS Workplace Behaviours – April 2016 The 2015 / 2016 financial year saw the final year of two trainee positions within the Infrastructure team. This included a trainee based out of each depot, with one focused on Horticulture and the other focused on Civil Construction. Both of these positions were nominally for a period of 2 years. Haydn Mackail successfully completed his Certificate III in Horticulture in January 2016. He has now progressed into a full role as a General Hand on staff in the Parks and Gardens team. David Sims-Lynch completed a Certificate III in Civil Construction in September 2015 and parted ways with the Shire following his completion of the course. CAPITAL WORKS PROJECTS - GENERAL The following section provides a summary of Capital Projects undertaken by the Infrastructure team in 2015/16. 1. I70001 - Jurien Bay Sewerage Project – Stages 1A and 1B The Jurien Bay Sewerage Stage 1 project construction commenced in June 2015 with construction completed in December 2015. Following this commissioning of the system took place over a number of months with the official opening of the project taking place in June 2016. The total funding for the project was approximately $5,618,901, exclusive of GST. The sources of this funding can be summarised as follows:

ANNUAL REPORT 2015/16
Page 22 of 108
FUNDING COMMENTS SuperTowns $ 3,694,850 Secured Shire $ 300,000 Supertowns interest WC DCWA PS 7 Diversion $ 220,000 Estimate from WC WC DN300 Sewer 600m $ 342,000 Estimate from WC RFR Grant $ 1,062,051 Confirmed February 2015 REVISED TOTAL FUNDING $ 5,618,901 Revised Project Budget
Stage 1 of the project consists of a new Pump Station and Pressure Main, as well as Infill Sewer. This will service areas east of Bashford Street including: Civic precinct Jurien Bay Police Station Jurien Bay District High School Health precinct Residential areas in Hamersley, Whitfield, Batt and Bayliss Streets. Key components of the project were as follows:
Practical Completion achieved 4 December 2015. Contractors commenced demobilisation 4 December 2015. Final walk through inspection 9 December 2015. Commissioning successfully completed 31 March 2016, prior to
correspondence from Water Corporation for official handover. Handover completed late May 2016. Official opening occurred on Friday, 24 June 2016 with Member for Moore,
Mr Shane Love, MLA and other key stakeholders in the project attending Shire continued to monitor and manage dust suppression once contractors
demobilised from site. Initial stages of construction came in approximately $800K under budget. CEO and Executive Manager Infrastructure (EMI) investigated possible
extensions to Infill Sewerage with consultant and Water Corporation and the Design and Cost estimate was finalised mid July 2016.
2. 270055 - Bashford Street Upgrade The Concept Design for a potential future Bashford Street Upgrade was completed by Cardno in February 2014 and presented Council. The design was reviewed by the Infrastructure team, with Council feedback presented to the consultant. The Concept design was revised and was presented at a Community Workshop in February 2015. The Concept Design was endorsed by Council in March 2015. The Infrastructure team has continued to work with Cardno regarding detailed design, which is expected to be completed during early 2017. Currently the Shire does not have any funding for the whole construction

ANNUAL REPORT 2015/16
Page 23 of 108
works of the project however potential funding sources will be pursued as the design progresses. Completing the detailed design will provide greater opportunities towards obtaining funding for the project. Small components of the project that were completed in the 2015 / 2016 financial year include: Dual Use Path from Dryandra Boulevard to Lesueur Drive Dual Use Path from Lindsay Street to Cook Street Dual Use Path from Whitfield Road to Nineteenth Avenue Small components of the project have been budgeted for in the 2016 / 2017 budget and are expected to be completed in the next financial year, these include: Dual Use Path from Roberts Street to White Street adjacent to the Caravan
Park. Dual Use Path from Batt Street to Whitfield Road adjacent to the property
boundaries.
3. I20079 - Foreshore Redevelopment The Infrastructure team continued to work on the planning and construction procurement for the Jurien Bay Foreshore Redevelopment. Construction commenced in April 2016 with completion expected early 2017. Key components of the project include: Clearing Permit received November 2015. EMI issued a series of Request for Quotes (RFQ) to undertake the works
as small scale packages with a series of specialised sub-contractors, sourced locally where possible rather than going to full tender.
Irrigation bores were installed early April 2016. Water Storage Tanks were installed May 2016. Earthworks and clearing commenced early May 2016. Fencing and Traffic Management onsite during construction. Upcoming works in the 2016 / 17 financial year will include:
Installation of irrigation pipework Topsoil preparation Turf installation Drainage installation Landscaping at jetty precinct Landscaping and car park upgrade at Cook Street toilets Street furniture installation
4. I20064 - Jurien Bay Entry Statements
Submissions were sought from the public for the design of new entry statements for the township of Jurien Bay. Submissions were received in

ANNUAL REPORT 2015/16
Page 24 of 108
December 2014 and advertised for public comment during January 2015. The submissions were presented at a Community Workshop in February 2015. The preferred design submission provided by ICAN was endorsed by Council in March 2015. The Infrastructure team continued to work with ICAN regarding detailed design and costs. Construction was completed in early 2016.
Contractor Little Rhino Designs was appointed to progress design through
to construction. Fabrication commenced in May 2016. Installation was completed in September 2016.
5. I20046 - Beachridge Planter Boxes
Work continued on the staged renewal of the Beachridge planter boxes. This has entailed the infill of the old tree box areas located in the park strips throughout Beachridge, where trees were causing pavement damage. The Infrastructure team is progressively filling in the areas with asphalt each year.
Construction commenced November 2015. Construction completed in June 2016.
6. I80001 - Baudin Park Playground Replacement
One of the Shire’s most popular playgrounds aka “Pirate Park” located in Baudin Park, Jurien Bay, had suffered significant structural damage in the previous years. Options were investigated to fix the damaged components, however the company who supplied the original playground no longer exists and parts were not available. The decision was made in line with the Shire’s Playground Replacement Plan to remove the old playground and install a new one. Key features of this project were:
To retain the Pirate Ship / Boat theme. Adventure Plus was commissioned to supply and install the replacement
playground. Removal of old playground took place 14 June 2016. Installation of new playground was completed in June 2016.
7. CCTV at Jetty Car Park
Project completed mid-September 2015.
8. Footpath Bashford Street (Lindsay Street to Cook Street) Works completed December 2015. Included an additional connection to Bashford Street crossover near Cook
Street. Included an additional connection through Harding Park between Lindsay
Street and Lesueur Drive.
ANNUAL REPORT 2015/16
Page 25 of 108
9. I10041 - Turquoise Path Realignment of sand affected path commenced in October 2015. Asphalt completed December 2016.
10. I30034 - Cervantes Waste Facility Fence Completed September 2015
11. I20078 - Jurien Bay Cricket Net Completed early October 2015.
12 I10043 - Footpath Bashford Street (19th Ave to Whitfield Rd Funded through Aged Friendly Communities Grant and completed in
April 2016 Shire staff are to remove old redundant footpath in late 2016.
13. I10042 - Footpath Indian Ocean Drive (Lesueur Dve to Dryandra Bvd) Funded through Aged Friendly Communities Grant and completed in
April 2016
14. I30035 - RSL Car Park Completed May 2016. CAPITAL WORKS PROJECTS - ROADS Rural Roads
Seal Renewal - funded through Regional Road Group [RRG]
1. RRG027 - Mimegarra Road The Shire was fortunate to receive $5M of State Initiatives funding from the WA State Government for the upgrade of Mimegarra / Meadows Roads. This entailed upgrading some 25km of a Type 3 gravel road to a Type 6 sealed road. Construction of the Meadows Road section took place in late 2014. This included pavement preparation with 150mm of gravel road base being imported and prepared along the 12km section, with the two coat seal being undertaken in December 2014. The Shire continues to liaise with Iluka regarding their planned works at the Brand Highway end of Mimegarra Road. Works were completed by Shire staff with a combination of local sub-contractors for specific components of the project. A summary of the 2015/16 works is as follows:
Clearing took place August 2015. Bulk earthworks, realignment and pavement preparation took place
October to December 2015.

ANNUAL REPORT 2015/16
Page 26 of 108
Final pavement preparation took place from March to April 2016. First coat primer seal completed late April 2016. Intersection Asphalt at Brand Highway completed early May 2016. Second coat seal to be undertaken December 2016.
2. MUR856 - Jurien East Road
Upgrade from Brand Highway (SLK 0) to Cockleshell Gully Road (SLK 24)
Approximately 24km to be done in stages over 3 years. Survey undertaken March / April 2016 Design commenced May 2016 Clearing requirements under investigation, Maia Environmental
undertook initial survey early May 2016. Initial vegetation management completed March 2016. Full clearing for widening to commence once Clearing Permit
received. Culverts procurement to commence once design complete. Major earthworks, pavement construction and seal widening to be
undertaken in 2016 / 2017 Budget. Gravel Resheets – predominantly funded through Municipal Funds
1. MGR049 - Goonderdoo Road Gravel Resheet commenced June 2016 and completed July 2016.
2. MGR015 - Agaton Road Gravel Resheet scheduled for June / July 2016.
3. RRG002 - Dandaragan Road Pavement reconstruction and widening. SLK 51.2 – 54.7. First coat primerseal completed February 2016. Second coat seal to be undertaken December 2016 funded through
2016 / 2017 projects.
4. MGR034 - Kayanaba Road Gravel Resheet completed August 2015. SLK 0 – 4.
5. MGR019 - Coalara Road Gravel Resheet completed September 2015. SLK 18.6 – 22.6
6. RTR127 - Sandy Cape Road Gravel Resheet completed September 2015. SLK 2.0 – 4.0.
ANNUAL REPORT 2015/16
Page 27 of 108
7. MGR016 - Waddi Road Gravel Resheet completed May 2016. SLK 6.4 – 9.0.
8. MGR047 - Cantabilling Road
Gravel Resheet completed May 2016. SLK 22.5 – 26.5. Issues with Declared Rare Flora meant a section could not be
completed. Urban Roads (funded through Roads to Recovery [RTR])
1. RTR901 - Cervantes Drainage
Aragon Street Stage 1 – Completed. Aragon Street Stage 2 – TBA. Weston and Lang – completed June 2016.
2. RTR252 - Ocean View Parade – Jurien Bay Heights
Works completed 9 January 2016. SLK 0 – 2.0
3. RTR117 - Meagher Drive – Badgingarra
Works completed 8 January 2015. Full length approximately 2km.
4. RTR205 - Lesueur Drive Between Osprey Close and Ward Street completed December 2015 Between Ward Street and Shearwater Drive completed April 2016.
5. RTR066 - Hamersley Street Awarded at December Council Meeting to WCP Civil. Works completed April 2016. Between Batt Street and Bayliss Street.
6. RTR107 - Corunna Road – Cervantes Awarded at December Council Meeting to WCP Civil. Works completed April 2016. Completed between Talavera Road and Ronsard Park.
7. RTR127 - Sandy Cape Road $130K funds to be transferred from Jurien East Road to Sandy Cape
Road. 2.0km of pavement construction and primerseal. SLK 0 – 2.0. First coat primerseal completed April 2016.
ANNUAL REPORT 2015/16
Page 28 of 108
PARKS & GARDENS The Parks and Gardens team and specific contractors continue to maintain all assets in each of the 4 towns within the Shire. Key areas of note in each town are: Badgingarra Oval Badgingarra Community Centre surrounds Town Streets Badgingarra Landfill Site
Dandaragan Oval Dandaragan Community Centre surrounds Pioneer Park Town Streets Community Resource Centre Grounds Cemetery Aggie’s Cottage Dandaragan Landfill Site
Jurien Bay Oval Jurien Community and Recreation Centre surrounds Town Streets Public Open Space Beachridge Swales Jurien Bay Jetty Turquoise Way Sandy Cape Cemetery Industrial Areas Airfield Jurien Landfill Site
Cervantes Oval Cervantes Community Recreation Centre surrounds Parks Town Streets Industrial Area Airfield Cervantes Waste Transfer Station

ANNUAL REPORT 2015/16
Page 29 of 108
PLANT AND EQUIPMENT In 2015 / 2016 the Shire replaced or bought the following items of Plant and Equipment: Heavy Vehicles
Small Trucks 7 Yard Truck sought through WALGA eQuotes in late 2015. EMI reviewing quotes based upon budget. To be held over to 2016 / 2017 budget
Loader for Jurien Yard Seeking second hand machine at Auction. RFQ for Disposal advertised in Shire Matters in April 2016 To be held over to 2016 /2017 budget
Small Trucks Road Maintenance Truck arrived February 2016
Water Tanker Purchased second hand machine in December 2015
Maintenance Grader Arrived March 2016
Slashing Tractor Arrived June 2016
Parks Equipment
Trailers Mower trailer for Dandaragan on order
Trailers Mower trailer for Jurien Bay procured November 2015
Mowers Verti mower procured September 2015 Cub mower replaced September 2015
Light Vehicles
2 x Colorado 7 replaced October 1 x Toyota Prado replaced October 2 x utilities replaced via second hand vehicles November 2015 1 x Colorado 7 (Environmental Health Officer) replaced February 2016
with Mazda CX5 2 x Colorado 7 LTZ (Executive Manager Corporate and Community
Services [EMCCS] and EMI) were replaced in March 2016 with 2 x Toyota Fortuners

ANNUAL REPORT 2015/16
Page 30 of 108
ASSET MANAGEMENT The Infrastructure team continues to development key Asset Management programs for Shire Infrastructure. Key items addressed in 2015 / 2016 as part of ongoing Asset Management included:
1. Infrastructure Management Procedures Document reviewed To be utilised in developing relevant Asset Management Plans
2. Asset Management Roads EMI presented Road Asset Management Overview at May Forum
including. Categorising Roads Hierarchy 1 – 5 Level of Service 1 – 5 Condition Rating Inspection 1 – 5 Heavy Vehicle (RAV) Policy Capital Budget for 2016/17
Data Collection All roads are in RAMM Require revaluing
3. Foot Path Asset Management Plan RAMM Data Survey completed late 2014 Valuations unit rates to be verified and updated Renewal works completed to be updated
Develop Hierarchy High and Low Level of Service Condition Rating (Use information from Bike Plan)
These values need to be updated into RAMM
4. Bike Network Plan New projects submitted to Department of Transport for 2016 / 2017 mid
October 2015 Bashford Street precinct projects awarded ($59,750) Bashford Street Dual Use Path (Roberts to White Streets) Bayliss Street Dual Use Paths (Bashford to Hamersley Streets) Whitfield Road Dual Use Paths (Bashford to Hamersley Streets)
5. Reserves / Parks Asset Management Plan RAMM Data - previously picked up by Ben Simmonds has been
uploaded into RAMM Photos and valuations to be added Review against Public Open Space Policy.

ANNUAL REPORT 2015/16
Page 31 of 108
Condition Rating to be completed Level of Service to be completed
6. Building Asset Management Plan RAMM Data - previously picked up by Ben Simmonds has been
uploaded into RAMM Photos and valuations to be added Review against Public Open Space Policy Condition Rating to be completed Level of Service to be completed Over the last 2 years we have had all buildings and infrastructure
(minus roads and footpaths) valued by Griffin Valuers for both insurance and fair value including replacement cost, remaining effective life and current value
7. Airport Asset Management Plan Completed June 2015 Executive Manager Infrastructure to review bi-annually Executive Manager Infrastructure conducted Condition Rating
inspection May 2016 Executive Manager Infrastructure developing capital renewal budget
projects for 2016/17 and next 5 years Executive Manager Infrastructure developing maintenance plan
Royalties for Regions Jurien Bay Sewerage Project Stage 1B

ANNUAL REPORT 2015/16
Page 32 of 108
STRATEGIC PLAN The following key performance indicators from the Shire of Dandaragan Strategic Plan were addressed by the Infrastructure Team in 2014 / 2015:
GOAL AREA KEY PERFOMANCE INDICATOR COMMENTS
1. Great Place for Residential and Business Development
Ensure timely provision of essential and strategic infrastructure
Key infrastructure essential and strategic projects have been undertaken as per the Capital Projects sections of this report. Significant projects include: • Jurien Bay Infill Sewer
Project Stage 1. • Jurien Bay Foreshore
Redevelopment. • Mimegarra Road
upgrade. • Sandy Cape Road
upgrade. • Corunna Road renewal. • Meagher Drive reseal
Residents have access to television channels
The Shire continues to distribute television service from the Jurien Bay Depot. Currently the community has access to all channels available to resident in regional Western Australia
2. Healthy, Safe and Active Community
N/A
3. Strong and connected community
N/A
4. Healthy Natural and Built Environment
Manage and maintain priority road verges which link or are strategic sites on Shire reserves
Develop and implement gravel pit restoration program
Relevant gravel pits continue to be maintained and rehabilitated on an ongoing basis.

ANNUAL REPORT 2015/16
Page 33 of 108
The Infrastructure Department continues to be an extremely busy and vital component of the Shire’s delivery of services to the communities of Jurien Bay, Dandaragan, Cervantes and Badgingarra. The day-to-day routine maintenance activities, combined with the capital projects, has kept all members of the team active and provided great opportunities for staff and local contractors to work together. The year 2016 / 2017 looks to be busier again with more capital works projects likely to reach construction phase as the Shire continues its pursuit of strategic infrastructure development.
Garrick Yandle EXECUTIVE MANAGER INFRASTRUCTURE
ANNUAL REPORT 2015/16
Page 34 of 108
EXECUTIVE MANAGER CORPORATE & COMMUNITY SERVICES REPORT
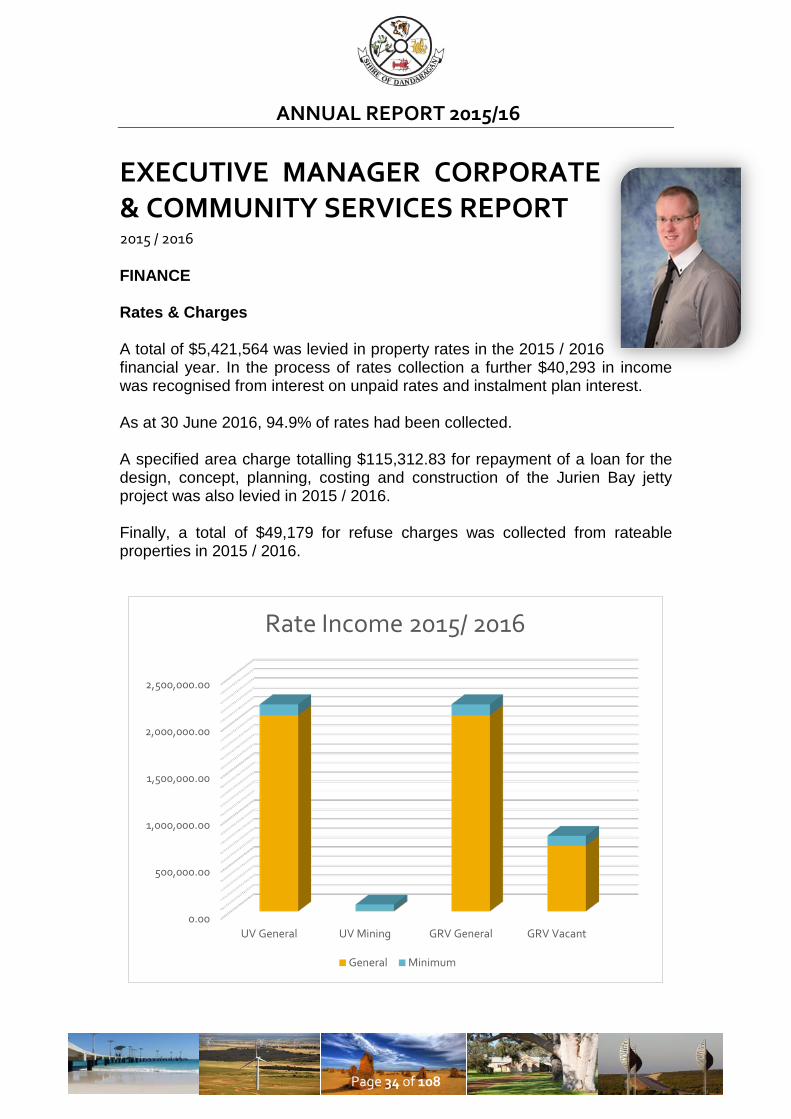
2015 / 2016 FINANCE Rates & Charges A total of $5,421,564 was levied in property rates in the 2015 / 2016 financial year. In the process of rates collection a further $40,293 in income was recognised from interest on unpaid rates and instalment plan interest. As at 30 June 2016, 94.9% of rates had been collected. A specified area charge totalling $115,312.83 for repayment of a loan for the design, concept, planning, costing and construction of the Jurien Bay jetty project was also levied in 2015 / 2016. Finally, a total of $49,179 for refuse charges was collected from rateable properties in 2015 / 2016.
0.00
500,000.00
1,000,000.00
1,500,000.00
2,000,000.00
2,500,000.00
UV General UV Mining GRV General GRV Vacant
Rate Income 2015/ 2016
General Minimum

ANNUAL REPORT 2015/16
Page 35 of 108
Grants A total of $4,742,430 in grants was secured by the Shire of Dandaragan during 2015 / 2016, these include: $ 757,735 from the WA Grants Commission $ 225,000 for the Sandy Cape Extension $2,000,000 from Main Roads for the Local Roads State Initiative $ 173,774 from Main Roads WA Regional Road Group $1,149,142 from Roads to Recovery
The Shire of Dandaragan would like to thank all the agencies who have made grants or contributions towards projects in the 2015 / 2016 financial year. Financial Results The Shire of Dandaragan finished 2015 / 2016 with a surplus of $2,250,891. However, the majority of this surplus is as a result of large unspent grants and incomplete capital works projects. Therefore, this surplus does not constitute a surplus of funds after all requirements have been met in the true definition of a surplus, rather reflects outstanding commitments that will be reprogrammed into the 2016 / 2017 budget. COMMUNITY The 2015 / 2016 year has seen the consolidation of major changes in the Community Development Team at the Shire from the previous year, with the Club Development Officer/Community Services Coordinator and the Community Development Officer working to deliver community development across the Shire. This new team have been more proactive in connecting with established community groups and groups of interest. They have been working more collaboratively with the Jurien Bay Youth Group and schools throughout the Shire which is improving engagement with youth in the Shire, and has resulted in a more focused approach to Youth Services. The Team has formalised its approach to working with both seniors and young people, by developing specific plans that become informing strategies for Council. This ensures that projects are appropriate, strategically-focused, and importantly, are supported by the groups that they impact. The Age Friendly Community Plan was adopted in April 2016 which enabled older members of our communities to provide feedback and ideas for areas of focus. This plan allows Council to respond to changing needs and ensure support for the wellbeing of the Shire of Dandaragan’s ageing population. Projects we worked on such as the Age Friendly Community Bus Pilot; improved access from the RSL Village and Beachridge with upgraded footpaths in Jurien Bay; beach access for people with disability and mobility issues, and continued advocacy for support services for seniors in their own home across the Shire, were all objectives that the public raised with us

ANNUAL REPORT 2015/16
Page 36 of 108
during this consultation phase. Youth Services have been focused on Youth Leadership; Events and Social Media; and Services. There has been continued support from Council of the Leeuwin Ocean Adventure Scholarship Program which awards one full fare on a Leeuwin voyage to a young person in the Shire who is aged between 15-18 years of age. This year two young women from Jurien Bay District High School (JBDHS) were successful and participated in the trip of lifetime in October 2016. After consultation with young people, we set up a social media app specifically for youth in the Shire. Shire of Dandaragan Team App has been launched which will be one of a number of social media platforms the Shire Community Development team will use to share news, get feedback, and engage with young people from around the Shire. Council have also continued to support Jurien Bay Youth Group financially and has been working more collaboratively with the Coordinator to look at ways we can improve the service. The team also worked with JBDHS on an art mural project for the Jurien Bay Federation Memorial Park toilet block, and with Badgingarra Primary School on the WALGA Banners in the Terrace Competition. The Spray the Grey Youth Festival was also cemented as an annual youth event coordinated by the Community Development team and the second festival in October 2015 attracted a large number of the Shire’s young people. We are continuing to grow this event and to work with young people to ensure that the festival is responsive to youth and community.
Spray the Grey 2016
ANNUAL REPORT 2015/16
Page 37 of 108
Mid-2016, the Shire was successful in receiving funding from Department of Local Government and Communities to undertake a Youth Plan. A consultant has been engaged and a survey for all young people has been developed and promoted widely. To date the main respondents are under the age of eleven years so the survey has been held open until the beginning of the school year to get the older demographic involved. This is important as they are the group that the Shire is seeking to engage with to have them more involved in decisions that affect them directly. The Community Development team worked with multiple community groups and consultants on the management of the North Head Radar Installation. The site was surveyed to determine the level of historical value, and this project will continue onto its next phase which is to determine community support and ideas for management. However, it was determined that in the short-term minor repairs be undertaken to stabilise bunker ‘A’ and this was undertaken by the Shire late 2016. The main focus of the Club Development Officer is to work with clubs to assist them to be more sustainable into the future and provide training in governance, talent development and volunteer recruitment and training. Funding for the position is provided in conjunction with the Department of Sport and Recreation and the Shire of Coorow. Since commencing in August 2014 the Club Development Officer has assisted clubs to review and update their constitutions, and has provided training workshops for club committees across the two Shires. There is regular reporting to the Department of Sport and Recreation and an operational plan is developed each year. The focus for this year is to promote Kidsport to the community and involve more people in sport and recreation. Future planning workshops are scheduled for early 2017 to provide clubs from across the Shire the opportunity to learn how to plan for the future and set their clubs up for success. Community Events The Shire hosts and supports many events across each of the towns. The Community Development team works with event organisers to ensure that they comply with statutory regulations so that events are kept incident free. Well managed and appropriate events are instrumental in showcasing our towns to the wider West Australian community to encourage more visitors that help our towns grow and be economically viable. The Community Development Team worked on creating a more seamless system for approving and issuing event permits after feedback that the existing process was complicated and hard to understand. These changes are now being rolled out administratively and the team will continue to work with event organisers and other Shire departments to ensure continuity and efficiency of event approvals, and make improvements where necessary.
ANNUAL REPORT 2015/16
Page 38 of 108
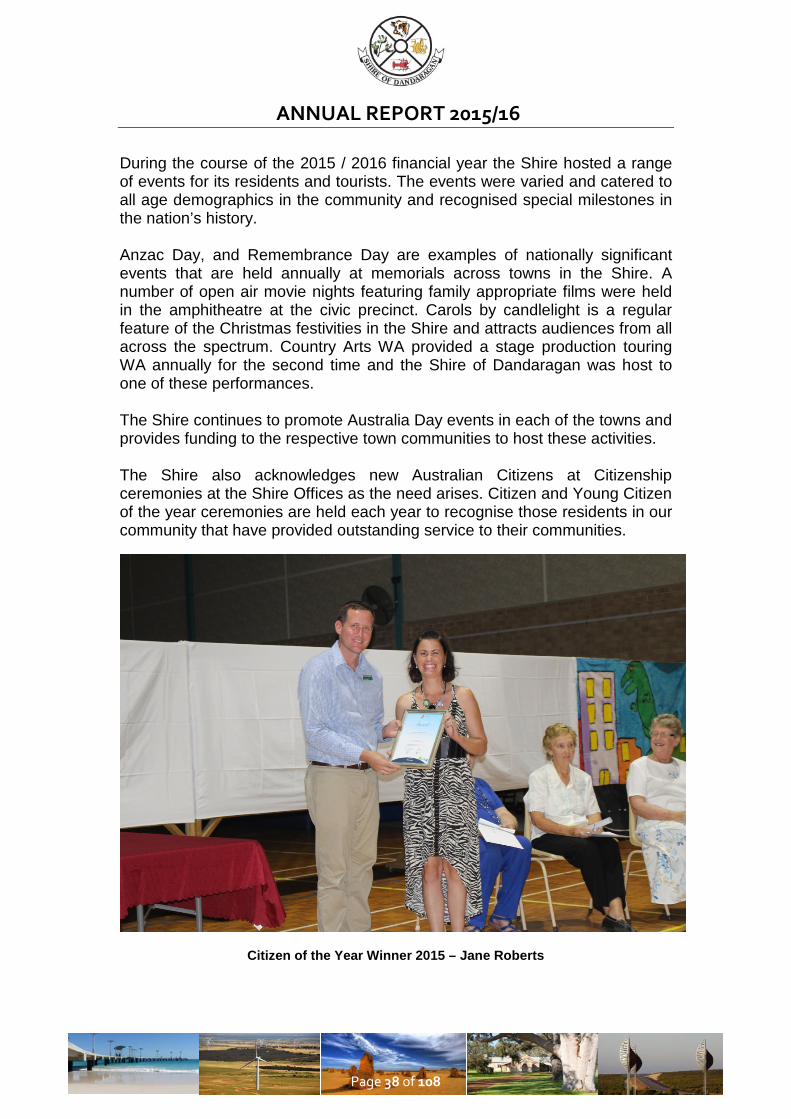
During the course of the 2015 / 2016 financial year the Shire hosted a range of events for its residents and tourists. The events were varied and catered to all age demographics in the community and recognised special milestones in the nation’s history. Anzac Day, and Remembrance Day are examples of nationally significant events that are held annually at memorials across towns in the Shire. A number of open air movie nights featuring family appropriate films were held in the amphitheatre at the civic precinct. Carols by candlelight is a regular feature of the Christmas festivities in the Shire and attracts audiences from all across the spectrum. Country Arts WA provided a stage production touring WA annually for the second time and the Shire of Dandaragan was host to one of these performances. The Shire continues to promote Australia Day events in each of the towns and provides funding to the respective town communities to host these activities. The Shire also acknowledges new Australian Citizens at Citizenship ceremonies at the Shire Offices as the need arises. Citizen and Young Citizen of the year ceremonies are held each year to recognise those residents in our community that have provided outstanding service to their communities.
Citizen of the Year Winner 2015 – Jane Roberts

ANNUAL REPORT 2015/16
Page 39 of 108
Annually the Shire of Dandaragan hosts the Jurien Bay Beach Mission and the Cervantes Family Festival which is targeted at engaging young people in healthy outdoor activities utilising the Shire’s magnificent beaches. There are regular markets held on Sunday’s across the year operated by the Lions Club of Jurien Bay and attract stallholders from within the Shire as well as from further afield. These markets have become a main attraction for locals and tourists alike. A list of events and activities for the 2015/2016 year are listed below. The Lions Club Sunday Markets (8 to 10 each year) Australia Day Festivities across the four towns Citizen and Young Citizen of the Year Awards evening Indian Ocean Festival Aggies Christmas Pop Up Shop Carols in the Park Spray the Grey Youth Festival Anzac Day Service Remembrance Day Service Vietnam Veterans Day Memorial Service Duyfken Visit – Dirk Hartog 400th Anniversary Voyage Jurien Bay Family Fiesta Wamplified Jurien Bay Junior Fishing Competition Girl Guides Whitfords Coastal Region Environmental Camp Dandaragan Walkathon Jurien Bay Dog’s Breakfast Cervantes Show & Shine Cervantes Market Day The Rocky Horror Picture Show Badgingarra Chamber of Commerce BBQ Christmas Night
In addition, the Shire received a number of requests to hold weddings on local beaches from community members local and afar in which the Community Development team assisted in coordinating use of Shire land and resources. The Shire recognises the community building advantages of hosting such events and will continue to support the above activities and endeavour to attract more of these events in the future. Shire of Dandaragan / Tronox Small Grants Program Policy 6.6 - Sport and Recreation Funding includes a provision for the Shire of Dandaragan and Tronox Sporting and Recreational Equipment and Small Grants Funding program.

ANNUAL REPORT 2015/16
Page 40 of 108
The Shire of Dandaragan, in its annual budget, allocates $15,000 to be matched by Tronox to fund the program. The purpose of the program is to assist community based organisations in the purchase of durable equipment and small grants to undertake improvements. The applications for funding this year were in excess of $100,000 due to the work of the Community Development team promoting the grants to sporting and community groups. A total of $48,880 worth of projects were funded, enabled by the carryover from previous years. The following groups received funding from this program in 2015 / 2016:
Organisation Project Description Project Cost ($)
Grant ($)
Badgingarra Community Association
Laptop and software 1,010.86 505.43
Cervantes Community Recreation Centre
Kitchen Equipment 1,700.00 750.00
Cervantes Cultural Committee
Sandwich Advertising Boards
1,263.60 631.80
Cervantes Playgroup Toys 1,335.55 667.78
Dandaragan St John’s Ambulance
Shed Fit Out 2,732.25 1,366.13
Coastal Kids Care Cubby house ground cover upgrade
4,727.27 2,363.64
Jurien Bay Bowling Club Cooking Range 6,289.00 3,144.50
Jurien Bay Football Club Roller Door 2,875.00 1,437.53
Jurien Bay Football Club Blinds 4,614.80 2,307.40
Jurien Bay Progress Association
Signage 689.70 344.85
Jurien Sport and Recreation Centre
Compressor for cool room
7,436.00 3,718.00
Jurien Bay Volunteer Marine Rescue Group
Fuel tank and Pump 4,200.00 2,100.00
TOTAL $38,874.03 $19,337.06

ANNUAL REPORT 2015/16
Page 41 of 108
Community Grants Program Policy 1.6 - Community Grants Program provides funds to community based organisations and individuals to support the promotion and development of social, economic, recreational, art and cultural benefits for the residents of the Shire of Dandaragan. The policy contains two sections, firstly a recurring annual grant as follows: 1. Local publications
Each year the Shire will incorporate within the budget a grant to be provided in September of each year to the community newspapers. The grant of $250 each is to cover the cost of community service announcements by the Shire in the various local publications. Advertising by the Shire is to be invoiced separately.
Shire of Dandaragan Community Newspapers 2. Student awards - schools
Each year the Shire will contribute $100 to the Jurien Bay District High School, $100 to the Central Midlands Senior High School, and $50 each to the Dandaragan Primary School, Badgingarra Primary School, Jurien Bay Primary School and Cervantes Primary School award nights.
3. Australia Day
Each year the Shire of Dandaragan will grant $1,000 to the Jurien Bay Progress and Tourism Association, $1,000 to the Cervantes Ratepayers & Progress Association, $750 to the Badgingarra Community Association and $750 to Advance Dandaragan for Australia Day festivities. This grant is to assist organisations with conducting an Australia Day event and is not intended to meet the total cost of the event. This year, the Cervantes Ratepayers & Progress Association were unable to coordinate their local

ANNUAL REPORT 2015/16
Page 42 of 108
event so the Cervantes Football Club were able to step in to ensure the event took place.
4. Leeuwin Sail Training Foundation
The Shire of Dandaragan will make an annual grant to the Leeuwin Sail Training Foundation to the value of one full fare in support of a local participant. Due to no recipient in the previous year, this year the Shire was able to support two local participant’s to take part in the voyage.
Jurien Bay District High School Leewin Scholarship recipients
5. Art acquisition
Each year the Shire of Dandaragan will contribute to the Cervantes Cultural Committee $1,500 to secure the Shire of Dandaragan Art Acquisition Prize. The $1,500 will be awarded to the chosen artist irrespective of the purchase value of the artwork. The prize will be determined by the Shire President or his delegate, who will seek guidance from the judges. In addition to the Acquisition Prize, the Shire of Dandaragan will donate $500 towards the cost of delivering the Art Show. These funds will be spent at the discretion of the Cervantes Cultural Committee.
6. Mid-West Group of Affiliated Agricultural Societies Inc
Each year the Shire of Dandaragan will contribute to the Mid West Group of Affiliated Agricultural Societies Inc $200 to showcase the Shire of Dandaragan’s products and attractions.

ANNUAL REPORT 2015/16
Page 43 of 108
The second section of the policy allows groups and individuals to make application for funding, with each application being assessed against the policy criteria. In 2015 / 2016 the following were funded from this policy:
ORGANISATION PROJECT DESCRIPTION GRANT
Cervantes P&C Art, Music and Dance Workshop $845.00
Cervantes Playgroup Petting Zoo $926.55
Cervantes Volunteer Bush Fire Brigade
Dinner for Emergency Services $1,500.00
Advance Dandaragan Community Dinner $500.00
Advance Dandaragan Christmas Carols $300.00
Dandaragan Community Resource Centre Archive Specialist Workshop $1,500.00
Dandaragan Community Resource Centre Yallalie Meteorite Event $1,500.00
Redgum Reports Photoshop Workshop $1,500.00
West Midlands Group Women, Wellbeing and Wine $1,500.00
Wolba Wolba Heritage Committee Christmas Pop Up Stores $1,500.00
Inspirational Community Arts Network 2 x Singing, Performing and Arts Workshops
$1,000.00
Jurien Bay Men’s Shed Octoberfest $1,500.00
Dandaragan Golf Club 50th Anniversary Celebration $1,400.00
Jurien Bay Beach Mission Summer Holiday Program $1,500.00
Cervantes Family Festival Summer Holiday Program $1,500.00
Jurien Community Resource Centre 3 x Movie Licences $750.00
TOTAL $19221.55

ANNUAL REPORT 2015/16
Page 44 of 108
Scott Clayton EXECUTIVE MANAGER CORPORATE & COMMUNITY SERVICES

ANNUAL REPORT 2015/16
Page 45 of 108
COMPETITIVE NEUTRALITY 2015 / 2016 National Competition Policy reforms require local governments to comply with and implement the principles of competitive neutrality and restructure monopolies (or near monopolies), subject to a public benefits assessment. National Competition Policy is a framework for reform and is about promoting competition in business across Australia regardless of private or public ownership, size of business or ownership structure. The key issues for local government are: Competitive neutrality - removal of any net benefits, which accrue to
government business activities as a result of public ownership. Legislation review (Local Laws) - to review government regulation,
which restricts competition. Structural reform - to reform the structure of government owned
monopoly business where it is possible to introduce competition. When conducting the competitive neutrality review, Council needed to ascertain the following in relation to services provided by the Shire: Is it a business? Is the annual income over $200,000? If the annual income is under the $200,000 threshold, then Council is not required to implement competitive neutrality. At the present time, Council does not have any business units with an annual income over $200,000, therefore, Council has not had to apply the competitive neutrality principle on National Competition Policy during the year under review.

ANNUAL REPORT 2015/16
Page 46 of 108
NATIONAL COMPETITION POLICY & STATE RECORDS ACT 2015 / 2016 NATIONAL COMPETITION POLICY The Shire of Dandaragan had 35 Local Laws that may have restricted competition and hence were reviewed under National Competition Policy. This process was completed in 2000 / 2001 with the gazettal of the following Local Laws on the 9 May 2001: Activities on thoroughfares and trading in thoroughfares and public
places Beekeeping Local Government Property Standing Orders Extractive Industries Fencing Repeal Local Law 2001 Pest Plants Bushfire Brigades Public Cemeteries Dogs Local Law STATE RECORDS ACT 2000 In compliance with the State Records Act 2000, the Shire of Dandaragan has a Record Keeping Plan. The amended Record Keeping Plan outlines the improvements made to the Shire’s record keeping policies, as they relate to staff and Councillors. The Plan has assisted the Shire to implement an efficient and effective electronic records management system, InfoXpert. This system has promoted ongoing improvements and continued compliance with the State Records Act 2000. Although the conversion to an electronic system was not easy, the benefits it provides far outweigh the initial difficulties. Each individual is now responsible for their own documents, in accordance with the State Records Act; records are everyone’s responsibility.
ANNUAL REPORT 2015/16
Page 47 of 108
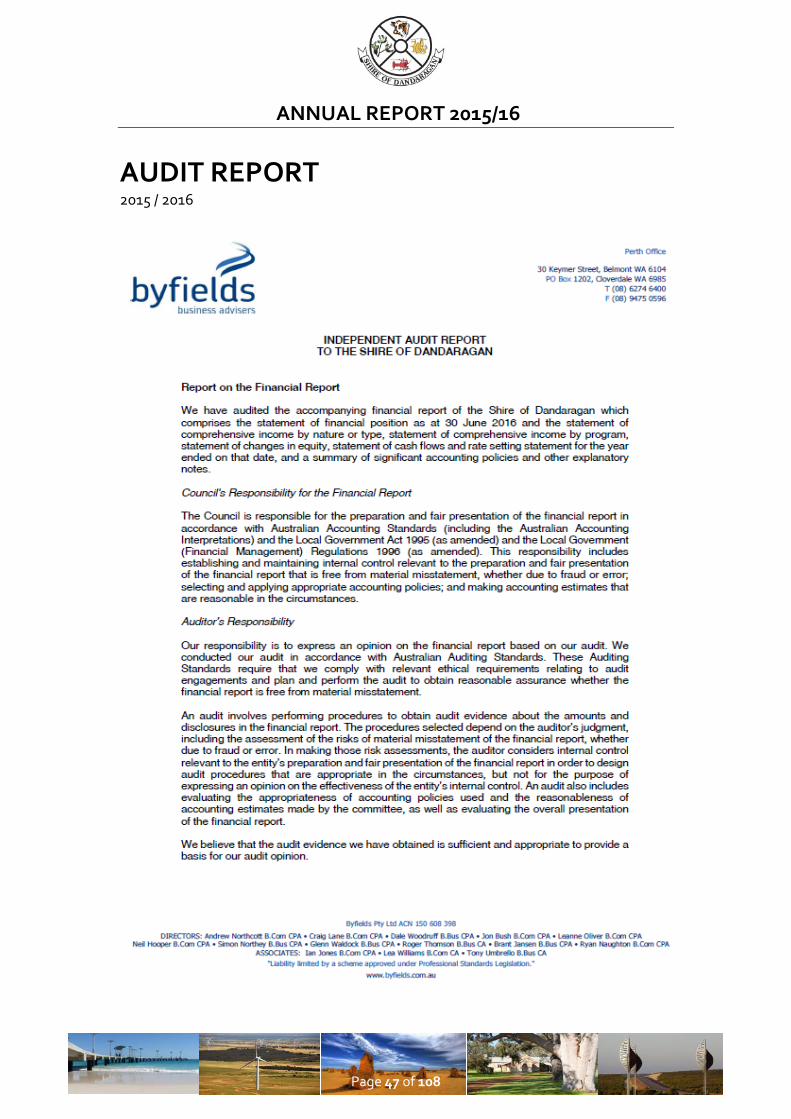
AUDIT REPORT 2015 / 2016

ANNUAL REPORT 2015/16
Page 48 of 108

ANNUAL REPORT 2015/16
Page 49 of 108
FINANCIAL REPORT 2015 / 2016
Declaration
SHIRE OF DANDARAGAN FINANCIAL
REPORT FOR THE YEAR ENDED 30th JUNE 2016
LOCAL GOVERNMENT ACT 1995
LOCAL GOVERNMENT (FINANCIAL MANAGEMENT) REGULATIONS 1996
STATEMENT BY CHIEF EXECUTIVE OFFICER
The attached financial report of the Shire of Dandaragan being the annual financial report and other information for the financial year ended 30th June 2016 are in my opinion properly drawn up to present fairly the financial position of the Shire of Dandaragan at 30th June 2016 and the results of the operations for the financial year then ended in accordance with the Australian Accounting Standards (except to the extent that these have been varied in the Statement of Accounting Policies required by Australian Accounting Standards AAS6 "Accounting Policies" and the accompanying notes to the annual financial report) and comply with the provisions of the Local Government Act 1995 and regulations under that Act.
Signed as authorisation of issue on the 24th day of October 2016.
Tony Nottle
CHIEF EXECUTIVE OFFICER

ANNUAL REPORT 2015/16
Page 50 of 108
Statement of Comprehensive Income by Nature and Type
SHIRE OF DANDARAGAN STATEMENT OF COMPREHENSIVE INCOME by Nature or Type
for the year ending 30 June 2016
Description Notes Actual
2015/2016 Budget
2015/2016 Actual
2014/2015 Revenue from Ordinary Activities
Rates 19a 5,549,577 5,557,872 5,277,120 Grants and Subsidies 24 1,143,498 1,072,751 2,869,161 Contributions Reimbursements Donations
658,396 471,572 272,458
Service Charges
(0) (0) 24,145 Fees and Charges 23 1,928,134 1,705,777 1,911,681 Interest Earnings 2a 257,179 267,000 334,921 Other Revenue
102,515 76,599 102,787
9,639,298 9,151,572 10,792,274
Expenses from Ordinary Activities Employee Costs
(3,444,566) (3,587,839) (3,437,460) Materials and Contracts
(2,566,930) (2,803,990) (2,501,608)
Utilities
(472,362) (535,591) (421,934) Insurance
(384,601) (351,295) (372,037)
Other Expenses
(606,958) (717,394) (1,448,240) Depreciation 2a (5,677,356) (5,026,812) (3,812,044) (13,152,772) (13,022,921) (11,993,322)
(3,513,474) (3,871,349) (1,201,048)
Borrowing Costs Expense 2a (46,070) (47,899) (57,051) Grants & Subsidies (towards non-operating activities) 24 3,598,932 5,062,100 5,106,974 Profit / Loss on Disposal of Assets 17 (116,653) (212,648) (164,298) NET RESULT (77,264) 930,204 3,684,576
Other Comprehensive Income Changes on revaluation of non-current assets 26 60,722 (0) 25,222,507
60,722 (0) 25,222,507
TOTAL COMPREHENSIVE INCOME (16,542) 930,204 28,907,083
This statement is to be read in conjunction with the accompanying notes
ANNUAL REPORT 2015/16
Page 51 of 108
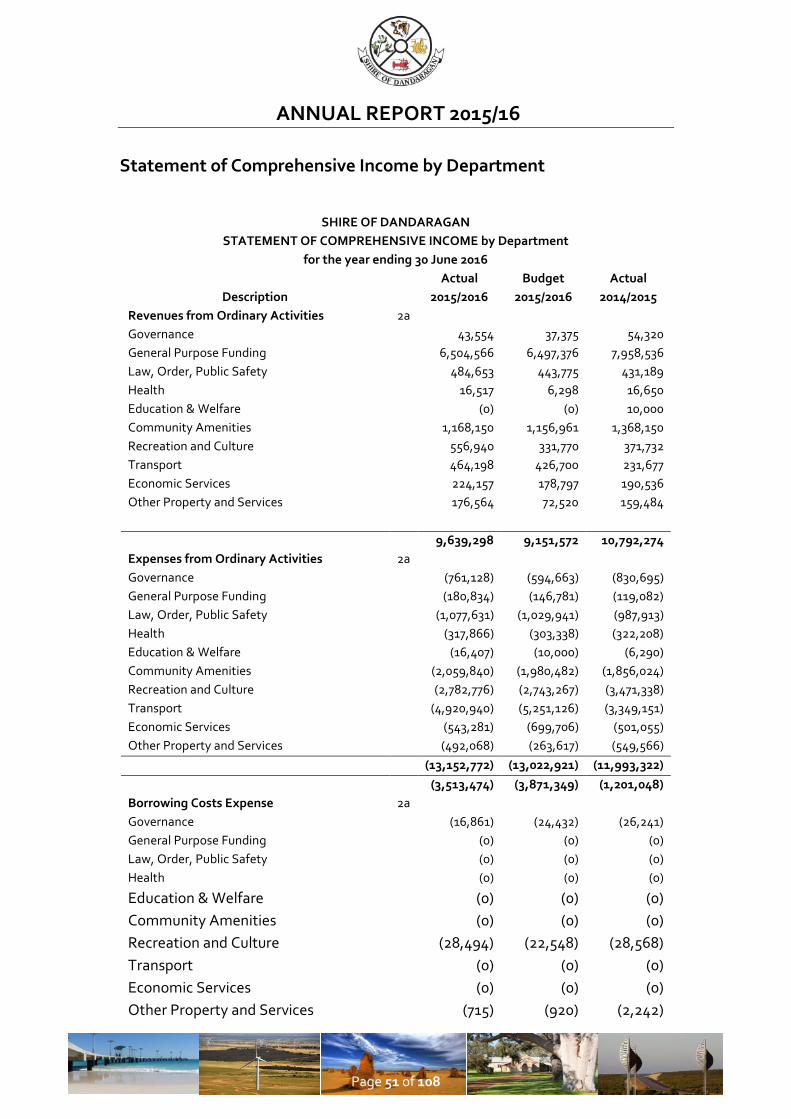
Statement of Comprehensive Income by Department
SHIRE OF DANDARAGAN STATEMENT OF COMPREHENSIVE INCOME by Department
for the year ending 30 June 2016
Description
Actual 2015/2016
Budget 2015/2016
Actual 2014/2015
Revenues from Ordinary Activities 2a Governance
43,554 37,375 54,320
General Purpose Funding
6,504,566 6,497,376 7,958,536 Law, Order, Public Safety
484,653 443,775 431,189
Health
16,517 6,298 16,650 Education & Welfare
(0) (0) 10,000
Community Amenities
1,168,150 1,156,961 1,368,150 Recreation and Culture
556,940 331,770 371,732
Transport
464,198 426,700 231,677 Economic Services
224,157 178,797 190,536
Other Property and Services
176,564 72,520 159,484
9,639,298 9,151,572 10,792,274
Expenses from Ordinary Activities 2a Governance
(761,128) (594,663) (830,695)
General Purpose Funding
(180,834) (146,781) (119,082) Law, Order, Public Safety
(1,077,631) (1,029,941) (987,913)
Health
(317,866) (303,338) (322,208) Education & Welfare
(16,407) (10,000) (6,290)
Community Amenities
(2,059,840) (1,980,482) (1,856,024) Recreation and Culture
(2,782,776) (2,743,267) (3,471,338)
Transport
(4,920,940) (5,251,126) (3,349,151) Economic Services
(543,281) (699,706) (501,055)
Other Property and Services (492,068) (263,617) (549,566) (13,152,772) (13,022,921) (11,993,322)
(3,513,474) (3,871,349) (1,201,048)
Borrowing Costs Expense 2a Governance
(16,861) (24,432) (26,241)
General Purpose Funding
(0) (0) (0) Law, Order, Public Safety
(0) (0) (0)
Health
(0) (0) (0)
Education & Welfare
(0) (0) (0) Community Amenities
(0) (0) (0)
Recreation and Culture
(28,494) (22,548) (28,568) Transport
(0) (0) (0)
Economic Services
(0) (0) (0) Other Property and Services (715) (920) (2,242)

ANNUAL REPORT 2015/16
Page 52 of 108
(46,070) (47,899) (57,051) Grants and Subsidies Non-Operating
Governance
(0) (0) (0) General Purpose Funding
(0) (0) (0)
Law, Order, Public Safety
(0) (0) 579,451 Health
(0) (0) (0)
Education & Welfare
(0) (0) (0) Community Amenities
(0) 562,000 1,062,051
Recreation and Culture
225,000 612,198 407,453 Transport 3,373,932 3,887,902 3,058,019 Economic Services (0) (0) (0) Other Property and Services (0) (0) (0)
3,598,932 5,062,100 5,106,974
Profit / Loss on Asset Disposal 17 Governance
(8,432) (14,364) (0)
General Purpose Funding
(0) (0) (0) Law, Order, Public Safety
(0) (0) (62,658)
Health
(4,281) (7,682) (0) Education & Welfare
(0) (0) (0)
Community Amenities
(4,535) (7,682) (0) Recreation and Culture
(0) (0) (0)
Transport
(121,272) (170,193) (86,491) Economic Services (3,781) (7,182) (0) Other Property and Services 25,648 (5,545) (15,149) (116,653) (212,648) (164,298) NET RESULT (77,264) 930,204 3,684,576 Other Comprehensive Income
Changes on revaluation of non-current assets 26 60,722 (0) 25,222,507 60,722 (0) 25,222,507
TOTAL COMPREHENSIVE INCOME (16,542) 930,204 28,907,083
This statement is to be read in conjunction with the accompanying notes

ANNUAL REPORT 2015/16
Page 53 of 108
Statement of Financial Position
SHIRE OF DANDARAGAN STATEMENT OF FINANCIAL POSITION
as at 30 June 2016
Description Notes 30 June 2016 30 June 2015
CURRENT ASSETS Cash 3 8,843,273 13,612,925
Trade & Other Receivables 4 508,582 1,208,368 Inventories 5 25,563 26,466
TOTAL CURRENT ASSETS
9,377,418 14,847,760
NON-CURRENT ASSETS Land 6 2,628,000 2,643,000
Buildings and Improvements 6 31,114,264 31,937,069 Furniture and Equipment 6 991,650 817,522 Plant and Equipment 6 4,457,675 4,596,790 Infrastructure 7 207,380,000 201,722,983 Trade & Other Receivables 4 282,001 266,237
TOTAL NON-CURRENT ASSETS
246,853,590 241,983,602 TOTAL ASSETS 256,231,008 256,831,362
CURRENT LIABILITIES Creditors 8 (529,645) (556,971)
Provisions 10 (524,151) (502,085) Loans Leases Overdrafts 9 (213,028) (199,104) Accruals 8 (51,568) (445,435)
TOTAL CURRENT LIABILITIES
(1,318,392) (1,703,594)
NON-CURRENT LIABILITIES Provisions 10 (82,086) (97,677)
Loans Leases and Overdrafts 9 (525,195) (708,214) TOTAL NON-CURRENT LIABILTIES
(607,281) (805,891)
TOTAL LIABILITIES
(1,925,673) (2,509,485)
TOTAL NET ASSETS 254,305,335 254,321,877
EQUITY Reserves - Cash Backed 11 6,596,882 10,568,117
Revaluation Surplus 26 42,052,339 41,991,617 Accumulations
205,656,113 201,762,143
TOTAL EQUITY 254,305,335 254,321,877
This statement is to be read in conjunction with the accompanying notes.
ANNUAL REPORT 2015/16
Page 54 of 108
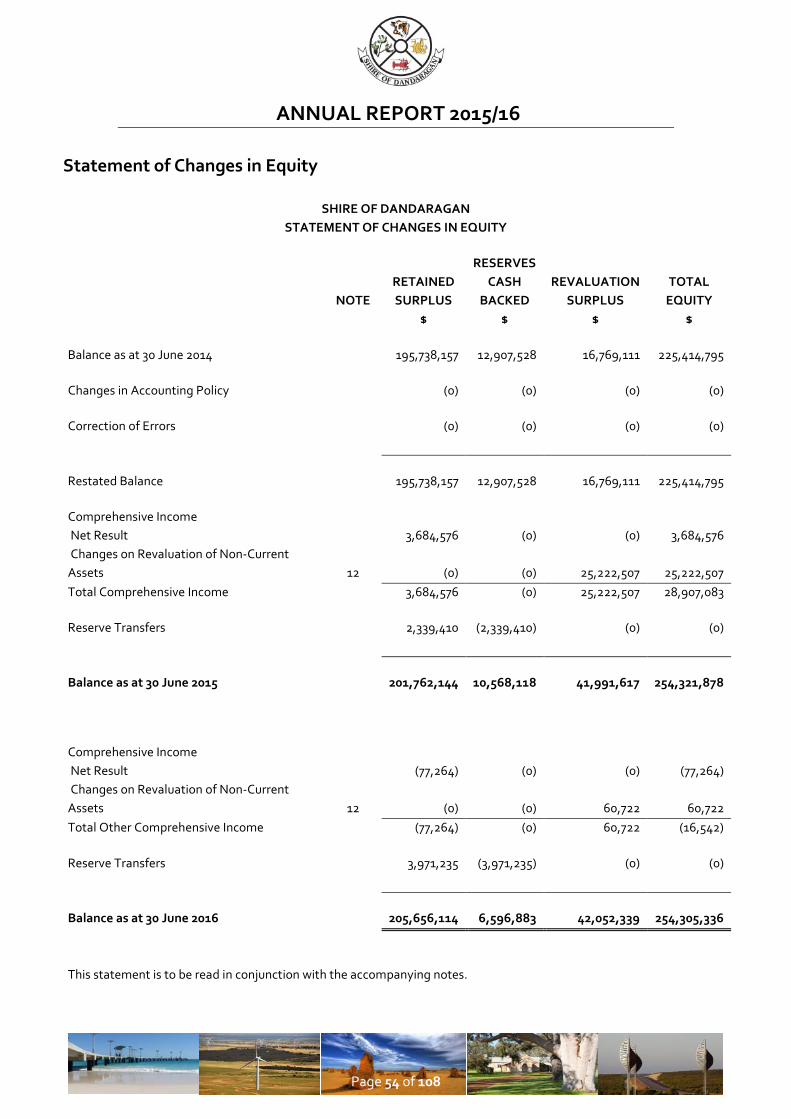
Statement of Changes in Equity
SHIRE OF DANDARAGAN STATEMENT OF CHANGES IN EQUITY
RESERVES
RETAINED CASH REVALUATION TOTAL
NOTE SURPLUS BACKED SURPLUS EQUITY
$ $ $ $
Balance as at 30 June 2014
195,738,157 12,907,528 16,769,111 225,414,795
Changes in Accounting Policy
(0) (0) (0) (0)
Correction of Errors
(0) (0) (0) (0)
Restated Balance
195,738,157 12,907,528 16,769,111 225,414,795
Comprehensive Income Net Result
3,684,576 (0) (0) 3,684,576 Changes on Revaluation of Non-Current Assets 12 (0) (0) 25,222,507 25,222,507 Total Comprehensive Income
3,684,576 (0) 25,222,507 28,907,083
Reserve Transfers
2,339,410 (2,339,410) (0) (0)
Balance as at 30 June 2015
201,762,144 10,568,118 41,991,617 254,321,878
Comprehensive Income
Net Result
(77,264) (0) (0) (77,264) Changes on Revaluation of Non-Current Assets 12 (0) (0) 60,722 60,722 Total Other Comprehensive Income
(77,264) (0) 60,722 (16,542)
Reserve Transfers
3,971,235 (3,971,235) (0) (0)
Balance as at 30 June 2016
205,656,114 6,596,883 42,052,339 254,305,336
This statement is to be read in conjunction with the accompanying notes.

ANNUAL REPORT 2015/16
Page 55 of 108
Statement of Cash Flows SHIRE OF DANDARAGAN
STATEMENT OF CASH FLOWS
for the year ending 30 June 2016
Note
Actual 2015/2016
Budget 2015/2016
Actual 2014/2015
Cash Flows from Operating Activities Receipts Rates
5,486,323 5,571,872 5,375,072 Operating Grants, Subsidies & Contributions
1,801,894 2,056,323 3,141,619
Service Charges
(0) (0) 24,145 Fees and Charges
2,591,684 1,705,777 1,411,900
Interest Earnings
257,179 267,000 334,921 Goods and Services Tax
630,274
559,228
Other Revenue 102,515 76,599 102,787
10,869,869 9,677,571 10,949,672
Payments Employee Costs
(3,415,163) (3,587,839) (3,427,860) Materials and Contracts
(2,965,787) (3,006,434) (1,978,342)
Utilities
(472,362) (535,591) (421,934) Insurance
(384,601) (351,295) (372,037)
Interest Expenses
(47,836) (47,899) (58,925) Goods and Services Tax
(580,121)
(541,739)
Other Expenses (606,958) (717,394) (628,806)
(8,472,828) (8,246,452) (7,429,643)
Net Cash provided by Operating Activities 12b 2,397,041 1,431,119 3,520,029
Cash Flows from Investing Activities Payment for Property, Plant and Equipment
(1,379,595) (2,508,743) (5,392,801) Payments for Construction of Infrastructure
(9,581,487) (12,378,840) (3,272,531)
Grants/Contributions for Assets
3,598,932 5,062,100 5,106,974 Proceeds from Sale of assets 17 373,570 278,363 186,556 Net Cash Used in Investing Activities
(6,988,580) (9,547,120) (3,371,802)
Cash Flows from Financing Activities Repayment of Debentures 18a (199,096) (199,104) (214,121)
Proceeds from Self-Supporting Loans
(9,019) 44,673 34,737 Payment to Community Groups (self supporting loans)
(0) (80,000) (0)
Proceeds from New Debentures 30,000 109,066 (0) Net Cash Provided by (Used in) Financing Activities
(178,115) (125,365) (179,384)
Net Increase (Decrease) in Cash Held
(4,769,654) (8,241,366) (31,157)
Cash at Beginning of Year 13,612,925 13,612,926 13,644,079 Cash at End of Year 12a 8,843,271 5,371,560 13,612,922

ANNUAL REPORT 2015/16
Page 56 of 108
Rate Setting Statement
SHIRE OF DANDARAGAN RATE SETTING STATEMENT by Department
for the year ending 30 June 2016
Description
Notes
Actual 2015/2016
Budget 2015/2016
Actual 2014/2015
Operating Revenues / Sources Governance
43,554 37,375 54,320 General Purpose Funding (Excluding Rate Revenue)
1,083,002 1,067,223 2,797,023
Law, Order and Public Safety
484,653 443,775 1,010,640 Health
16,517 6,298 16,650
Education & Welfare
(0) (0) 10,000 Community Ammenities
1,168,150 1,718,961 2,430,201
Recreation and Culture
781,940 943,968 779,186 Transport
3,838,131 4,314,602 3,289,696
Economic Services
224,157 178,797 190,536 Other Property and Services 202,212 72,520 161,835
7,842,314 8,783,519 10,740,086
Expenses / (Application) Governance
(786,422) (633,458) (856,936) General Purpose Funding
(180,834) (146,781) (119,082)
Law, Order and Public Safety
(1,077,631) (1,029,941) (1,050,570) Health
(322,147) (311,019) (322,208)
Education & Welfare
(16,407) (10,000) (6,290) Community Ammenities
(2,064,374) (1,988,164) (1,856,024)
Recreation and Culture
(2,811,270) (2,765,815) (3,499,906) Transport
(5,042,212) (5,421,319) (3,435,642)
Economic Services
(547,062) (706,888) (501,055) Other Property and Services (492,783) (270,082) (569,308)
(13,341,143)
(13,283,468)
(12,217,022)
Adjustments for Non-Cash (Revenue) and Expenditure (Profit)/Loss on Asset Disposals 17 (116,653) (212,648) (164,298)
Movement in Accrued Interest
1,766 (0) 1,874 Movement in Accrued Salaries and Wages
(22,928) (0) 102,297
Movement in Employee Provisions
(6,476) (0) (111,897) Movement in Deferred Rates
6,745 (0) 1,438
Movement in Accrued Expenses
415,028 (0) (409,220) Loss on fair value of asset through profit & loss
(0) (0) (819,436)

ANNUAL REPORT 2015/16
Page 57 of 108
Depreciation on Assets 2a (5,677,356) (5,026,812) (3,812,044)
Total Operating less non cash items
(98,955) 739,510 3,734,350
Capital Revenue and (Expenditure) Purchase Land and Buildings
(367,858) (1,298,434) (3,961,436) Purchase Furniture and Equipment
(2,482) (55,450) (12,333)
Purchase Plant and Equipment
(1,009,254) (1,154,859) (1,419,033) Purchase Tools and Attractive Items
(0) (0) (0)
Purchase Infrastructure Assets - Roads
(4,360,771) (5,945,674) (2,435,927) Purchase Infrastructure Assets - Parks & Reserves
(356,623) (1,247,970) (163,608)
Purchase Infrastructure Assets - Other
(4,864,093) (5,185,196) (672,996) Proceeds from disposal of assets 17 373,570 278,363 186,556 Proceeds from Debentures (New) 18 30,000 109,066 (0) Repayment of Debentures 18 (199,095) (199,104) (214,121) Payment of Self Supporting Loan to Community Group
(50,760) (80,000) (0)
Self-Supporting Loan Principal Income
41,740 44,673 34,737 Transfer to Reserves 11 (853,706) (863,224) (2,050,759) Transfer from Reserves 11 4,824,941 5,787,447 4,390,169
Surplus/(Deficit) July 1 B/Fwd 19b 3,722,672 3,640,700 1,145,560 Surplus/(Deficit) June 30 C/Fwd 19b 2,250,891 0 3,722,672
Amount raised from rates 19a 5,421,564 5,430,153 5,161,512
This statement is to be read in conjunction with the accompanying notes.
ANNUAL REPORT 2015 / 2016
Page 57 of 108
Note 1 – Significant Accounting Policies
The significant policies, which have been adopted in the preparation of this financial report, are: (a) Basis of Accounting
The financial report is a general purpose financial report which has been prepared in accordance with Australian Accounting Standards (as they apply to local governments and not-for-profit entities), other mandatory professional reporting requirements and the Local Government Act 1995 and accompanying regulations. The reports have been prepared on the accrual basis under the convention of historical cost accounting modified, where applicable, by measurement at fair value of selected non-current assets, financial assets and liabilities. Except for cash flow and rate setting information, the report has also been prepared on the accrual basis and is based on historical costs, modified, where applicable, by the measurement at fair value of selected non-current assets, financial assets and liabilities.
Critical Accounting Estimates The preparation of a financial report in conformity with Australian Accounting Standards require management to make judgements, estimates, and assumptions that effect the application of policies and reported amounts of assets and liabilities, income and expenses. The estimates and associated assumptions are based on historical experience and various other factors that are believed to be reasonable under the circumstances; the results of which form the basis of making judgements about carrying values of assets and liabilities that are not readily apparent from other sources. Actual results may differ from these estimates.
(b) The Local Government Reporting Entity All Funds through which the Council controls resources to carry on its functions have been included in the financial statements forming part of this financial report. In the process of reporting on the local government as a single unit, all transactions and balances between those Funds (for example, loans and transfers between Funds) have been eliminated. All monies held in the Trust Funds are excluded from the financial statements. A separate statement of those monies appears at Note 16 to these financial statements.
(c) Goods and Services Tax
Revenues, expenses and assets are recognised net of the amount of GST, except where the amount of
GST incurred is not recoverable from the Australian Taxation Office (ATO). Receivables and payables are stated inclusive of GST receivable or payable. The net amount of GST recoverable from, or payable to, the ATO is included with receivables or payables in the statement of financial position.

ANNUAL REPORT 2015 / 2016
Page 58 of 108
Cash flows are presented on a Gross basis. The GST components of cash flows arising from investing or financing activities which are recoverable from, or payable to, the ATO are presented as operating cash flows..
(d) Cash and Cash Equivalents Cash and cash equivalents include cash on hand, cash at bank, deposits available on demand with
banks and other short term highly liquid investments that are readily convertible to known amounts of cash and which are subject to an insignificant risk of changes in value and bank overdrafts. Bank overdrafts are reported as short term borrowings in current liabilities in the statement of financial position.
(e) Trade and Other Receivables
Trade and other receivables include amounts due from ratepayers for unpaid rates and service charges and other amounts due from third parties for goods sold and services performed in the ordinary course of business. Receivables expected to be collected within 12 months of the end of the reporting period are classified as current assets. All other receivables are classified as non-current assets. Collectability of trade and other receivables is reviewed on an ongoing basis. Debts that are known to be uncollectible are written off when identified. An allowance for doubtful debts is raised when there is objective evidence that they will not be collectible.
(f) Inventories
Inventories are valued at the lower of cost and net realisable value. Net realisable value is the estimated selling price in the ordinary course of business less the estimated costs of completion and the estimated costs necessary to make the sale.
(g) Fixed Assets
Mandatory Requirement to Revalue Non-Current Assets Effective from 1 July 2012, the Local Government (Financial Management) Regulations were amended and the measurement of non-current assets at Fair Value became mandatory. The amendments allow for a phasing in of fair value in relation to fixed assets over three years as follows: (a) for the financial year ending on 30 June 2013, the fair value of all of the assets of the local
government that are plant and equipment; and (b) for the financial year ending on 30 June 2014, the fair value of all of the assets of the local
government –
(i) that are plant and equipment; and
(ii) that are –
ANNUAL REPORT 2015 / 2016
Page 59 of 108
(I) land and buildings; or
(II) infrastructure;
and
(c) for a financial year ending on or after 30 June 2015, the fair value of all of the assets of the local government.
Thereafter, in accordance with the regulations, each asset class must be revalued at least every 3 years.
In 2013, Council commenced the process of adopting Fair Value in accordance with the Regulations.
Relevant disclosures, in accordance with the requirements of Australian Accounting Standards, have been made in the financial report as necessary.
Initial Recognition and Measurement between Mandatory Revaluation Dates
All assets are initially recognised at cost and subsequently revalued in accordance with the mandatory measurement framework detailed above. In relation to this initial measurement, cost is determined as the fair value of the assets given as consideration plus costs incidental to the acquisition. For assets acquired at no cost or for nominal consideration, cost is determined as fair value at the date of acquisition. The cost of non-current assets constructed by the Council includes the cost of all materials used in construction, direct labour on the project and an appropriate proportion of variable and fixed overheads. Individual assets acquired between initial recognition and the next revaluation of the asset class in accordance with the mandatory measurement framework detailed above, are carried at cost less accumulated depreciation as management believes this approximates fair value. They will be subject to subsequent revaluation at the next anniversary date in accordance with the mandatory measurement framework detailed above.
Revaluation
Increases in the carrying amount arising on revaluation of assets are credited to a revaluation surplus in equity. Decreases that offset previous increases of the same asset are recognised against revaluation surplus directly in equity. All other decreases are recognised in profit or loss.
Land under Roads In Western Australia, all land under roads is Crown Land, the responsibility for managing which, is vested in the local government. Effective as at 1 July 2008, Council elected not to recognise any value for land under roads acquired on or before 30 June 2008. This accords with the treatment available in Australian Accounting Standard AASB 1051 Land Under Roads and the fact Local Government (Financial Management) Regulation 16(a)(i) prohibits local governments from recognising such land as an asset.

ANNUAL REPORT 2015 / 2016
Page 60 of 108
In respect of land under roads acquired on or after 1 July 2008, as detailed above, Local Government (Financial Management) Regulation 16(a)(i) prohibits local governments from recognising such land as an asset.
Whilst this treatment is inconsistent with the requirements of AASB 1051, Local Government (Financial Management) Regulation 4(2) provides, in the event of such an inconsistency, the Local Government (Financial Management) Regulations prevail. Consequently, any land under roads acquired on or after 1 July 2008 is not included as an asset of the Council.
(h) Depreciation of Non-Current Assets The depreciable amount of all fixed assets including buildings but excluding freehold land, are depreciated on a straight-line basis over the individual asset’s useful life from the time the asset is held ready for use. Leasehold improvements are depreciated over the shorter of either the unexpired period of the lease or the estimated useful life of the improvements. When an item of property, plant and equipment is revalued, any accumulated depreciation at the date of the revaluation is treated in one of the following ways: a) Restated proportionately with the change in the gross carrying amount of the asset so that
the carrying amount of the asset after revaluation equals its revalued amount; or b) Eliminated against the gross carrying amount of the asset and the net amount restated to
the revalued amount of the asset.
Buildings 10 to 50 years Furniture and Equipment 5 to 20 years Plant and Equipment 5 to 15 years Sealed roads and streets
formation not depreciated pavement 30 years seal 30 years
Gravel roads formation not depreciated pavement 30 years
gravel sheet 15 years pavement 50 years Foot paths - slab 20 years
Sewerage piping 100 years Water supply piping & drainage systems
75 years
Footpaths 50 years Infrastructure Parks & Reserves 10 to 50 years Infrastructure Other 10 to 50 years
The assets residual values and useful lives are reviewed, and adjusted if appropriate, at the end of each reporting period.
ANNUAL REPORT 2015 / 2016
Page 61 of 108
An asset’s carrying amount is written down immediately to its recoverable amount if the asset’s carrying amount is greater than its estimated recoverable amount. Gains and losses on disposals are determined by comparing proceeds with the carrying amount. These gains and losses are included in the statement of comprehensive income in the period in which they arise. When revalued assets are sold, amounts included in the revaluation surplus relating to that asset are transferred to retained surplus. Capitalisation Threshold Expenditure on items of equipment under $2,000 is not capitalised. Rather, it is recorded on an asset inventory listing. Fair Value of Assets and Liabilities When performing a revaluation, the Council uses a mix of both independent and management valuations using the following as a guide: Fair Value is the price that Council would receive to sell the asset or would have to pay to transfer a liability, in an orderly (ie unforced) transaction between independent, knowledgeable and willing market participants at the measurement date.
As fair value is a market-based measure, the closest equivalent observable market pricing information is used to determine fair value. Adjustments to market values may be made having regard to the characteristics of the specific asset. The fair values of assets that are not traded in an active market are determined using one or more valuation techniques. These valuation techniques maximise, to the extent possible, the use of observable market data.
To the extent possible, market information is extracted from either the principal market for the asset (ie the market with the greatest volume and level of activity for the asset or, in the absence of such a market, the most advantageous market available to the entity at the end of the reporting period (ie the market that maximises the receipts from the sale of the asset after taking into account transaction costs and transport costs).
For non-financial assets, the fair value measurement also takes into account a market participant’s ability to use the asset in its highest and best use or to sell it to another market participant that would use the asset in its highest and best use.
Fair Value Hierarchy
AASB 13 requires the disclosure of fair value information by level of the fair value hierarchy, which categorises fair value measurement into one of three possible levels based on the lowest level that an input that is significant to the measurement can be categorised into as follows:
Level 1
Measurements based on quoted prices (unadjusted) in active markets for identical assets or liabilities that the entity can access at the measurement date.

ANNUAL REPORT 2015 / 2016
Page 62 of 108
Level 2
Measurements based on inputs other than quoted prices included in Level 1 that are observable for the asset or liability, either directly or indirectly.
Level 3
Measurements based on unobservable inputs for the asset or liability.
The fair values of assets and liabilities that are not traded in an active market are determined using one or more valuation techniques. These valuation techniques maximise, to the extent possible, the use of observable market data. If all significant inputs required to measure fair value are observable, the asset or liability is included in Level 2. If one or more significant inputs are not based on observable market data, the asset or liability is included in Level 3.
Valuation techniques
The Council selects a valuation technique that is appropriate in the circumstances and for which sufficient data is available to measure fair value. The availability of sufficient and relevant data primarily depends on the specific characteristics of the asset or liability being measured. The valuation techniques selected by the Council are consistent with one or more of the following valuation approaches:
Market approach
Valuation techniques that use prices and other relevant information generated by market transactions for identical or similar assets or liabilities.
Income approach
Valuation techniques that convert estimated future cash flows or income and expenses into a single discounted present value.
Cost approach
Valuation techniques that reflect the current replacement cost of an asset at its current service capacity.
Valuation techniques
Each valuation technique requires inputs that reflect the assumptions that buyers and sellers would use when pricing the asset or liability, including assumptions about risks. When selecting a valuation technique, the Council gives priority to those techniques that maximise the use of observable inputs and minimise the use of unobservable inputs. Inputs that are developed using market data (such as publicly available information on actual transactions) and reflect the assumptions that buyers and sellers would generally use when pricing the asset or liability and considered observable, whereas inputs for which market data is not available and therefore are developed using the best information available about such assumptions are considered unobservable.
As detailed above, the mandatory measurement framework imposed by the Local
ANNUAL REPORT 2015 / 2016
Page 63 of 108
Government (Financial Management) Regulations requires, as a minimum, all assets carried at a revalued amount to be revalued at least every 3 years.
(i) Investments and Other Financial Assets
Classification
Council classifies its investments in the following categories: financial assets at fair value through profit or loss, loans and receivables, held-to-maturity investments and available-for-sale financial assets. The classification depends on the purpose for which the investments were acquired. Management determines the classification of its investments at initial recognition and, in the case of assets classified as held-to-maturity, re-evaluates this designation at each reporting date.
(i) Financial assets at fair value through profit and loss Financial assets at fair value through profit or loss are financial assets held for trading. A financial
asset is classified in this category if acquired principally for the purpose of selling in the short term. Derivatives are classified as held for trading unless they are designated as hedges. Assets in this category are classified as current assets.
(ii) Loans and receivables Loans and receivables are non-derivative financial assets with fixed or determinable payments that
are not quoted in an active market. They are included in current assets, except for those with maturities greater than 12 months after the balance sheet date which are classified as non-current assets. Loans and receivables are included in trade and other receivables in the balance sheet.
(iii) Held-to-maturity investments Held-to-maturity investments are non-derivative financial assets with fixed or determinable
payments and fixed maturities that the Council’s management has the positive intention and ability to hold to maturity. If Council were to sell other than an insignificant amount of held-to-maturity financial assets, the whole category would be tainted and reclassified as available-for-sale. Held-to-maturity financial assets are included in non-current assets, except for those with maturities less than 12 months from the reporting date, which are classified as current assets.
(iv) Available-for-sale financial assets Available-for-sale financial assets, comprising principally marketable equity securities, are non-
derivatives that are either designated in this category or not classified in any of the other categories. They are included in non-current assets unless management intends to dispose of the investment within 12 months of the balance sheet date. Investments are designated as available-for-sale if they do not have fixed maturities and fixed or determinable payments and management intends to hold them for the medium to long term.
Derecognition
Financial assets are derecognised where the contractual rights to receipt of cash flows expire or the asset is transferred to another party whereby the Council no longer has any significant continual involvement in the risks and benefits associated with the asset.

ANNUAL REPORT 2015 / 2016
Page 64 of 108
Financial liabilities are derecognised where the related obligations are discharged, cancelled or expired. The difference between the carrying amount of the financial liability extinguished or transferred to another party and the fair value of the consideration paid, including the transfer of non-cash assets or liabilities assumed, is recognised in profit or loss.
Subsequent measurement Loans and receivables and held-to-maturity investments are carried at amortised cost using the effective interest method.
Available-for-sale financial assets and financial assets at fair value through profit and loss are
subsequently carried at fair value. Gains or losses arising from changes in the fair value of the financial assets at fair value through profit or loss category are presented in the income statement within other income or other expenses in the period in which they arise. Dividend income from financial assets at fair value through profit and loss is recognised in the income statement as part of revenue from continuing operations when Council’s right to receive payments is established. Changes in the fair value of other monetary and non-monetary securities classified as available-for- sale are recognised in equity.
Impairment A financial asset is deemed to be impaired if, and only if, there is objective evidence of impairment as
a result of one or more events (a “loss event”) having occurred, which has an impact on the estimated future cash flows of the financial asset(s).
In the case of available-for-sale financial assets, a significant or prolonged decline in the market value
of the instrument is considered a loss event. Impairment losses are recognised in profit or loss immediately. Also, any cumulative decline in fair value previously recognised in other comprehensive income is reclassified to profit or loss at this point.
In the case of financial assets carried at amortised cost, loss events may include: indications that the
debtors or a group of debtors are experiencing significant financial difficulty, default or delinquency in interest or principal payments; indications that they will enter bankruptcy or other financial reorganisation; and changes in arrears or economic conditions that correlate with defaults.
For financial assets carried at amortised cost (including loans and receivables), a separate allowance
account is used to reduce the carrying amount of financial assets impaired by credit losses. After having taken all possible measures of recovery, if management establishes that the carrying amount cannot be recovered by any means, at that point the written-off amounts are charged to the allowance account or the carrying amount of impaired financial assets is reduced directly if no impairment amount was previously recognised in the allowance account.
(k) Impairment
In accordance with Australian Accounting Standards the Shire’s assets, other than inventories, are assessed at each reporting date to determine whether there is any indication they may be impaired.

ANNUAL REPORT 2015 / 2016
Page 65 of 108
Where such an indication exists, an estimate of the recoverable amount of the asset is made in accordance with AASB 136 ‘Impairment of Assets’ and appropriate adjustments made.
An impairment loss is recognised whenever the carrying amount of an asset or its cash-generating
unit exceeds its recoverable amount. Impairment losses are recognised in the income statement.
For non-cash generating assets such as roads, drains, public buildings and the like, value in use is represented by the depreciated replacement cost of the asset.
(l) Trade and Other Payables Trade payables and other payables are carried at amortised cost. They represent liabilities for goods
and services provided to the Shire prior to the end of the financial year that are unpaid and arise when the Shire becomes obliged to make future payments in respect of the purchase of these goods and services. The amounts are unsecured and are usually paid within 30 days of recognition.
(m) Employee Benefits
The provisions for employee entitlements relates to amounts expected to be paid for long service leave, annual leave, wages and salaries and are calculated as follows:
(i) Wages, Salaries and Annual and Long Service Leave (Short-term benefits)
The provision for employee entitlements to wages, salaries, annual leave and long service leave expected to be settled within 12 months represents the amount that the municipality has a present obligation to pay resulting from employees’ services provided to balance date. The provision has been calculated at nominal amounts based on remuneration rates the Council expects to pay and includes related on-costs.
(ii) Long Service Leave (Long-term benefits) The liability for long service leave is recognised in the provision for employee benefits and
measured as the present value of expected future payments to be made in respect of services provided by employees up to the reporting date using the projected unit credit method. Consideration is given to expected future wage and salary levels, experience of employee departures and periods of service. Expected future payments are discounted using market yields at the reporting date on national government bonds with terms to maturity and currency that match as closely as possible, the estimated future cash outflows. Where Council does not have the unconditional right to defer settlement beyond 12 months, the liability is recognised as a current liability.
(n) Interest-bearing Loans and Borrowings
All loans and borrowings are initially recognised at the fair value of the consideration received less directly attributable transaction costs. After initial recognition, interest-bearing loans and borrowings are subsequently measured at amortised cost using the effective interest method. Fees paid on the establishment of loan facilities that are yield related are included as part of the carrying amount of the loans and borrowings.

ANNUAL REPORT 2015 / 2016
Page 66 of 108
Borrowings are classified as current liabilities unless the group has an unconditional right to defer settlement of the liability for at least 12 months after the balance sheet date.
Borrowing costs are recognised as an expense when incurred and adjusted for accrued interest at balance day.
(o) Provisions Provisions are recognised when: The council has a present legal or constructive obligation as a result of past events; it is more likely than not that an outflow of resources will be required to settle the obligation; and the amount has been reliably estimated. Provisions are not recognised for future operating losses. Where there are a number of similar obligations, the likelihood that an outflow will be required in settlement is determined by considering the class of obligations as a whole. A provision is recognised even if the likelihood of an outflow with respect to any one item included in the same class of obligations may be small.
(p) Leases
Lease payments under operating leases, where substantially all the risks and benefits remain with the lessor, are charged as expenses in the periods in which they are incurred
. (q) Rates, Grants, Donations and Other Contributions
Rates, grants, donations and other contributions are recognised as revenues when the local government obtains control over the assets comprising the contributions. Control over assets acquired from rates is obtained at the commencement of the rating period or, where earlier, upon receipt of the rates. Where contributions recognised as revenues during the reporting period were obtained on the condition that they be expended in a particular manner or used over a particular period, and those conditions were undischarged as at the reporting date, the nature of and amounts pertaining to those undischarged conditions are disclosed in Note 2(c). That note also discloses the amount of contributions recognised as revenues in a previous reporting period which were obtained in respect of the local government's operation for the current reporting period.
(r) Superannuation The Council contributes to a number of Superannuation Funds on behalf of employees. All funds to which the Council contributes are defined contribution plans.
(s) Rounding Off Figures All figures in this annual financial report, other than a rate in the dollar, are rounded to the nearest dollar.
(t) Comparative Figures

ANNUAL REPORT 2015 / 2016
Page 67 of 108
Where required, comparative figures have been adjusted to conform with changes in presentation for the current financial year. Where required, comparative figures shown in this annual financial report relate to the original budget estimate for the relevant item of disclosure.
(u) Current and Non-Current Classification
In the determination of whether an asset or liability is current or non-current, consideration is given to the time when each asset or liability is expected to be settled. The asset or liability is classified as current if it is expected to be settled within the next 12 months, being the Council’s operational cycle. In the case of liabilities where Council does not have the unconditional right to defer settlement beyond 12 months, such as vested long service leave, the liability is classified as current even if not expected to be settled within the next 12 months. Inventories held for trading are classified as current even if not expected to be realised in the next 12 months except for land held for resale where it is held as non-current based on Council’s intentions to release for sale.
(v) Budget Comparative Figures
Unless otherwise stated, the budget comparative figures shown in this annual financial report relate
to the original budget estimate for the relevant item of disclosure.
(w) Intangible Assets
Easements Due to legislative changes, Easements are required to be recognised as assets. They are initially recognised at cost and have an indefinite useful life. It has been deemed that all easement in the control of the Council have a NIL value.
(x) New Accounting Standards and Interpretations for Application in Future Periods
The AASB has issued a number of new and amended Accounting Standards and Interpretations that have mandatory application dates for future reporting periods, some of which are relevant to the Council. Management’s assessment of the new and amended pronouncement that are relevant to the Council, applicable to future reporting periods and which have not yet been adopted are set out as follows.

ANNUAL REPORT 2015 / 2016
Page 68 of 108
Title
Issu
ed /
Com
pile
dAp
plic
able
(1)
Impa
ct
(i)
AASB
9 F
inan
cial
Inst
rum
ents
Dec
embe
r 201
41
Janu
ary
2018
Nil
– Th
e ob
ject
ive
of th
is S
tand
ard
is to
impr
ove
and
sim
plify
the
(inco
rpor
atin
g AA
SB 2
014-
7 an
dap
proa
ch fo
r cla
ssifi
catio
n an
d m
easu
rem
ent o
f fin
anci
al a
sset
sAA
SB 2
014-
8)co
mpa
red
with
the
requ
irem
ents
of A
ASB
139.
Giv
en th
e na
ture
of
the
finan
cial
ass
ets
of th
e C
ity, i
t is
not a
ntic
ipat
ed th
e St
anda
rd
will
have
any
mat
eria
l effe
ct.
(ii)
AASB
15
Rev
enue
from
Con
tract
s w
ith
Dec
embe
r 201
41
Janu
ary
2017
This
Sta
ndar
d es
tabl
ishe
s pr
inci
ples
for e
ntiti
es to
app
ly to
repo
rtC
usto
mer
sus
eful
info
rmat
ion
to u
sers
of f
inan
cial
sta
tem
ents
abo
ut th
e na
ture
,am
ount
, tim
ing
and
unce
rtain
ty o
f rev
enue
and
cas
h flo
ws
aris
ing
from
a c
ontra
ct w
ith a
cus
tom
er.
The
effe
ct o
f thi
s St
anda
rd w
ill de
pend
upo
n th
e na
ture
of f
utur
etra
nsac
tions
the
City
has
with
thos
e th
ird p
artie
s it
has
deal
ings
with
. It m
ay o
r may
not
be
sign
ifica
nt.
(iii)
AASB
16
Leas
esFe
brua
ry 2
016
1 Ja
nuar
y 20
19U
nder
AAS
B 16
ther
e is
no
long
er a
dis
tinct
ion
betw
een
finan
cean
d op
erat
ing
leas
es. L
esse
es w
ill no
w b
ring
to a
ccou
nt a
right
-to-u
se a
sset
and
leas
e lia
bilit
y on
to th
eir s
tate
men
t of f
inan
cial
poiti
on fo
r all
leas
es. E
ffect
ivel
y th
is m
eans
the
vast
maj
ority
of
oper
atin
g le
ases
as
defin
ed b
y th
e cu
rren
t AAS
B 11
7 Le
ases
whi
chcu
rren
tly d
o no
t im
pact
the
stat
emen
t of f
inan
cial
pos
ition
will
bere
quire
d to
be
capi
talis
ed o
n th
e st
atem
ent o
f fin
anci
al p
ositi
on o
nce
AAS
B 16
is a
dopt
ed.
Cur
rent
ly, o
pera
ting
leas
e pa
ymen
ts a
re e
xpen
sed
as in
curr
ed.
This
will
ceas
e an
d w
ill be
repl
aced
by
both
dep
reci
atio
n an
d in
tere
st c
harg
es. B
ased
on
the
curr
ent n
umbe
r of o
pera
ting
leas
es h
eld
by th
e C
ity, t
he im
pact
is n
ot e
xpec
ted
to b
esi
gnifi
cant
.

ANNUAL REPORT 2015 / 2016
Page 69 of 108
Title
Issu
ed /
Com
pile
dAp
plic
able
(1)
Impa
ct
(iv)
AASB
201
4-3
Amen
dmen
ts to
Aus
tralia
nAu
gust
201
41
Janu
ary
2016
This
Sta
ndar
d am
ends
AAS
B 11
: Joi
nt A
rran
gem
ents
to re
quire
the
Acco
untin
g St
anda
rds
- Acc
ount
ing
for
acqu
irer o
f an
inte
rest
(bot
h in
itial
and
add
ition
al) i
n a
join
t ope
ratio
nAc
quis
ition
s of
Inte
rest
s in
Joi
nt O
pera
tions
in w
hich
the
activ
ity c
onst
itute
s a
busi
ness
, as
defin
ed in
AAS
B 3:
Bus
ines
s C
ombi
natio
ns,
to a
pply
all
of th
e pr
inci
ples
on
busi
ness
[AAS
B 1
& AA
SB 1
1]co
mbi
natio
ns a
ccou
ntin
g in
AAS
B 3
and
othe
r Aus
tralia
n Ac
coun
ting
Stan
dard
s ex
cept
for t
hose
prin
cipl
es th
at c
onfli
ct w
ithth
e gu
idan
ce in
AAS
B 11
; and
dis
clos
e th
e in
form
atio
n re
quire
dby
AAS
B 3
and
othe
r Aus
tralia
n Ac
coun
ting
Stan
dard
s fo
r bus
ines
sco
mbi
natio
ns.
Sinc
e ad
optio
n of
this
Sta
ndar
d w
ould
impa
ct o
nly
acqu
isiti
ons
ofin
tere
sts
in jo
int o
pera
tions
on
or a
fter 1
Jan
uary
201
6,m
anag
emen
t bel
ieve
s it
is im
prac
ticab
le a
t thi
s st
age
to p
rovi
de a
reas
onab
le e
stim
ate
of s
uch
impa
ct o
n th
e C
ity's
fina
ncia
lst
atem
ents
.
(v)
AASB
201
4-4
Amen
dmen
ts to
Aus
tralia
n
Augu
st 2
014
1 Ja
nuar
y 20
16Th
is S
tand
ard
amen
ds A
ASB
116
and
AASB
138
to e
stab
lish
the
Acco
untin
g St
anda
rds
- Cla
rific
atio
n of
pr
inci
ple
for t
he b
asis
of d
epre
ciat
ion
and
amor
tisat
ion
as b
eing
the
Acce
ptab
le M
etho
ds o
f Dep
reci
atio
n an
dex
pect
ed p
atte
rn o
f con
sum
ptio
n of
the
futu
re e
cono
mic
ben
efits
of
Amor
tisat
ion
an a
sset
. It a
lso
clar
ifies
the
use
of re
venu
e-ba
sed
met
hods
to
calc
ulat
e th
e de
prec
iatio
n of
an
asse
t is
not a
ppro
pria
te n
or is
[AAS
B 11
6 &
138]
reve
nue
gene
rally
an
appr
opria
te b
asis
for m
easu
ring
the
cons
umpt
ion
of th
e ec
onom
ic b
enef
its e
mbo
died
in a
n in
tang
ible
asse
t.
Giv
en th
e C
ity c
uren
tly u
ses
the
expe
cted
pat
tern
of c
onsu
mpt
ion
of th
e fu
ture
eco
nom
ic b
enef
its o
f an
asse
t as
the
basi
s of
cal
cula
tion
of d
epre
ciat
ion,
it is
not
exp
ecte
d to
hav
e a
sign
ifica
nt im
pact
.
(vi)
AASB
201
4-5
Amen
dmen
ts to
Aus
tralia
n D
ecem
ber 2
014
1 Ja
nuar
y 20
17C
onse
quen
tial c
hang
es to
var
ious
Sta
ndar
ds a
risin
g fro
m th
e Ac
coun
ting
Stan
dard
s ar
isin
g fro
m A
ASB
15is
suan
ce o
f AAS
B 15
.
It w
ill re
quire
cha
nges
to re
flect
the
impa
ct o
f AAS
B 15
.

ANNUAL REPORT 2015 / 2016
Page 70 of 108
Title
Issu
ed /
Com
pile
dAp
plic
able
(1)
Impa
ct
(vii)
AASB
201
5-2
Amen
dmen
ts to
Aus
tralia
n Ja
nuar
y 20
151
Janu
ary
2016
This
Sta
ndar
d am
ends
AAS
B 10
1 to
pro
vide
cla
rific
atio
n re
gard
ing
Acco
untin
g St
anda
rds
– D
iscl
osur
eth
e di
sclo
sure
requ
irem
ents
in A
ASB
101.
Spe
cific
ally
, the
Initi
ativ
e: A
men
dmen
ts to
Stan
dard
pro
pose
s na
rrow
-focu
s am
endm
ents
to a
ddre
ss s
ome
of
AASB
101
the
conc
erns
exp
ress
ed a
bout
exi
stin
g pr
esen
tatio
n an
d di
sclo
sure
requ
irem
ents
and
to e
nsur
e en
titie
s ar
e ab
le to
use
judg
emen
t[A
ASB
7, 1
01, 1
34 &
104
9]w
hen
appl
ying
a S
tand
ard
in d
eter
min
ing
wha
t inf
orm
atio
n to
disc
lose
in th
eir f
inan
cial
sta
tem
ents
.
This
Sta
ndar
d al
so m
akes
edi
toria
l and
con
sequ
entia
l am
endm
ents
as a
resu
lt of
am
endm
ents
to th
e St
anda
rds
liste
d in
the
title
colu
mn.
It is
not
ant
icip
ated
it w
ill ha
ve a
ny s
igni
fican
t im
pact
on
disc
losu
res
as th
ey c
urre
ntly
exi
st a
nd a
ny c
hang
es w
ill re
late
to
pres
enta
tion.
(viii)
AASB
201
5-6
Amen
dmen
ts to
Aus
tralia
n M
arch
201
51
July
201
6Th
e ob
ject
ive
of th
is S
tand
ard
is to
ext
end
the
scop
e of
AAS
B 12
4Ac
coun
ting
Stan
dard
s - E
xten
ding
Rel
ated
R
elat
ed P
arty
Dis
clos
ures
to in
clud
e no
t-for
-pro
fit s
ecto
r ent
ities
.Pa
rty D
iscl
osur
es to
Not
-for-
Prof
it Pu
blic
Sect
or E
ntiti
esTh
e St
anda
rd is
exp
ecte
d to
hav
e a
sign
ifica
nt d
iscl
osur
e im
pact
on
the
finan
cial
repo
rt of
the
City
as
both
Ele
cted
Mem
bers
and
Sen
ior
[AAS
B 10
, 124
& 1
049]
Man
agem
ent w
ill be
dee
med
to b
e Ke
y M
anag
emen
t Per
sonn
elan
d re
sulta
nt d
iscl
osur
es w
ill be
nec
essa
ry.
Not
es:
(1) A
pplic
able
to re
porti
ng p
erio
ds c
omm
enci
ng o
n or
afte
r the
giv
en d
ate.
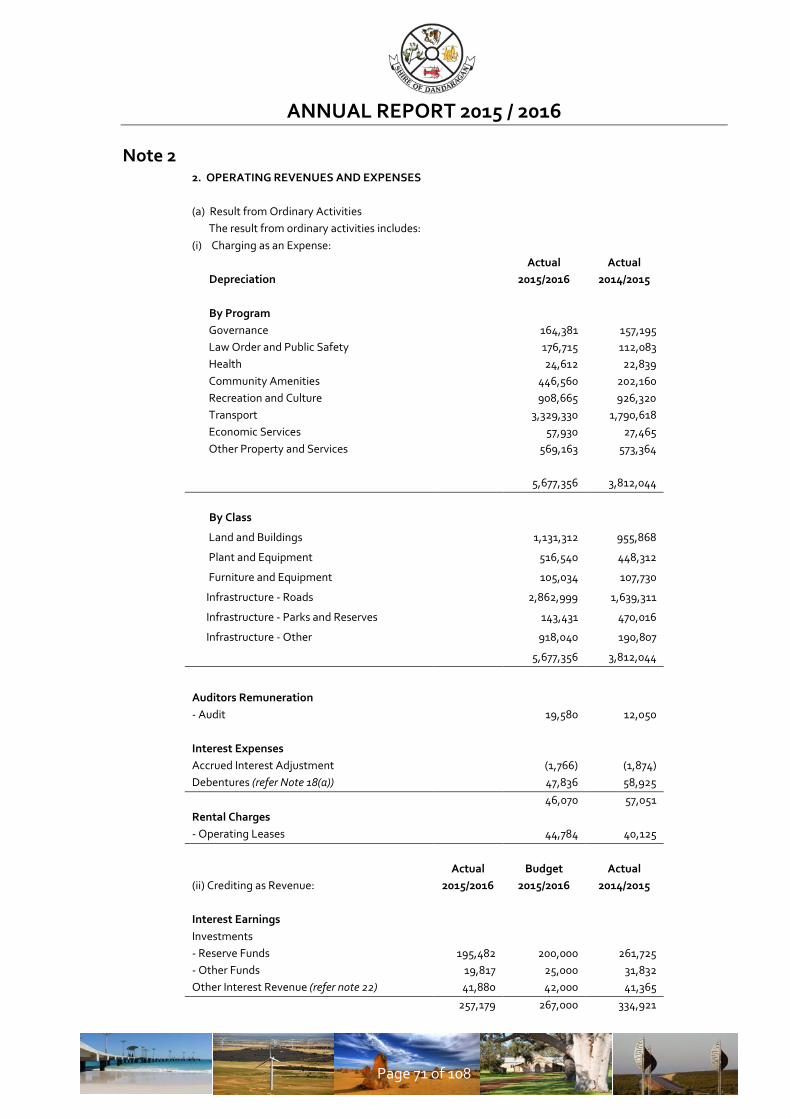
ANNUAL REPORT 2015 / 2016
Page 71 of 108
Note 2 2. OPERATING REVENUES AND EXPENSES
(a) Result from Ordinary Activities
The result from ordinary activities includes: (i) Charging as an Expense:
Depreciation
Actual 2015/2016
Actual 2014/2015
By Program Governance
164,381 157,195 Law Order and Public Safety
176,715 112,083
Health
24,612 22,839 Community Amenities
446,560 202,160
Recreation and Culture
908,665 926,320 Transport
3,329,330 1,790,618
Economic Services
57,930 27,465 Other Property and Services
569,163 573,364
5,677,356 3,812,044
By Class Land and Buildings
1,131,312 955,868
Plant and Equipment
516,540 448,312
Furniture and Equipment
105,034 107,730
Infrastructure - Roads
2,862,999 1,639,311
Infrastructure - Parks and Reserves
143,431 470,016
Infrastructure - Other
918,040 190,807
5,677,356 3,812,044
Auditors Remuneration - Audit
19,580 12,050
Interest Expenses Accrued Interest Adjustment
(1,766) (1,874) Debentures (refer Note 18(a)) 47,836 58,925
46,070 57,051
Rental Charges - Operating Leases 44,784 40,125
(ii) Crediting as Revenue: Actual
2015/2016 Budget
2015/2016 Actual
2014/2015
Interest Earnings Investments - Reserve Funds 195,482 200,000 261,725
- Other Funds 19,817 25,000 31,832 Other Interest Revenue (refer note 22) 41,880 42,000 41,365
257,179 267,000 334,921

ANNUAL REPORT 2015 / 2016
Page 72 of 108
Note 2 (cont) (b) Statement of Objectives
The Shire of Dandaragan is dedicated to providing high quality services to the community through the various service orientated programmes which it has established:-
General Purpose Funding (Schedule 3) Rate revenue and expenses (excluding Specified Area Rate income), amounts received from Government bodies of a general purpose nature and amounts receivable in respect of interest on deferred pensioner rates. Interest received from investments. It also includes Valuation and Legal Expenses.
Governance (Schedule 4) Members’ Costs incurred in carrying out Council’s functions.
Law, Order, Public Safety (Schedule 5)
Supervision of various by-laws, fire prevention and animal control.
Health (Schedule 7) Health administration and inspection, maintenance of doctor’s surgery, residence and other health and preventative services.
Community Amenities (Schedule 10) Rubbish collection services, rubbish tip maintenance, effluent disposal, townsite stormwater drainage control, maintenance and protection of environment, tourism, television rebroadcasting facilities, administration of Town Planning Scheme, operations of Community Development Officer and maintenance of cemeteries.
Recreation and Culture (Schedule 11)
Maintenance of halls and community centres, maintenance of beaches and foreshore amenities, maintenance of parks, gardens and reserves, and library services.
Transport (Schedule 12) Construction and maintenance of roads, footpaths, depots, traffic signs, street trees, street lighting and airfields.
Economic Services (Schedule 13) Pest & Vermin Control Services and administration of Building Control.
Other Property and Services (Schedule 14) Private works, plant operation costs, overhead costs, salaries and wages.

ANNUAL REPORT 2015 / 2016
Page 73 of 108
Note 2 (cont)
2. O
PERA
TIN
G R
EVEN
UES
AN
D EX
PEN
SES
( c )
Cond
ition
s ove
r Gra
nts /
Con
trib
utio
ns
Gran
t/Co
ntrib
utio
nFu
nctio
n/Ac
tivity
Ope
ning
Ba
lanc
e(1)
01/0
7/14
Rece
ived
(2)
2014
/201
5Ex
pend
ed(3
) 20
14/2
015
Clos
ing
Bala
nce
30/0
6/15
Rece
ived
(2)
2015
/201
6Ex
pend
ed(3
)
2015
/201
6
Clos
ing
Bala
nce
30/0
6/16
R4R
Fore
shor
eO
ther
Rec
reat
ion
& C
ultu
re39
9,90
0
26,1
83
37
3,71
7
91,9
84
28
1,73
3
Jurie
n CC
TVO
ther
Law
Ord
er &
Pub
lic
Safe
ty25
,000
25,0
00
25
,000
-
Ro
ads t
o Re
cove
ryTr
ansp
ort
402,
122
79
,391
322,
731
1,
149,
142
1,47
1,87
3
-
Loca
l Roa
ds S
tate
Initi
ativ
eTr
ansp
ort
1,84
0,00
0
1,
076,
374
763,
626
2,
000,
000
1,59
4,49
9
1,
169,
127
Aged
Frie
ndly
Com
mun
ities
tr
ateg
ic P
lan
Educ
atio
n &
Wel
fare
10,0
00
10
,000
10,0
00
-
Com
mun
ity C
rime
Prev
entio
n Fu
ndO
ther
Rec
reat
ion
& C
ultu
re6,
500
6,
500
6,
500
-
Aged
Frie
ndly
Com
mun
ities
Sm
all V
alue
Gra
ntTr
ansp
ort
51,0
00
51
,000
51,0
00
-
-
-
-
-
R4R
2012
/13
Indi
vidu
al
Com
pone
ntRe
crea
tion
and
Cultu
re19
8,55
1
1,73
4
2,47
2
197,
813
20
,969
176,
844
To
tal
223,
551
2,
711,
256
1,18
4,41
9
1,
750,
388
3,14
9,14
2
3,
271,
825
1,62
7,70
5

ANNUAL REPORT 2015 / 2016
Page 74 of 108
Note 3
Actual 2015/2016
Actual 2014/2015
3. CASH AND CASH EQUIVALENTS Unrestricted 2,246,391 3,044,809
Restricted 6,596,882 10,568,117 8,843,273 13,612,925 The following restrictions have been imposed by regulations or other
externally imposed requirements : Plant Replacement Reserve 576,353 855,811
Building Reserve 862,589 588,052
Long Service Leave Reserve Rubbish Reserve 357,962 351,029
Community Centre reserve 373,498 360,380
Television Reserve 92,244 90,458
Bushfire Reserve Computer Reserve 53,818 52,776
Annual Leave Entitlements Reserve Road Construction Reserve Caravan Parks Reserve 398,522 346,158
Playground Equipment Reserve Land Development Reserve 66,697 65,405
Parking Requirements Reserve 10,765 10,557
Coastal / Foreshore Development Reserve Parks and Recreational Grounds Development Reserve 355,176 348,297
Footpath Construction Reserve Sport and Recreation Reserve 182,854 130,280
Admin Office Extension Reserve 426 425
Landscaping Reserve 2,499 2,451
Jetty Reserve 276,558 336,660
Aerodrome Reserve 79,692 56,141
Housing Reserve Jurien Bay City Centre Enhancement Project (Supertowns) Reserve 494,397 3,829,365
Staff Attraction & Incentive Reserve 197,822 193,990
Public Open Space Renewal Reserve 739,715 557,373
Infrastructure Renewal Reserve 1,056,110 937,591
Public Open Space Construction Reserve 84,279 82,647
Infrastructure Construction Reserve Building Construction Reserve 109,687 107,563
Leave Reserve 203,419 199,479
Sewer Stage 1B Reserve 21,798 1,065,231
Total Reserve 6,596,882 10,568,117

ANNUAL REPORT 2015 / 2016
Page 75 of 108
Note 4
2016
2015
4. TRADE AND OTHER RECEIVABLES
$
$
Current
Rates Outstanding
244,702
188,192
Sundry Debtors
146,873
737,133
GST Receivable
117,007
209,753
Accrued Income
0
73,290
508,582
1,208,368
Non-Current
Rates Outstanding - Pensioners
32,598
25,854
Loans - Clubs/Institutions
247,541
238,522
Bonds and Deposits
1,862
1,862
282,001
266,237
Note 5
2016
2015
5. INVENTORIES
Current
Fuel and Materials
25,563
26,466
25,563
26,466

ANNUAL REPORT 2015 / 2016
Page 76 of 108
Note 6
6. PROPERTY, PLANT AND EQUIPMENT 2016
2015
$
$
Land and Buildings - Independent Valuation 2014 31,574,502
31,574,502
Additions after Valuation - cost
4,244,294
3,961,435
Less Accumulated Depreciation
(2,076,532)
(955,868)
33,742,264
34,580,069
Furniture and Equipment - Independent Valuation 2016 991,650
901,170
Additions after Valuation - cost
0
133,833
Less Accumulated Depreciation
0
(217,481)
991,650
817,522
Plant and Equipment - Independent Valuation 2016 4,386,050
4,113,150
Additions after Valuation - cost
71,805
1,287,230
Less Accumulated Depreciation
(180)
(803,590)
4,457,675
4,596,790
Depreciated Cost of PP&E at fair value 39,191,589
39,994,381
Current Replacement cost of
Depreciated PP&E at fair value
41,268,301
41,971,320
less Land
(2,643,000)
(2,643,000)
Current Replacement cost of
38,625,301
39,328,320
Depreciated PP&E at fair value less land
less Accumulated Depreciation
(2,076,712)
(1,976,939)
Depreciate Cost of PP&E at fair value (less land) 36,548,589
37,351,381
Land
2,643,000
2,643,000
Depreciated Cost of PP&E at fair value 39,191,589 39,994,381

ANNUAL REPORT 2015 / 2016
Page 77 of 108
Note 6 (cont)
Land & Buildings The Shire’s land and buildings were revalued at 30 June 2014 by independent valuers. In relation to land and non-specialised buildings, valuations were made on the basis of observable open market values of similar assets, adjusted for condition and comparability, at their highest and best use (Level 2 inputs in the fair value hierarchy). With regard to specialised buildings, these were valued having regard for their current replacement cost utilising both observable and unobservable inputs being construction costs based on recent contract prices, current condition (Level 2 inputs), residual values and remaining useful life assessments (Level 3 inputs). Given the significance of the Level 3 inputs into the overall fair value measurement, these specialised building assets are deemed to have been valued using Level 3 inputs. These Level 3 inputs are based on assumptions with regards to future values and patterns of consumption utilising current information. If the basis of these assumptions were varied, they have the potential to result in a significantly higher or lower fair value measurement. The revaluation of these assets resulted in an overall increase of $15,555,572.87 in the net value of the Shire’s land and buildings. All of this increase was credited to the revaluation surplus in the Shire’s equity and was recognised as Changes on Revaluation of non-current Assets in the Statement of Comprehensive Income. Furniture and Equipment & Plant and Equipment: Both furniture and equipment and plant and equipment were revalued in 2016 as part of the mandatory requirements embodied in Local Government (Financial Management) Regulation 17A. Whilst the additions since that time are shown at cost, given they were acquired at arms length and any accumulated depreciation reflects the usage of service potential, it is considered the recorded written down value approximates fair value. Thus, the value is considered in accordance with Local Government (Financial Management (Regulation) 17A (2) which requires these assets to be shown at fair value. They will be revalued during the year ended 30 June 2019 in accordance with the mandatory asset measurement framework detailed at Note 1.

ANNUAL REPORT 2015 / 2016
Page 78 of 108
Note 6 (cont)
6.PR
OPE
RTY,
PLA
NT
AND
EQU
IPM
ENT
(Con
tinue
d)
Mov
emen
ts in
Car
ryin
g Am
ount
s
Mov
emen
t in
the
carr
ying
am
ount
s of e
ach
clas
s of p
rope
rty,
pla
nt a
nd e
quip
men
t bet
wee
n th
e be
ginn
ing
and
the
end
of th
e cu
rren
t fin
anci
al y
ear.
Bala
nce
Carr
ying
at th
eRe
valu
atio
nAm
ount
Begi
nnin
gIn
crem
ents
/De
prec
iatio
nat
the
of th
e Ye
arAd
ditio
ns(D
ispo
sals
)(D
ecre
men
ts)
(Exp
ense
)En
d of
Yea
r$
$$
$$
$
Free
hold
Lan
d(L
evel
2)
2,64
3,00
00
(15,
000)
00
2,62
8,00
0To
tal L
and
2,64
3,00
00
(15,
000)
00
2,62
8,00
0
Non
-Spe
cial
ised
Build
ings
(Lev
el 2
)1,
266,
709
52,2
44(7
0,00
0)0
(59,
032)
1,18
9,92
0
Spec
ialis
ed B
uild
ings
(Lev
el 3
)30
,670
,360
315,
615
00
(1,0
61,6
32)
29,9
24,3
43To
tal B
uild
ings
31,9
37,0
6936
7,85
8(7
0,00
0)0
(1,1
20,6
64)
31,1
14,2
64
Tota
l Lan
d an
d Bu
ildin
gs34
,580
,069
367,
858
(85,
000)
0(1
,120
,664
)33
,742
,264
Furn
iture
and
Equ
ipm
ent
(Lev
el 3
)81
7,52
22,
482
027
6,68
0(1
05,0
34)
991,
650
Plan
t and
Equ
ipm
ent
(Lev
el 2
)4,
596,
790
1,00
9,25
4(4
15,8
72)
(1,2
67,2
58)
(516
,540
)3,
406,
375
Plan
t and
Equ
ipm
ent
(Lev
el 3
)0
00
1,05
1,30
00
1,05
1,30
0
Tota
l Pro
pert
y, P
lant
and
Equ
ipm
ent
39,9
94,3
811,
379,
595
(500
,872
)60
,722
(1,7
42,2
38)
39,1
91,5
89

ANNUAL REPORT 2015 / 2016
Page 79 of 108
Note 6 (cont)
6PR
OPE
RTY,
PLA
NT
AND
EQU
IPM
ENT
(Con
tinue
d)
(c)
Fair
Valu
e M
easu
rem
ents
Asse
t Cla
ssFa
ir Va
lue
Hier
arch
yVa
luat
ion
Tech
niqu
eBa
sis o
f val
uatio
nDa
te o
f las
t Va
luat
ion
Inpu
ts u
sed
Land
and
Bui
ldin
gs
Free
hold
Lan
d2
Obs
erva
ble
open
mar
ket v
alue
s of
simila
r ass
ets,
adj
uste
d fo
r con
ditio
n an
d co
mpa
rabi
lity,
at t
heir
high
est
and
best
use
Inde
pend
ent v
alua
tion
June
201
4Pr
ice
per h
ecta
re /
mar
ket b
orro
win
g ra
te
Non
- Sp
ecia
lised
Bu
ildin
gs2
Obs
erva
ble
open
mar
ket v
alue
s of
simila
r ass
ets,
adj
uste
d fo
r con
ditio
n an
d co
mpa
rabi
lity,
at t
heir
high
est
and
best
use
Inde
pend
ent v
alua
tion
June
201
4Im
prov
emen
ts to
land
usin
g co
nstr
uctio
n co
sts a
nd
curr
ent c
ondi
tion
Spec
ialis
ed B
uild
ings
3Im
prov
emen
ts to
land
val
ued
usin
g co
st a
ppro
ach
usin
g de
prec
iate
d re
plac
emen
t cos
tIn
depe
nden
t val
uatio
nJu
ne 2
014
Impr
ovem
ents
to la
nd u
sing
cons
truc
tion
cost
s and
cu
rren
t con
ditio
n (le
vel 2
), re
sidua
l and
rem
aini
ng u
sefu
l lif
e as
sess
men
t (le
vel 3
)
Furn
iture
and
Equ
ipm
ent
3Co
st a
ppro
ach
usin
g de
prec
iate
d re
plac
emen
t cos
tIn
depe
nden
t val
uatio
nJu
ne 2
016
Purc
hase
cos
ts a
nd c
urre
nt c
ondi
tion
(Lev
el 2
), re
sidua
l va
lues
and
rem
aini
ng u
sefu
l life
ass
essm
ents
(Lev
el 3
) in
puts
Plan
t and
Equ
ipm
ent
Plan
t and
Equ
ipm
ent
2M
arke
t app
roac
h us
ing
rece
nt
obse
rvab
le m
arke
t dat
a fo
r sim
ilar
item
Inde
pend
ent v
alua
tion
June
201
6M
arke
t pric
e pe
r ite
m
Plan
t and
Equ
ipm
ent
3Co
st a
ppro
ach
usin
g de
prec
iate
d re
plac
emen
t cos
tIn
depe
nden
t val
uatio
nJu
ne 2
016
Purc
hase
cos
ts a
nd c
urre
nt c
ondi
tion
(Lev
el 2
), re
sidua
l va
lues
and
rem
aini
ng u
sefu
l life
ass
essm
ents
(Lev
el 3
) in
puts
Leve
l 3 in
puts
are
bas
ed o
n as
sum
ptio
ns w
ith re
gard
s to
futu
re v
alue
s and
pat
tern
s of c
onsu
mpt
ion
utili
sing
curr
ent i
nfor
mat
ion.
If th
e ba
sis o
f th
ese
assu
mpt
ions
wer
e va
ried
, the
y ha
ve th
e po
tent
ial t
o re
sult
in a
sign
ifica
ntly
hig
her o
r low
er fa
ir va
lue
mea
sure
men
t.
Durin
g th
e pe
riod
ther
e w
ere
chan
ges i
n th
e va
luat
ion
tech
niqu
es u
sed
to d
eter
min
e th
e fa
ir va
lue
ofPr
oper
ty, P
lant
and
equ
ipm
ent u
sing
leve
l 2 o
r lev
el 3
inpu
ts

ANNUAL REPORT 2015 / 2016
Page 80 of 108
Note 7
2016
2015
$
$
7. INFRASTRUCTURE
Roads - Management Valuation 2015 - Level 3
234,795,000
234,795,000
Additions after valuation - cost
4,360,771
0
Less Accumulated Depreciation
(59,245,999)
(56,383,000)
179,909,772
178,412,000
Footpaths - Management Valuation 2015 - Level 3
7,072,000
7,072,000
Additions after valuation - cost
269,356
0
Less Accumulated Depreciation
(2,069,000)
(1,859,000)
5,272,356
5,213,000
Drainage - Independent Valuation 2015 - Level 3
6,870,000
6,870,000
Additions after valuation - cost
4,369,015
0
Less Accumulated Depreciation
(1,624,348)
(1,510,000)
9,614,667
5,360,000
Parks and Reserves - Independent Valuation 2015 - Level 3 2,878,183
2,878,183
Additions after valuation - cost
356,623
0
Less Accumulated Depreciation
(1,193,631)
(1,050,200)
2,041,175
1,827,983
Other Infrastructure - Independent Valuation 2015 - Level 3 16,279,000
16,279,000
Additions after valuation - cost
225,722
0
Less Accumulated Depreciation
(5,962,692)
(5,369,000)
10,542,030
10,910,000
Depreciated Infrastructure at fair value
207,380,000
201,722,983
Current Replacement cost of
Depreciated Infrastructure at fair value
277,475,670
267,894,183
less Accumulated Depreciation
(70,095,670)
(66,171,200)
Depreciated Infrastructure at fair value
207,380,000
201,722,983
The fair value of infrastructure is determined at least every three years in accordance with the regulatory framework. Additions since the date of valuation are shown as cost. Given they were acquired at arms length and any accumulated depreciation reflects the usage of service potential, it is considered the recorded written down value approximates fair value. At the end of each intervening period the valuation is reviewed and, where appropriate, the fair value is updated to reflect current market conditions. This process is considered to be in accordance with Local Government (Financial Management) Regulation 17A (2) which requires infrastructure to be shown at fair value.

ANNUAL REPORT 2015 / 2016
Page 81 of 108
Note 7 (cont)
7. I
NFR
ASTR
UCT
URE
(Con
tinue
d)
Mov
emen
ts in
Car
ryin
g Am
ount
s
The
follo
win
g re
pres
ents
the
mov
emen
t in
the
carr
ying
am
ount
s of e
ach
clas
s of i
nfra
stru
ctur
e be
twee
n th
ebe
ginn
ing
and
the
end
of th
e cu
rren
t fin
anci
al y
ear.
Bala
nce
Carr
ying
at th
eRe
valu
atio
nAm
ount
Begi
nnin
gIn
crem
ents
/De
prec
iatio
nat
the
of th
e Ye
arAd
ditio
ns(D
ispo
sals
)(D
ecre
men
ts)
(Exp
ense
)En
d of
Yea
r$
$$
$$
$
Road
s(L
evel
3)
178,
412,
000
4,36
0,77
10
(2,8
62,9
99)
179,
909,
772
Foot
path
s(L
evel
3)
5,21
3,00
026
9,35
60
(210
,000
)5,
272,
356
Drai
nage
(Lev
el 3
)5,
360,
000
4,36
9,01
50
(114
,348
)9,
614,
667
Park
s and
Res
erve
s(L
evel
3)
1,82
7,98
335
6,62
30
(143
,431
)2,
041,
175
Oth
er In
fras
truc
ture
(Lev
el 3
)10
,910
,000
225,
722
0(5
93,6
92)
10,5
42,0
30
Tota
l Inf
rast
ruct
ure
201,
722,
984
9,58
1,48
70
0(3
,924
,470
)20
7,38
0,00
1

ANNUAL REPORT 2015 / 2016
Page 82 of 108
Note 7 (cont)
7.IN
FRAS
TRU
CTU
RE (C
ontin
ued)
(c)
Fair
Valu
e M
easu
rem
ents
Asse
t Cla
ssFa
ir Va
lue
Hier
arch
yVa
luat
ion
Tech
niqu
eBa
sis o
f val
uatio
nDa
te o
f las
t Va
luat
ion
Inpu
ts u
sed
Road
s3
Cost
app
roac
h us
ing
depr
ecia
ted
repl
acem
ent c
ost
Man
agem
ent v
alua
tion
June
201
5Co
nsrt
uctio
n co
sts a
nd c
urre
nt c
ondi
tion
(Lev
el 2
), re
sidua
l val
ues a
nd re
mai
ning
use
ful l
ife a
sses
smen
ts
(Lev
el 3
) inp
uts
Foot
path
s3
Cost
app
roac
h us
ing
depr
ecia
ted
repl
acem
ent c
ost
Man
agem
ent v
alua
tion
June
201
5Co
nsrt
uctio
n co
sts a
nd c
urre
nt c
ondi
tion
(Lev
el 2
), re
sidua
l val
ues a
nd re
mai
ning
use
ful l
ife a
sses
smen
ts
(Lev
el 3
) inp
uts
Drai
nage
3Co
st a
ppro
ach
usin
g de
prec
iate
d re
plac
emen
t cos
tIn
depe
nden
t val
uatio
nJu
ne 2
015
Cons
rtuc
tion
cost
s and
cur
rent
con
ditio
n (L
evel
2),
resid
ual v
alue
s and
rem
aini
ng u
sefu
l life
ass
essm
ents
(L
evel
3) i
nput
s
Park
s and
Res
erve
s3
Cost
app
roac
h us
ing
depr
ecia
ted
repl
acem
ent c
ost
Inde
pend
ent v
alua
tion
June
201
5Co
nsrt
uctio
n co
sts a
nd c
urre
nt c
ondi
tion
(Lev
el 2
), re
sidua
l val
ues a
nd re
mai
ning
use
ful l
ife a
sses
smen
ts
(Lev
el 3
) inp
uts
Oth
er In
fras
truc
ture
3Co
st a
ppro
ach
usin
g de
prec
iate
d re
plac
emen
t cos
tIn
depe
nden
t val
uatio
nJu
ne 2
015
Cons
rtuc
tion
cost
s and
cur
rent
con
ditio
n (L
evel
2),
resid
ual v
alue
s and
rem
aini
ng u
sefu
l life
ass
essm
ents
(L
evel
3) i
nput
s
Leve
l 3 in
puts
are
bas
ed o
n as
sum
ptio
ns w
ith re
gard
s to
futu
re v
alue
s and
pat
tern
s of c
onsu
mpt
ion
utili
sing
curr
ent i
nfor
mat
ion.
If th
e ba
sis o
f th
ese
assu
mpt
ions
wer
e va
ried
, the
y ha
ve th
e po
tent
ial t
o re
sult
in a
sign
ifica
ntly
hig
her o
r low
er fa
ir va
lue
mea
sure
men
t.
Durin
g th
e pe
riod
ther
e w
ere
no c
hang
es in
the
valu
atio
n te
chni
ques
use
d to
det
erm
ine
the
fair
valu
e of
infr
astr
uctu
re u
sing
leve
l 3 in
puts
.

ANNUAL REPORT 2015 / 2016
Page 83 of 108
Note 8
2016
2015
$
$
8.
TRADE AND OTHER PAYABLES
Current
Sundry Creditors
499,013
483,745
GST Payable
30,632
73,225
Accrued Interest on Debentures
12,726
14,493
Accrued Expenses
15,914
430,942
Accrued Salaries and Wages
22,928
0
581,213
1,002,405
Note 9 9. LONG-TERM BORROWINGS
Current
Secured by Floating Charge
Debentures
213,028
199,104
213,028
199,104
Non-Current
Secured by Floating Charge
Debentures
525,195
708,214
525,195
708,214
Additional detail on borrowings is provided in Note 18.
Note 10 10. PROVISIONS
Current
Provision for Annual Leave
307,329
297,238
Provision for Long Service Leave
216,822
204,847
524,151
502,085
Non-Current
Provision for Long Service Leave
82,086
97,677
82,086
97,677

ANNUAL REPORT 2015 / 2016
Page 84 of 108
Note 11
11 RESERVES - CASH/INVESTMENT BACKED
Actual Actual Actual Actual
2016 2016 2016 2016
Opening Balance
Transfer to Transfer (from)
Closing Balance
$ $ $ $
Plant Replacement Reserve 855,811 16,904 (296,362) 576,353
Building Renewal Reserve 588,052 274,537
862,589
Rubbish Reserve 351,029 6,934
357,962
Community Centre reserve 360,380 13,118
373,498
Television Reserve 90,458 1,787
92,244
Computer Reserve 52,776 1,042
53,818
Caravan Parks Reserve 346,158 52,364
398,522
Land Development Reserve 65,405 1,292
66,697
Parking Requirements Reserve (Lot 1154 Sandpiper Street) 10,557 209
10,765
Parks and Recreational Grounds Development Reserve (Seagate Estate) 348,297 6,880
355,176
Sport and Recreation Reserve 130,280 52,573
182,854
Admin Office Extension Reserve 425 1
426
Landscaping Reserve (Lot 1154 Sandpiper Street) 2,451 48
2,499
Jetty Reserve 336,660 6,650 (66,751) 276,558
Aerodrome Reserve 56,141 23,551
79,692
Jurien Bay City Centre Enhancement Project (Supertowns) Reserve 3,829,365 64,809 (3,399,776) 494,397
Staff Attraction & Incentive Reserve 193,990 3,832
197,822
Public Open Space Renewal Reserve 557,373 182,342
739,715
Infrastructure Renewal Reserve 937,591 118,519
1,056,110
Public Open Space Construction Reserve 82,647 1,632
84,279
Infrastructure Construction Reserve
0
Building Construction Reserve 107,563 2,125
109,687
Leave Reserve 199,479 3,939
203,419
Sewer Stage 1B Reserve 1,065,231 18,618 (1,062,051) 21,798
10,568,117 853,706 (4,824,941) 6,596,882
All of the reserve accounts are supported by money held in financial institutions and match the amount shown as restricted cash in Note 3 to this financial report.

ANNUAL REPORT 2015 / 2016
Page 85 of 108
Note 11 (cont)
11 RESERVES - CASH/INVESTMENT BACKED
In accordance with council resolutions in relation to each reserve account, the purpose for which the reserves are set aside and their anticipated date of use are as follows:
Name of Reserve
Anticipated date of use
Purpose of the reserve
Plant Replacement Reserve Ongoing
- to be used in order to assist in the purchase of major items of plant.
Building Renewal Reserve Ongoing
- to fund capital renewal of buildings and associated assets as guided by the Building Asset Management Plan.
Rubbish Reserve Ongoing
- to be used to fund establishing, enhancing, rehabilitation or any other activities associated with new and existing landfill or waste site
Community Centre reserve Ongoing
- to be used to fund capital construction costs and major maintenance restoration / preservation costs to the community recreation centres located in the four towns.
Television Reserve Ongoing
- to be used to fund the provision of new or improved television rebroadcasting facilities throughout the shire.
Computer Reserve Ongoing - to be used for the future purchase of computers.
Caravan Parks Reserve Ongoing
- to be used to fund improvements, other works and the promotion of caravan parks and their surrounds. To also fund planning, feasibility and establishment of new caravan parks.
Land Development Reserve Ongoing
- For the purpose of funding land development in the townsites of Dandaragan and Badgingarra.
Parking Requirements Reserve (Lot 1154 Sandpiper Street) Ongoing
- to fund future parking requirements in the Shire of Dandaragan in the vicinity of Lot 1154 Sandpiper Street, Jurien Bay as separately identified.
Parks and Recreational Grounds Development Reserve (Seagate Estate) Ongoing
- to fund the future purchase of land or development of parks and recreation grounds in the locality of Seagate Estates as separately identified or with Ministerial approval, for the improvement or development of parks and recreation.
Sport and Recreation Reserve Ongoing
- To fund community sporting groups requests in accordance with the Shire of Dandaragan's Recreation Plan.
Admin Office Extension Reserve 2016/2017
- To fund investigation, design and capital costs of future office extensions.
Landscaping Reserve (Lot 1154 Sandpiper Street) Ongoing
- to fund future landscaping requirements in the Shire of Dandaragan in the vicinity of Lot 1154 Sandpiper Street, Jurien Bay as separately identified.
Jetty Reserve 2016/2017
- to fund design, feasibility and construction relating to the jetty project
Aerodrome Reserve Ongoing
- to be used for renewal, major maintenance, expansion or relocation of Shire of Dandaragan's airstrips and aerodromes

ANNUAL REPORT 2015 / 2016
Page 86 of 108
Note 11 (cont)
Jurien Bay City Centre Enhancement Project (Supertowns) Reserve 2016/2017
- to be used to fulfilling the requirements, outcomes and achievables identified in the Financial Assistance Agreement for the Supertowns Development Project Fund – Jurien Bay City Centre Enhancement Project
Staff Attraction & Incentive Reserve Ongoing
- to be used to fund staff attraction and incentive programs and processes, such as, but not limited to additional superannuation contributions, bonuses, rental subsidies and utility subsidies
Public Open Space Renewal Reserve Ongoing
- to fund capital renewal of public open space and associated assets as guided by the Public Open Space Asset Management Plan
Infrastructure Renewal Reserve Ongoing
- to fund capital renewal of infrastructure and associated assets as guided by the Infrastructure Asset Management Plan.
Public Open Space Construction Reserve Ongoing
- to fund capital construction and/or purchase of public open space and associated assets.
Infrastructure Construction Reserve Ongoing
- to fund capital construction and/or purchase of infrastructure and associated assets.
Building Construction Reserve Ongoing
- to fund capital construction and/or purchase of infrastructure and other associated assets.
Leave Reserve Ongoing
- to fund annual leave and long service leave entitlements.
Sewer Stage 1B Reserve 2016/2017
- to be used to fulfilling the requirements, outcomes and achievables identified in the Financial Assistance Agreement for the Sewer Stage 1B Project
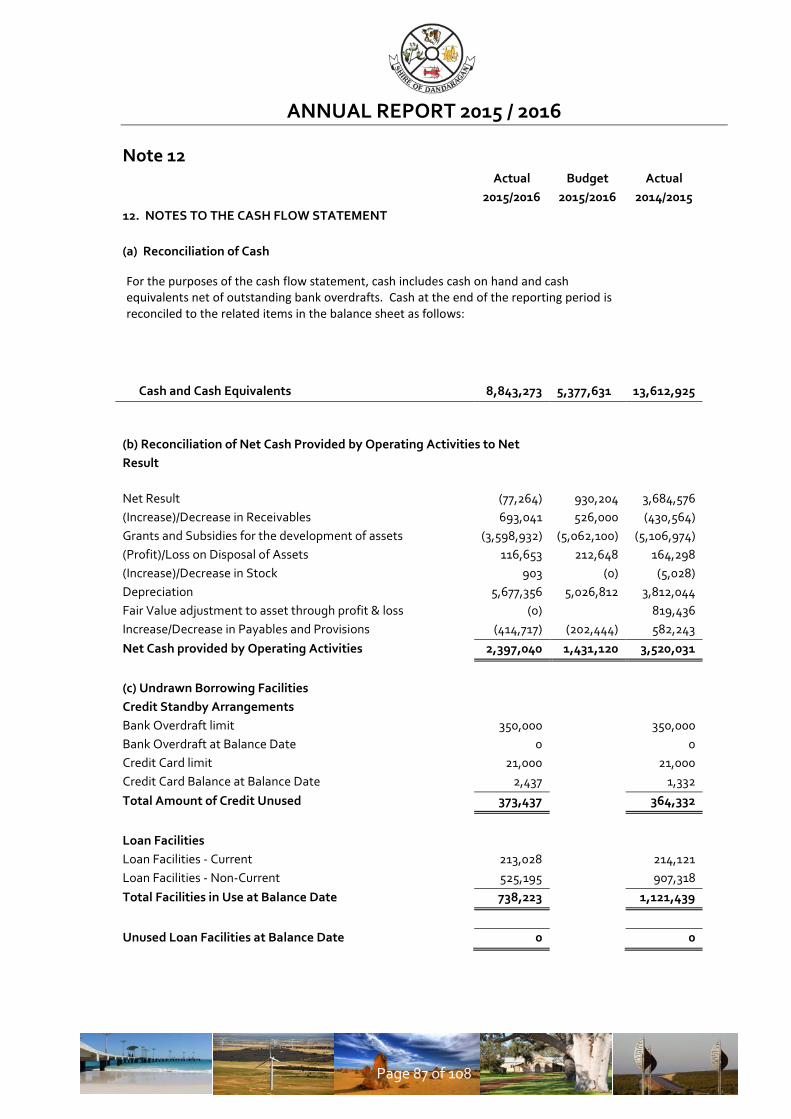
ANNUAL REPORT 2015 / 2016
Page 87 of 108
Note 12
Actual 2015/2016
Budget 2015/2016
Actual 2014/2015
12. NOTES TO THE CASH FLOW STATEMENT
(a) Reconciliation of Cash
Cash and Cash Equivalents 8,843,273
5,377,631 13,612,925
(b) Reconciliation of Net Cash Provided by Operating Activities to Net Result
Net Result (77,264) 930,204 3,684,576 (Increase)/Decrease in Receivables 693,041 526,000 (430,564) Grants and Subsidies for the development of assets (3,598,932) (5,062,100) (5,106,974) (Profit)/Loss on Disposal of Assets 116,653 212,648 164,298 (Increase)/Decrease in Stock 903 (0) (5,028) Depreciation 5,677,356 5,026,812 3,812,044 Fair Value adjustment to asset through profit & loss (0)
819,436
Increase/Decrease in Payables and Provisions (414,717) (202,444) 582,243 Net Cash provided by Operating Activities 2,397,040 1,431,120 3,520,031
(c) Undrawn Borrowing Facilities Credit Standby Arrangements Bank Overdraft limit 350,000
350,000
Bank Overdraft at Balance Date 0
0 Credit Card limit 21,000
21,000
Credit Card Balance at Balance Date 2,437
1,332 Total Amount of Credit Unused 373,437
364,332
Loan Facilities Loan Facilities - Current 213,028
214,121
Loan Facilities - Non-Current 525,195
907,318 Total Facilities in Use at Balance Date 738,223
1,121,439
Unused Loan Facilities at Balance Date 0
0
For the purposes of the cash flow statement, cash includes cash on hand and cash equivalents net of outstanding bank overdrafts. Cash at the end of the reporting period is reconciled to the related items in the balance sheet as follows:

ANNUAL REPORT 2015 / 2016
Page 88 of 108
Note 13
2016
2015
13. CAPITAL AND LEASING COMMITMENTS $
$
(a) Operating Lease Commitments
Non-cancellable operating leases
contracted for but not capitalised in
the accounts.
Payable:
- not later than one year
29,621
18,500
- later than one year but not later than five years 87,736
49,334
- later than five years
0
0
117,357
67,835
(b) Capital Expenditure Commitments
Contracted for:
- plant & equipment purchases
-
-
- capital expenditure projects
556,369
381,117
Payable:
- not later than one year
556,369
381,117
Note 14
2016
2015
$
$
14. TOTAL ASSETS CLASSIFIED BY FUNCTION AND ACTIVITY
Governance
5,338,353
5,579,935
General Purpose Funding
0
0
Law, Order, Public Safety
1,846,101
1,794,562
Health
822,887
881,509
Community Amenities
18,028,142
18,517,343
Recreation and Culture
17,309,000
17,167,983
Transport
193,080,037
188,237,684
Economic Services
1,514,079
880,637
Other Property and Services
8,632,990
8,657,710
246,571,589
241,717,364

ANNUAL REPORT 2015 / 2016
Page 89 of 108
Note 15
2016 2015 201415. FINANCIAL RATIOS
Current Ratio 3.50 1.75 1.43 Asset Sustainability Ratio 0.97 1.20 1.31 Debt Service Cover Ratio 8.60 9.77 5.23 Operating Surplus Ratio* (0.43) (0.18) (0.18) Own Source Revenue Ratio 0.64 0.65 0.76
The above ratios are calculated as follows:
Current Ratio current assets minus restricted current assetscurrent liabilities minus liabilities associated
with restricted assets
Asset Sustainability Ratio capital renewal and replacement expendituredepreciation expense
Debt Service Cover Ratio annual operating surplus before interest and depreciationprincipal and interest
Operating Surplus Ratio operating revenue minus operating expenseown source operating revenue
Own Source Revenue Ratio own source operating revenueoperating expense

ANNUAL REPORT 2015 / 2016
Page 90 of 108
Note 16
16. RESTRICTED ASSETS
Funds held at balance date over which the Municipality has no control and are not included inthe financial statements are as follows:
TRUST Balance Balance30-Jun-15 Inwards Outwards 30-Jun-16
$ $ $ $
Housing Bonds 250 250 Seagate Estate 37,300 37,300 Dust Bond 50,007 50,007 Fire Fighting Facility 5,000 5,000 Housing Relocation Bond 4,000 4,000 Footpath Deposit 2,600 2,600 Burial Plots 1,869 450 2,319 Other Development Bonds 19,000 19,000 Dandaragan Recreation Fund 9,500 9,500 Nomination Deposits - - Unclaimed monies 4,476 4,476 Development Assessment Panel Fee - BSL 639 41,248 38,887 3,000 BCITF - Scheme Amendment Deposit 1,000 1,000 KidsSport - 480 480
135,641 42,178 38,887 138,932
RESTRICTED ASSETS Balance Balance30-Jun-15 Inwards Outwards 30-Jun-16
$ $ $ $
Regional Strategy 13,540 13,540 DOLA Stage 1 Fencing & Footpaths, Cervantes 41,401 41,401 Landcorp Cash in Lieu POS 162,500 162,500 $500 x 11 Lot Contrib. Mtce of Canover Rd Stage 2 15,900 15,900 Footpath - Foreshore Management Plan 20,814 20,814 Lot 1146 Sandpiper Street 2,000 2,000 Retention Wormall Civil 148,050 148,050 Retention DJ MacCormick Stowns 39,078 39,078 Lot 290 Canover 5,000 5,000 Interest 59,550 59,550
320,706 187,128 - 507,834
Movement
Movement

ANNUAL REPORT 2015 / 2016
Page 91 of 108
Note 17
17. DISPOSALS OF ASSETS - 2015/2016 FINANCIAL YEAR
The following assets were disposed of during the year.
Net Book Value Sale Price Profit (Loss)
Actual Budget Actual Budget Actual Budget
$ $ $ $ $ $
Class of Asset
Plant & Machinery
Grader 66,000 65,000 138,676 142,000 (72,676) (77,000)
Water Tanker 5,025 5,000 15,000 15,000 (9,975) (10,000)
Tractor 5,000 11,818 20,000 20,000 (15,000) (8,182)
Pig Trailer 0 5,000 12,000 0 (7,000)
Loader 0 5,000 12,500 0 (7,500)
Ride On Mower 3,000 3,000 3,233 3,300 (233) (300)
Light Vehicle CEO 31,818 29,091 38,074 37,000 (6,256) (7,909)
Light Vehicle EMI 28,182 25,455 29,071 31,000 (889) (5,545)
Light Vehicle EMCCS 28,182 24,545 30,358 31,000 (2,177) (6,455)
Light Vehicle MPS 25,455 21,818 29,989 29,500 (4,535) (7,682)
Light Vehicle MBS 25,455 21,818 29,235 29,000 (3,781) (7,182)
Light Vehicle EHO 24,545 21,818 28,827 29,500 (4,281) (7,682)
Light Vehicle Utility 5,455 2,000 12,022 11,000 (6,567) (9,000)
Light Vehicle Utility 7,273 2,000 11,386 11,500 (4,113) (9,500)
Road Patrol Truck 18,182 20,000 30,000 32,711 (11,818) (12,711)
7 Yard Truck 0 15,000 44,000 0 (29,000)
Land
Lot 6 Dandaragan Road 15,000 15,000
Building
Lot 6 Dandaragan Road 85,000 0 59,352 0 25,648 0
373,570 278,363 490,224 491,011 (116,653) (212,648)

ANNUAL REPORT 2015 / 2016
Page 92 of 108
Note 18
18.I
NFO
RMAT
ION
ON
BO
RRO
WIN
GS
(a)
Debe
ntur
e Re
paym
ents
Loan
Det
ails
Amou
nt
New
In
tere
st R
epay
men
tsPr
inci
pal
Out
stan
ding
Loan
sAc
tual
Budg
etAc
tual
Budg
etO
utst
andi
ngN
o.1
July
201
520
15/2
016
15/1
615
/16
15/1
615
/16
30 Ju
ne 2
016
Self
Supp
ortin
g Lo
ans
113
Adva
nce
Dand
arag
an16
,232
904
920
4,29
7
4,29
7
11,9
35
11
4Ce
rvan
tes C
omm
unity
Clu
b72
,415
4,96
4
5,03
3
14,1
36
14
,136
58,2
79
13
0Ju
rien
Bow
ling
Club
14
9,87
4
7,17
9
8,05
6
18,4
07
18
,407
131,
467
13
1Ju
rien
Bow
ling
Club
-
30,0
00
40
2
38
1
2,
824
2,
833
27
,176
Oth
er L
oans
127
Jurie
n Ad
min
Cen
tre
(ref
inan
ce 1
15)
453,
687
24
,432
24,4
32
54
,668
54,6
68
39
9,01
9
128
Jurie
n Je
tty
215,
110
9,
955
9,
955
10
4,76
3
104,
763
11
0,34
6
129
Heat
on S
tree
t Und
ergr
ound
Pow
er-
-
-
-
Ce
rvan
tes C
omm
unity
Cen
tre
-
-
Tota
l90
7,31
8
30,0
00
47
,836
48,7
76
19
9,09
5
199,
104
73
8,22
3
Com
mun
ity G
roup
Cas
h Ad
vanc
eAm
ount
N
ew
Prin
cipa
lO
utst
andi
ngLo
ans
Actu
alBu
dget
Out
stan
ding
1 Ju
ly 2
015
2015
/201
6-
-
30
June
201
6
Self
Supp
ortin
gCe
rvan
tes B
owlin
g Cl
ub20
,760
2,07
6
5,00
0
15,7
60
Tota
l-
20,7
60
-
-
2,
076
5,
000
15
,760
GRA
ND
TOTA
L90
7,31
8
50,7
60
47
,836
48,7
76
20
1,17
1
204,
104
75
3,98
3
Heat
on S
tree
t Und
ergr
ound
Pow
er is
par
tly fi
nanc
ed b
y a
Serv
ice
Char
geJu
rien
Recr
eatio
nal J
etty
is fi
nanc
ed b
y a
Spec
ified
Are
a Ra
teAl
l oth
er lo
an re
paym
ents
wer
e fin
ance
d by
gen
eral
pur
pose
reve
nue.
(b)
Ove
rdra
ft
Coun
cil e
stab
lishe
d an
ove
rdra
ft fa
cilit
y of
$35
0,00
0 in
200
1/02
to a
ssist
with
shor
t ter
m li
quid
ity re
quire
men
ts.
The
bala
nce
of th
e ba
nk o
verd
raft
at 1
July
201
5 an
d 30
June
201
6 w
as $
Nil.
Prin
cipa
l Rep
aym
ents
Prin
cipa
l Rep
aym
ents

ANNUAL REPORT 2015 / 2016
Page 93 of 108
Note 19
19a
RATI
NG
INFO
RMAT
ION
- 20
15/2
016
FIN
ANCI
AL Y
EAR
RATE
TYP
ERa
te in
Num
ber
Rate
able
Budg
etBu
dget
Budg
etBu
dget
$of
Valu
eRa
teIn
terim
Back
Tota
lRa
teIn
terim
Back
Tota
lPr
oper
ties
Reve
nue
Rate
Rate
sRe
venu
eRe
venu
eRa
teRa
tes
Reve
nue
Gen
eral
Rat
eGe
nera
l GRV
0.07
5600
1,83
527
,614
,498
2,08
7,65
6-
-2,
087,
656
2,09
0,68
022
,187
-2,
112,
867
Vaca
nt R
esid
entia
l - G
RV0.
1914
0068
53,
653,
810
699,
339
--
699,
339
699,
290
12,0
87-
-
687,
203
Vaca
nt R
ural
Res
iden
tial G
RVU
V0.
0074
7768
633
4,84
0,50
0
2,50
3,60
3
-
-2,
503,
603
2,50
3,60
3
2,
574
-
-
2,50
1,02
9U
V - M
inin
g0.
0074
772
736,
932
5,51
0
5,51
05,
510
5,
510
Sub-
Tota
l3,
208
36
6,84
5,74
0
5,29
6,10
8
-
-
5,
296,
108
5,29
9,08
2
7,
527
-
5,30
6,60
9
Min
imum
Rat
esGe
nera
l GRV
627
$
187
1,29
3,25
4
117,
249
-
-11
7,24
911
7,24
9
--
117,
249
Vaca
nt R
esid
entia
l - G
RV62
7$
16
947
5,88
0
10
5,96
3
--
105,
963
105,
963
-
-10
5,96
3Va
cant
Rur
al R
esid
entia
l GRV
--
0-
-0
UV
627
$
502,
440,
400
31
,350
--
31,3
5031
,350
--
31,3
50U
V - M
inin
g78
5$
87
1,64
8,12
5
68,2
95
-
-68
,295
67,5
10
-
-67
,510
Sub-
Tota
l49
35,
857,
659
322,
857
00
322,
857
322,
072
00
322,
072
Ex G
ratia
Rat
es1,
188
1,20
41,
204
3,70
137
2,70
3,39
95,
618,
965
5,62
0,15
35,
621,
154
5,62
9,88
5Di
scou
nts (
refe
r not
e 21
)(1
90,0
00)
(208
,322
)
Tota
l as p
er R
ate
Sett
ing
Stat
emen
t5,
430,
153
5,42
1,56
3Sp
ecifi
ed A
rea
Rate
(ref
er to
not
e 20
b)11
4,71
911
5,31
3In
stal
men
t Adm
in F
ee13
,000
12,7
00
Tota
l as p
er In
com
e St
atem
ent
5,55
7,87
25,
549,
576
2015
/16
BUDG
ET20
15/1
6 AC
TUAL

ANNUAL REPORT 2015 / 2016
Page 94 of 108
Note 19 (cont)
19b RATING INFORMATION - 2015/2016 FINANCIAL YEAR
Information on Surplus/(Deficit) Brought Forward
Description 1 July 2015 Movement Closing Balance
NET CURRENT ASSETS
Composition of Estimated Net Current Asset Position
CURRENT ASSET
Cash - Unrestricted 3,044,809 (798,418) 2,246,391
Cash - Restricted 10,568,117 (3,971,235) 6,596,882
Receivables 1,135,143 (657,193) 477,950
Inventories 26,466 (903) 25,563
14,774,534 (5,427,748) 9,346,786
LESS: CURRENT LIABILITIES
Payables and Provisions (483,745) (15,268) (499,013)
14,290,789 (5,443,016) 8,847,773
Less: Restricted Cash - Reserves 10,568,117 (3,971,235) 6,596,882
NET CURRENT ASSET POSITION 3,722,672 (1,471,781) 2,250,891
30 June 2015 Carried Forward Surplus (Deficit) $ 1,145,560
1 July 2015 Brought Forward Surplus (Deficit) $ 3,722,672
30 June 2016 Carried Forward Surplus (Deficit) $ 2,250,891
There was no difference between the Surplus/(Deficit) 1 July 2015 Brought Forward position used in the 2016 audited financial report and the Surplus/(Deficit) Carried Forward position as disclosed in the 2015 audited financial report.

ANNUAL REPORT 2015 / 2016
Page 95 of 108
Note 20
20a.
SPEC
IFIE
D AR
EA R
ATE
- 201
5/16
FIN
ANCI
AL Y
EAR
Rate
inBa
sis
Rate
able
Rate
Budg
etAp
plie
dBu
dget
$of
Valu
eRe
venu
eRa
teto
Cos
tsAp
plie
dRa
te$
$Re
venu
e$
to C
osts
$
$Je
tty
- Rat
e0.
0055
94GR
V20
,507
,076
114,
719
114,
719
114,
719
114,
719
- Int
erim
Rat
e59
40
594
0- B
ack
Rate
115,
313
114,
719
115,
313
114,
719
The
spec
ified
are
a ra
te is
for d
esig
n, fe
asib
ility
and
con
stru
ctio
n re
latin
g to
the
new
jett
y an
d fo
resh
ore
deve
lopm
ent a
t Dob
byn
Park
- Ju
rien
Bay
The
proc
eeds
of t
he ra
te a
re a
pplie
d to
the
cost
of d
esig
n co
ncep
t, pl
ans,
cos
ting
and
cons
truc
iton.

ANNUAL REPORT 2015 / 2016
Page 96 of 108
Note 21
21. DISCOUNTS, INCENTIVES, CONCESSIONS, & WRITE-OFFS- 2015/2016 FINANCIAL YEAR
Type Disc % Total BudgetCost/ Cost/Value Value
$ $General Rates Discount 5.00% 208,322 190,000
RatesCentral West Men's Shed Write-Off 3,024.00 3,024
Civic Centre HireJurien Bay District High School Waiver 6,220.00 6,220
Jurien Bay Airstrip LandingsMr P M Lonnon Waiver 24,958.37Pearce Flying Club Inc Waiver 606.32R F D S Western Operations - WA Waiver 316.94Najara Enterprises P/L Waiver 137.80Royal Aero Club of WA Inc Waiver 124.02Geraldton Air Charter P/L Waiver 96.46Back Nominees P/L Waiver 82.68Lloyd Helicopters P/L - In Administration Waiver 82.68Mr L Northey Waiver 82.68Mr H L Hamersley Waiver 68.90All Sky Helicopters P/L Waiver 55.12Skydive Express P/L Waiver 55.12Interair P/L Waiver 55.12Kelmac Aviation P/L Waiver 55.12Rotorwest P/L Waiver 55.12Aviair P/L Waiver 55.12Curtin Flying Club Inc Waiver 41.34Groundwater Consulting Services P/L Waiver 41.34Mr C O Hanson Waiver 41.34Mr D Joice Waiver 41.34Mr G Poett Waiver 41.34Mr P Bess Waiver 41.34Mr W G White Waiver 41.34Aeropower P/L Waiver 27.56Air Australia International P/L Waiver 27.56Chrishine Nominees P/L Waiver 27.56Corsaire P/L Waiver 27.56Fortescue Helicopters P/L Waiver 27.56Jandakot Flight Centre P/L Waiver 27.56L E & A Coppin Waiver 27.56Mr A Dean Waiver 27.56Mr A Dudgeon Waiver 27.56Mr B J Norrish Waiver 27.56

ANNUAL REPORT 2015 / 2016
Page 97 of 108
Note 21 (cont)
21. DISCOUNTS, INCENTIVES, CONCESSIONS, & WRITE-OFFS- 2015/2016 FINANCIAL YEAR
Type Disc % Total BudgetCost/ Cost/Value Value
$ $Mr E Croft Waiver 27.56Mr T Moore Waiver 27.56Mr W H Van Ast Waiver 27.56Shine Air P/L Waiver 27.56Togarn P/L Waiver 27.56VH-JOK P/L Waiver 27.56Bunbury Aero Club (Inc) Waiver 13.78C T L Flying Group Waiver 13.78Cloud Dancer Pilot Training P/L Waiver 13.78Cumbertronics P/L Waiver 13.78D S L Contracting P/L Waiver 13.78Datatec Australia P/L Waiver 13.78Deba International P/L Waiver 13.78Dr S N Clarke Waiver 13.78Dunn Aviation Aust P/L Waiver 13.78Erickson Air-Crane Inc Waiver 13.78H T Tan & J A Elliot-Tan Waiver 13.78Helibits P/L Waiver 13.78I L H A P/L Waiver 13.78Longbow Geological Services P/L Waiver 13.78Mr A Hyde Waiver 13.78Mr C Brady Waiver 13.78Mr C D Brown Waiver 13.78Mr D Cullen Waiver 13.78Mr G Hood Waiver 13.78Mr J Murphy Waiver 13.78Mr M Laufer Waiver 13.78Mr R E Naef Waiver 13.78Mt Gallipoli P/L Waiver 13.78Nantay P/L Waiver 13.78Northam Air Services P/L Waiver 13.78Outline Global P/L Waiver 13.78Robi44 Investments P/L Waiver 13.78Stamford Park Investments P/L Waiver 13.78University Flying Club Inc (WA) Waiver 13.78 28,018
A discount on rates is granted to all who pay their rates in full within 35 days of the date of serviceappearing on the rate notice.
Rates for 3 Madrid Street, Cervantes are written-off for the following reasons;i. the tenure of the land being crown land would be otherwise exempt from rating had the Central West Men’s Shed not taken up tenancyii. the Central West Men’s Shed is a non for profit community group with limited income earning potential; andiii. the purpose of a Men’s Shed aligns with the Shire of Dandaragan’s strategic plan
Hire fees for rooms at the Civic Centre are waived for educational purposes
Landing fees at the Jurien Bay airstrip were waive for 2015/2016
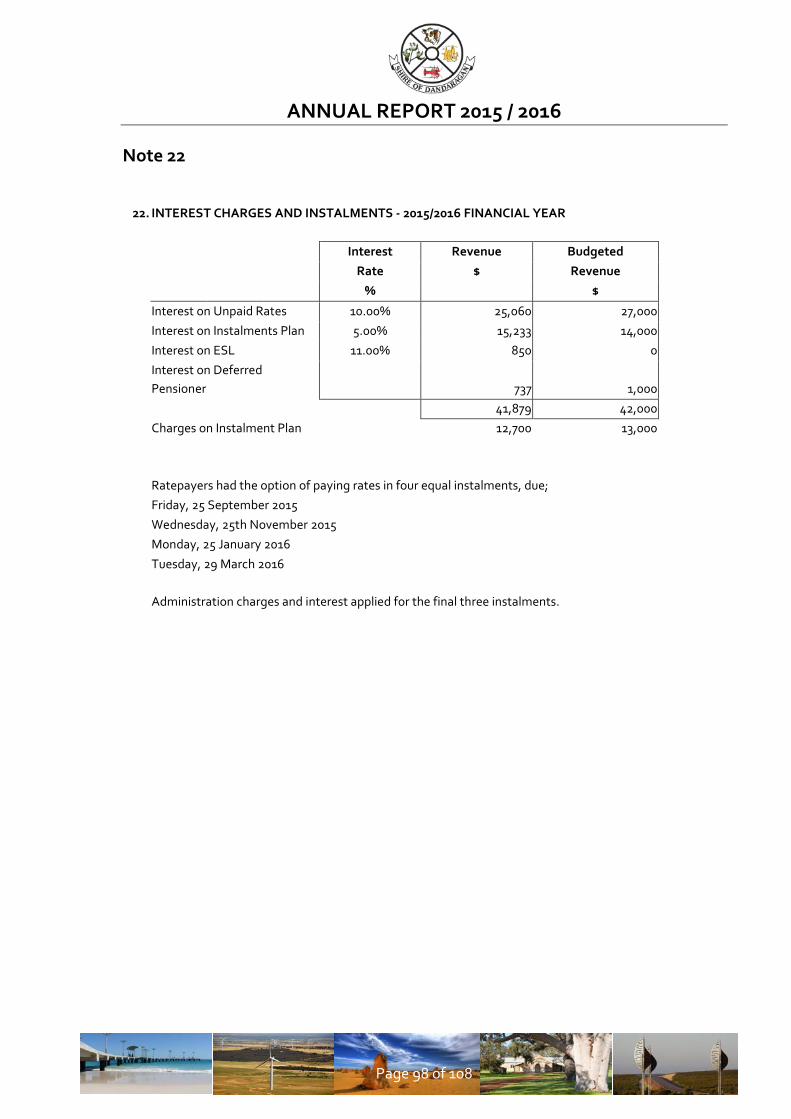
ANNUAL REPORT 2015 / 2016
Page 98 of 108
Note 22
22. INTEREST CHARGES AND INSTALMENTS - 2015/2016 FINANCIAL YEAR
Interest Revenue Budgeted
Rate $ Revenue
% $
Interest on Unpaid Rates 10.00% 25,060 27,000
Interest on Instalments Plan 5.00% 15,233 14,000
Interest on ESL
11.00% 850 0
Interest on Deferred Pensioner 737 1,000
41,879 42,000
Charges on Instalment Plan
12,700 13,000
Ratepayers had the option of paying rates in four equal instalments, due;
Friday, 25 September 2015
Wednesday, 25th November 2015
Monday, 25 January 2016
Tuesday, 29 March 2016
Administration charges and interest applied for the final three instalments.

ANNUAL REPORT 2015 / 2016
Page 99 of 108
Note 23
2016
2015
23. FEES & CHARGES
$
$
Governance
113
320
General Purpose Funding
11,190
20,271
Law, Order, Public Safety
311,063
283,583
Health
11,169
8,101
Community Amenities
1,102,559
1,329,839
Recreation & Culture
203,262
20,481
Transport
10,424
4,808
Economic Services
192,831
179,778
Other Property & Services
85,524
64,500
1,928,134
1,911,681
There were no changes during the year to the amount of the fees or charges detailed in the original budget.

ANNUAL REPORT 2015 / 2016
Page 100 of 108
Note 24
24. GRANT REVENUE
2016
2015
$
$
By Nature and Type:
Grants and Subsidies - operating 1,143,498
2,869,161
Grants and Subsidies - non-operating 3,598,932
5,106,974
4,742,430
7,976,136
By Program:
General Purpose Funding 757,735
2,427,434
Law, Order, Public Sector 79,722
638,565
Health
0
455
Education and Welfare 0
10,000
Community Amenities
20,000
1,062,051
Recreation and Culture 297,500
552,743
Transport
3,565,355
3,284,888
Economic Services
22,118
0
4,742,430
7,976,136
Note 25
2016 2016 2015
25. COUNCILLORS’ REMUNERATION
$ Budget $
$
The following fees, expenses and allowances were
paid to council members and/or the president.
Councillor Meeting Fees
126,056 127,720 127,720
President Meeting Fees
24,384 24,720 16,018
President Allowance
11,837 12,000 8,003
Deputy President Allowance
2,959 3,000 3,000
Travelling Expenses
18,325 25,000 26,262
Technology Allowance
9,003 9,000 6,455
Telecommunications Allowance
4,327 4,500 4,250
196,892 205,940 191,708
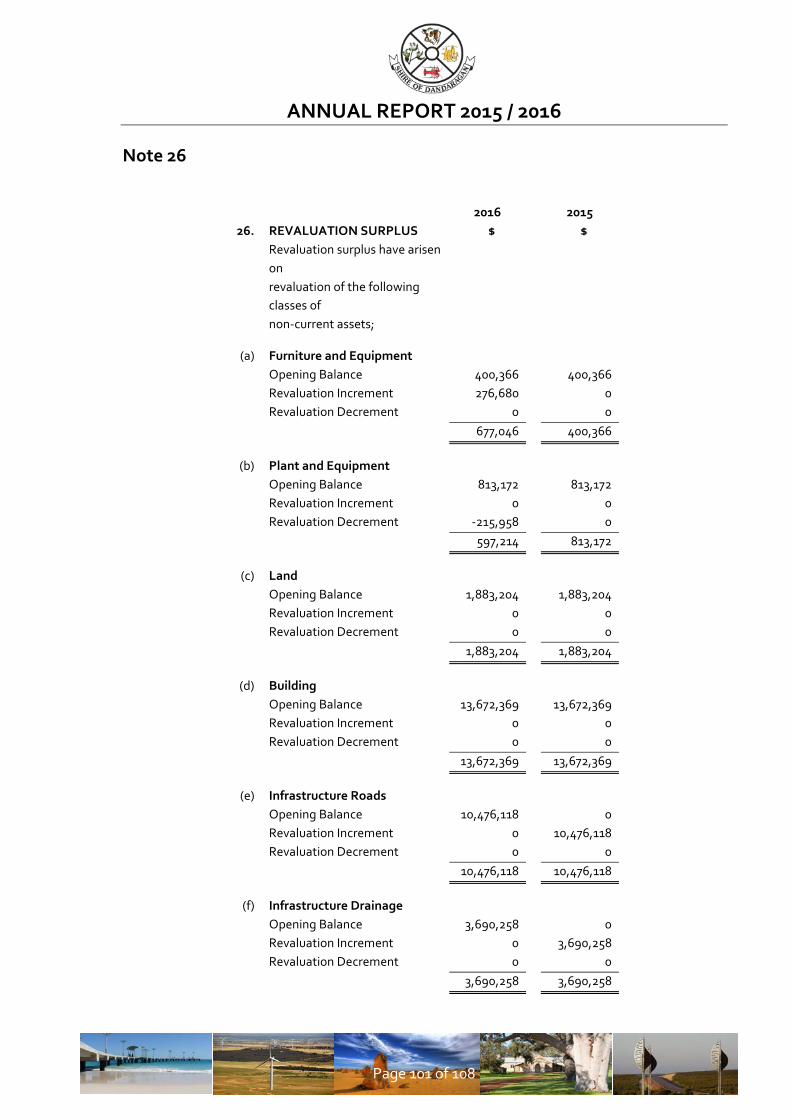
ANNUAL REPORT 2015 / 2016
Page 101 of 108
Note 26
2016
2015
26. REVALUATION SURPLUS $
$
Revaluation surplus have arisen on
revaluation of the following classes of
non-current assets;
(a) Furniture and Equipment
Opening Balance 400,366
400,366
Revaluation Increment 276,680
0
Revaluation Decrement 0
0
677,046
400,366
(b) Plant and Equipment
Opening Balance 813,172
813,172
Revaluation Increment 0
0
Revaluation Decrement -215,958
0
597,214
813,172
(c) Land
Opening Balance 1,883,204
1,883,204
Revaluation Increment 0
0
Revaluation Decrement 0
0
1,883,204
1,883,204
(d) Building
Opening Balance 13,672,369
13,672,369
Revaluation Increment 0
0
Revaluation Decrement 0
0
13,672,369
13,672,369
(e) Infrastructure Roads
Opening Balance 10,476,118
0
Revaluation Increment 0
10,476,118
Revaluation Decrement 0
0
10,476,118
10,476,118
(f) Infrastructure Drainage
Opening Balance 3,690,258
0
Revaluation Increment 0
3,690,258
Revaluation Decrement 0
0
3,690,258
3,690,258

ANNUAL REPORT 2015 / 2016
Page 102 of 108
Note 26 (cont)
(g) Infrastructure Footpaths
Opening Balance 3,862,146
0
Revaluation Increment 0
3,862,146
Revaluation Decrement 0
0
3,862,146
3,862,146
(h) Infrastructure Other
Opening Balance 7,193,984
0
Revaluation Increment 0
7,193,984
Revaluation Decrement 0
0
7,193,984
7,193,984
TOTAL ASSET REVALUATION SURPLUS 42,052,339
41,991,617
Note 27
27. EMPLOYEE NUMBERS
2016
2015
The number of full-time equivalent
employees at balance date
48
47
Note 28
28. TRADING UNDERTAKINGS AND MAJOR TRADING UNDERTAKINGS
Council did not participate in any trading undertakings
or major trading undertakings during 2015 / 2016

ANNUAL REPORT 2015 / 2016
Page 103 of 108
Note 29 29. FINANCIAL RISK MANAGEMENT
Carrying Value
Fair Value
2016
2015
2016
2015
$
$
$
$
Financial Assets
Cash and cash equivalents 8,843,273
13,612,925
8,843,273
13,612,925
Receivables 790,583
1,474,605
790,583
1,474,605
9,633,856
14,396,319
9,633,856
14,396,319
Financial Liabilities
Payables
581,213
1,002,406
581,213
1,002,406
Borrowings 738,223
907,318
738,223
907,318
1,319,436
1,476,110
1,319,436
1,371,851
Council’s activities expose it to a variety of financial risks including price risk, credit risk, liquidity risk and interest rate risk. The Council’s overall risk management focuses on the unpredictability of financial markets and seeks to minimise potential adverse effects on the financial performance of the Council. Council does not engage in transactions expressed in foreign currencies and is therefore not subject to foreign currency risk. Financial risk management is carried out by the finance area under policies approved by the Council. The Council held the following financial instruments at balance date:
Fair value is determined as follows: • Cash and Cash Equivalents, Receivables, Payables – estimated to the carrying value which approximates net market value. • Borrowings, Held-to-Maturity Investments – estimated future cash flows discounted by the current market interest rates applicable to assets and liabilities with similar risk profiles. • Financial Assets at Fair Value through profit and loss, Available for Sale Financial Assets – based on quoted market prices at the reporting date or independent valuation.

ANNUAL REPORT 2015 / 2016
Page 104 of 108
Note 29 (cont)
29. FINANCIAL RISK MANAGEMENT (Continued) (a) Cash and Cash Equivalents
30-Jun-16
30-Jun-15
$
$
Impact of a 1% (+) movement in interest rates on cash
and investments:
- Equity
88,433
136,129
- Income Statement
88,433
136,129
Council’s objective is to maximise its return on cash and investments whilst maintaining an adequate level of liquidity and preserving capital. The finance area manages the cash and investments portfolio with the assistance of independent advisers (where applicable). Council has an investment policy and the policy is subject to review by Council. The major risk associated with investments is price risk – the risk that the capital value of investments may fluctuate due to changes in market prices, whether these changes are caused by factors specific to individual financial instruments of their issuers or factors affecting similar instruments traded in a market. Cash and investments are also subject to interest rate risk – the risk that movements in interest rates could affect returns. Another risk associated with cash and investments is credit risk – the risk that a contracting entity will not complete its obligations under a financial instrument resulting in a financial loss to Council. Council manages these risks by diversifying its portfolio and only purchasing investments with high credit ratings or capital guarantees. Council also seeks advice from independent advisers (where applicable) before placing any cash and investments.

ANNUAL REPORT 2015 / 2016
Page 105 of 108
Note 29 (cont)
29. FINANCIAL RISK MANAGEMENT (Continued) (b) Receivables
30-Jun-16
30-Jun-15
Percentage of Rates and Annual Charges
- Current
0.14%
0.00%
- Overdue
99.86%
100.00%
Percentage of Other Receivables
- Current
72.80%
99.25%
- Overdue
27.20%
0.75%
Council’s major receivables comprise rates and annual charges and user charges and fees. The major risk associated with these receivables is credit risk – the risk that the debts may not be repaid. Council manages this risk by monitoring outstanding debt and employing debt recovery policies. It also encourages ratepayers to pay rates by the due date through incentives. Credit risk on rates and annual charges is minimised by the ability of Council to recover these debts as a secured charge over the land – that is, the land can be sold to recover the debt. Council is also able to charge interest on overdue rates and annual charges at higher than market rates, which further encourages payment. The level of outstanding receivables is reported to Council monthly and benchmarks are set and monitored for acceptable collection performance. The profile of the Council’s credit risk at balance date was:

ANNUAL REPORT 2015 / 2016
Page 106 of 108
Note 29 (cont)
29.F
INAN
CIAL
RIS
K M
ANAG
EMEN
T (C
ontin
ued)
(c)
Borr
owin
gs
The
follo
win
g ta
bles
set o
ut th
e ca
rryi
ng a
mou
nt, b
y m
atur
ity, o
f the
fina
ncia
l ins
trum
ents
exp
osed
to in
tere
st ra
te ri
sk:
Wei
ghte
dAv
erag
eEf
fect
ive
<1 y
ear
>1<2
yea
rs>2
<3 y
ears
>3<4
yea
rs>4
<5 y
ears
>5 y
ears
Tota
lIn
tere
st R
ate
$$
$$
$$
$%
Year
End
ed 3
0 Ju
ne 2
016
Borr
owin
gs
Fixe
d Ra
teDe
bent
ures
110,
346
11,9
3558
,279
27,1
7653
0,48
673
8,22
25.
43%
Wei
ghte
d Av
erag
e E
ffect
ive
Inte
rest
Rat
e5.
26%
5.96
%7.
20%
2.68
%5.
40%
Aver
age
Effe
ctiv
e<1
yea
r>1
<2 y
ears
>2<3
yea
rs>3
<4 y
ears
>4<5
yea
rs>5
yea
rsTo
tal
Inte
rest
Rat
e$
$$
$$
$$
%Ye
ar E
nded
30
June
201
5
Borr
owin
gs
Fixe
d Ra
teDe
bent
ures
14,2
6121
5,11
016
,232
72,4
1563
3,56
195
1,57
95.
42%
Wei
ghte
d Av
erag
e E
ffect
ive
Inte
rest
Rat
e5.
14%
5.26
%5.
96%
7.20
%5.
27%
Borr
owin
gs a
re a
lso
subj
ect t
o in
tere
st ra
te ri
sk –
the
risk
that
mov
emen
ts in
inte
rest
rate
s co
uld
adve
rsel
y af
fect
fund
ing
cost
s.
Cou
ncil
man
ages
this
risk
by
borr
owin
g lo
ng te
rm a
nd fi
the
inte
rest
rate
to th
e si
tuat
ion
cons
ider
ed th
e m
ost a
dvan
tage
ous
at
the
time
of n
egot
iatio
n.
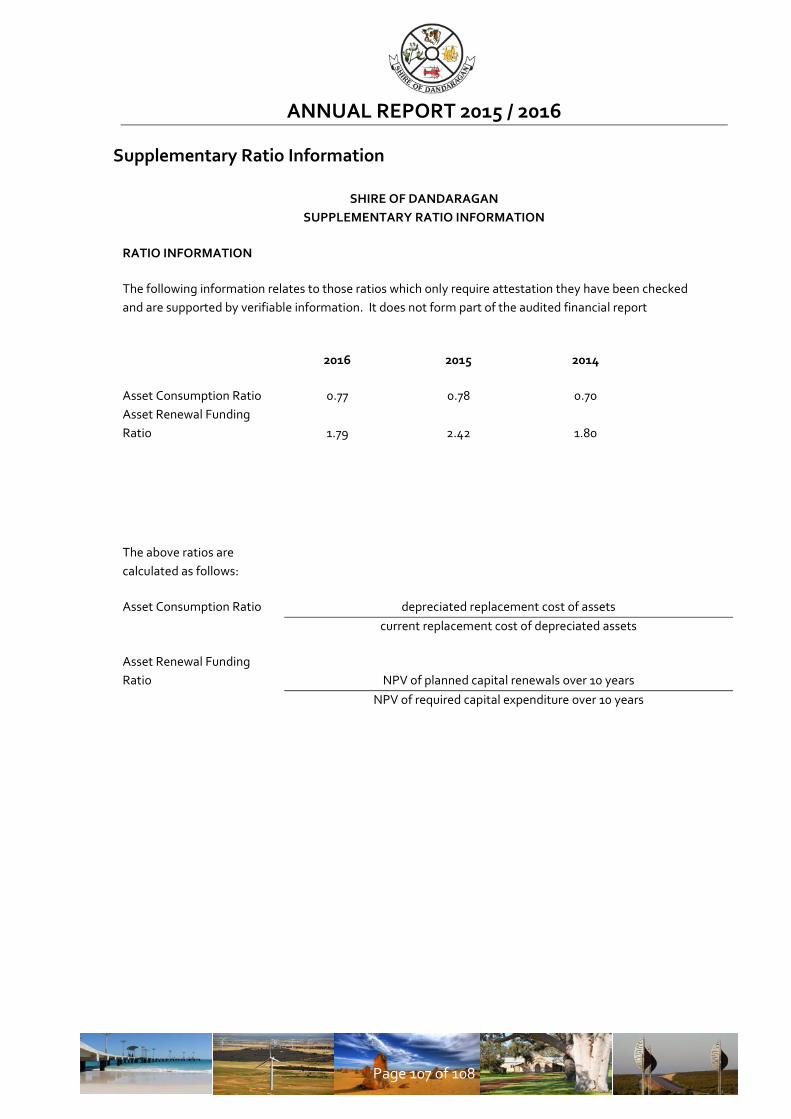
ANNUAL REPORT 2015 / 2016
Page 107 of 108
Supplementary Ratio Information
SHIRE OF DANDARAGAN SUPPLEMENTARY RATIO INFORMATION
RATIO INFORMATION
The following information relates to those ratios which only require attestation they have been checked and are supported by verifiable information. It does not form part of the audited financial report
2016
2015
2014
Asset Consumption Ratio 0.77
0.78
0.70 Asset Renewal Funding
Ratio 1.79
2.42
1.80
The above ratios are calculated as follows:
Asset Consumption Ratio depreciated replacement cost of assets
current replacement cost of depreciated assets
Asset Renewal Funding Ratio NPV of planned capital renewals over 10 years
NPV of required capital expenditure over 10 years


