
Annual Report 2015
1
NB

Annual Report 2015
2
NB
AT A GLANCE
Growth returns
Up 9% year-on-
year
Profit of €2.6m,
representing a truer
picture of the
Group’s financial
health with the
change to IFRS
Attractive industry
backdrop: By 2019
global digital
advertising spend
>50% of overall
media spend
Bolt-on acquisitions
filling in existing
white spots in the
Netherlands and
Spain
New strategic
partnership with US
based PM Digital
Closure of
landmark €20.7m
financing, with
€10m earmarked
for growth plans
Profitability up
EBITDA margin of
14.8% versus
12.8% in 2014
Prestigious Client
wins with the likes
Euromaster, Estée
Lauder and Dubai
Parks & Resorts
500 Employees
22 Offices Worldwide
Listed on the Paris
Stock Exchange
Record breaking
results
€37.2m in GM
€5.5m in EBITDA

Annual Report 2015
3
NB
FINANCIAL SUMMARY
Gross Margin
€37.2m
EBITDA
€5.5m
Gross margin was up 9.1% in 2015, coming in at €37.2m versus €34.1m in 2014. Growth was particularly strong in Germany, the UK and Spain on a geographical basis, whilst PPC, Media and Social Media performed well on a channel basis.
Group EBITDA hit a new high in 2015, with €5.5m being recorded versus €4.4m in 2014. EBITDA margins also improved hitting 14.8%, up from 12.8% in the previous year.
EBIT
€4.3m
Net Profit
€2.6m
Operating profit under IFRS shows the real economic value created by the Group, with goodwill on historic acquisitions being subject to an annual impairment test, rather than being depreciated annually on a straight-line basis.
Net Profit also showed the effect of the change to IFRS with lower depreciation and amortisation. 2015 is not comparable with 2014, however, as a change in Group financial policy on the capitalising of tax losses carried forward meant the tax charge for the year was not offset like in 2014
Contribution to 2015 GM by Geography % EBITDA Margin by Country %
The DACH region became the largest contributor geographically in 2015, increasing it’s share from 27% to 32%, with France falling from 31% to 24% and the UK increasing to 12%
Group EBITDA margins hit 14.8% all-in, with the UK and the Middle East in particular showing healthy improvement in EBITDA margins.
33,8 34,1 37,2
2013 2014 2015
2,5
4,4 5,5
2013 2014 2015
1,3
4,1 4,3
2013 2014 2015
-0,6
2,7 2,6
2013 2014 2015
France
UK
DACH
Northern Europe
Southern Euorpe
Middle East France
UK
DACH
Northern Europe
Southern Europe
Middle East
9%
22% 20%
-0,3%
29%
21%
France
UK
DACH
Northern Europe
Southern Europe
Middle East
Annual Report 2015
4
NB
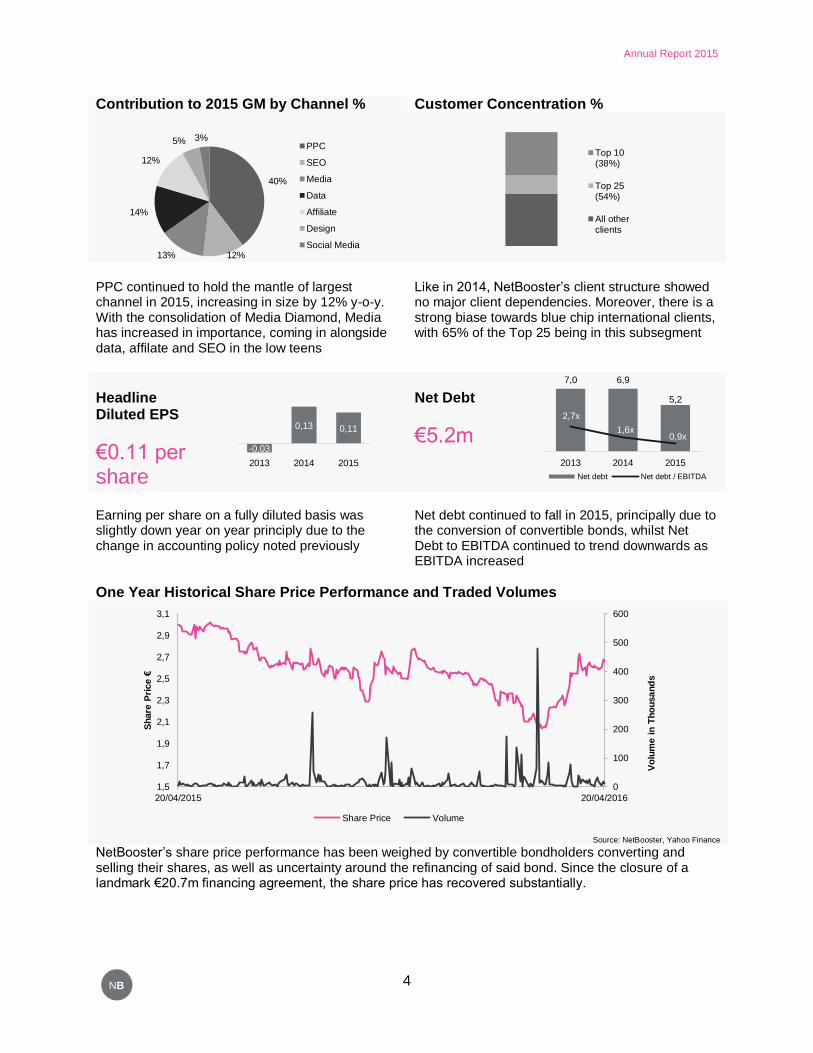
Contribution to 2015 GM by Channel % Customer Concentration %
PPC continued to hold the mantle of largest channel in 2015, increasing in size by 12% y-o-y. With the consolidation of Media Diamond, Media has increased in importance, coming in alongside data, affilate and SEO in the low teens
Like in 2014, NetBooster’s client structure showed no major client dependencies. Moreover, there is a strong biase towards blue chip international clients, with 65% of the Top 25 being in this subsegment
Headline Diluted EPS
€0.11 per share
Net Debt
€5.2m
Earning per share on a fully diluted basis was slightly down year on year principly due to the change in accounting policy noted previously
Net debt continued to fall in 2015, principally due to the conversion of convertible bonds, whilst Net Debt to EBITDA continued to trend downwards as EBITDA increased
One Year Historical Share Price Performance and Traded Volumes
Source: NetBooster, Yahoo Finance
NetBooster’s share price performance has been weighed by convertible bondholders converting and selling their shares, as well as uncertainty around the refinancing of said bond. Since the closure of a landmark €20.7m financing agreement, the share price has recovered substantially.
40%
12% 13%
14%
12%
5% 3% PPC
SEO
Media
Data
Affiliate
Design
Social Media
Top 10(38%)
Top 25(54%)
All otherclients
-0,03
0,13 0,11
2013 2014 2015
7,0 6,9
5,2
2,7x
1,6x 0,9x
2013 2014 2015
Net debt Net debt / EBITDA
0
100
200
300
400
500
600
1,5
1,7
1,9
2,1
2,3
2,5
2,7
2,9
3,1
20/04/2015 20/04/2016
Vo
lum
e i
n T
ho
usa
nd
s
Sh
are
Pri
ce €
Share Price Volume

Annual Report 2015
5
NB
BOARD OF DIRECTORS & MANAGEMENT
Bernard-Louis Roques
Non-Executive Board Member
Chairman of the Board
Bernard-Louis is a pioneer in the
IT venture capital industry in
France
Benjamin Faes
Non-Executive Board Member
Board of Directors
Benjamin Faes is currently the
Managing Director of Customer
Solutions and Innovations at
Google for Northern and Central
Europe
Andreas Von Habsburg
Non-Executive Board Member
Board of Directors
Andreas has extensive transaction
experience in Europe M&A and
privitizations in a wide variety of
industries
Tim Ringel CEO (July 2013)
Board of Directors
Tim founded the metapeople
group in 1999, which became
part of NetBooster in 2011
Tom Armbruster
COO (July 2013)
Executive Committee
In 2010, Tom joined the
metapeople group from UBS
Vincent Added
CFO (June 2011)
Executive Committee
Vincent joined the group in 2010
from Deloitte
Natalie Dusey
General Secretary (2013)
Executive Committee
Natalie has 10 years+ of
Corporate Affairs experience
with International companies
Cian O’Connor
Corporate Finance (2015)
Executive Committee
Cian is Head of Corporate
Finance and Controlling, he has
over 15 years of corporate
finance experience
Emmanuel Arendarczyk
Country Manager UK (2006)
Strategic Committee
Emmanuel joined from Google,
during his time at NetBooster he
has worked in numerous positions
within the group
Kristoffer Ewald Head of DNA (2007)
Strategic Committee
Kris merged his business with
NetBooster in 2007 and became
the data specialist
Julius Ewig
Country Manager, DE (2013)
Strategic Committee
Julius Ewig has been the
Country Manager of metapeople
Duisburg since 2013
Jens Nielsen
Head of Nordics (2009)
Strategic Committee
Jens has 25 years of
international management and
consulting experience

Annual Report 2015
6
NB
LETTER TO THE SHAREHOLDERS
Dear Shareholder,
I am delighted to announce to you, our shareholders, that 2015 was the best ever year in
NetBooster’s history both from a business and financial perspective. 2015 saw the Group
capitalise on the restructuring work undertaken in the prior two years, where the management
team refocussed the business on large and profitable accounts and aligned the Group in terms
of strategic objectives, financial goals and product offering. If 2013 and 2014 were years of
internal reorganisation and consolidation, 2015 was the year where growth returned and M&A
activity resumed in earnest.
Why do we focus on Gross Margin?
NetBooster’s business splits into either service driven business based on a management fee
and percentage of advertising spend (i.e. PPC, Media, Affiliate, Social Media), or project driven
business based on man hours (i.e. SEO, Design, Data). As a result of the first type of business,
our revenue numbers are inflated with publisher costs (i.e. google, facebook, etc.) that are
passed through our P&L in revenue and removed in the cost of sales line. Also, clients can
choose to pay these costs directly, so our revenue line can fluctuate substantially from year to
year purely as a result of this. Hence, we see Gross Margin (GM) as the main metric to evaluate
our top line performance, as these are the fees that we earn for the work we do.
How did we do on our top line – Gross Margin?
NetBooster posted a record breaking Gross Margin of €37.2m in 2015, up 9% year-on-year.
PPC and SEO accounted for 52% of the top line, with PPC (including Social Ads) continuing to
post strong gains, producing €14.8m in GM versus €13.2m in the prior year, a year on year
increase of over 12%. SEO was reasonably stable in 2015, coming in at €4.5m, slightly lower
than 2015 on account of the cyclicality of the business. The expectation is that it will recover in
2016.
13,2
4,8 3,3
5,6 4,3
2,6 0,8
14,8
4,5 5,0 5,3 4,6
1,9 1,1
P P C S E O M E D I A D A T A A F F I L I A T E D E S I G N S O C I A L M E D I A
2014 2015

Annual Report 2015
7
NB
The other big contributors came in the form of Media, Data and Affiliate, accounting for 40% of
the overall business and registering a combined growth rate of 14%. The big driver of this came
through Media, with the acquisition of Media Diamond, producing record growth of 51% and
hitting €5.0m in GM in 2015. Data also produced strong results with the business adding €5.3m
to Group GM versus €5.6m in the previous year. Data continues to permeate all aspects of the
Group’s activities, so it’s standalone consulting fees do not do its full contribution true justice.
Design and Social Media are the final two activities, which together account for 8% of the
Group’s GM. Social Media, which under our definition comprises community management, but
excludes social advertising, saw its contribution grow by 42% in 2015. The expectation is that
this business, together with Social Ads, will form a cornerstone business unit going forward.
Geographically the DACH region powered ahead in 2015, increasing GM from €9.2m in the
prior year to €11.8m in 2015 and claiming the mantle of the largest market. The German
business was driven by increased share of client wallet from the likes of Deutsche Telekom and
Deichmann in particular. French GM came down somewhat, with clients such as Bouygues
Telecom tempering budgets in light of headwinds in the local market. However, the instatement
of a new management team locally is expected to yield benefits in repositioning the French
business for future growth, both organically with existing clients such as Accor and Estée
Lauder, but also with new potential customers.
The UK saw exceptional levels of growth registered in 2015, with the top line jumping by over
30% to €4.4m, owing principally to strong expansion in PPC and the on-boarding of new Group
clients such as Groupe SEB. Local issues in Finland and Sweden saw Northern European GM
fall in 2015 to €7.0m, but a rebound is expected to set in from 2016 onwards, as the Nordic
markets deepen their product offering and align more with the Group. Southern Europe saw a
substantial increase in their top line with the addition of Media Diamond, with GM moving from
€2.5m in 2014 to €3.2m. Likewise our Dubai based business more than doubled its GM to hit
the €2m mark and thereby become a more significant component of the Group’s top line.
10,7
3,3
9,2
7,8
2,5
0,9
8,9
4,4
11,8
7,0
3,2
2,0
F R A N C E U K D A C H N O R T H E R N E U R O P E
S O U T H E R N E U R O P E
M I D D L E E A S T
2014 2015

Annual Report 2015
8
NB
What about profitability?
Yet again NetBooster set a new record on the profit front, with Group EBITDA hitting €5.5m in
2015, versus €4.4m in 2014. EBITDA margins also improved, rising to 14.8%, up from 12.8% in
the previous year. EBITDA largely reflected the development on the top line with the DACH
countries hitting €2.4m in EBITDA and their margins increasing to 20%, up a full percentage
point on the previous year.
Despite a decline on the top line in France, the management team still posted a higher EBITDA
with adjustments on the cost front keeping margins in check. The UK’s healthy top line growth
translated into a very favourable level of EBITDA with the British entity hitting the €1m mark and
increasing margins from 11% in the prior year to a record setting 22%. Northern Europe’s
EBITDA felt the full impact of the lower top line, with adjustments to the operating model
expected to feed through to a gradual recovery in profitability in the coming year. Southern
Europe continued to produce high EBITDA margins, coming in at 29% and growing on a
nominal basis to almost €1m. Finally, the Middle East matched its strong growth with delivery on
the bottom line, posting 21% EBITDA margins and contributing positively to group results.
The impact of the move to IFRS is most keenly seen in the net profit line, with goodwill on
historic acquisitions being subject to an annual impairment test, rather than being depreciated
annually on a straight-line basis. As a result, Net Profit better reflects the real operational
performance of the business, with profit levels in 2015 staying stable at €2.6m. 2015 is not,
however, comparable with 2014, as a change in Group financial policy on the capitalising of tax
losses carried forward meant the tax charge for the year was not offset by capitalised tax losses
positively impacting the P&L like in 2014.
What do we see happening out there?
NetBooster sees numerous trends from an operational perspective: (1) A convergence of
channels and focus on pure performance, (2) A realisation amongst our client base that
branding can also be performance driven, (3) A pent up demand amongst multinational
companies for a full service provider capable of delivering across product and geography, (4)
the emergence of facebook as a credible addition to Google, (5) Data is driving transparency
and (6) TV is going digital and digital marketing with it.
0,6
0,4
1,7
0,9
0,8
0,0
0,8 1,0
2,4
0,0
0,9
0,4
F R A N C E U K D A C H N O R T H E R N E U R O P E
S O U T H E R N E U R O P E
M I D D L E E A S T
EBITDA 2014 EBITDA 2015

Annual Report 2015
9
NB
(1) A convergence of channels and focus on pure performance:
Clients continue to focus on their overall marketing spend and how that translates into revenue
for their own business. Deutsche Telekom is a good case in point, with all channels now merged
into a client centric model ensuring seamless budget allocation on a daily basis to the highest
performing channel for the client. Through data analytics and performance analysis NetBooster
can help Deutsche Telekom to select the most appropriate strategy on the back of real time
data and implement it on their behalf as well. Our message is clear: NetBooster will adopt the
model most appropriate to the client’s needs, thereby achieving the highest level of performance.
(2) A realisation amongst our client base that branding can also be performance driven:
We all learned in business school, that marketing is a funnel, going from
awareness / branding through interest, consideration, intent and evaluation.
Previously performance marketing was believed to be only applicable at the
latter end of the funnel, with clients focussing on the likes of pay per click
campaigns to ensure they got share of client face time before their purchase
decision was made. Today, however, there is a growing realisation that the same performance
attributes and metrics can be used at the awareness stage, ensuring that clients can follow their
overall spend through the funnel and evaluate the performance of it in turning it into product
sales. Our message is clear: Branding is now part of performance marketing and we intend to
tap into it.
(3) A pent up demand amongst multinational companies for a full service provider capable
of delivering across product and geography
Our strategic rapprochement with PM Digital has really opened our eyes to the enormous
untapped potential that exists amongst multinational and global companies in particular for a full
service performance marketing agency, that can deliver across channel and geography. Not
only do clients want an integrated global platform to deliver their marketing spend, they also
have a distinct need to assess that spend using the same metrics across geography and cannot
do so with a patchwork of agencies using differing approaches. Our message is clear: We
intend to satisfy this pent-up demand.
(4) The emergence of facebook as a credible addition to Google
Facebook continues to broaden its appeal, with a performance offering that allows the client to
target their audience with messages tailored to their potential customer’s specific
interests in a timely and insightful way. The delivery of advertising on facebook can be
customized for use throughout the customer journey, from discovery/awareness
through to purchase, which differentiates it somewhat from google. Moreover, with the
advent of Facebook Messenger based advertising, a real-time one-on-one conversation can be
had between our client and their potential customer. Our message is clear: facebook represents
a clear growth channel and one we intend to ramp up aggressively.
(5) Data is driving transparency
The Big 6 media network’s business models are based on ambiguous deals with publishers,
known in the industry as kickbacks or volume discounts. Advertisers are increasingly
challenging this due to an increase in transparent trading platforms and the digitalisation of the
advertiser and their ultimate consumers. Additionally, they also have a considerable self interest

Annual Report 2015
10
NB
in getting more from their marketing budgets, rather than seeing an estimated 30% of it go on
backroom deals. NetBooster operates in a transparent way. Our message is clear: We believe
that the Big 6 will suffer as transparency increases and their business model comes under
pressure from reduced top line fees on the back of the digitalisation of advertising.
(6) TV is going digital and digital marketing with it
As a result of the offering of Netflix, Hulu, iTunes, Amazon Prime and other
streaming services, TV consumption is changing and moving into the digital space.
Therefore, TV will become a digital performance channel, fully measurable and
targeted to specific audiences and consumers. Our message is clear: We see this as an
enormous opportunity for NetBooster and are gearing up to take full advantage of it.
The building blocks for growth being put in place
The NetBooster that exists today is a much more structurally coherent and collaborative entity,
than that which existed a number of years back. A real focus has been on professionalising,
integrating and creating a common culture out of the assortment of entities that sat under the
NetBooster umbrella. Management has also spent the time and resources to provide our
investors with market standard financial information with the introduction of IFRS, purge legacy
issues such as the group’s convertible bond through a refinancing, but also secure inorganic
growth through M&A and partnership deals.
IFRS
The switch to IFRS provides you, our investors, and other users of our financial statements with
the ability to compare the financial performance of NetBooster on a like-for-like basis with its
international peers and provide more transparency to investors on the Group’s performance. It
represents yet another step in making NetBooster’s Investor Relations best in class, providing
the investment community with the type of information that can inform their decisions on an
investment in the group. We believe it offers us the platform to attract a broader brush of
investors to support our future growth story and create the conditions for all investors to prosper.
Refinancing
In March, 2016, NetBooster announced the closing of a landmark €20.7m financing agreement,
which sent a clear message of our intent to the financial markets. The new senior secured
facility consists of a €10.7m tranche that was used to reimburse the convertible bond that came
due on the 23rd of March, 2016 and smaller outstanding loans, as well as a €10m tranche that
is dedicated to finance our envisaged growth plans.
The new arrangements offer NetBooster considerable flexibility, with 50% of the transaction
coming in the form of a bullet type euro private placement maturing in 2022 and 50% in the form
of a traditional amortising loan with a term of 5 years and 9 months. Credit du Nord was
appointed Lead Arranger on the transaction and jointly structured it with Tikehau Investment
Management’s NOVI I fund. Two other large European banks, BNP Paribas and Société
Générale and a global player, HSBC, made up the rest of the pool.

Annual Report 2015
11
NB
The financing round represented the culmination of many years of hard work, solidifies
NetBooster’s balance sheet with an attractive, long term financing structure, whilst also prefunds
our ambitious growth plans to evolve into a global digital media agency.
M&A and Partnership deals
In April, 2015 the Group exercised its call option to acquire a further 40% stake
in Media Diamond, bringing its overall ownership in the business to 50% and
giving it effective control over the entity with a majority position on the board.
The acquisition of Media Diamond represents another step in our ambition to serve our global
clients in all markets, with the Spanish business in particular able to service the Iberian
Peninsula, but also the lucrative South American market.
In September, 2015 the Group announced the acquisition of Internet Advantage
based in Utrecht, Netherlands. The acquisition further enhanced NetBooster’s reach
by adding the Dutch market to the Group’s European offering and fills in a white spot
that existed previously. Internet Advantage’s management, employees and services
fitted perfectly into our vision of growing in size and knowhow with entrepreneurially managed
companies. Moreover, as indicated earlier, our top clients are keen to expand into more regions
with us and with this transaction we are answering that demand by cherry-picking the best local
players with highly involved entrepreneurs and integrating them onto our platform.
In February, 2016 NetBooster announced a new strategic partnership deal with
PM Digital of the U.S., thereby forming one of the biggest independent
performance agency networks in the world, culminating in a combined
international presence with NetBooster of over 25 offices, 800 employees, 250 leading Brands
and managed media spend of over $500m annually. Together, we will be in a position to offer
our clients unprecedented expertise in PPC, SEO, CRM, Programmatic, Affiliate, Media, Social
Media, UX/CRO and all that supported by a strong Data, Analytics and Creative offering on a
global basis.
With PM Digital’s deep roots in direct and integrated marketing, coupled with their exceptional
channel intelligence, this partnership will give us and our clients a significant competitive
advantage.
Conclusion
NetBooster has posted landmark results in 2015 for the second year in a row, a product of the
combined efforts of all our committed, creative and hard-working colleagues. I’m proud of what
NetBooster has achieved, but believe our most exciting years lie ahead of us. The platform we
have built over the last three years has now put us in a position to evolve from being a Europe
focused international player into a global digital media performance agency. Ours is a business
with a growing client base, loyal employees and a strong pedigree for innovation.
Our industry is shifting in our favour from traditional media to digital. Our blue chip clients are
eager to work with the exceptional talent that we can put at their disposal. They come to us
because we’re transparent, efficient and client centric and can deliver the service that they want.
That’s what defines us and makes us stand out from the traditional media agencies and will fuel
our growth story going forward.

Annual Report 2015
12
NB
OUR GLOBAL FOOTPRINT

Annual Report 2015
13
NB
COMPANY HISTORY

Consolidated Financial Statements | December 31, 2015
14 NB
PRODUCT DESCRIPTION
Product Description Business Area
PPC | stands for pay per click: NetBooster creates and manages Pay-Per-Click campaigns on all the major search engines (Google, Yahoo, Bing, etc.) and social networks (Facebook, etc.). NetBooster’s PPC campaigns offer keyword mining and copywriting, scientific optimization tracking, reporting account management, landing page optimization, and international/multilingual campaigns.
PPC
SEO | stands for search engine optimisation: NetBooster uses SEO to achieve the best possible coverage for the customer’s website on major search engines (Google, Bing, and Yahoo). NetBooster is a Google enterprise partner. The SEO service focuses on: Content Management System (CMS) Optimisation, SEO Process, Link Management and Generation, Monitoring and Reporting, Keyword Research, Multilingual SEO, Search Engine Listing Continuity.
SEO
Data & Analytics: NetBooster offers a selection of analytics tools allowing for tracking and measurement of demographics, campaign visitor behaviour, channel effectiveness, cost of new customer acquisition, ROI, etc.
Data
DMP: NetBooster launched “Groundcontrol” by NetBooster, its own data management platform (DMP) in 2014.
Data
CRM strategy (consultancy): NetBooster helps customers with every aspect of their CRM strategy, including choosing the right campaign management platform, defining CRM strategy, operational setting up an animation plan, and providing integration with information systems.
Data
Media | Programmatic buying allows brands to optimize their campaigns by purchasing them in auctions according to pre-defined criteria, thus enabling them to buy a qualified audience.
Media
Affiliate network: NetBooster Affiliate is an independent affiliate network that provides hands on account management of client’s affiliate program deliver expert technical insights and solutions
Affiliate
Affiliate marketing: Affiliate marketing is a type of performance-based marketing in which a business rewards one or more affiliates for each visitor or customer brought by the affiliate's own marketing efforts.
Affiliate
Design Web design and art direction. Design
Social Media NetBooster helps brands to capture more fans and followers and transform them into clients by combining data from social networks with the client’s CRM.
Social Media

Consolidated Financial Statements | December 31, 2015
15 NB
INDUSTRY VIEW
Tell me about performance marketing?
Performance Marketing is a strong growing sub-segment of the digital advertising market. All
advertising activities in this sub-segment are measurable and accounted for against clear
KPIs. This enables companies to measure performance in real time and focus on Return on
Investment (ROI).
Many companies are consolidating all performance channels on an international basis with
one agency, as this allows them to amalgamate data and thereby maximize the outcomes
they are seeking in an efficient and scalable manner. Performance marketing is a
measurable digital advertising medium, with revenue generation and profit enhancement at
the heart of the offering.
Where do the big six and local players stand on performance marketing?
Coming from the offline world (TV, print, radio, billboards) the Big 6 media networks are
mainly focused on creative idea generation and their implementation (media buying). Their
clients are absorbed by the creation of brands and brand awareness, so as to generate
desire for a product by targeting as many consumers as possible. Given that awareness is
the main KPI for traditional advertising agencies, they do not focus on revenue generation
and profit enhancement for their clients – Performance isn’t in the DNA of the Big 6.
NetBooster faces local competition in several of the larger markets (France, Germany, UK).
Only a few of these very local competitors weren’t sold to the Big 6. The companies that
remain are focussed on selected countries and do not cover the majority of Europe.
Especially when it comes to large international RFP’s and pitches, the local players simply
cannot compete, as their size impedes them to deliver across different performance channels
and markets.
Competitive Industry Landscape:
Source: NetBooster Kepler Cheuvreux, RECMA

Consolidated Financial Statements | December 31, 2015
16 NB
The shift to digital: Redefining business models
The above quote isn’t from NetBooster, but from McKinsey & Company’s Global Media
Report 2015. They go on to re-inforce our view of the market stating that “As digital media
gain ground, advertisers are increasingly accepting the validity and persuasiveness of
advertising on these media, moving away from the typical high cost-per-thousand (CPM)
traditional media to less expensive, low CPM internet and mobile advertising – further
accelerating the shift of analogue dollars to digital.”
Focusing in on some of NetBooster’s larger markets, it is clear that there is sizeable growth
potential in our home markets, with the global picture shown overleaf, being even more
attractive.
Total Media Advertising Spend – Key European Markets
UK (GBP, bn) 2014 2015 2016 2017 2018 2019 CAGR
Digital 7.2 8.1 8.9 9.7 10.6 11.3 9.5%
TV 3.9 4.1 4.3 4.3 4.4 4.4 2.3%
Print 2.8 2.7 2.6 2.5 2.5 2.5 -2.5%
Outdoor 1.0 1.1 1.1 1.1 1.1 1.1 2.3%
Radio 0.3 0.4 0.4 0.4 0.4 0.4 0.9%
TOTAL 15.3 16.3 17.2 18.1 18.9 19.7 5.2%
France ($, bn) 2014 2015 2016 2017 2018 2019 CAGR
Digital 3.0 3.2 3.4 3.6 3.8 3.9 5.2%
TV 4.3 4.3 4.3 4.4 4.4 4.5 0.8%
Print 3.6 3.3 3.2 3.1 3.0 2.9 -3.8%
Outdoor 1.7 1.7 1.7 1.7 1.7 1.8 1.1%
Radio 1.0 1.0 1.0 0.9 0.9 0.9 -0.4%
TOTAL 13.5 13.5 13.6 13.7 13.9 14.0 0.7%
Germany ($, bn) 2014 2015 2016 2017 2018 2019 CAGR
Digital 6.3 6.6 7.0 7.3 7.6 7.9 4.8%
TV 5.7 5.9 6.0 6.2 6.2 6.3 2.1%
Print 9.3 9.0 8.7 8.5 8.3 8.2 -2.4%
Outdoor 1.3 1.4 1.4 1.5 1.5 1.5 2.1%
Radio 1.0 1.0 1.0 1.0 1.0 1.0 -0.2%
TOTAL 23.5 23.8 24.1 24.4 24.6 24.9 1.1%
Source: NetBooster, eMarketer
“Spending on media continues to shift from traditional to digital products and services at a rapid pace. By 2019, we believe digital spending will account for more than 50 percent of overall media spend”

Consolidated Financial Statements | December 31, 2015
17 NB
Global advertising by Category (US$ millions)
Global ($, bn) 2014 2015 2016 2017 2018 2019 CAGR
Digital 127.3 146.6 168.5 190.8 212.0 231.4 12.7%
TV 183.5 189.4 202.5 209.0 223.1 233.9 5.0%
Audio 31.0 31.1 31.3 31.4 31.5 31.7 0.4%
Cinema 2.1 2.2 2.4 2.6 2.8 3.1 7.5%
Out-of-Home 31.7 33.2 34.8 36.5 38.4 40.3 4.9%
Consumer Magazines 23.2 22.5 21.9 21.4 20.9 20.5 -2.4%
Newspapers 73.1 71.4 70.4 70.1 70.3 70.8 -0.6%
Video Games 3.4 4.4 4.9 5.6 6.3 6.9 15.2%
TOTAL 452.1 473.6 505.6 532.1 565.4 594.3 5.6%
Source: NetBooster, McKinsey & Company Global Media Report 2015

Consolidated Financial Statements | December 31, 2015
18 NB
Table of contents
AT A GLANCE ........................................................................................................................................ 2
FINANCIAL SUMMARY ......................................................................................................................... 3
BOARD OF DIRECTORS & MANAGEMENT ......................................................................................... 5
LETTER TO THE SHAREHOLDERS ..................................................................................................... 6
OUR GLOBAL FOOTPRINT ................................................................................................................ 12
COMPANY HISTORY .......................................................................................................................... 13
PRODUCT DESCRIPTION .................................................................................................................. 14
INDUSTRY VIEW ................................................................................................................................. 15
CONSOLIDATED BALANCE SHEET................................................................................................... 21
CONSOLIDATED INCOME STATEMENT ........................................................................................... 22
CONSOLIDATED STATEMENT OF COMPREHENSIVE INCOME ..................................................... 23
.......... 23
CONSOLIDATED STATEMENT OF CHANGES IN EQUITY ............................................................... 24
CONSOLIDATED CASH FLOW STATEMENT .................................................................................... 25
NOTE 1: GENERAL INFORMATION ON THE NETBOOSTER GROUP.......................................... 26
Note 1.1: General information ....................................................................................................... 26
Note 1.2: Major events .................................................................................................................. 26
NOTE 2: BASIS OF PREPARATION ................................................................................................ 28
Note 2.1: Statement of compliance ............................................................................................... 28
Note 2.2: First-time adoption of IFRS ............................................................................................ 29
NOTE 3: SUMMARY OF ACCOUNTING PRINCIPLES ................................................................... 30
Note 3.1: Basis of measurement ................................................................................................... 30
Note 3.2: Estimates and assumptions ........................................................................................... 30
Note 3.3: Foreign currency translation .......................................................................................... 31
Note 3.4: Consolidation ................................................................................................................. 32
Note 3.5: Business combinations and goodwill ............................................................................. 33
Note 3.6: Other intangible assets .................................................................................................. 35

Consolidated Financial Statements | December 31, 2015
19 NB
Note 3.7: Property, plant and equipment ....................................................................................... 35
Note 3.8: Impairment of non-financial assets other than goodwill ................................................. 36
Note 3.9: Financial assets ............................................................................................................. 36
Note 3.10: Derivative financial instruments ................................................................................... 38
Note 3.11: Trade receivables ........................................................................................................ 38
Note 3.12: Cash and cash equivalents .......................................................................................... 39
Note 3.13: Share capital ................................................................................................................ 39
Note 3.14: Share-based payments ................................................................................................ 39
Note 3.15: Long-term employee benefits ...................................................................................... 39
Note 3.16: Provisions .................................................................................................................... 40
Note 3.17: Borrowings ................................................................................................................... 40
Note 3.18: Convertible bonds financial instruments ...................................................................... 41
Note 3.19: Trade payables ............................................................................................................ 41
Note 3.20: Current and deferred income tax ................................................................................. 41
Note 3.21: Segment reporting ....................................................................................................... 42
Note 3.22: Recognition of revenue ................................................................................................ 42
Note 3.23: Grants .......................................................................................................................... 43
Note 3.24: Leases ......................................................................................................................... 43
Note 3.25: EBITDA ........................................................................................................................ 44
Note 3.26: Other operating income and expenses – non current .................................................. 44
Note 3.27: Dividends distribution ................................................................................................... 44
Note 3.28: Earnings per share ...................................................................................................... 44
NOTE 4: FINANCIAL RISK MANAGEMENT .................................................................................... 45
Note 4.1: Financial risk factors ...................................................................................................... 45
Note 4.2: Capital management ...................................................................................................... 46
Note 4.3: Fair value estimation ...................................................................................................... 46
NOTE 5: ADDITIONAL INFORMATION RELATED TO THE CONSOLIDATED BALANCE SHEET 48
Note 5.1: Intangible assets and Goodwill ...................................................................................... 48
Note 5.2: Property, plant and equipment ....................................................................................... 51
Note 5.3: Investments accounted for using the equity method and related derivative financial
instruments .................................................................................................................................... 52
Note 5.4: Non-current financial assets .......................................................................................... 53
Note 5.5: Financial instruments ..................................................................................................... 54
Note 5.6: Trade and other receivables .......................................................................................... 56
Note 5.7: Other assets .................................................................................................................. 57
Note 5.8: Cash and cash equivalents ............................................................................................ 58
Note 5.9: Share capital .................................................................................................................. 59
Note 5.10: Other non-current provisions ....................................................................................... 60
Note 5.11: Borrowings ................................................................................................................... 60
Note 5.12: Current and deferred income tax ................................................................................. 62
Note 5.13: Trade and other payables ............................................................................................ 64

Consolidated Financial Statements | December 31, 2015
20 NB
Note 5.14: Other liabilities ............................................................................................................. 64
NOTE 6: NOTES TO THE CONSOLIDATED STATEMENT OF INCOME ....................................... 65
Note 6.1: Segment information ...................................................................................................... 65
Note 6.2: Other income from operations ....................................................................................... 67
Note 6.3: Operating expenses ....................................................................................................... 68
Note 6.4: Share – based payments ............................................................................................... 69
Note 6.5: Depreciation and Amortization ....................................................................................... 72
Note 6.6: Other operating income and expenses .......................................................................... 73
Note 6.7: Financial income and expenses ..................................................................................... 73
Note 6.8: Earnings per share ........................................................................................................ 73
NOTE 7: RELATED PARTIES .......................................................................................................... 74
Note 7.1: Key management compensation ................................................................................... 74
Note 7.2: Media Diamond .............................................................................................................. 74
NOTE 8: UNRECOGNISED ITEMS .................................................................................................. 75
Note 8.1: Commitments issued ..................................................................................................... 75
Note 8.2: Events occurring after the reporting period .................................................................... 75
NOTE 9: SCOPE OF CONSOLIDATION .......................................................................................... 76
NOTE 10: CONVERSION TO IFRS .................................................................................................. 77
NOTE 11: AUDITOR’S FEES ........................................................................................................... 86

Consolidated Financial Statements | December 31, 2015
21 NB
CONSOLIDATED BALANCE SHEET

Consolidated Financial Statements | December 31, 2015
22 NB
CONSOLIDATED INCOME STATEMENT
In thousands of euros Note 2015 2014 2013
Revenue Note 6.1 110 803 96 568 114 086Cost of sales - (73 636) (62 486) (80 261)
Gross margin Note 6.1 37 167 34 082 33 825
Employee benefits expense Note 6.3 (24 282) (22 956) (24 733)
External expenses Note 6.3 (7 747) (6 918) (6 231)
Taxes other than taxes on income - (155) (240) (379)
Other income from operations Note 6.2 499 412 150
Other expenses from operations Note 6.3 36 (30) (102)
EBITDA Note 6.1 5 518 4 350 2 530
Depreciation and Amortization Note 6.5 (515) (417) (407)
Other operating income and expenses - non current Note 6.6 (668) 140 (849)
Operating profit (loss) - 4 335 4 073 1 274
Income from cash and cash equivalents Note 6.7 4 22 22
Cost of f inancial debt Note 6.7 (1 366) (1 403) (1 388)
Cost of net financial debt Note 6.7 (1 362) (1 381) (1 366)
Other f inancial income Note 6.7 1 670 421 1 288
Other f inancial expenses Note 6.7 (809) (825) (452)
Net financial profit (loss) Note 6.7 (501) (1 785) (530)
Share of profit of investments accounted for using the equity method Note 5.3 (8) 27 -
Profit (loss) before tax - 3 826 2 315 744
Income tax expense Note 5.12 (1 271) 379 (1 373)
Net profit (loss) for the year Note 6.1 2 555 2 694 (629)
Profit attributable to:
- Ow ners of the parent - 2 299 2 694 (629)
- Non-controlling interests - 256 - -
OCI 153 118 (14)
Comprehensive Income 2 708 2 812 (643)
Earnings per share attributable to the owners of the parent (in euro
per share):
- Basic earnings per share Note 6.8 0,15 0,17 (0,04)
- Diluted earnings per share Note 6.8 0,11 0,13 (0,03)

Consolidated Financial Statements | December 31, 2015
23 NB
CONSOLIDATED STATEMENT OF COMPREHENSIVE INCOME

Consolidated Financial Statements | December 31, 2015
24 NB
CONSOLIDATED STATEMENT OF CHANGES IN EQUITY
Thousands of € Share capitalShare
premiums
Consolidate
d reserves
Profit/loss
for the year
Translation
adjustments
Shareholder
s' equity
Position at 31/12/2012 1 461 27 676 (14 558) (3 966) - 10 613
Changes to capital (parent company)
Share capital increases 68 1 692 - - - 1 760
Costs of capital increases - (7) - - - (7)
Transfers and levies on premiums 14 (14) - - - -
Reclassification of profit/loss during the previous year - - (3 966) 3 966 - -
Consolidated profit/loss for the period - - - (629) - (629)
Changes to translation adjustments - - - - (14) (14)
Changes to treasury shares - 21 - - - 21
Value of employee services (IFRS 2) - - 74 - - 74
Convertible bonds - (99) 42 - - (57)
Business combinations - - - - - -
Liquidity program - - (20) - - (20)
Other movements - - (22) - - (22)
Position at 31/12/2013 1 543 29 269 (18 450) (629) (14) 11 719
Changes to capital (parent company)
Share capital increases 58 1 651 - - - 1 709
Costs of capital increases - - - - - -
Transfers and levies on premiums 1 (1) - - - -
Reclassification of profit/loss during the previous year - - (629) 629 - -
Other comprehensive income (total comprehensive income) - - - - - -
Consolidated profit/loss for the period - - - 2 694 - 2 694
Changes to translation adjustments - - - - 118 118
Changes to treasury shares - (411) - - - (411)
Value of employee services (IFRS 2) - - 135 - - 135
Convertible bonds - (83) 33 - - (50)
Business combinations (1) - - (700) - - (700)
Liquidity program - - 44 - - 44
Other movements - - - - - -
Position at 31/12/2014 1 602 30 424 (19 566) 2 694 104 15 258
Changes to capital (parent company)
Share capital increases 57 1 292 - - - 1 349
Costs of capital increases - - - - - -
Transfers and levies on premiums - (10 000) 10 000 - - -
Reclassification of profit/loss during the previous year - - 2 694 (2 694) - -
Other comprehensive income (total comprehensive income) - - - - - -
Consolidated profit/loss for the period - - - 2 554 - 2 554
Changes to translation adjustments - - - - 248 248
Changes to treasury shares - (1 125) - - - (1 125)
Value of employee services (IFRS 2) - - 85 - - 85
Convertible bonds - 120 42 - - 162
Business combinations - - 71 - - 71
Other movements - - 95 - (95) -
Position at 31/12/2015 1 659 20 711 (6 581) 2 555 258 18 602
Total equity attributable to owners of the parent 1 659 20 711 (6 652) 2 299 258 18 275
Total equity attributable to non-controlling interests - - 71 256 - 327
(1) Adjustment additional goodwill Guava

Consolidated Financial Statements | December 31, 2015
25 NB
CONSOLIDATED CASH FLOW STATEMENT
In thousands of euros Note 2015 2014 2013
Cash flows from/used in operating activities
Net profit (loss) for the year - 2 555 2 694 (629)
Adjustments for non-cash and non-operating items:
Depreciation and amortization - 514 302 845
Addition to (reversals of) provisions - 71 (14) 55
Share of profit of investments accounted for using the equity methodNote 5.3 8 (27) -
Net (gain) loss on disposals - (193) (389) 75
Income tax expense Note 5.12 1 271 (379) 1 373
Income tax paid - (946) (1 031) (854)
Other non-cash items (1) - (1 122) 119 (1 055)
Cost of net f inancial debt Note 6.7 1 362 1 381 1 366
Adjustments for changes in w orking capital
Change in trade and other receivables - (2 041) 1 321 3 696
Change in trade and other payables - 1 679 (4 842) (4 663)
Net cash flows from/used in operating activities - 3 158 (865) 209
Cash flows from/used in investing activities
Acquisition of subsidiary, net of cash acquired - 947 3 -
Purchases of property, plant and equipment Note 5.2 (414) (213) (649)
Purchases of intangible assets Note 5.1 (221) (343) (29)
Purchases of other non-current assets - (78) (203) (443)
Proceeds from other non-current assets - 310 703 697
Net cash flows from/used in investing activities - 544 (53) (424)
Cash flows from/used in financing activities
Proceeds from issuance of ordinary shares - (1 013) (505) 3
Proceeds from borrow ings - 940 - 320
Repayment of borrow ings - (1 186) (669) (425)
Acquisition of interest in a subsidiary - (1 120) (395) 6
Interest paid - (401) (575) (623)
Interest received - 9 37 15
Dividends paid to non-controlling interests - 65 - -
Net cash flows from/used in financing activities - (2 706) (2 107) (704)
Increase/decrease in cash and cash equivalents - 996 (3 025) (919)
Cash and cash equivalents at beginning of period Note 5.8 4 664 7 494 8 433
Translation difference on cash and cash equivalents - 179 194 (20)
Cash and cash equivalents at end of period Note 5.8 5 838 4 664 7 494
(1) fair value adjustement on the bonds for €1047 K

Consolidated Financial Statements | December 31, 2015
26 NB
NOTES TO THE CONSOLIDATED FINANCIAL STATEMENTS
NOTE 1: GENERAL INFORMATION ON THE NETBOOSTER GROUP
Note 1.1: General information
Incorporated in 1998, NetBooster SA (“the Company”) and its subsidiaries (together, “the Group”) are an
independent digital communication group that makes its comprehensive expertise of digital marketing
available to its customers to achieve the best possible performance for their investments.
The Group has 21 offices worldwide, it invests in technology and its network caters for the entire pan-
European online marketing chain: search engine optimisation, data and analytics, ground control
technology, display, affiliation, online media, creation, eCRM and social networks, with a recognised
expertise in tomorrow’s digital marketing (Social Media, Video, Ad Exchange etc.). It is certified as an
"Innovative Enterprise" by OSEO Innovation and listed on the NYSE Alternext stock exchange.
NetBooster is also eligible for FCPI hi-tech funds and SME stock savings plans.
The Company is a joint-stock company (“Société Anonyme”), incorporated and domiciled in France. The
address of its registered office is 4/6 passage Louis Philippe in Paris (75011), France.
The Company’s reporting period closes on December 31. The following consolidated financial statements
are presented in thousand of euros and all values are rounded to the nearest thousand except when
otherwise stated. Thus, numbers may not sum precisely due to rounding.
The Group’s consolidated financial statements were authorised for issue by the Board of Directors on 26
April 2016.
Note 1.2: Major events
Business combinations
Additional acquisition of 40% of the share capital of Media Diamond
On May 8, 2014, the Group acquired a 10% ownership interest in a Spanish company, Media Diamond,
for an overall investment of €57 thousand. The purchase agreement includes a €20 thousand option for
NetBooster to acquire a further 40% ownership interest in 2015 for an initial contractual price of €560
thousand. The fair value of the call option amounted to €230 thousand as of April 16, 2015. The Group
effectively exercised its call option on April 16, 2015, by acquiring a complementary 40% stake in Media
Diamond for a final contractual price of €775 thousand. Therefore, since this date, it holds 50% of the
shares of Media Diamond.
Through the initial shareholders’ agreement, NetBooster is guaranteed half the seats of the Board and
participates equally with other investors all significant financial and operating decisions. The Group has
therefore determined it has joint control over this entity since May 8, 2014, even though it only held 10%
the interest in the first year.
In 2015, the shareholders’ agreement was amended to guarantee NetBooster an additional Board seat
effective from April 16, 2015. As consequence, since this date the Group has determined it has control
the entity and the 50% interest in Media Diamond has been accounted using the full consolidation method.

Consolidated Financial Statements | December 31, 2015
27 NB
The following table summarises the fair value of net assets acquired and the goodwill as of April 16, 2015:
(1) As of April 16, 2015, the 50% interest previously-held in Media Diamond was revalued at €1,256 thousand, based on the €775 thousand final contractual price paid in cash for the further 40% stake and the €230 thousand fair value of the call option exercised as of April 16, 2015. This revaluation resulted in a revaluation gain of €167 thousand, recognised in other operating income in the consolidated income statement.
(2) As the full consolidation of Media Diamond resulted from the additional Board seat, no consideration was transferred. (3) The Group decided to measure non-controlling interests based on their share in the net identifiable assets of Media
Diamond at the acquisition date.
The goodwill has been allocated to the Southern Europe reporting segment.
Acquisition of Internet Advantage
On September 14, 2015, NetBooster acquired 100% of the digital marketing agency, Internet Advantage,
which is based in Utrecht in the Netherlands. Since that date, the newly acquired agency has been
accounted using the full consolidation method and has operated under the NetBooster Group’s German
brand metapeople.
The following table summarises the fair value of net assets acquired and goodwill as of September 14,
2015:
Acquisition-related costs amounted to €39 thousand and were directly recognised in other operating
income and expenses the consolidated income statement.
This acquisition enables NetBooster to extend its international footprint by adding the important Dutch
market to its networks country portfolio. Goodwill represents the expected operational synergies with
Internet Advantage in order to focus on performance driven digital strategy and grow the businesses. The
goodwill has been allocated to the Germany, Switzerland and Netherlands (“DACH”) reporting segment.
Other major events
Share capital increases
During the year convertible bonds were converted into shares (18 convertible bonds converted into
450,000 shares) to a total amount of €1,125 thousand, representing 2.72% of share capital at the closing
date.
On January 14, 2015, the Company's Board of Directors declared a capital increase resulting from the
exercise of 81,931 share subscription warrants afforded to the previous shareholders of Metapeople.
In thousands of euros
Net identifiable assets acquired 272
Goodwill 1 120
In thousands of euros
Net identifiable assets acquired 82
Goodwill 375

Consolidated Financial Statements | December 31, 2015
28 NB
81,931 new shares were created for a total subscription of €223,671.63 and a capital increase of
€8,193.10. These subscriptions were paid up as compensation against company receivables outstanding
to the parties concerned for the earn-out due in connection with the purchase of metapeople.
On December 15, 2015, the Company's Board of Directors declared a capital increase resulting from the
award of 5,000 free shares to the Group’s managers. 5,000 new shares were created for a capital
increase of €500.
On December 21, 2015, the Company's Board of Directors declared a capital increase resulting from the
award of 30,000 free shares to the Group’s managers. 30,000 new shares were created for a capital
increase of €3,000.
Share buyback program
As of December 31, 2015, NetBooster held 581,106 of its own shares, worth €1,473,144 thousand. These
shares were purchased in the market using the liquidity contract (78,103) for the sum of €198,032 and an
average price of €2,54 and a share buyback program (503,003) for the sum of €1,275,113 and an
average price of €2,54.
Consolidation of Danish companies
In a bid to optimise costs, management decided to merge the company NetBooster Affiliate A/S with the
company NetBooster Agency A/S.
- A new subsidiary in Norway
A new entity was created in Norway (NetBooster Norway). As it is controlled by the Group, it is fully
consolidated in the Group perimeter as of December 31, 2015.
Conversion to IFRS
Those consolidated financial statements are the first one prepared according to the International Financial
Reporting Standards (“IFRS”). The switch to IFRS will provide investors and other users of financial
statements with the ability to compare the financial performance of NetBooster on a like-for-like basis with
its international peers and provide more transparency to investors on the Group’s performance. The Note
10 provides the impacts of the conversion to IFRS on the consolidated income statement and the
consolidated balance as of and for the years ended December 31, 2013 and 2014 (and the financial
position as of January 1, 2013).
NOTE 2: BASIS OF PREPARATION
Note 2.1: Statement of compliance
The principal accounting policies applied in the preparation of these consolidated financial statements are
set out below. These policies have been consistently applied to all the years presented, unless otherwise
stated.
The accounting policies adopted in preparing and presenting the consolidated financial statements
comply with the IFRS standards and interpretations as adopted by the European Union (“UE”) as of
December 31, 2015. The standards and interpretations are available on the website
http://ec.europa.eu/finance/accounting/ias/index_en.htm. These comprise IFRS and the related
interpretations issued by the International Accounting Standards Board (IASB), the Standing
Interpretations Committee (SIC) and the IFRS Interpretations Committee (IFRS IC), effective as of
December 31, 2015 and adopted by the European Union.

Consolidated Financial Statements | December 31, 2015
29 NB
The following standards, amendments to existing standards and interpretations that have been published
by the IASB and endorsed by the EU are mandatory for the Group’s accounting period beginning on or
after January 1, 2015:
IFRIC 21 “Levies”
Annual improvement to IFRSs 2011-2013 cycles
The application of these new standards, amendments and interpretations is not material for the Group’s
consolidated financial statements.
As of December 31, 2015, the main standards, amendments to existing standards and interpretations
adopted by the IASB and endorsed by the EU but not yet applicable are:
Accounting standards, amendments or interpretations Effective date in UE Amendment to IAS 1 “Presentation of financial statements”
Effective from January 1, 2016
Amendment to IAS 16 “Property, plant and equipment” and IAS 38 “Intangible assets”
Effective from January 1, 2016
Amendment to IAS 19 “Employee benefits” Effective for reporting periods beginning on after February 2, 2015
Amendment to IFRS 11 “Joint arrangements” Effective from January 1, 2016 Annual improvement to IFRSs 2010-2012 cycles Effective for reporting periods beginning
on after February 2, 2015 Annual improvement to IFRSs 2012-2014 cycles Effective from January 1, 2016
As of December 31, 2015, the main standards, amendments to existing standards and interpretations
adopted by the IASB but not yet applicable as of December 31, 2015 are:
Accounting standards, amendments or interpretations Effective date IFRS 9 “Financial instruments” Initially effective from January 1, 2015
then deferred until January 1, 2017 IFRS 15 “Revenue from contracts with customers” Effective for reporting periods beginning
on after January 1, 2018
The Group is assessing the potential impact on its consolidated financial statements resulting from the
application of these standards.
Note 2.2: First-time adoption of IFRS
For all periods up to and including the years ended December 31, 2014, the Company prepared its
consolidated financial statements in accordance with generally accepted accounting principles in France
(“French GAAP”). The Company decided to prepare for the first time consolidated financial statements in
accordance with International Financial Reporting Standards (“IFRS”) for the year ended December 31,
2015. The Company elected to use January 1, 2013 as the First-time Adoption Date of IFRS as adopted
by the European Union.
Subject to certain transition elections and exceptions disclosed in Note 10, the Company has consistently
applied the accounting policies used in the preparation of its opening IFRS statement of financial position
as of January 1, 2013 throughout all periods presented, as if these policies had always been in effect.
Note 10 discloses the impact of the transition to IFRS on the reported financial position, financial
performance and cash flows, including the nature and effect of significant changes in accounting policies
from those used in the Company’s consolidated financial statements for the years ended December 31,
2014, December 31, 2013 and January 1, 2013 prepared under French GAAP.

Consolidated Financial Statements | December 31, 2015
30 NB
NOTE 3: SUMMARY OF ACCOUNTING PRINCIPLES
Note 3.1: Basis of measurement
The consolidated financial statements have been prepared under the historical cost convention, except
for derivative financial instruments which are measured at fair value.
Note 3.2: Estimates and assumptions
The preparation of financial statements based on IFRS requires management to use judgment in applying
its accounting policies and reasonable estimates and assumptions about the future. Estimates are made
based on a going concern assumption and on information available at the date of their preparation.
Estimates and judgements are continuously reviewed and are based on historical experience and other
factors, including expectations about future events that are believed to be reasonable under the
circumstances. When the Group makes estimates and assumptions concerning the future, the resulting
accounting estimates will, by definition, seldom equal the related actual results.
The most significant accounting estimates and judgments that the Group has used in the preparation of
its consolidated financial statements are addressed below:
Revenue recognition
The Group’s revenue from services is recognised in the accounting period in which the services are
rendered. For long-term contracts, revenue is recognised based on the actual service provided to the end
of the reporting period as a proportion of the total services to be provided (percentage of completion
method). Estimates of revenues, costs or extent of progress toward completion are revised if
circumstances change. Any resulting increases or decreases in estimated revenues or costs are reflected
in the consolidated income statement in the period in which the circumstances that give rise to the
revision become known by management.
Impairment of non-financial assets
The Group reviews goodwill and intangible assets not subject to amortisation at least annually as well as
other non-financial assets when there is an indication that the asset might be impaired. The Group has
estimated the recoverable amount of operating segments using discounted cash flow models that
required assumptions about future cash flows, margins and discount rate. Refer to Note 5.1 for more
details about methods and assumptions used in estimating net recoverable amounts.
Recognition of deferred tax asset for carried forward tax losses
The recognition of deferred tax assets on carried forward tax losses is based upon whether it is more
likely than not that sufficient and suitable taxable profits will be available in the future against which the
tax losses carried forward can be offset and, when appropriate, the timing of the recovery period.
Therefore, the Group exercises judgement regarding the future financial performance of the particular
legal entity or tax group in which the deferred tax asset has been recognised, and estimates the recovery
period. Refer to Note 5.12 for more details about methods and assumptions used in estimating taxable
future profits.
Derivative financial instruments on convertible bonds
The fair value of the derivative financial instruments that are not traded in an active market is determined
using valuation techniques. As a consequence, regarding the fair value estimation of the derivative
conversion option for convertible bonds, the Group uses its judgement to make assumptions that are
mainly based on the features of the convertible bonds options. Refer to Note 5.11 for more details about
fair value estimation of the derivative option for convertible bonds.

Consolidated Financial Statements | December 31, 2015
31 NB
Consolidation decisions
Following the two-step acquisition of Media Diamond in 2014 and 2015 (refer to Note 1.2), the Group was
required to use judgment in order to determine the control it has over the entity and the consolidation
method to adopt. Between May 8, 2014 and April 16, 2016, the Group concluded it jointly controlled
Media Diamond, even though it only held a 10% stake, as it was guaranteed half the seats of the Board
and participated equally with other investors to all significant financial and operating decisions. Since April
16, 2015, the Group has obtained the full control over Media Diamond as it has been guaranteed an
additional Boart seat. As of December 31, 2015, Media Diamond is therefore accounted using the full
consolidation method.
Note 3.3: Foreign currency translation
Functional and presentation currency
Items included in the financial statements of each of the Group’s entities are measured using the currency
of the primary economic environment in which the entity operates (“the functional currency”). Most of the
Group’s entities operate in Euro zone and use the euro as their functional currency.
The consolidated financial statements are presented in euros (“the presentation currency”).
Transaction and balances
Foreign currency transactions, i.e. in a currency other than the entity’s functional currency, are translated
into the functional currency using the exchange rates prevailing at the dates of the transactions or
valuation where items are re-measured. Foreign exchange gains and losses resulting from the settlement
of such transactions and from the translation at year-end exchange rates of monetary assets and
liabilities denominated in foreign currencies are recognised in the consolidated income statement.
All foreign exchange gains and losses are presented in the consolidated income statement with in “other
financial income” or “other financial expenses”.
Group companies
The financial statements of entities (none of which has the currency of a hyper-inflationary economy) that
have a functional currency different from the presentation currency (i.e. the euro) are translated into the
presentation currency as follows:
Assets and liabilities of each balance sheet, other than equity, are translated at the closing rate at
the date of that balance sheet.
Equity is translated at the historic rate.
Income and expenses for each income statement are translated at average exchange rates
(unless this average is not a reasonable approximation of the cumulative effect of the rates
prevailing on the transaction dates, in which case income and expenses are translated at the rate
on the dates of the transactions).
Cash-flows are translated at average exchange rates.
All resulting translation adjustments are recognised in other comprehensive income on “Currency
translation differences”.
Goodwill and fair value adjustments arising on the acquisition of a foreign entity are treated as assets and
liabilities of the foreign operation and translated at the closing rate. Exchange differences are recognised
in other comprehensive income. On the loss of exclusive control, joint control or significant influence on a
foreign entity, the past exchange differences recognised in equity are recycled in the income statement,
as part of the gain or loss on sale, even if the Group retains a residual interest in this entity.

Consolidated Financial Statements | December 31, 2015
32 NB
The principal exchange rates used for the translation of the financial statements of the Group's main
subsidiaries are as follows:
Note 3.4: Consolidation
The consolidated financial statements of the Group include the financial statements of NetBooster SA and
its subsidiaries at December 31, 2015. The financial statements of subsidiaries and joint ventures cover
the same reporting period as the parent company.
A list of companies included in the scope of consolidation is provided in Note 9.
Subsidiaries
Subsidiaries (including structured entities) are all entities over which the Group has control. The Group
controls an entity when the Group is exposed to, or has rights to, variable returns from its involvement
with the entity and has the ability to affect those returns through its power to direct the relevant activities
of the entity. Subsidiaries are fully consolidated from the date on which control is transferred to the Group
and are deconsolidated from the date that control ceases.
Inter-company transactions, balances and unrealised gains on transactions between Group companies
are eliminated. Unrealised losses are also eliminated unless the transaction provides evidence of an
impairment of the transferred asset. Accounting policies of subsidiaries have been changed upon
acquisition where necessary to ensure consistency with the policies adopted by the Group.
Non-controlling interests represent the share of profit or loss and the net assets owned by outside parties.
They are disclosed separately from results and equity attributable to owners of the Company in the
consolidated income statement, statement of comprehensive income, statement of changes in equity and
balance sheet.
Investments in associates
Associates are all entities over which the Group has significant influence but not control or joint control.
This is generally the case where the Group holds between 20% and 50% of the voting rights. Investments
in associates are accounted for using the equity method.
Under the equity method, the investment is initially recognised at cost and adjusted thereafter to
recognise the Group’s share of the post-acquisition profits or losses of the investee in the consolidated
income statement, and the Group’s share of movements in other comprehensive income of the investee
in the consolidated statement of other comprehensive income. Dividends received or receivable from an
equity-accounted investment are recognised as a reduction in the carrying amount of the investment. The
Group’s investment in associates includes goodwill identified on acquisition, net of accumulated
impairment loss.
When the Group’s share of losses in an equity-accounted investment equals or exceeds its interest in the
entity, including any other unsecured long-term receivables, the Group does not recognise further losses
unless it has incurred obligations or made payments on behalf of the entity.
Unrealised gains on transactions between the Group and its equity-accounted investees are eliminated to
the extent of the Group’s interest in these entities. Unrealised losses are also eliminated unless the
Exchange rate Closing Average Closing Average Closing AverageJan 1,
2013
GBP/EUR 0.7367 0.7262 0.7826 0.8066 0.8350 0.8493 0.8184
CHF/EUR 1.0825 1.0676 1.2029 1.2148 1.2259 1.2309 1.2077
DKK/EUR 7.4619 7.4582 7.4452 7.4551 7.4600 7.4582 7.4606
SEK/EUR 9.1806 9.3511
NOK/EUR 9.6034 8.9401
2015 2014 2013

Consolidated Financial Statements | December 31, 2015
33 NB
transaction provides evidence that the asset disposed of is impaired. Accounting policies adopted by
equity-accounted investees have been changed where necessary to ensure consistency with the policies
adopted by the Group.
As of December 31, 2015, the Group does not own any interest in associates.
Joint arrangements
Joint arrangements are all contractual arrangements over which the Group as joint control. Joint control is
defined as a contractually agreed sharing of control between at least two parties, which exists only when
decisions about the relevant activities require the unanimous consent of the parties sharing control.
Under IFRS 11 “Joint arrangements”, investments in joint arrangements are classified as either joint
operations or joint ventures:
In a joint venture, the parties have rights to the net assets of the arrangement. Interests in joint
ventures are accounted for using the equity method, after initially being recognised at cost in the
consolidated balance sheet;
In a joint operation, the parties have rights to the assets and obligations for the liabilities relating
to the arrangement. The Group recognises its direct right to the assets, liabilities, revenues and
expenses of joint operations and its share of any jointly held or incurred assets, liabilities,
revenues and expenses.
As of December 31, 2015, the Group does not own any interest in joint ventures nor joint operations.
Changes in ownership interests
The Group treats transactions with non-controlling interests that do not result in a loss of control as
transactions with equity owners of the Company. A change in ownership interest results in an adjustment
between the carrying amounts of the controlling and non-controlling interests to reflect their relative
interests in the subsidiary. Any difference between the amount of the adjustment to non-controlling
interests and any consideration paid or received is recognised in a separate reserve within equity
attributable to owners of the Company.
When the Group ceases to consolidate or equity account for an investment because of a loss of control,
joint control or significant influence, any retained interest in the entity is re-measured to its fair value with
the change in carrying amount recognised in the income statement. This fair value becomes the initial
carrying amount for the purposes of subsequently accounting for the retained interest as an associate,
joint venture or financial asset. In addition, any amounts previously recognised in other comprehensive
income in respect of that entity are accounted for as if the Group had directly disposed of the related
assets or liabilities. This may mean that amounts previously recognised in other comprehensive income
are reclassified to profit or loss.
Note 3.5: Business combinations and goodwill
The Group applies the acquisition method to account for business combinations. The consideration
transferred for the acquisition of a subsidiary comprises:
the fair value of the assets transferred,
the liabilities incurred to the former owners of the acquired business,
the equity interests issued by the Group, and
the fair value of any asset or liability resulting from a contingent consideration arrangement.
Identifiable assets acquired and liabilities and contingent liabilities assumed in a business combination
are measured initially at their fair values at the acquisition date, except for deferred tax assets and
liabilities, and assets and liabilities related to employee benefit arrangements, which are recognised and
measured in accordance with IAS 12 “Income taxes” and IAS 19 “Employee benefits”, respectively.

Consolidated Financial Statements | December 31, 2015
34 NB
The Group recognises any non-controlling interest in the acquired entity on an acquisition-by-acquisition
basis either at fair value or at the non-controlling interest’s proportionate share of the acquired entity’s net
identifiable assets.
Acquisition-related costs are expensed as incurred.
Where settlement of any part of cash consideration is deferred, the amounts payable in the future are
discounted to their present value as at the date of exchange. The discount rate used is the entity’s
incremental borrowing rate, being the rate at which a similar borrowing could be obtained from an
independent financier under comparable terms and conditions.
When the consideration transferred by the Group in a business combination includes assets and liabilities
resulting from a contingent consideration arrangement, the contingent consideration is measured at its
acquisition-date fair value and included as part of the consideration transferred. Subsequent changes to
the fair value of the contingent consideration are defined as measurement period adjustments when they
arise from additional information that the acquirer obtained during the measurement period (12 months)
about facts and circumstances that existed at the acquisition date. Measurement period adjustments are
retrospectively recognised through an adjustment to goodwill. Subsequent changes to the fair value of the
contingent consideration that result from events after the acquisition date are not defined as
measurement period adjustments and their recognition depends on the nature of the contingent
consideration:
if the contingent consideration is classified as equity, it is not re-measured subsequently and its
subsequent settlement is accounted within equity;
if the contingent consideration is classified as an asset or a liability which is a financial instrument
and is within the scope of IAS 39, it is measured at fair value, with any resulting gain or loss
recognised either in the income statement or in OCI in accordance with that IFRS;
if the contingent consideration is classified as an asset or a liability which is not within the scope
of IAS 39, subsequent changes to its fair value is recognised in accordance with IAS 37 or other
IFRS applied for those items.
If the business combination is achieved in stages, the acquisition date carrying value of the acquirer’s
previously held equity interest in the acquire is re-measured to fair value at the acquisition date. Any
gains or losses arising from such re-measurement are recognised in the income statement.
Goodwill is defined as the excess of the transferred consideration, the amount of any non-controlling
interest in the acquired entity and the acquisition-date fair value of any previous equity interest in the
acquired entity over the fair value of the net identifiable assets acquired. Positive goodwill is recognised
as an intangible asset in the consolidated balance sheet. Goodwill is not amortised but it is tested for
impairment..
For the purposes of assessing impairment, goodwill is allocated to each of the Group’s cash-generating
units (“CGU”), or groups of CGUs, that is expected to benefit from the synergies of the combination. If the
initial allocation of goodwill acquired in a business combination cannot be completed before the end of the
year in which the business combination is effected, that initial allocation shall be completed before the
end of the following fiscal year. A CGU, or group of CGUs, to which goodwill has been allocated is tested
for impairment annually, or more frequently when there is an indication that the unit may be impaired. If
the recoverable amount of the CGU is less than its carrying amount, the impairment loss is allocated first
to reduce the carrying amount of any goodwill allocated to the unit, and then to the other assets of the unit
pro rata based on the carrying amount of each asset in the unit. Any impairment loss for goodwill is not
reversed in subsequent periods.
Gains and losses arising on the disposal of an entity include the carrying amount of goodwill relating to
the entity sold. In the case of a bargain purchase, negative goodwill is recognised directly in the income
statement.

Consolidated Financial Statements | December 31, 2015
35 NB
Note 3.6: Other intangible assets
Intangible assets acquired separately are measured on initial recognition at cost. The cost of intangible
assets acquired in a business combination is their fair value at the acquisition date. Following initial
recognition, intangible assets are carried at cost less any accumulated amortisation and any accumulated
impairment losses.
The Group assesses whether the useful lives of intangible assets are finite or indefinite. Intangible assets
with an indefinite useful life are not amortised and are tested for impairment annually either individually or
at the level of the cash-generating unit to which it relates. The useful life of intangible assets with
indefinite useful lives is reviewed annually to determine whether the indefinite life assessment remains
appropriate. Intangible assets with finite useful lives are amortised over their useful life and tested for
impairment whenever there is evidence that they may be impaired. The useful life and amortisation
method for an intangible asset with a finite useful life are reviewed at least at each reporting date.
According to IAS 38 “Intangible assets”, research expenditure is recognised as an expense as incurred
and development costs that are directly attributable to the design and testing of identifiable and unique
assets controlled by the Group, such as software, are recognised as intangible assets when the following
criteria are met:
It is technically feasible to complete the intangible asset so that it will be available for use;
Management intends to complete the asset and use or sell it;
There is an ability to use or sell the software;
It can be demonstrated how the software will generate probable future economic benefits;
Adequate technical, financial and other resources to complete the development and to use or sell
the software are available; and
The expenditure attributable to the software during its development can be reliably measured.
Directly attributable development costs that are capitalized as part of intangible assets include the
following:
wages and salaries and other ancillary staff costs in connection with development;
any expenditure on design and development projects outsourced to subcontractors; and
depreciation / amortisation of property, plant and equipment or intangibles, in connection with
development only.
Development costs previously recognised as an expense are not recognised as an asset in a subsequent
period. Capitalized development costs are amortised from the point at which the asset is ready for use.
The other intangible assets mainly include computer software. Costs associated with maintaining
software programmes are recognised as an expense as incurred. Software purchased is recognised as
intangible assets on the balance sheet at the purchase price. Development costs that are directly
attributable to the design and testing of identifiable unique software products controlled by the Group are
also recognised as intangible assets if the criteria to capitalize set out above are met. Software
recognised as intangible assets is amortised on a straight-line basis over its estimated useful life
(between 3 and 5 years) from the date on which it is brought to service.
Note 3.7: Property, plant and equipment
Property, plant and equipment are recognised at historical cost less accumulated depreciation. Historical
cost includes expenditure that is directly attributable to the acquisition of the items.
Subsequent costs are included in the asset’s carrying amount or recognised as a separate asset, as
appropriate, only when it is probable that future economic benefits associated with the item will flow to the
Group and the cost of the item can be measured reliably. The carrying amount of any component

Consolidated Financial Statements | December 31, 2015
36 NB
accounted for as a separate asset is derecognised when replaced. All other repairs and maintenance are
charged to profit or loss during the reporting period in which they are incurred.
Depreciation on property, plant and equipment is calculated using the straight-line method to allocate
their cost to their residual values over their estimated useful lives or, in the case of leasehold
improvements and certain leased plant and equipment, the shorter lease term, as follows:
Fixtures and fitting: 5-10 years
Office equipment: 3-5 years
Office furnishings: 5-10 years
The assets’ residual values and useful lives are reviewed, and adjusted if appropriate, at the end of each
reporting period.
Gains and losses on disposals are determined by comparing the proceeds with the carrying amount and
are included in the consolidated income statement.
Note 3.8: Impairment of non-financial assets other than goodwill
Intangible and tangible assets that are subject to amortisation are tested for impairment whenever events
or changes in circumstances indicate that their carrying amount may not be recoverable. Intangible
assets other than goodwill that have an indefinite useful life or that are not ready to use are not subject to
amortisation and are tested annually for impairment or more frequently if events or changes in
circumstances indicate that they might be impaired.
An impairment loss is recognised in the consolidated income statement on “Depreciation and amortisation”
for the amount by which the asset’s carrying amount exceeds its recoverable amount. The recoverable
amount is the higher of an asset’s fair value less costs of disposal and value in use. When it is not
possible to estimate the recoverable amount of an individual asset, the Group estimates the recoverable
amount of the CGU or the group of CGUs to which the asset belongs.
Prior impairment of non-financial assets other than goodwill is reviewed for possible reversal at each
reporting date.
Note 3.9: Financial assets
Classification
The Group classifies its financial assets in the following categories: financial assets at fair value through
profit or loss, loans and receivables, held-to-maturity investments and available-for-sale financial assets.
The classification depends on the purposes for which the financial assets were acquired. Management
determines the classification of its financial assets at initial recognition and, only in the case of assets
classified as held-to-maturity, re-evaluates this designation at the end of each reporting period.
Financial assets at fair value through profit or loss
Financial assets at fair value through profit or loss are financial assets held for trading and financial
assets designated upon initial recognition as at fair value through profit or loss. A financial asset is
classified in this category if acquired principally for the purpose of selling in the short term. Derivatives,
including separately recognised embedded derivatives, are also categorised as held for trading unless
they are designated as hedges. Assets in this category are classified as current assets if expected to be
settled within 12 months, otherwise they are classified as non-current.
Gains and losses from financial assets held for trading are recognised immediately in the income
statement.

Consolidated Financial Statements | December 31, 2015
37 NB
Loans and receivables
Loans and receivables are non-derivative financial assets with fixed or determinable payments that are
not quoted in an active market. They are included in current assets, except for loans and receivables with
maturities greater than 12 months after the end of the reporting period, which are classified as non-
current assets.
Held-to-maturity investments
Held-to-maturity investments are non-derivative financial assets with fixed or determinable payments and
fixed maturities that the Group has the positive intention and ability to hold to maturity. They are included
in current assets, except for held-to-maturity investments with maturities greater than 12 months after the
end of the reporting period, which are classified as non-current assets.
Available-for-sale financial assets
Available-for-sale financial assets are non-derivatives that are either designated in this category or not
classified in any of the other categories. They are included in non-current assets unless the investment
matures or management intends to dispose of it within 12 months after the reporting date.
The breakdown by category of the Group’s financial assets is disclosed in Note 5.5.
Recognition and derecognition
Regular purchases and sales of financial assets are recognised on the trade date, that is the date on
which the Group commits to purchase or sell the asset. Financial assets are derecognised when the
rights to receive cash flows from the financial assets have expired or have been transferred and the
Group has transferred substantially all the risks and rewards of ownership.
When securities classified as available-for-sale are sold or impaired, the accumulated fair value
adjustments recognised in other comprehensive income are reclassified to profit or loss.
Measurement
At initial recognition, financial assets are measured at fair value plus, for all financial assets not carried at
fair value through profit or loss, transaction costs that are directly attributable to the acquisition of the
financial asset. Transaction costs of financial assets carried at fair value through profit or loss are
expensed in the income statement.
Loans and receivables and held-to-maturity investments are subsequently carried at amortised cost using
the effective interest method.
Available-for-sale financial assets and financial assets at fair value through profit or loss are subsequently
carried at fair value. Gains and losses arising from changes in the fair value are recognised as follows:
for financial assets at fair value through profit or loss, changes in the carrying amount are
recognised in the income statement as “other operating income or expenses” in the period in
which they arise;
for available-for-sale financial assets, changes in the carrying amount are recognised in other
comprehensive income, except for translation differences related to change in the amortised
costs of monetary securities denominated in a foreign currency, which are recognised in the
income statement.
Impairment of financial assets
At each reporting date, the Group assesses whether there is objective evidence that a financial asset or a
group of financial assets is impaired. A financial asset is impaired only if there is objective evidence of
impairment as a result of one or more events that occurred after the initial recognition of the asset (a “loss
event”) and that loss event has an impact on the estimated future cash flows of the financial asset that
can be reliably estimated.

Consolidated Financial Statements | December 31, 2015
38 NB
The criteria used to determine if there is an objective evidence of impairment loss includes:
significant financial difficulties of the obligor;
delinquencies in interest or principal payments; and
it becomes probable that the borrower will enter bankruptcy or other financial reorganization.
For equity securities, a significant or prolonged decline in the fair value of the security below its cost is
also evidence that the asset is impaired.
If such evidence exists, the Group recognises an impairment loss, as follows:
For financial assets carried at amortised cost, the impairment loss is the difference between the
amortised cost of the loan or receivable and the present value of the estimated future cash flows,
discounted using the instrument’s original effective interest rate. The carrying amount of the asset
is reduced by this amount.
For available-for-sale financial assets, the impairment loss is the difference between the original
cost of the asset and its fair value at the measurement date, less any impairment loss previously
recognised in the income statement. This amount represents the loss in accumulated other
comprehensive income that is reclassified to net income.
Impairment losses on financial assets carried at amortised cost and available-for-sale debt instruments
are reversed in subsequent periods if the amount of the loss decreases and the decrease can be related
objectively to an event occurring after the impairment was recognised. Impairment losses on available-for-
sale equity instruments are not reversed.
Note 3.10: Derivative financial instruments
The Group did not undertake any hedging activity during the period.
Derivatives financial instruments are initially recognised at fair value on the date a derivative contract is
entered into and are subsequently re-measured to their fair value at each reporting date. Subsequent
changes in the fair value of derivative instruments are recognised immediately in the consolidated income
statement within Net financial profit (loss).
The fair values of derivative instruments are disclosed in Note 5.5.
Note 3.11: Trade receivables
Trade receivables are amounts due from customers for services performed in the ordinary course of
business. If collection is expected in one year or less (or in the normal operating cycle of the business if
longer), they are classified as current assets. If not, they are presented as non-current assets.
Trade receivables are recognised initially at fair value, which is generally their nominal value, except if the
effect of discounting is material. They are subsequently measured at amortised cost using the effective
interest method, less provision for impairment.
A factoring contract existed until the year ended December 31, 2014. However, even if transferred to the
factor, according to IFRS assets derecognition criteria, those trade receivables have continued to be
recognized (refer to Note 5.6).
An impairment charge is recognised in the consolidated income statement when there is objective
evidence that the Group will not be able to collect all amounts due according to the original terms of the
receivables. The amount of the provision is the difference between the carrying amount and the present
value of estimated future cash flows, discounted at the original effective interest rate. The provision is
recognised in the income statement on “cost of sales”. When a trade receivable is considered
uncollectible, it is written off.

Consolidated Financial Statements | December 31, 2015
39 NB
Note 3.12: Cash and cash equivalents
In the consolidated statement of cash flows, cash and cash equivalents includes cash in hand, deposits
held at call with banks, other short-term highly liquid investments with original maturities of three months
or less and which are subject to an insignificant risk of changes in value, as well as bank overdrafts if they
do not constitute a financing operation. In the consolidated balance sheet, bank overdrafts are shown
within borrowings in current liabilities.
Note 3.13: Share capital
Ordinary shares are classified as equity. Incremental costs directly attributable to the issue of new shares
or options are shown in equity as a deduction, net of tax, from the proceeds.
Where any company of the Group purchases the Company’s equity instruments, for example as the result
of a share buy-back or a share-based payment plan, the consideration paid, including any directly
attributable incremental costs (net of income taxes) is deducted from equity attributable to the owners of
the Company as treasury shares until the shares are cancelled or reissued. Where such ordinary shares
are subsequently reissued, any consideration received, net of any directly attributable incremental
transaction costs and the related income tax effects is included in equity attributable to the owners of the
Company.
Note 3.14: Share-based payments
The Group has set up a performance-based long-term incentive plan for certain employees, which is
classified as equity-settled share-based payments.
Equity-settled shared-based payments to employees are measured at the fair value of the equity
instruments at the grant date. This fair value is recognised in the consolidated income statement on
“Employee benefits expense” on a straight-line basis over the vesting period, based on the Group’s
estimates of equity instruments expected to vest, with a corresponding increase in equity. At the end of
each reporting period, the Group revises its estimate of the number of equity instruments expected to vest.
The impact of the revision of the original estimates, if any, is recognised in the consolidated income
statement on “Employee benefits expense” such that the cumulative expense reflects the revised
estimate, with a corresponding adjustment to the equity-settled employee benefits reserve.
Note 3.15: Long-term employee benefits
The Group operates various retirement and post-employment schemes, including both defined benefit
and defined contribution pension plans.
Defined contribution pension plans
A defined contribution plan is a pension plan under which the Group pays fixed contributions into a
separate entity. The Group has no legal or constructive obligations to pay further contributions if the fund
does not hold sufficient assets to pay all employees the benefits relating to employee service in the
current and prior periods.
Except the legal retirement benefit plan in France, the Group provides only defined contribution plans to
its employees, through payment contributions to publicly or privately administered pension insurance
plans on a mandatory, contractual or voluntary basis. The Group has no further payment obligations once
the contributions have been paid. The contributions are recognised in the income statement as employee
benefit expense when they are due. Prepaid contributions are recognised as an asset to the extent that a
cash refund or a reduction in the future payments is available.

Consolidated Financial Statements | December 31, 2015
40 NB
Defined benefit pension plans
A defined benefit plan is a pension plan that is not a defined contribution plan. Typically, defined benefit
plans define an amount of pension benefit that an employee will receive on retirement, usually dependant
on one or more factors such as age, years of service and compensation.
For defined benefit plans, the retirement benefit obligation is recognised in the balance sheet and
represents the present value of the defined benefit obligation as adjusted for unrecognised actuarial gains
and losses and unrecognised past service cost, and as reduced by the fair value of plan assets, if any.
Actuarial gains and losses arising from experience adjustments and changes in actuarial assumptions are
recognised in other comprehensive income as incurred. Past service costs (effect of amendment,
curtailment or settlement of a defined pension plan) are recognised immediately in the income statement.
The interest expenses arising from the reverse discounting of retirement benefits and similar obligations
and the financial income from the expected return on plan assets are recognised in net financial profit
(loss).The defined benefit is estimated annually.
The Group’s defined benefit plans include only the legal retirement benefit plan in France. The amount of
the obligation of the Group’s French companies is considered to be not significant as of December 31,
2015 and therefore is not disclosed in the notes to the consolidated financial statements.
Note 3.16: Provisions
Provisions for legal claims or other risks are recognised when:
the Group has a present legal or constructive obligation as a result of past events;
it is probable that an outflow of resources will be required to settle the obligation; and
the amount can be reliably estimated.
Provisions are not recognised for future operating losses.
Where there are a number of similar obligations, the likelihood than an outflow will be required in
settlement is determined by considering the class of obligations as a whole. A provision is recognised
even if the likelihood of an outflow with respect to any one item included in the same class of obligations
may be small.
Provisions are measured at the present value of management’s best estimate of the expenditure required
to settle the obligation at the reporting date. The discount rate used to determine the present value is a
pre-tax rate that reflects current market assessments of the time value of money and the risks specific to
the obligation. The increase in the provision due to passage of time is recognised as interest expense.
Provisions are classified as short-term or long-term according to whether the obligation is expected to be
settled within or beyond one year.
Note 3.17: Borrowings
Borrowings are recognised initially at fair value, being their issue proceeds (fair value of consideration
received) net of transaction costs incurred. Borrowings are subsequently carried at amortised cost using
the effective interest method. Any difference between proceeds, net of transaction costs, and the
redemption value is recognised in the income statement over the period of the borrowings using the
effective interest method.
The effective interest rate is the rate that exactly discounts the expected stream of future cash flows
(transaction costs included) through to maturity of the financial liability, or a shorter period if appropriate,
to the current net carrying amount of the liability on initial recognition.
Costs directly attributable to the establishment of loan facilities are recognised as transaction costs of the
loan to the extent that it is probable that some or all of the facility will be drawn down. In this case, the fee

Consolidated Financial Statements | December 31, 2015
41 NB
is deferred until the draw-down occurs. To the extent there is no evidence that it is probable that some or
all of the facility will be drawn down, the fee is capitalised as a pre-payment for liquidity services and
amortised over the period of the facility to which it relates.
Borrowings are classified as current liabilities unless the Group has an unconditional right to defer
settlement of the liability for at least 12 months after the end of the reporting period.
Note 3.18: Convertible bonds financial instruments
In 2007, the Company issued convertible bonds, which were renegotiated in 2012. Under IFRS, the conversion parity being not fixed, the bonds are qualified as hybrid financial instruments comprising borrowings and an embedded derivative for the convertible option. Embedded derivative are classified under financial derivative (liability) line item in the consolidated balance sheet. The valuation of the embedded derivative (at fair value) has been done by independent valuation experts. Interest expenses for the borrowing are calculated using the effective interest method and the variation of the derivative fair value is accounted on “other financial income/expense” for the part of the borrowings which is not converted to equity.
Note 3.19: Trade payables
These amounts represent liabilities for services provided by the Group prior to the end of financial year
which are unpaid. Trade and other payables are presented as current liabilities unless payment is not due
within 12 months after the reporting period. They are recognised initially at nominal value except if
payment terms exceed standard terms, in which case they are initially recognised at fair value, and
subsequently measured at amortised cost using the effective interest method.
Note 3.20: Current and deferred income tax
The tax expense for the period comprises current and deferred tax. Tax is recognised in the consolidated
income statement, except to the extent that it relates to items recognised in other comprehensive income
or directly in equity. In this case, the tax is also recognised in other comprehensive income or directly in
equity, respectively.
The current income tax charge is calculated on the basis of the tax laws enacted or substantively enacted
at the balance sheet date in the countries where the Company and its subsidiaries operate and generate
taxable income. Management annually evaluates positions taken in tax returns with respect to situations
in which applicable tax regulation is subject to interpretation. It establishes provisions where appropriate
on the basis of amounts expected to be paid to the tax authorities.
Deferred income tax is recognised on temporary differences arising between the tax bases of assets and
liabilities and their carrying amounts in the consolidated financial statements. However, deferred tax
liabilities are not recognised if they arise from the initial recognition of goodwill. Deferred income tax is not
accounted for if it arises from initial recognition of an asset or liability in a transaction other than a
business combination that at the time of the transaction affects neither accounting nor taxable profit or
loss. Deferred income tax is determined using tax rates and laws that have been enacted or substantively
enacted by the balance sheet date are expected to apply when the related deferred income tax asset is
realised or the deferred income tax liability is settled. Deferred tax assets and liabilities are not discounted.
Deferred income tax assets are recognised only to the extent that it is probable that future taxable profit
will be available against which the temporary differences can be utilised. The carrying value of the
deferred tax assets is reviewed at each closing date and reduced to the extent that it is no longer
probable that sufficient taxable profit will be available to allow all or part of the deferred income tax asset
to be utilized.

Consolidated Financial Statements | December 31, 2015
42 NB
Deferred income tax liabilities are provided on taxable temporary differences arising from investments in
subsidiaries, associates and joint arrangements, except for deferred income tax liability where the timing
of the reversal of the temporary difference is controlled by the Group and it is probable that the temporary
difference will not reverse in the foreseeable future.
Deferred income tax assets and liabilities are offset when there is a legally enforceable right to offset
current tax assets against current tax liabilities and when the deferred income taxes assets and liabilities
relate to income taxes levied by the same taxation authority on either the same taxable entity or different
taxable entities where there is an intention to settle the balances on a net basis.
Note 3.21: Segment reporting
In accordance with IFRS 8 “Operating segments”, operating segments are reported in a manner
consistent with the internal reporting provided to the chief operating decision-maker (“CODM”). The
CODM is responsible for allocating resources and assessing performance of the operating segments and
has been identified as the Board of Directors.
The information relating to operating segments is based on the same accounting methods and rules used
to prepare the consolidated financial statements.
Note 3.22: Recognition of revenue
The Group’s activities are the following:
Pay per Click (PPC) activity, which relates to the management of keywords and ad spaces for the
customers,
Search Engine Optimization (SEO) activity, which is a consulting activity relating to websites
creation and optimization,
Media activity, which relates to advertisement campaigns optimization through internet ad spaces
and retargeting (through Real Time Bidding),
Data activity, which comprises both CRM solutions (emailing and customer databases
acquisition) and data analytics solutions,
Affiliate activity, which relates to the management of advertisements campaigns through affiliate
networks,
Design activity, which is the production of websites, advertisements (videos, banners), e-mails, or
other advertisement contents, and
Social Media, which relates to advertisement retargeting on social networks.
Consequently, the Group’s resources are mainly generated by two types of service contracts:
Recurring contracts, usually drawn up for an initial term of one year and tacitly renewable (for
example, in PPC or Media activities), and
Contracts drawn up on a more sporadic basis to provide human resources, calculated in man-
days (for example, in SEO or Design activities).
Revenue from service contracts is recognised over the period of the contract by reference to the stage of
completion. The Group recognises revenue when:
the stage of completion of the transaction at the end of the reporting period can be measured
reliably,
the amount of revenue and costs incurred or to be incurred in respect of the transaction can be
reliably measured, and
it is probable that future economic benefits associated with the transaction will flow to the entity.
Revenue is measured based on the price specified in the sales contract, net of discounts, returns and
value added taxes.

Consolidated Financial Statements | December 31, 2015
43 NB
In some of its transactions in PPC and Media activities, the Group acts as an “agent” on behalf a third-
party service provider. For these transactions, the Group calculates the net amount earned, and any
expenses incurred with third-party suppliers are excluded from revenue. In other transactions, the Group
acts as a “principal” for its clients. For these transactions, the Group recognises the gross amount
invoiced as revenue and any expenses incurred with third-party suppliers in “Cost of sales”.
Note 3.23: Grants
Government grants are recognised at their fair value where there is a reasonable assurance that the
grant will be received and the Group will comply with all attached conditions. Their recognition and
measurement differ depending on whether grants relate to costs or to assets:
Government grants relating to costs are deferred and recognised in the income statement over
the period necessary to match them with the costs that they are intended to compensate. They
are recognised on “Other income from operations”.
Government grants relating to assets presented in the balance sheet by deducting the grant from
the carrying amount of the asset. The grant is recognised in profit or loss over the life of the
depreciable asset as a reduced depreciation expense.
NetBooster SA is entitled to the French research tax credit (“Crédit d’Impôt Recherche”). Income tax
credits granted for research costs are recognised in the consolidated income statement on “Other income
from operations” when earned. Income tax credits granted for development costs that are capitalized as
part of intangible assets are deducted from capitalised amounts and recognised in the consolidated
income statement as a deduction of depreciation expense.
The Group’s French companies are also entitled to a French tax credit to support competitiveness and
employment (“Crédit d’Impôt Compétitivité Emploi”). This income tax credit is deducted from
corresponding employee expenses in the income statement.
Note 3.24: Leases
Operating leases
Leases in which a significant portion of the risks and rewards of ownership have not been transferred to
the Group (as a lessee) are classified as operating leases. Payments made under operating leases (net
of any incentives received from the lessor) are charged to the income statement on a straight-line basis
over the period of the lease.
In the event that lease incentives are received from the lessor to enter into operating leases, such
incentives are recognised as a liability. The aggregate benefit of incentives is recognised in the income
statement as a reduction of rental expenses on a straight-line basis over the lease term.
The Group recognised rental income from operating sub-leases on a straight-line basis over the term of
the relevant sub-lease. Initial direct costs incurred in negotiating and arranging an operating sub-lease
are added to the carrying amount of the sub-leased asset and recognised on a straight-line basis over the
lease term.
Finance leases
Leases in which a significant portion of the risks and rewards of ownership have been transferred to the
Group (as a lessee) are classified as finance leases. Finance leases are capitalised at the lease’s
commencement at the lower of the fair value of the leased equipment and the present value of the
minimum lease payments. The corresponding rental obligations, net of finance charges, are included in
financial liabilities. Each lease payment is allocated between the liability and finance charges. The interest
element of the finance cost is charged to the income statement over the lease period so as to produce a
constant periodic rate of interest on the remaining balance of the liability for each period. The equipment

Consolidated Financial Statements | December 31, 2015
44 NB
acquired under finance leases is depreciated over the shorter of the useful life of the asset and the lease
term.
As of December 31, 2015, December 31, 2014, December 31, 2013 and January 1, 2013, the Group did
not recognise any finance lease in its consolidated financial statements, as the related amounts were not
material.
Note 3.25: EBITDA
EBITDA is defined as Operating profit (loss) adjusted to exclude the following items: (i) depreciation and
amortisation expense; (ii) “non-recurring” operating income expenses as disclosed in the consolidated
income statement on “Other operating income and expenses - net”.
EBITDA is not a presentation made in accordance with IFRS, is not a measure of financial condition,
liquidity or profitability and should not be considered as an alternative to net income attributable to the
Group determined in accordance with IFRS, operating profit / (loss), net cash flows from/used in
operating activities determined in accordance with IFRS or any other measure prescribed by GAAP.
EBITDA assists the Group in comparing its performance over various reporting periods on a consistent
basis because it removes from operating results the impact of items that do not reflect the core operating
performance. Because not all companies calculate EBITDA identically, this presentation of EBITDA may
not be comparable to other similarly titled measures of other companies.
Note 3.26: Other operating income and expenses – non current
In accordance with the recommendation from the French accounting authorities (Autorité des Normes
Comptables – ANC recommendation 2013-03 dated November 7, 2013), “Other operating income and
expenses – Net” is reported on a separate line in the income statement and includes items that are
limited in number, clearly identifiable and non-recurring that have a material impact on consolidated
results. This classification is applied to certain material items of income and expenses that are unusual in
terms of their nature and frequency, such as net income from sale of assets or restructuring costs, etc.
They are presented separately in the income statement to help users of the consolidated financial
statements to better understand the Group’s financial performance.
Note 3.27: Dividends distribution
Dividends paid to shareholders are recognised as a liability in the consolidated financial statements for
the period during which they are approved by the Company’s shareholders.
Note 3.28: Earnings per share
Basic earnings per share
Basic earnings per share are calculated by dividing the net income or loss for the period attributable to
equity owners of the Company by the weighted average number of ordinary shares outstanding during
the period.
Diluted earnings per share
Diluted earnings per share are calculated by adjusting the weighted average number of ordinary shares
outstanding for dilutive instruments. The number of shares included with respect to options, warrants and
similar instruments is computed using the treasury stock method. The Company’s potentially dilutive
ordinary shares comprise stock options granted to employees, warrants and convertible bonds
conversion option.

Consolidated Financial Statements | December 31, 2015
45 NB
NOTE 4: FINANCIAL RISK MANAGEMENT
Note 4.1: Financial risk factors
The Group’s activities expose it to a variety of financial risks: market risk (including foreign exchange risk,
interest rate risk), credit risk and liquidity risk. The Group’s overall risk management focuses on the
unpredictability of financial markets and seeks to minimise potential adverse effects on the Group’s
financial performance.
The Group’s risk management is carried out by a [central department under policies approved by the
Board of Directors which identifies and evaluates financial risks in close co-operation with the Group’s
operating units. The Board provides written principles for overall risk management, as well as written
policies covering specific areas, such as foreign exchange risk, interest rate risk, credit risk, use of
derivative financial instruments and non-derivative financial instruments, and investment of excess
liquidity].
Market risks
Foreign exchange risk
The Group operates internationally and is exposed to foreign exchange risk arising from various currency
exposures, primarily with respect to the pound sterling, the Swiss franc, the Swedish krone, the
Norwegian krone and the Danish krone.
Foreign exchange risk arises from:
the future settlement of the Group’s foreign currency transactions;
the year-end translation of monetary assets and liabilities denominated in foreign currencies;
the translation of subsidiaries’ accounts that have a functional currency different from the
presentation currency (i.e. the euro) for consolidation purposes.
Management requires the Group’s companies to manage their foreign exchange risk against their
functional currency and imposes strict limits on the maximum exposures that can be entered into. The
Company does not hedge foreign currency exposures.
The sensitivity of the consolidated net profit (loss) to changes in the exchange rates of the main
currencies used by the Group is as follows:

Consolidated Financial Statements | December 31, 2015
46 NB
Interest rate risk
The Group is not significantly exposed to interest rate risk because its long-term borrowings and
receivables are mainly at fixed rate and are carried at amortised cost. Therefore, they are not subject to
interest rate risk since neither the carrying amount nor the future cash flows will fluctuate because of a
change in market interest rates.
Credit risk
Credit risk arises from cash and cash equivalents, non-current financial assets, derivative financial
instruments as well as credit exposures to customers, including outstanding receivables and committed
transactions.
Credit risk is managed on Group basis, except for credit risk relating to accounts receivables balances.
Each local entity is responsible for managing and analysing the credit risk for each of their new clients
before standard payment and delivery terms and conditions are offered. If customers are independently
rated, these ratings are used. If there is no independent rating, risk control assesses the credit quality of
the customer, taking into account its financial position, past experience and other factors. Individual risk
limits are set based on internal or external ratings in accordance with limits set by the Group.
Liquidity risk
The objective of liquidity risk management is to ensure that the Group has enough funding facilities
available to meet its current and future obligations. Management monitors rolling forecasts of the Group’s
liquidity reserve and cash and cash equivalents on the basis of expected cash flows. This is generally
carried out at local level in operating companies of the Group in accordance with practice and limits set by
the Group.
At the reporting date, due to its favourable available cash position, the management considers that the
liquidity risk is likely to be limited in the short term.
Note 4.2: Capital management
The Group’s objectives, when managing capital, are to safeguard the Group’s ability to continue as a
going concern in order to provide returns for shareholders and to maintain an optimal capital structure to
reduce the cost of capital.
In order to maintain or adjust the capital structure, the Group may adjust the amount of dividends paid to
shareholders, return capital to shareholders, issue new shares or sell assets to reduce debt.
Note 4.3: Fair value estimation
The following table classifies financial assets and liabilities that are recognised on the balance sheet at
fair value in a hierarchy that is based on significance of the inputs used in making the measurements.
According to IFRS 13, the different levels have been defined as follows:
Level 1: quoted prices (unadjusted) in active markets for identical assets or liabilities;
Level 2: inputs other than quoted prices included within level 1 that are observable for the asset
or liability, either directly (that is, as prices) or indirectly (that is, derived from prices);
Level 3: inputs for the asset or liability that are not based on observable market date (that is,
unobservable inputs).

Consolidated Financial Statements | December 31, 2015
47 NB
-

Consolidated Financial Statements | December 31, 2015
48 NB
NOTE 5: ADDITIONAL INFORMATION RELATED TO THE CONSOLIDATED BALANCE
SHEET
Note 5.1: Intangible assets and Goodwill
For the year ended December 31, 2014, the increase in intangible assets was due to the recognition of
the Ground control software which amounted to €224 thousand and of the new website which amounted
to €56 thousand.
For the year ended December 31, 2015, the increase in intangible assets was mainly due to the new
goodwill of Media Diamond (€1120 K) and metapeople Netherlands (€375 K). Complementary capitalized
development costs have been recognized for the Ground control software which amounted to €79
thousand.

Consolidated Financial Statements | December 31, 2015
49 NB
Impairment test for goodwill
Managements reviews the business performance based on geography. Therefore, for impairment testing
purposes, goodwill is monitored by management at the level of six geographic segments: (i) France, (ii)
United Kingdom, (iii) Germany, Switzerland and Netherlands (“DACH”), (iv) Northern Europe, (v)
Southern Europe and (vi) Middle East (Dubai).
Each geographical area represents a group of CGUs, each CGU being a Group’s subsidiary.
Goodwill breaks down as follows by group of CGUs:
(1) D.A.C.H.: Germany, Austria, Switzerland & Netherlands
The Group tests whether goodwill has suffered any impairment on an annual basis, by comparing the
aggregate recoverable amount of the assets included in each group of CGUs with its carrying amount.
The recoverable amount of each group of CGUs is determined based on value-in-use calculations, using
post-tax cash flow projections based on financial budget approved by management covering a five-year
period. Cash flows beyond the five-year period are extrapolated using the estimated long-term growth
rates stated below.
Key assumptions
The key assumptions used to calculate the value in use of each CGU are as follows:
The discount rates used are post-tax weighted average costs of capital and reflect specific risks relating
to the relevant segments and the countries in which they operate.

Consolidated Financial Statements | December 31, 2015
50 NB
No goodwill impairment loss was recorded for the years ended December 31, 2015, December 31, 2014,
December 31, 2013 and January 1, 2013.
Sensibility
The Group performed a sensitivity test of the impairment charge to changes in the key assumptions used
(i.e. post-tax discount rate and long term growth rate).
For all CGUs, the key assumptions were modified as follows:
post-tax discount rate: +5%; and
long term growth rate: -0.5%.
This sensitivity test as of December 31, 2013, December 31, 2014 and December 31, 2015 did not
conduct the Group to modify its assumptions as no additional impairment charge resulted from the test.

Consolidated Financial Statements | December 31, 2015
51 NB
Note 5.2: Property, plant and equipment
For the year ended December 31, 2013, the decrease in carrying amount of property, plant and
equipment mainly related to NetBooster SA’s change of premises which generated disposals for a total
amount of €646 thousand and non-recurring assets depreciation for a total amount of €175 thousand.
Lease
Operating leases
The Group does not recognise any assets acquired under finance leases as of December 31, 2015,
December 31, 2014, December 31, 2013 and January 1, 2013. Lease payments under operating leases
amounted to €1,816 thousand as of December 31, 2015, €2,331 thousand as of December 31, 2014,
€2,272 thousand as of December 31, 2013. They related mainly to the lease of offices in London and
Paris. They are recognised in the consolidated income statement on “External expenses”.
Free rents
Free rents were granted in 2013 for the Paris office for a total amount of €275 thousand. This amount is
amortized on a straight-line basis over 9 years.

Consolidated Financial Statements | December 31, 2015
52 NB
Sub-lease
Starting 2015, there is a sub-lease for the London office. The rental income from this sub-lease contract is
recognised on the same basis as the related rental expense that is in the income statement on “External
expenses” and on a straight-line basis over the term of the sub-lease. The rental income amounted to
€137 thousand as of December 31, 2015.
Commitments for minimum lease payments in relation to non-cancellable operating leases
Note 5.3: Investments accounted for using the equity method and related derivative financial instruments
Investments accounted for using the equity method
On May 8, 2014, the Group acquired a 10% ownership interest in a Spanish company, Media Diamond, for an overall investment of €57 thousand. The purchase agreement includes a €20 thousand option for NetBooster to acquire a further 40% in 2015 for an initial contractual price of €560 thousand. The Group effectively exercised its call option on April 16, 2015. Therefore, as of December 31, 2015, it holds 50% of the shares of the Company. Through the initial shareholders' agreement, NetBooster is guaranteed half the seats of the Board and
participates equally with other investors to all significant financial and operating decisions. The Group has
therefore determined that it has a joint control over this entity since May 8, 2014, even though it only
holds 10% of the interests the first year.
Therefore, as of December 31, 2014, the 10% interests in Media Diamond were accounted for under the
equity accounting method. The investment amounted to €85 thousand and is composed of the initial price
as well as the Group’s share of profit of Media Diamond for the eight-month period ended December 31,
2014.
In 2015, the shareholders’ agreement has been amended to guarantee NetBooster with an additional
Board seat, with a retroactive effect as of April 16, 2015. As the consequence, since this date, the Group
has determined it has control on the entity and the 50% interest in Media Diamond has been accounted
using the full consolidation method.
Derivative financial instrument (asset)
The call option described above was designated as a derivative instrument recognised at fair value
through profit and loss. As of May 8, 2014, it is initially recognised for €20 thousand which is its
acquisition price. As of December 31, 2014, the call option is re-measured at fair value and recognised for
€230 thousand in the consolidated balance sheet. Therefore, a €210 thousand gain arising from change

Consolidated Financial Statements | December 31, 2015
53 NB
in the fair value of the instrument is recognised in other financial income in the consolidated income
statement for the year ended December 31, 2014 (refer to Note 5.5).
The Group effectively exercised its call option on April 16, 2015, by acquiring a supplementary 40% stake
in Media Diamond for a final contractual price of €775 thousand and therefore derecognised the
derivative as of December 31, 2015. As of April 16, 2015, the fair value of the call option amounted to
€230 thousand, as the share price of Media Diamond remained stable between 31, 2014 and April 16,
2015. The derivative fair value previously recognised is transferred to the carrying amount of the joint-
venture.
Note 5.4: Non-current financial assets
As of December 31, 2013, non-current financial assets broke down as follows:
Investments in non-consolidated companies amounted to €16 thousand and related to Buzz
Lemon Holding and NetBooster Hong-Kong Holding.
Guarantee deposits and other receivables amounted to €532 thousand, including a €140
thousand guarantee for the Rue Dieu lease, where restitution was challenged by the lessor and
fully impaired by the Group, and a €215 thousand financial advance engaged at the end of 2013
by NetBooster Spain pursuant to a partnership with Media Diamond from the beginning of 2014.
Financial assets pledged as a guarantee against the bank endorsement obtained for the lease of
the premises at 4/6 Passage Louis Philippe in Paris amounted to €164 thousand.
Financial claims on non-consolidated entities included €290 thousand in relation with NetBooster
Brazil and €300 thousand in relation with NetBooster Hong-Kong.
Funds capitalised under the liquidity contract and the share buyback program amounted to €88
thousand.
As of December 31, 2014, non-current financial assets broke down as follows:

Consolidated Financial Statements | December 31, 2015
54 NB
Guarantee deposits and other receivables amounted to €416 thousand, including a €215
thousand of financial advance engaged at the end of 2013 by NetBooster Spain pursuant to a
partnership with Media Diamond from the beginning of 2014.
Financial assets pledged as a guarantee against the bank endorsement obtained for the lease of
the premises at 4/6 Passage Louis Philippe in Paris amounted to €164 thousand.
Other guarantee deposits related to Denmark for €82 thousand, to Germany for €65 thousand
and to Switzerland for €3 thousand.
Financial claims on non-consolidated entities included €290 thousand in relation with NetBooster
Brazil and €175 thousand in relation with NetBooster Hong-Kong, and are fully impaired at the
closing date.
Funds capitalised under the liquidity contract and the share buyback program amount to €162
thousand.
As of December 31, 2015, non-current financial assets broke down as follows:
Guarantee deposits related to France for €76 thousand, to Denmark for €76 thousand, to
Germany for €83 thousand and to Spain for €31 thousand and to Switzerland for €56 thousand
Financial assets pledged as a guarantee against the bank endorsement obtained for the lease of
the premises at 4/6 Passage Louis Philippe in Paris amounted to €164 thousand
Financial claims on non-consolidated entities included €175 thousand in relation with NetBooster
Hong-Kong, and are fully impaired at the closing date. Financial €290 thousand of NetBooster
Brasil were totally write off at the closing date.
Funds capitalised under the liquidity contract amount to €16 thousand
Note 5.5: Financial instruments
Financial assets and liabilities have been classified into categories that determine their basis of
measurement and, for items measured at fair value, whether changes in fair value are recognised in the
income statement or the statement of comprehensive income.

Consolidated Financial Statements | December 31, 2015
55 NB
Financial instruments (assets) by category
Financial instruments (liabilities) by category

Consolidated Financial Statements | December 31, 2015
56 NB
Note 5.6: Trade and other receivables
Fair values
The fair values of trade and other receivables approximate their carrying amounts.
Ageing analysis and impairment
The ageing analysis of trade receivables is as follows:
Movements on the Group provision for impairment of trade receivables are as follows:
Movements in allowances for impairment of trade receivables are included in cost of sales in the consolidated income statement. Provisions are generally recognised when the receivable is not expected to be recovered. Improvements to customer risk management, introduced in 2012, eliminated any significant depreciation in the course of 2014.
Currencies
The euro-equivalent values of the carrying amounts of the Group's foreign currency trade receivables are
shown below:

Consolidated Financial Statements | December 31, 2015
57 NB
Transferred receivables
As of January 1, 2013 and December 31, 2013, the carrying amount of the trade receivables includes
receivables which are subject to a factoring arrangement. Under this arrangement, the Group has
transferred the relevant receivables to the factor in exchange for cash and was prevented from selling or
pledging the receivables. However, according to IFRS, the Group has retained the main risk and rewards
of the transferred receivables. It has therefore continued to recognise the transferred assets in their
entirety in its balance sheet. The amount repayable under the factoring agreement is presented as
secured borrowings. The factoring contract expired on April 30, 2014, and was replaced by non-secured
facilities with the Group's banking partners.
The relevant carrying amounts are as follows:
Note 5.7: Other assets
(1) In 2013, other receivables include the factoring contract drawn up by NetBooster SA: 2,080 K€ of outstanding debt and 636K€ in a guarantee fund. These items no longer exist at 31 December 2014 because the NetBooster SA factoring contract was discontinued in the first half of 2014. In 2014 following the liquidation of companies in the TradeDoubler Search group, receivables with Bidbuddy were written off in the amount of 2.3 M€. This debt was offset by a 2.3 M€ write-off with Bidbuddy. Extraordinary income of 224 K€ was posted In 2015 other receivables related to mainly by credit note to be received in France for €80 thousand
(2) States receivables related to mainly by Tax research and CICE which are mainly non current assets

Consolidated Financial Statements | December 31, 2015
58 NB
Note 5.8: Cash and cash equivalents
As of December 31, 2014, the cash position was adversely affected by the late arrival of a bank transfer
from a customer in an amount of €1.3 million.

Consolidated Financial Statements | December 31, 2015
59 NB
Note 5.9: Share capital
As of December 31, 2015, the Company’s share capital amounted to €1,659 thousand, represented by
16,586,570 shares with a par value of €0.10. From January 1, 2013, changes in share capital have been
as follows:
Conversion right of convertible bonds
As of March 23, 2012, the Company issued convertible bonds, as described in Note 5.11.
During the years ended December 31, 2013, 2014 and 2015, 18 bonds, 20 bonds and 18 were converted
respectively in 450,000 shares, 500,000 shares and 450,000 shares, representing a total capital share
increase of €3.5 million.
Share capital increases
Refer to Note 1.2.
Securities giving access to share capital
The company issued certain securities (warrants and free shares) giving access to share capital. The
tables in note 6.4 provide a summary of the entitlements in circulation as December 31, 2015:

Consolidated Financial Statements | December 31, 2015
60 NB
Note 5.10: Other non-current provisions
The provision concerns litigations.
Litigation
As of January 1, 2013 and December 31, 2013, a €8 thousand provision for litigation was recognised as a
result of a dispute between the Company and the French tax authorities regarding a tax audit in 2009.
French tax authorities claimed for registration fees in connection with foreign companies’ ownership rights,
for a total amount of €850 thousand. The litigation outcome occurs in October 2014 and leads to the
reversal of the previously recognised provision and the recognition of a €136 thousand non-recurring
expense (refer to Note 6.6).
As of December 31, 2013, a €56 thousand provision was recognised as result of litigation between
NetBooster UK, a fully-owned subsidiary, and one of its employees. This provision was released during
the year ended December 31, 2014.
As of December 31, 2014, a €50 thousand provision was recognised concerning litigation with one
employee. As of December 31, 2015, management estimates the risk being the same.
As of December 31, 2015, a €56 thousand provision was recognised concerning some litigation with
employees. According to the risk defined by the lawyers, management estimates a maximum risk of €56
thousand.
Note 5.11: Borrowings

Consolidated Financial Statements | December 31, 2015
61 NB
Bank borrowings
As of December 31, 2014, bank borrowings included:
a €1,024 thousand borrowing in Denmark with a 9.25% interest rate (this borrowing was
reimbursed during the year ended December 31, 2015),
a €173 thousand borrowing in France with a 2.8% interest rate.
As of December 31, 2015, bank borrowings included:
a €470 thousand borrowing in France with CDN with a 2,25% interest rate and a €470 thousand
borrowing in France with BPI with a 3,27% interest rate. These two borrowings were initiated in
June and July 2015,
a €64 thousand borrowing in France with a 2.8 % interest rate.
Convertible bonds
In 2012, the Company renegotiated a share-convertible bond issue originally in 2007. The main terms of
the contract for convertible bonds are as follows:
Number of bonds: 232 (admitted for trading and listed on the Alternext market since March 28,
2007)
Par value of one bond: €62,500
Issue price of one bone: €62,500
Term of borrowing: 4 years
Annual interest rate: 3%
Gross actuarial yield rate in the event of non-conversion: 6.12%
Redemption in the event of non-conversion before the due date on March 23, 2016: redemption
payable on March 23, 2015 at the issue price plus a redemption premium of €8,543 per bond, i.e.
a total amount of €71,043 per bond
Conversion parity: 1 bond for 25,000 shares, i.e. €2.50 per share except when the volume
average weighted price (VAWP) exceeds €4.75 per share, in which case one bond entitles the
holder to a number of shares equal to 25.000 x 4.75/VAWP
In 2012 and 2013, 51 bonds were converted into shares. 20 other bonds were converted in 2014 and 18
were converted in 2015. As of December 31, 2015, the number of remaining bonds was 143, for a total
redemption premiums due on maturity of the shares of €1,221,649. See Note 5.9 for the impacts on share
capital.
The carrying amount of the convertible bonds and the derivative conversion option attached to the bonds
are as follows:
The carrying amount of the derivative conversion option amounts to its fair value. The derivative
conversion option is classified as non-current derivative financial instruments.

Consolidated Financial Statements | December 31, 2015
62 NB
Note 5.12: Current and deferred income tax
The current tax includes the CVAE tax («Contribution sur la valeur ajoutée des entreprises ») in France respectively for a total amount of €115 thousand, €128 thousand and €120 thousand, for the years ended December 31, 2015, December 31, 2014 and December 31, 2013. The tax on the Group’s profit before tax differs from the theoretical amount that would arise using the tax
rate applicable to profits in France (33.33%) as follows:
The tax charge relating to components of other comprehensive income is immaterial.
Deferred income tax
The analysis of deferred tax income and deferred tax liabilities is as follows:
The gross movement on the deferred income tax account is as follows:

Consolidated Financial Statements | December 31, 2015
63 NB
Most deferred tax assets are accounted for by expected tax savings from loss carryforwards held by the
Group’s subsidiaries. Deferred income tax assets are recognised for tax losses carried forwards to the
extent that the realisation of the related tax benefit through future taxable profits is probable.
As of December 31, 2015, the Group limited the probability of attribution of tax losses to three years after
2015.
The Group companies’ tax losses carried forwards are detailed as follows as of December 31, 2015:
With the exception of results in previous years, featuring non-recurring operating losses, NetBooster SA
has posted positive tax results since 2004. It has also been consolidated for tax purposes with its
subsidiary Pixidis since January 1, 2013, which is a substantially tax beneficiary.
The Guava Group elected to deploy fiscal integration for all the Danish companies within its scope of
consolidation.
NetBooster Italy has undergone considerable restructuring since 2009 to rectify its operational profitabi lity.
The company’s projected earnings will probably lead to the deployment of tax loss carryforwards over two
or three years.
In the first-half of 2012, NetBooster Spain underwent a merger with Evolnet, a company that has made
substantial gains since it joined the Group in 2008. This operation enabled it to use a portion of its tax
losses carried forwards in 2012, 2013 and 2014.
NetBooster Finland has undergone considerable restructuring since 2010. Its projected earnings will
probably lead to the deployment of a portion of tax loss carryforwards over two or three years.
Subsidiaries Dec 31, 2015
NetBooster SA 10 691
NetBooster Italy 367
NetBooster Finland 1 025
NetBooster Holding A/S 10 092
NetBooster Agency A/S 3 894
NetBooster Spain 265
NetBooster Sw eden 1 343
NetBooster UK 7 236
Tax losses carried forwards 34 913

Consolidated Financial Statements | December 31, 2015
64 NB
Note 5.13: Trade and other payables
The carrying amounts of trade and other payables are assumed to be the same as their fair values due to
their short-term nature.
Deferred income is composed of revenue spread out over the audit, operational and maintenance phases,
consulting services billed but still pending, media revenue and affiliation billed in advance.
Note 5.14: Other liabilities
(1) During the year ended December 31, 2014, the Group carried out the liquidation of some non-operational companies in the Trade Doubler Search group, acquired in 2011. These non-operational companies assumed a €2.6 million debt and conversely recognised a €2.3 million receivables, towards their previous parent company IMV. Following their liquidation, the €2.6 million debt was written off, and offset by the write-off of the €2.3 million receivables.
(2) A €1.7 million compensation claim was claimed against the Company by Mr. Raphaël Zier (former CEO) during the past years. The claim relates to the non-issuance of financial instruments in his favour during the exercise of his functions. Negotiations are in progress and as of December 31, 2015 managements best estimate of the risk amounted to €420 thousand and accrued this amount as other current liabilities in the consolidated balance sheet. The expense is booked in the “Other operating income and expenses – net” line item.

Consolidated Financial Statements | December 31, 2015
65 NB
NOTE 6: NOTES TO THE CONSOLIDATED STATEMENT OF INCOME
Note 6.1: Segment information
The Board of Directors examines the group’s performance both from a product and geographic
perspectives and has identified six reportable segments of its business:
France
United Kingdom
Germany and Switzerland which have comparable growth rates and similar growth margins
Northern Europe, comprising Denmark, Finland and Sweden which have comparable growth
rates and similar growth margins
Southern Europe, comprising Spain and Italy which have comparable growth rates and similar
growth margins
Middle East (Dubai)
In addition, segment information from a product perspective has been presented to give an overview of
the main activities. Consequently, the activities are the following:
Pay per Click (PPC) activity relates to the management of keywords and ad spaces for the
customers.
Search Engine Optimization (SEO) activity is a consulting activity relating to websites creation
and optimization.
Media activity relates to advertisement campaigns optimization through internet ad spaces and
retargeting (through Real Time Bidding).
Data activity comprises both CRM solutions (emailing and customer databases acquisition) and
data analytics solutions
Affiliate activity relates to the management of advertisements campaigns through affiliate
networks.
Design activity is the production of websites, advertisements (videos, banners), e-mails, or other
advertisement contents.
Social Media relates to advertisement retargeting on social networks.
The Board of Directors primarily uses a measure gross margin to assess the performance of the
operating segments. However, the Board of Directors also receives information about the segments’,
EBITDA, even if these information are not subject to specific review from the Board.
Segment information

Consolidated Financial Statements | December 31, 2015
66 NB
Reconciliation of non-current assets

Consolidated Financial Statements | December 31, 2015
67 NB
Addition information on products
Note 6.2: Other income from operations
Others are mainly some accruals for suppliers released from more than 5 years to clean the balance
sheet position.

Consolidated Financial Statements | December 31, 2015
68 NB
Note 6.3: Operating expenses
Employee benefits expense
External expenses

Consolidated Financial Statements | December 31, 2015
69 NB
Note 6.4: Share – based payments
The Company has issued share purchase warrants “Bon de souscription d’actions” or “BSAs” and free
shares.
Share purchase warrants (“Bons de souscription d’actions” or “BSAs”)
The following table summarizes the data relating to share purchase warrants:
Plans Date of award by the Board of directors
Number of outstanding BSAs Sub.price Ex. price
Jan 1, 2013
Dec 31, 2013
Dec 31, 2014
Dec 31, 2015
BSA 2009 Before 2012 78,170 0 0 0 - €2,26
BSA management / BSA MP
Dec 5, 2012 0 163,863 81,931 0 €0.0 €2,73
BSA 2014 May 12, 2014 0 0 1,175,000 1,175,000 €0.2 €2,42
Each warrant from those plans are convertible into 1 ordinary share.
BSA 2009 The BSAs were granted before January 1, 2013. They were never exercised and became not exercable
during the year ended December 31, 2013.
No IFRS 2 valuation has been performed as the vesting date was prior January 1, 2013 (Transition Date
to the IFRS).
BSA Management / BSA MP
The BSAs were granted during the Board of Directors of December 5, 2012, on the condition precedent of
the signature of the amendment on the sale agreement of Metapeople group to the Group (which
effectively happened on January 2013). They were granted as “earn out” payment due to two sellers of
Metapeople. There were 163,863 BSAs granted the same date into 2 plans (81,932 BSA-1 and 81,931
BSA-2). The BSA-1 were entirely exercised on January 21, 2014 and the BSA-2 were entirely exercised
on January 14, 2015.
The exercise of share purchase warrants is not subject to performance conditions. However, there is a
service condition under which the beneficiary must still be an employee or corporate officer of the
Company. These plans are qualified as “equity settled” under IFRS 2.
No IFRS 2 valuation has been performed as the BSA Management relate to the change of the 2012 earn-
out relating to metapeople acquisition. As this change was performed on December 5, 2012, ie before the
Transition Date to the IFRSs and that is not for the benefit of the two sellers, there is no expense to be
recorded in the years ended December 31, 2013 and 2014.

Consolidated Financial Statements | December 31, 2015
70 NB
BSA 2014
The BSAs were granted during the Board of Directors of May 14, 2014 for some of the NetBooster
corporate officers and the top management members. The subscription price for each BSA has been
fixed to €0.20 in accordance with an independent expert valuation and the exercise price equaled to
€2.42 which was the average closing share price on Alternext Paris on the 60 trading sessions before
May 12, 2014.
The BSAs were entirely subscribed by the beneficiaries for a total amount of €235 thousand recorded as
an issue premium by the Company in 2014.
The BSAs can’t be exercised during 18 months at the grant date, ie. they can be exercised starting
November 12, 2015.
The exercise of the BSAs is subject to performance and service conditions. There is a performance
condition under which the closing share price should exceed €3.30 for the 20 consecutive trading days
preceding the grant date (May 14, 2014) and the exercise date. There is also a service condition under
which the beneficiary must still be an employee of the Company. This plan is qualified as “equity settled”
under IFRS 2.
As the subscription price was determined as the fair value of the BSAs (determined by an independent
expert valuation), there is no expense to be recorded as share-based payments.
Free shares (“Actions gratuities” or “AGA”)
Ordinary shares may be issued by the Company to employees for no cash consideration. They are “free
shares”. All free shares plans are “equity-settled” according to IFRS 2.
The following table summarizes the data relating to free shares:
Plans Date of award by the Board of directors
Number of outstanding BSAs Vesting date
Jan 1, 2013
Dec 31, 2013
Dec 31, 2014 Dec 31, 2015
AGA Guava March 2, 2011 and May 13, 2011
340,583 0 0 0 March 2, 2013 and May 13, 2013
AGA February 7, 2012 7,500 7,500 7,500 0 February 7, 2012
AGA July 17, 2013 0 5,000 5,000 0 July 17, 2013
AGA 2013 October 14, 2013 0 30,000 30,000 0 October 14, 2015
AGA 2014 February 3, 2014 0 0 112,000 86,000 February 3, 2016
AGA DF November 12, 2014
0 0 12,500 0 November 12, 2016

Consolidated Financial Statements | December 31, 2015
71 NB
Conditions
AGA Guava
Eligible employees are employees of Guava subsidiary (339,582 free shares) and the former IT Director
(1,000 free shares). These free shares are subject to performance and service conditions:
There are some performance conditions linked to business results. There is also a service condition under which the beneficiaries must still be employees of the
Company as of March 2, 2013 (339,582 free shares) and May 13, 2013 (1,000 free shares) On March 4, 2013, and on July 17, 2013, at the end of the two-years’ service condition period, 139,168
and 1,000 share options were definitely granted to the beneficiaries of the plans respectively, through a
share capital increases.
AGA (awarded on February 7, 2012)
The then Chief Operating Officer was eligible to the plan. No condition was indicated to vest the free
shares. On March 31, 2014, 7,500 shares were definitely granted to the plan beneficiary through a share
capital increase of €750 (nominal of €0.1).
AGA (awarded on July 17, 2013)
The then Chief Operating Officer was eligible to the plan. The vesting of the free shares is subject to a
service condition under which the beneficiary must still be employee of the Company as of July 17, 2015.
These free shares were awarded definitely on 15/09/2016.
AGA 2013 There were 4 employees from the Group top management who were eligible to the plan. The vesting of
the free shares is subject to a service condition under which the beneficiaries must still be employees of
the Company as of October 14, 2015.
On December 21, 2015, at the end of the two-years’ service condition period, 30,000 share options were
definitely granted to the beneficiaries of this plan, through a share capital increases.
AGA 2014 There were 15 managers of the Group who were eligible to the plan.
The vesting of the free shares is subject to a service condition under which the beneficiaries must still be
employees of the Company as of February 3, 2016. This latter condition leads the outstanding free
shares being 86,000 as of December 31, 2015 (vs. 112,000 as of December 31, 2014).
AGA DF
One employee from the metapeople company was eligible to the plan.
The vesting of the free shares is subject to performance and service conditions:
There is a performance condition under which the Group should have expensed more than a certain amount of purchases with the supplier Facebook for the year ended December 31, 2014 and for the year ended December 31, 2015.
There is also a service condition under which the beneficiary must still be an employee of the Company as of November 12, 2016.
However, the employee eligible to the plan left the Company during the year ended December 31, 2015.

Consolidated Financial Statements | December 31, 2015
72 NB
Valuation methods of the free shares
The fair value of free shares was determined using the Black and Scholes model. The valuation methods
used to estimate the fair value of the free shares are presented below:
the share price is based on the closing quoted price of the ordinary shares at the grant dates; no turnover has been assumed the probability of reaching the non-markets conditions are estimated to be 100%.
For each plans, the share-based payments expenses are recognized on the vesting period.
Breakdown of the compensation expenses accounted for under IFRS 2 for the years ended December
2013, 2014 and 2015 (free shares)
€ in thousand
Plans 2015 2014 2013
AGA Guava 0 0 57
AGA (awarded on Feb 2012) 0 0 0
AGA (awarded on July 2013) 0 0 10
AGA 2013 22 28 6
AGA 2014 65 106 -
AGA DF -2 2 -
Total 85 135 74
Note 6.5: Depreciation and Amortization

Consolidated Financial Statements | December 31, 2015
73 NB
Note 6.6: Other operating income and expenses
The Group identified a limited number of items which are non-recurring, well identified, material due to the
significance of their nature and/or amount. These are listed separately in the income statement in “Other
operating income and expenses” in order to provide a better understanding if the financial performance of
the Group, as follows:
Note 6.7: Financial income and expenses
Note 6.8: Earnings per share
Basic earnings per share
In thousands of euros 2015 2014 2013
Income from sale of assets - net 0 353 0
Waiver of debt tradedoubler search - net 0 225 0
Research tax credit 2011 to 2013 0 225 0
Tax audit 0 -140 0
Restructuration costs -338 -431 -323
Gain on equity method revaluation 167 0 0
Company removed from the scope of consolidation (1) 189 0 0
Litigation (2) -420 0 0
Others -266 -92 -526
Other operating income and expenses - net -668 140 -849
(1) IMW has been liquidated in 2015 and removed from the scope of consolidation
(2) Provision for Zier Litigation

Consolidated Financial Statements | December 31, 2015
74 NB
Diluted earnings per share
NOTE 7: RELATED PARTIES
Related parties are considered to be:
Key management which includes the 8 members of the executive committee and the Board of
Directors
Media Diamond which is a joint-venture for NetBooster from May 8, 2014 to April 16, 2015.
Note 7.1: Key management compensation
The compensation expensed to key management for services is shown below:
Note 7.2: Media Diamond
The following transactions were carried with Media Diamond from May 8, 2014 to April 16, 2015:
The services were sold/purchased on an arm’s length basis.

Consolidated Financial Statements | December 31, 2015
75 NB
NOTE 8: UNRECOGNISED ITEMS
Note 8.1: Commitments issued
Pledge on financial instruments drawn up as a guarantee against the bank endorsement for the
lease drawn up by the Company
The Company arranged a pledge on marketable securities to a total value of €164 thousand. This
collateral stands against a €328 thousand bank guarantee for the Company in connection with the lease
drawn up by the Company for the premises at 4/6 passage Louis Philippe 75011 PARIS. This item was
recognised as non-current financial assets on the balance sheet.
Note 8.2: Events occurring after the reporting period
Refinancing of outstanding convertible bonds
The 21 March 2016, NetBooster has announced the closing of a landmark €20.7m financing agreement. The new senior secured facility consists of a €10.7m tranche that will be used to reimbourse an existing convertible bond that comes due on the 23rd of March and smaller outstanding loans, as well as a €10m tranche that is dedicated to finance our envisaged growth plans. The latter represents a key cornerstone of management’s promise to deliver continued strong growth and global expansion. The new arrangements offer NetBooster considerable flexibility, with 50% of the transaction coming in the form of a bullet type euro private placement maturing in 2022 and 50% in the form of a traditional amortising loan with a term of 5 years and 9 months. Credit du Nord was appointed Lead Arranger on the transaction and jointly structured it with Tikehau Investment Management’s NOVI I fund. Two other large European banks, BNP Paribas and Société Générale and a global player, HSBC, made up the rest of the pool.

Consolidated Financial Statements | December 31, 2015
76 NB
NOTE 9: SCOPE OF CONSOLIDATION
As of December 31, 2015

Consolidated Financial Statements | December 31, 2015
77 NB
NOTE 10: CONVERSION TO IFRS
For all periods up to and including the year ended December 31, 2014, the Company prepared its
consolidated financial statements in accordance with generally accepted accounting principles in France
(“French GAAP”). The Company decided to prepare for the first time consolidated financial statements in
accordance with International Financial Reporting Standards (“IFRS”) for the year ended December 31,
2015 and elected to use January 1, 2013 as the First-time Adoption Date of IFRS as adopted by the
European Union.
First-time adoption in accordance with IFRS 1
IFRS 1 requires full retrospective application of IFRS for the first-time adopters. However, it provides
some voluntary and mandatory exemptions from full retrospective applications.
Voluntary exemptions
Voluntary exemptions adopted by the Company are as follows:
Business combinations
Under IFRS 1, a first-time adopter may elect not to apply IFRS 3 “Business Combination” retrospectively
to past business combinations that occurred before the date of transition to IFRS. The Company has
elected to apply IFRS 3 prospectively from the date of transition. Accordingly, business combinations
completed prior to January 1, 2013 have not been restated, thus any goodwill arising from business
combinations which took place before this date is recognized at the carrying amount based on French
GAAP.
Exchange differences on translating foreign operations
Under IFRS 1, a first-time adopter may elect to deem the cumulative translation adjustments for foreign
operations to be zero at the date of transition. The Company has elected this exemption and has deemed
the cumulative amount of exchange differences on translating foreign operations to be zero as of January
1, 2013.
Mandatory exemptions
IFRS 1 prohibits retrospective application of IFRSs related to estimates, derecognition of financial assets
and financial liabilities, hedge accounting, classification and measurement of financial assets and non-
controlling interests. The Group applied the requirements of IFRSs on these items prospectively.
French GAAP to IFRS reconciliations
Upon transition to IFRS, the Company has adjusted amounts previously reported in its consolidated
financial statements prepared in accordance with French GAAP. The following reconciliations and notes
disclose the impact of adjustments made by the Group with respect to the transition from French GAAP to
IFRS on:
The balance sheet, including equity, as of January 1, 2013, December 31, 2013 and December
31, 2014;
The income statement and the cash flow statement for the years ended December 31, 2013 and
2014.

Consolidated Financial Statements | December 31, 2015
78 NB
French GAAP to IFRS reconciliation of the balance sheet
Reconciliation as of January 1, 2013
AS OF JANUARY 1, 2013
In thousands of euros
French
GAAP
Convertible
bondsFactoring
Employee
benefits
Currency
gains or
losses
Liquidity
programIFRS
ASSETS
Non-current assets
Goodw ill 24 934 24 934
Intangible assets 104 104
Property, plant and equipment 826 826
Non-current f inancial assets 1 408 1 408
Deferred income tax assets 1 690 193 4 1 887
Total non-current assets 28 962 193 4 29 159
Current assets
Trade and other receivables 34 540 1 219 35 759
Current income tax assets 255 255
Other current assets 4 212 (1 219) 2 993
Cash and cash equivalents 8 457 8 457
Total current assets 47 464 47 464
TOTAL ASSETS 76 426 193 4 76 623
EQUITY AND LIABILITIES
Equity attributable to owners of the parent
Ordinary shares 1 461 1 461
Share premium 27 676 27 676
Retained earnings and other reserves (14 083) (387) (7) (57) (24) (14 558)
Net profit (loss) for the period (3 966) (3 966)
Translation adjustments (57) 57 -
Total equity attributable to owners of the parent 11 031 (387) (7) (24) 10 613
Non-controlling interests - -
TOTAL EQUITY 11 031 (387) (7) (24) 10 613
Non-current liabilities
Post-employment benefits - 11 11
Other non-current provisions 11 11
Borrow ings 14 345 (1 434) 24 12 935
Derivative f inancial instruments - 2 014 2 014
Deferred income tax liabilities 25 25
Other non-current liabilities 447 447
Total non-current liabilities 14 828 580 11 24 15 443
Current liabilities
Borrow ings 520 520
Trade and other payables 42 349 42 349
Current income tax liabilities 286 286
Other current liabilities 7 412 7 412
Total current liabilities 50 567 50 567
TOTAL LIABILITIES 65 395 580 11 24 66 010
TOTAL EQUITY AND LIABILITIES 76 426 193 4 76 623

Consolidated Financial Statements | December 31, 2015
79 NB
Reconciliation as of December 31, 2013
AS OF DECEMBER 31, 2013
In thousands of euros
French
GAAPImpairment
Share-
based
payments
Convertible
bondsFactoring
Employee
benefitsLeases
Currency
gains or
losses
Liquidity
programIFRS
ASSETS
Non-current assets
Goodw ill 20 814 4 120 24 934
Intangible assets 94 94
Property, plant and equipment 923 923
Non-current f inancial assets 806 806
Deferred income tax assets 1 252 (115) 4 53 1 194
Total non-current assets 23 889 4 120 (115) 4 53 27 951
Current assets
Trade and other receivables 28 236 4 057 32 293
Current income tax assets 512 512
Other current assets 5 253 (2 716) 2 537
Cash and cash equivalents 7 509 7 509
Total current assets 41 510 1 341 42 851
TOTAL ASSETS 65 399 4 120 (115) 1 341 4 53 70 802
EQUITY AND LIABILITIES
Equity attributable to owners of the parent
Ordinary shares 1 543 1 543
Share premium 29 368 (99) 29 269
Retained earnings and other reserves (18 070) 74 (346) (7) (57) (44) (18 450)
Net profit (loss) for the period (5 243) 4 120 (74) 674 (1) (107) (629)
Translation adjustments (71) 57 (14)
Total equity attributable to owners of the 7 527 4 120 230 (8) (107) (44) 11 719
Non-controlling interests - -
TOTAL EQUITY 7 527 4 120 230 (8) (107) (44) 11 719
Non-current liabilities
Post-employment benefits - 12 12
Other non-current provisions 719 (653) 66
Borrow ings 13 251 (551) 12 700
Derivative f inancial instruments - 859 859
Other non-current liabilities 223 160 383
Total non-current liabilities 14 193 (345) 12 160 14 020
Current liabilities
Borrow ings 377 1 341 44 1 762
Trade and other payables 37 852 37 852
Current income tax liabilities 346 346
Other current liabilities 5 103 5 103
Total current liabilities 43 678 1 341 44 45 063
TOTAL LIABILITIES 57 871 (345) 1 341 12 160 44 59 083
TOTAL EQUITY AND LIABILITIES 65 398 4 120 (115) 1 341 4 53 70 802

Consolidated Financial Statements | December 31, 2015
80 NB
Reconciliation as of December 31, 2014
AS OF DECEMBER 31, 2014
In thousands of euros
French
GAAP
Business
combinationImpairment
Share-based
payments
Convertible
bonds
Employee
benefitsLeases
Currency
gains or
losses
Grants IFRS
ASSETS
Non-current assets
Goodw ill 17 658 (843) 8 119 24 934
Intangible assets 448 (40) 408
Property, plant and equipment 783 783
Investments accounted for using the
equity method- 85 85
Non-current f inancial assets 821 (78) 743
Deferred income tax assets 2 039 (79) 477 5 74 13 2 529
Total non-current assets 21 749 (915) 8 119 477 5 74 (27) 29 482
Current assets
Trade and other receivables 32 332 32 332
Current income tax assets 597 597
Derivative f inancial instruments - 230 230
Other current assets 913 913
Cash and cash equivalents 5 567 5 567
Total current assets 39 409 230 39 639
TOTAL ASSETS 61 158 (685) 8 119 477 5 74 (27) 69 121
EQUITY AND LIABILITIES
Equity attributable to owners of the
parent
Ordinary shares 1 602 1 602
Share premium 30 606 (182) 30 424
Retained earnings and other reserves (23 313) (699) 4 120 135 362 (8) (107) (57) (19 566)
Net profit (loss) for the period 21 14 3 999 (135) (1 134) (3) (41) (27) 2 694
Translation adjustments 47 57 104
Total equity attributable to owners
of the parent8 963 (685) 8 119 (954) (11) (147) (27) 15 258
Non-controlling interests - -
TOTAL EQUITY 8 963 (685) 8 119 (954) (11) (147) (27) 15 258
Non-current liabilities
Post-employment benefits - 16 16
Other non-current provisions 50 50
Borrow ings 11 092 262 11 354
Derivative f inancial instruments - 1 169 1 169
Deferred income tax liabilities 147 147
Other non-current liabilities - 222 222
Total non-current liabilities 11 289 1 431 16 222 12 958
Current liabilities
Borrow ings 1 152 1 152
Trade and other payables 36 781 36 781
Current income tax liabilities 258 258
Other current liabilities 2 714 2 714
Total current liabilities 40 905 40 905
TOTAL LIABILITIES 52 194 1 431 16 222 53 863
TOTAL EQUITY AND LIABILITIES 61 157 (685) 8 119 477 5 75 (27) 69 121

Consolidated Financial Statements | December 31, 2015
81 NB
French GAAP to IFRS reconciliation of the income statement
Reconciliation for the year ended December 31, 2013
Reconciliation for the year ended December 31, 2014
o Notes to the French GAAP to IFRS reconciliations
Note (a) - Business combination
The business combinations for the years ended December 31, 2013 and December 31, 2014 relate to
Media Diamond and Guava.
Media Diamond
On May 8, 2014, the Company acquired a 10% stake in the Spanish company Media Diamond. The
shareholders’ agreement also included a call option granted to the Company for the acquisition of an

Consolidated Financial Statements | December 31, 2015
82 NB
additional 40% stake in March 2015. In its consolidated financial statements under French GAAP for the
year ended December 31, 2014, the Group did not consolidate Media Diamond as it held 10% of the
shares and the investment is presented as a long-term asset in the balance sheet.
In accordance with IFRS 10, IFRS 11 and IAS 28, an analysis should be conducted in order to assess if
the Group has control, joint control or significant influence over an investee in order to apply the correct
IFRS accounting treatment for the recognition of the investment.
Following such analysis, the Group has concluded that Media Diamond is a joint-venture and should be
accounted for under the equity accounting method in its IFRS consolidated financial statements.
Furthermore, according to IAS 39, the call option granted to the Company for the acquisition of an
addition 40% stake in Media Diamond should be designed as a derivative instrument, measured at fair
value in the consolidated balance sheet, with changes in fair value being accounted through profit or loss.
As a consequence, as of December 31, 2014, these changes resulted in:
The reclassification of the investment in Media Diamond, previously recognized as a non-current
financial asset in the consolidated balance sheet, to:
o “Investments accounted for using the equity method” for an amount of €58 thousand
which represents the purchase price of the 10% stake in Media Diamond and related-
acquisition costs; and
o “Derivative financial instrument” for an amount of €20 thousand which represents the fair
value of the call option.
An adjustment to profit (loss) before tax for €237 thousand composed of:
o €27 thousand in order to recognize the Group’s share of profit in Media Diamond for the
period from May 8, 2014 to December 31, 2014, with a corresponding increase of the
investment accounted for using the equity method in the consolidated balance sheet; and
o €210 thousand in order to recognize the gain arising from the change in the call option
fair value between May 8, 2014 and December 31, 2014, with a corresponding increase
of the derivative financial instrument in the consolidated balance sheet.
The related tax effects decreased deferred tax assets by €79 thousand as of December 31, 2014, with a
corresponding effect in net profit (loss).
Guava
In 2011, further to a step-by-step acquisition, NetBooster held a 90.49% interest ownership in the Guava
group. In April 18, 2014, NetBooster decided to purchase the remaining non-controlling stake. In its
consolidated financial statements under French GAAP for the year ended December 31, 2014, the Group
recognized an additional goodwill corresponding to the acquisition price, including acquisition-related
costs) less the amount of equity acquired.
In accordance with IFRS 3, acquisition-related costs must be expensed as incurred. Furthermore,
transactions with non-controlling interests that do not result in a change of control are treated as
transactions with equity owners of the Group and result in an adjustment between the carrying amounts
of the controlling and non-controlling interests. Any difference between the amount of the adjustment to
non-controlling interests and the consideration paid or received is recognized in a separate reserve within
equity attributable to owners of the Group.
As a consequence of the IFRS transition, as of December 31, 2014, the Group derecognize the additional
goodwill under French GAAP for €843 thousand with the following corresponding adjustments:
An adjustment to net profit (loss) for €144 thousand, composed of:
o an additional €27 thousand expense corresponding to the acquisition-related costs that
had been capitalized under French GAAP; and

Consolidated Financial Statements | December 31, 2015
83 NB
o the reversal of the €117 thousand income recognized under French GAAP as previous
losses of the subsidiary were full recognized in equity attributable to owners of the Group.
An adjustment to the Group’s reserve for the remaining amount.
Note (b) - Impairment
In the Group’s consolidated financial statements under French GAAP, goodwill was amortized on a
straight-line basis. Further to annual amortisation, the Group performed impairment tests at the end of
each reporting period in order to identify and record any additional depreciation.
In accordance with IAS 36, goodwill is no longer amortized but is tested for impairment annually, or more
frequently if events or changes in circumstances indicate that it might be impaired. However, as explained
in Note 10.1, IFRS 1 states that any goodwill arising from business combinations which took place before
the date of transition to IFRS is recognized at the carrying amount based on French GAAP, and may not
be restated to adjust any previous amortisation of goodwill. In addition, in the context of an IFRS
transition, a first-time adopter should test goodwill for impairment at the date of transition to IFRS.
As of January 1, 2013, the impairment test carried out does not indicate that goodwill shall be impaired.
As a consequence, the net book value of goodwill recognized under French GAAP at this date remained
the same in the opening balance sheet of the Group’s IFRS consolidated financial statements.
The Group has reversed goodwill amortisation charges recognized under French GAAP for the periods
beginning on and after January 1, 2013, resulting in:
An adjustment to goodwill for €4,120 thousand as of December 31, 2013 and €8,119 thousand as
of December 31, 2014 ;
An adjustment to net profit (loss) for €4,120 thousand for 2013 and €3,999 thousand for 2014.
Furthermore, impairment tests were performed as of December 31, 2013 and December 31, 2014, and
did not indicate that goodwill shall be impaired. Therefore, no depreciation charge has been recognized.
Note (c) – Share-based payments
The Company grants free shares and warrants (BSA) to its managers and representatives. In the Group’s
consolidated financial statements under French GAAP, free shares and warrants did not generate any
expense and were recorded as a capital increase only when exercised for the amount of the exercise
price paid.
In accordance with IFRS 2, equity-settled shared-based payments to employees are measured at the fair
value of the equity instruments at the grant date. This fair value is recognised in the consolidated income
statement on a straight-line basis over the vesting period, based on the Group’s estimates of equity
instruments expected to vest, with a corresponding increase in equity.
As a consequence, the IFRS adjustments have consisted in an adjustment to net profit (loss) for €(74)
thousand for 2013 and €(135) thousand for 2014, with a corresponding impact on the Group’s retained
earnings and other reserves.
Note (d) – Convertible bonds
In its consolidated financial statements under French GAAP, the Group fully recognized its share-
convertible bond in borrowings. Additionally, a provision for non-conversion of convertible bonds was
recognized in 2013 because of the unfavourable trajectory of the share listing and was reversed in 2014.
In accordance with IAS 39, compound financial instruments must be analysed to distinguish and record
separately a debt component and an equity component, if applicable. In addition, embedded derivatives
of a compound financial instrument are recorded separately from the host instrument.
Following such analysis, the Group’s convertible bond was qualified as a hybrid financial instrument
recognized in borrowings, with an embedded derivative for the convertible option recognized in derivative

Consolidated Financial Statements | December 31, 2015
84 NB
financial instruments (liability). The valuation of the financial debt and the embedded derivative have been
done as of January 1, 2013, December 31, 2013 and December 31, 2014, resulting in:
An adjustment to borrowings for €(1,434) thousand as of January 1, 2013, €(551) thousand as of
December 31, 2013 and €262 thousand as of December 31, 2014 , corresponding to the
derecognition of the previous debt under French GAAP, offset by the recognition of the host
instrument under IFRS, initially at fair value and subsequently on an amortised cost basis using
the effective interest method.
An adjustment to derivative financial liabilities for €2,014 thousand as of January 1, 2013, €859
thousand as of December 31, 2013 and €1,169 thousand as of December 31, 2014 in order to
recognize the embedded convertible option at fair value.
An adjustment to other non-current provisions for €(653) thousand as of December 31, 2013 in
order to release the provision for non-conversion accounted under French GAAP.
An adjustment to profit (loss) before tax for €1,012 thousand in 2013 and €(1,701) in 2014,
corresponding to the revaluation of interest expenses based on the effective interest method, the
change in fair value of the derivative financial instrument and the release of the provision for non-
conversion and its reversal under French GAAP.
The related tax effects impacted deferred tax assets for €193 thousand as of January 1, 2013, €(115) as
of December 31, 2013 and €477 as of December 31, 2014, with a corresponding effect in net profit (loss).
Note (e) – Employee benefits
In its consolidated financial statements under French GAAP, the Group did not account for any provision
relating to post-employment benefits and treated these items as off-balance sheet commitments.
In accordance with IAS 19, the Group should recognize a liability for defined benefit plans in the
consolidated balance sheet. In addition, current and past service cost is recognized in net profit (loss).
Actuarial gains and losses related to defined benefit plan obligations are recognized in other
comprehensive income.
As a consequence, these changes resulted in:
An adjustment to post-employment benefits for €11 thousand as of January 1, 2013, €12
thousand as of December 31, 2013 and €16 thousand as of December 31, 2014;
An adjustment to profit (loss) before tax for €(1) thousand in 2013 and €4 thousand in 2014.
The related tax effects impacted deferred tax assets for €4 thousand as of January 1, 2013, €4 thousand
as of December 31, 2013 and €5 as of December 31, 2014, with a corresponding effect in net profit (loss).
Note (f) – Leases
In the Group’s consolidated financial statements under French GAAP, rents (even in case of rent-free
periods) are expensed according to the contractual repayment schedule.
In accordance with IAS 17, rental expenses and rent-free periods must be recognized on a straight-line
basis over the expected lease term.
As a consequence, this change resulted in an adjustment to other non-current liabilities for €160
thousand as of December 31, 2013 and €61 thousand as of December 31, 2014 with a corresponding
impact in net profit (loss), due to the Group’s free rents amortization over the expected rent terms.
The related tax effects impacted deferred tax assets for €53 thousand as of December 31, 2013 and €74
as of December 31, 2014, with a corresponding effect in net profit (loss).

Consolidated Financial Statements | December 31, 2015
85 NB
Note (g) – Currency gains or losses
In the Group’s consolidated financial statements under French GAAP, any conversion difference arising
from the translation of the financial statements of the Group’s foreign companies to euros was recognized
in shareholders’ equity under “translation adjustments”.
In accordance with IAS 21, all exchange differences resulting from the translation of the financial
statements of the Group’s entities into the presentation currency shall be recognized in other
comprehensive income. In addition, as explained in Note 10.1, IFRS 1 states that a first-time adopter may
elect to deem the cumulative translation adjustments for foreign operations to be zero at the date of
transition.
As a result, these changes resulted in:
The derecognition of past cumulative translation adjustments in equity for €57 thousand as of
January 1, 2013, December 31, 2013 and December 31, 2014 with a corresponding impact in
retained earnings and other reserves.
The recognition of translation adjustments in OCI for €(14) thousand in 2013 and €118 thousand
in 2014.
Note (h) – Grants
The Company is entitled to French research tax credit. For the years ended December 31, 2011 to 2013,
expenditures eligible for the French research tax credit related to research costs. For the year ended
December 31, 2014, they related to development costs recognized as intangible assets. In its
consolidated financial statements under French GAAP, the research tax credit was recognized in the
consolidated balance sheet as a receivable. When the tax credit was in relation to operating charges for
the year, it was recognized in the consolidated income statement.
In accordance with IAS 20, a distinction should be made between the research tax credit associated with
research costs which do not comply with the criteria of capitalization of IAS 38 and the research tax credit
associated with capitalized development costs. The first should be considered as a grant related to
income and recognized in the consolidated income statement. The second should be recognized as a
grant related to assets presented as a deferred income or as a deduction from the carrying amount of the
asset and recognized in the consolidated income statement over the life of the depreciable asset.
As a consequence, as the research tax credit for the year 2014 is considered as a grant related to assets,
the Group has recognized it as a deduction from the carrying amount of the related intangible asset, for
an amount of €50 thousand. In addition, the amortization of this research tax credit amounted to €10
thousand in 2014.
Note (i) – Liquidity program
According to the liquidity program contract, the Group can cancel the contract starting the 24th month of
the contract, ie starting May 2014. As the cancellation option did not exist as of January 1, 2013 and
December 31, 2013, the Group reclassified €24 thousand as of January 1, 2013 and €44 thousand as of
December 31, 2014 from retained earnings and other reserves to borrowings in its IFRS consolidated
balance sheet. These amounts correspond to the maximum amount of the contract still available.
Note (j) – Factoring
The Group drew up a factoring contract from 2012 to 2014. In its consolidated financial statements under
French GAAP, the receivables transferred to the factor entity were derecognized from the trade
receivables.
In accordance with IAS 39, the Group can derecognize an asset only if it transfers substantially all the
risks and rewards of ownership of the asset.

Consolidated Financial Statements | December 31, 2015
86 NB
Following the analysis of the terms of the factoring contract according to IFRS criteria, the Group has
concluded it should not derecognize the receivables transferred to the factor entity under IFRS. As a
consequence, the transferred receivables have been recognized back in the IFRS consolidated balance
sheet and the rights to draw on lines of credit and the guarantee deposit have been credited.
Note (k) – Revenue
In its consolidated financial statements under French GAAP, revenue from media buying activities was
fully recognized in the consolidated income statement, except revenue made with French customer
subject to the “Sapin law” which was not recognized as NetBooster acts as the agent of its client when
purchasing advertising place.
In accordance with IAS 18, revenue includes only the gross inflows of economic benefits received and
receivable by the entity on its own account. Therefore, in an agency relationship, if the Group is an agent
acting as an intermediary earning a fee or a commission in return for arranging the provision of services
on behalf a principal, amounts collected are not revenue. Instead, revenue is the amount of commission.
For some additional customers in its media buying activities, the Group act as an agent and should
recognize revenue based on the net amount earned, resulting in a reclassification of €18,670 thousand in
2013 and €19,440 thousand in 2014 from revenue to cost of sales.
Note (l) – CVAE
In the Group’s consolidated financial statements under French GAAP, the CVAE (Cotisation sur la Valeur
Ajoutée des Entreprises), contribution which is based on the added value generated by the Group’s
French entities, was accounted for in the operating income.
According to IAS 12, as the CVAE is a tax based on added value, it can be considered in the scope of
IAS 12. Consequently, the Group has an accounting option to present it under “income taxes”. As a result,
in its consolidated income statement under IFRS, the Group has proceeded to the reclassification of €120
thousand for 2013 and €128 thousand for 2014 from operating profit (loss) to income tax.
NOTE 11: AUDITOR’S FEES
The following table shows the amount of auditor’s fees included in the Group’s consolidated income
statement for the year. The fees shown apply to fully consolidated subsidiaries.
In thousands of euros 2015 2014 2013
Audit
Statutory audit fees, certif ication, auditing of the accounts -95 -97 -92
- Parent company -65 -55 -53
- Subsidiaries -30 -42 -39
Fees for services directly linked to the Statutory Auditor's
mission -86 -85 -90
- Parent company 0 0 0
- Subsidiaries -86 -85 -90
Sub-total -181 -182 -182
Other services rendered by auditors' networks to fully-
consolidated subsidiaries
Tax -3 -2 -2
Other -42 -23 -31
Sub-total -45 -26 -33
Total fees paid to the statutory auditor -226 -208 -215


