
Analyzing the Social and Economic Returns of Laboratoria’s Bootcamp

2ANALYZING THE SOCIAL AND ECONOMIC RETURNS OF LABORATORIA’S BOOTCAMP 2020
April 2021
Analyzing the Social and Economic Returns of Laboratoria’s Bootcamp.
This document was created by Laboratoria.Author: Daniela SarzosaDesign: Begoña Hernando
In collaboration with: Mariana Costa, Francisca Lanusse, Francesca León and Karen Kelly.
©Laboratoria

3ANALYZING THE SOCIAL AND ECONOMIC RETURNS OF LABORATORIA’S BOOTCAMP 2020
Executive Summary
Introduction
Laboratoria’s Multilevel Impact Individual Impact Industry Impact Societal Impact Understanding Our Impact
Cost-Benefit Analysis Present Discounted Value of Benefits Calculating Benefits of a 5 and 30 Year Timeframe Cost of Investment Economic Return of the Bootcamp Financing of Bootcamp Graduate Repayment Earned Revenue from Companies Philanthropic Revenue
Competitive Analysis What Makes Laboratoria Unique? Bootcamp Comparison
Conclusions
Annex
Content
45
6
9
26
30
32

4ANALYZING THE SOCIAL AND ECONOMIC RETURNS OF LABORATORIA’S BOOTCAMP 2020
Executive Summary
In an effort to better understand Laboratoria’s impact, in this paper we present an analysis that describes the multidimensional nature of the bootcamp's impact and quantifies the economic benefits received by our graduates. This study is an effort to describe and measure the transformation our students experience after participating in a program that prepares them to access high quality, well-paid jobs and strong career prospects in the technology industry.
In addition to describing the different mechanisms through which Laboratoria ignites change, this paper presents the results of a cost-benefit analysis, following the Robin Hood Foundation approach, whose objective is to quantify Laboratoria’s bootcamp economic return. We found that in just over a year, through their salaries, working graduates receive the total amount of the investment that Laboratoria has made on their behalf. For every dollar invested in the bootcamp, a social return of $4.57 is created in a 5 year time frame. The financial impact these women experience is the result of a combination of factors: they develop the skills necessary to succeed in a high-paying industry, they only pay for the education received if the ultimate job placement goal is achieved, and thanks to the support of our donors, they do not pay for the total investment cost needed for the program to operate.
The analysis shows how Laboratoria’s investment in women who have not been able to start a professional career translates into significant financial benefits for them, as well as social and economic benefits for society as a whole.

5ANALYZING THE SOCIAL AND ECONOMIC RETURNS OF LABORATORIA’S BOOTCAMP 2020
Laboratoria’s mission is to empower women who dream of a better future to start and grow transformative careers in technology. Our goal is to help women overcome the barriers that prevent them from starting a professional career that allows them to access high quality jobs. We do this by providing an immersive six-month bootcamp in technical and life skills for women from underserved backgrounds who have not been able to start a professional career yet. After the program we connect our students with quality software developer and UX designer jobs where they can kick-start their careers, and foster a strong community of alumnae who support each other’s growth as future leaders of the tech sector. Our graduates are building transformational careers for themselves in tech, while filling in the enormous talent and gender gap in the sector and contributing to its inclusive growth.
Since our launch in Lima, Peru in 2014, Laboratoria has scaled to open training centers in Chile, Mexico, Brazil and Colombia. We have trained over 1,900 women, placing 79% of them in tech jobs in Latin America and abroad. We are now a source of talent for over 600 leading companies across sectors and industries, from retail and banking to logistics and fintech. Through our work we are helping all sorts of organizations - from large corporations to tech startups and software factories - find the technical talent they need to grow their teams while bringing the diversity that helps build better work cultures and products.
Thousands of anecdotes, testimonies and data collected through time could be used to demonstrate how Laboratoria’s bootcamp has contributed to changing the lives of the women who decide to participate in the program and the people surrounding them. For those of us who have the responsibility of quantifying, documenting and sharing all the dimensions of our impact, this is a challenging but rewarding exercise. This analysis is an attempt to measure, understand and share with our community of partners and supporters the impact our bootcamp is having in the lives of the women we serve across Latin America.
Introduction
Introduction

6ANALYZING THE SOCIAL AND ECONOMIC RETURNS OF LABORATORIA’S BOOTCAMP 2020
Laboratoria is committed to designing and delivering an educational experience that allows students to develop skills that companies in Latin America’s growing tech sector are searching for. This means assuming the responsibility of facilitating an education service that allows Latin American women to enter or re-enter the labor market with better salary conditions and benefits than the ones they had prior to Laboratoria. We understand that the educational experience we want to provide must have a tangible and measurable impact on the professional and economic situation of graduates. They are the ones who invest their time, effort and resources to be part of our bootcamp and we are co-responsible for translating that investment into a positive economic return in the future.
We firmly believe that the individual transformation that is enabled by Laboratoria’s bootcamp contributes to more prosperous and wealthier societies. Laboratoria’s impact goes beyond the employability and financial empowerment that graduates experience. There are several different mechanisms through which Laboratoria ignites change. We could think of Laboratoria’s bootcamp impact on three different layers or dimensions: the individual level, the labor market level and the societal level.
Individual ImpactLaboratoria’s impact on women who go through the program is achieved because they acquire highly demanded digital skills in the tech industry and they develop the socioemotional skills to succeed as professionals. Additionally, our graduates develop the confidence to apply to high quality and highly remunerated jobs, changing their views of what they see possible for their future. Through Laboratoria, they have direct access to these types of jobs by building connections with hiring companies and a cohort of other professional women that will facilitate their successful inclusion in the tech sector. The skills they acquire in the bootcamp and the connections created increase their probability of being employed and their future earning potential. Graduates who
Laboratoria’s Multilevel Impact
7ANALYZING THE SOCIAL AND ECONOMIC RETURNS OF LABORATORIA’S BOOTCAMP 2020
get a job in the tech industry, characterized by competitive salaries and good career development opportunities, achieve higher levels of financial autonomy as their salaries increase considerably.
Industry ImpactWhen analyzing Laboratoria’s impact at the company or industry level we can see that women who are hired in entry-level tech positions become agents of change in their organizations. Perceptions and gender norms change in the tech industry as Laboratoria’s graduates help the tech sector become more gender inclusive. Companies count on a more diverse talent base that fosters inclusion and often outperforms other less diverse teams, creating digital products that fulfill the needs of a wider variety of users. Furthermore, Laboratoria’s graduates’ presence in the job market reduces talent acquisition costs for companies that find a greater pipeline of qualified women who join the pool of applicants to tech positions.
Societal ImpactLaboratoria’s impact goes beyond the individual and industry scenario given that society as a whole also benefits. Laboratoria’s graduates become role models for other women who have been pushed aside from selecting careers in technology1. Having female role models in the sector constructs identity bridges that motivate more women to consider the tech sector in their occupational choices. As wage levels are substantially lower in predominantly female occupations, having more women working in the tech sector is a way to address the gender wage gap, which in Latin America is one of the highest in the world. Furthermore, the type of skills a knowledge economy needs to create value through the design of products and services are the ones Laboratoria’s students acquire during bootcamp, and the ones more women need to develop in order to occupy positions with highly competitive salaries and growth opportunities. Building these skills in more people is also in line with the needs of a growing digital economy. In such a way, Laboratoria contributes to the regional digital transformation process by not only ensuring that the digital ecosystem has the necessary talent to operate and grow, but by assuring that these skills are developed by populations that are traditionally underrepresented in the labour market.
At the societal level, Laboratoria’s social impact can also be seen from the perspective of contributing to transitioning more women to the formal economy. Only around 32% of our graduates were receiving an income
1 For more information go to this publication by Laboratoria and SAP Mexico that shows the adversities faced by women when they try to incorporate themselves in Mexico’s technology sector.

8ANALYZING THE SOCIAL AND ECONOMIC RETURNS OF LABORATORIA’S BOOTCAMP 2020
at the moment they applied to Laboratoria and 26% of those who had a job reported to be informal workers. A higher female participation in the formal labor market has an important positive impact in the cities in which Laboratoria operates. We could think of positive changes for local governments who will experience an increase in their tax payers base or for graduates’ families who will benefit from a higher income and access to health insurance coverage and other social benefits.
Understanding Our ImpactThis paper is an effort to quantify and share detailed evidence of how Laboratoria’s impact works at the individual level. It is through the individual transformation of our graduates that our impact is amplified to wider audiences, and that is why we want to invest more time analyzing what that impact really looks like.
Traditionally, we have gathered information about our students from the first point of contact we have with them when they apply to the program, throughout the bootcamp and after graduation. We do so through a baseline survey and periodic follow up surveys. When comparing our students’ economic situation before and after the bootcamp, there is a significant change. This is why a large part of our impact indicators have been based on pre-post program comparisons. From the start, Laboratoria has tracked two main indicators in order to quantify our impact on women's lives: the job placement rate of graduates and the salaries they attain upon graduation, together with the comparison of pre and post program salary levels.
In order to better understand our impact, we decided that it was necessary to perform a detailed analysis of the pre and post bootcamp financial situation of our graduates and to compare our bootcamp with other similar educational alternatives in the region. We know that Laboratoria’s graduates experience a significant salary increase, but what is the actual return of Laboratoria’s bootcamp on other dimensions over time? How long does it take for a graduate to recover the investment made in the program? How does our impact compare to other bootcamps in the region? Marketwise, is our bootcamp competitive? In the following sections we present a cost-benefit analysis and a competitive analysis that will help us answer these questions.

9ANALYZING THE SOCIAL AND ECONOMIC RETURNS OF LABORATORIA’S BOOTCAMP 2020
The purpose of this analysis is to go beyond the pre-post salary comparison indicator traditionally used to measure the impact on Laboratoria graduates’ earnings. Following the Robin Hood Foundation (RHF) approach, we will calculate the bootcamp’s economic return through a cost-benefit analysis from the perspective of both Laboratoria and its graduates. The analysis will allow us to quantify the monetary return of each dollar invested for operating the bootcamp. The economic return is calculated using the following formula:
Present discounted value of benefits (earning boost)Cost of Investment
As the formula shows, the numerator consists of calculating the net present value of future benefits. For this exercise, benefits are defined as the difference between salaries post bootcamp and salaries pre bootcamp for those graduates that got a job after graduation. The denominator is the total cost, which Laboratoria incurs for running the program. Because our graduates are the only actors for whom we will calculate the program benefits, we can consider the total cost of the program to be the investment needed to create the economic value perceived by our working graduates. In the following sections we will present how we calculate each component of the formula.
Present discounted value of benefitsLaboratoria’s graduates are a group of women who have many shared experiences regarding the social and economic barriers they have faced to achieve successful professional careers. However, even if these barriers are something they do have in common, they still represent a highly diverse group. Some of them obtained a college degree in the past, while others never finished high school. Some of them have not had any work experience before coming to our bootcamp and others have worked for more than a decade in various industries. Some of them are mothers,
Cost-benefit Analysis

10ANALYZING THE SOCIAL AND ECONOMIC RETURNS OF LABORATORIA’S BOOTCAMP 2020
a portion of them come from rural areas and their ages range from 18 to 54. The way in which Laboratoria’s training program changes these women's lives is as diverse as their professional, academic and social backgrounds. Laboratoria’s financial impact is no exception.
We chose a total of eight cohorts to run the analysis. In order to have representation from the several markets where we operate, we are working with data from two cohorts from each of our centers. These are the two last cohorts whose placement season already ended (six months after graduation) and that took place before the COVID-19 pandemic. For each cohort, we calculated the monthly earnings difference (post-pre Laboratoria) for each graduate who got a job in the tech sector after the bootcamp. From these eight cohorts we had a total of 324 graduates with an 84% placement rate.
Around 70% of our graduates from these cohorts were unemployed or reported that they were working without receiving an income before Laboratoria (usually supporting a family business). For the vast majority of this 70%, we had information about the monthly salary received during their last paid working experience and used it as the baseline salary for the analysis. For those graduates for whom we did not have baseline data for their monthly income pre Laboratoria because they have never had an income, we used a proxy of the median salary level of admitted students with similar characteristics (site, previous education and age). To calculate this proxy we used around 335 data points from admitted students for whom we have income data previous to Laboratoria. Graduates for whom we used this proxy represent around 20% of the total sample chosen for the analysis. We recognize that doing this will cause an understatement of the financial benefits received by graduates since we will assign a previous salary to students who were not receiving any income. However, there are a couple of reasons we believe this is necessary. First, our graduates could have found a job even if they did not go through the program. We believe that assigning a pre salary value for these graduates will allow us to do a more reasonable analysis, especially in the long term. Second, using proxies for the pre Laboratoria income will eventually allow us to compare our financial impact with other education institutions. These institutions do not necessarily work with a population similar to the one Laboratoria works with, which is characterized by higher than the average unemployment rates or socioeconomic vulnerability levels.
The RHF cost-benefit methodology mimics randomized control trial methodologies to calculate the present discounted value of benefits as they take into account the control group or counterfactual performance. The idea is to discount the benefit’s value by what would have happened to our students without the program. If one of our graduates would have

11ANALYZING THE SOCIAL AND ECONOMIC RETURNS OF LABORATORIA’S BOOTCAMP 2020
not passed through Laboratoria’s program, she could still experience an increase in her salary in a one year time frame. To have a more “clean” estimate of the boost in income that Laboratoria causes, we needed to subtract from the benefit’s value the amount of salary increase these women would have experienced without Laboratoria. Using panel data from national household surveys and grouping women by specific demographic characteristics, we compared these groups’ average monthly salary in two consecutive years2. The counterfactual was defined as the monthly salary percentage increase from one year to another. We raised our estimate for the baseline (pre-salary) by these percentages to adjust for the counterfactual. Differences in the counterfactuals used responded to differences in graduates’ demographic characteristics.
The diversity described previously reflects itself in the variation of monthly earning differences that each student experienced individually. Age, previous education and work experience distribution among graduates are just some of the characteristics that differentiate the financial boost after the bootcamp. The individual differences consequently drive profound cohort variations in terms of the financial impact perceived by each one of them. Additionally, intrinsic characteristics of the market and the industry of sites in which we operate, and variations in cohort sizes also contribute to different cohort results. For example, post salaries received by graduates from Mexico City are higher than the ones from Lima, yet the average pre Laboratoria income was lower for Mexico City. This means that skills acquired by Mexico’s graduates will cause a higher earning boost than the one experienced by Lima’s graduates.
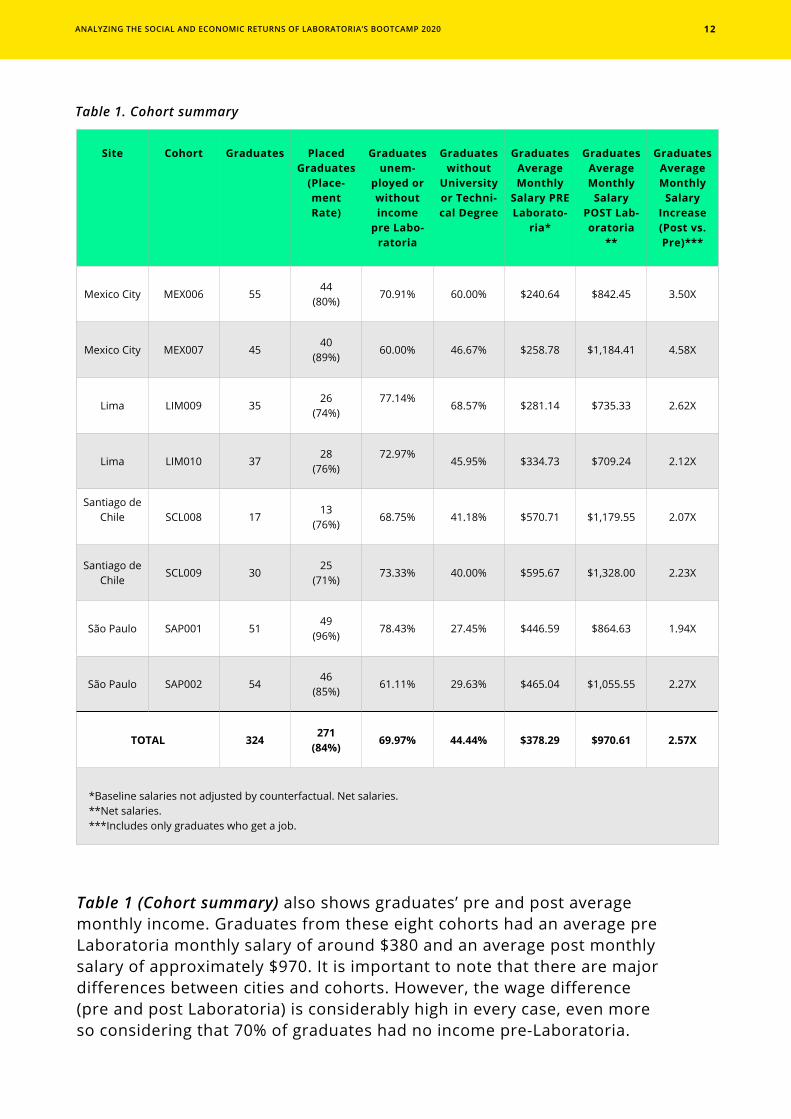
Before presenting the value of benefits, in the following table you will find the total number of graduates and placed graduates for the cohorts chosen. Additionally, we have included some indicators that speak about our graduates’ profile: the percentage of graduates who were unemployed or didn’t receive any income before Laboratoria and the percentage of graduates who do not have a college or technical degree.
2 For Peru we used Encuesta Nacional de Hogares (ENAHO), for Brazil we used Pesquisa Nacional por Amostra de Domicílios (PNAD), for Mexico we used Encuesta Nacional de Ocupación y Empleo (ENOE) and for Chile we used Encuesta Nacional de Empleo (ENE). For all household surveys we used 2017 and 2018 data.
12ANALYZING THE SOCIAL AND ECONOMIC RETURNS OF LABORATORIA’S BOOTCAMP 2020
Table 1. Cohort summary
Site Cohort Graduates Placed Graduates
(Place-ment Rate)
Graduates unem-
ployed or without income
pre Labo-ratoria
Graduates without
University or Techni-cal Degree
Graduates Average Monthly
Salary PRE Laborato-
ria*
Graduates Average Monthly
Salary POST Lab-oratoria
**
Graduates Average Monthly
SalaryIncrease (Post vs. Pre)***
Mexico City MEX006 5544
(80%)70.91% 60.00% $240.64 $842.45 3.50X
Mexico City MEX007 4540
(89%)60.00% 46.67% $258.78 $1,184.41 4.58X
Lima LIM009 3526
(74%)77.14%
68.57% $281.14 $735.33 2.62X
Lima LIM010 3728
(76%)72.97%
45.95% $334.73 $709.24 2.12X
Santiago de Chile SCL008 17
13(76%)
68.75% 41.18% $570.71 $1,179.55 2.07X
Santiago de Chile
SCL009 3025
(71%)73.33% 40.00% $595.67 $1,328.00 2.23X
São Paulo SAP001 5149
(96%)78.43% 27.45% $446.59 $864.63 1.94X
São Paulo SAP002 5446
(85%)61.11% 29.63% $465.04 $1,055.55 2.27X
TOTAL 324271
(84%)69.97% 44.44% $378.29 $970.61 2.57X
*Baseline salaries not adjusted by counterfactual. Net salaries.**Net salaries. ***Includes only graduates who get a job.
Table 1 (Cohort summary) also shows graduates’ pre and post average monthly income. Graduates from these eight cohorts had an average pre Laboratoria monthly salary of around $380 and an average post monthly salary of approximately $970. It is important to note that there are major differences between cities and cohorts. However, the wage difference (pre and post Laboratoria) is considerably high in every case, even more so considering that 70% of graduates had no income pre-Laboratoria.

13ANALYZING THE SOCIAL AND ECONOMIC RETURNS OF LABORATORIA’S BOOTCAMP 2020
These women went through a six-month training, which gave them what they needed to develop a lifetime career in a high paying sector. All cohorts from the sample experienced a salary increase of 90% or more in less than a year (6 months of study + up to 6 months of job search. Six months is the maximum length of the placement period). This salary increase corresponds only to graduates who were placed after the bootcamp.
Furthermore, we believe that the training our graduates receive will allow them not only to get a job, but to actually develop a long-lasting career in the tech sector. We run post-program follow-up surveys at 6, 12 and 18 months after graduation in order to assess how their socio-economic and professional situation has evolved. Taking a look at our 12 month survey, we can see that from the total number of respondents, which represents around 46% of all graduates, around 82% of graduates are working and the vast majority of them are still working in the tech sector. In addition, from the most recent cohorts at Laboratoria that have answered the 12-month survey, we found that around 67% of graduates who were working reported they did so at the same company where they began their first job. These numbers encouraged us to run the present value of benefits exercise for a 5 year time-frame as we feel confident that a considerable percentage of our graduates will still be working in the sector. We will also present the results for a 30-year timeframe analysis considering that our impact is not only restricted to the first years after graduation. We believe that Laboratoria’s experience shifts our graduates' professional trajectory in such a way that their earning potential over their lifetime is radically increased.
CALCULATING BENEFITS OF A 5-YEAR AND 30-YEAR TIMEFRAME
In order to account for the longer-term benefits our graduates experience, we are calculating the present discounted value of benefits for a 5-year and 30-year timeframe. A couple of assumptions were made in order to do this. Because follow-up surveys aren’t answered by the totality of graduates, we do not know exactly how many of them are working after a certain period of time and we also do not have exact information on their salary trajectory. Therefore, the follow-up information presented above on the percentage of working graduates and the income levels might be biased. The profile of graduates who take the time to answer the follow-up surveys might differ from that of graduates who did not respond. However, as a result of our constant interactions with our alumnae community, we know that only a small percentage of graduates who found a job after graduation will stop working in the tech sector after some time, and the majority of our working

14ANALYZING THE SOCIAL AND ECONOMIC RETURNS OF LABORATORIA’S BOOTCAMP 2020
graduates who keep developing their careers see their salaries grow over time. These two phenomena are likely to have opposite effects on the value of benefits received by graduates in the long run. We might expect that having fewer working graduates in the tech sector diminishes the benefits value in the future, but for those who keep working, wages are expected to rise and hence the value of benefits. This means that for calculating benefits on a 5-year and 30-year timeframe we would need to make assumptions about the percentage of graduates who are still working several years after graduation and the salary levels these graduates attain.
To address our need for data to run our calculations on a longer timeframe and to make these assumptions as informed as possible, we decided to launch the Alumnae Community Census in October of 2020. The census was open to all our graduates and active students. This was the perfect moment to reach out to graduates who graduated from the bootcamp more than two years ago and from whom we didn’t have data regarding their current status. We had a total of 624 answers between active students and graduates. We managed to get 32% of all graduates since Laboratoria launched its first cohort in 2015 to answer the survey. The census was also very helpful since our official follow-up surveys only go until 18 months after graduation and for the first time we were able to hear from more than 200 graduates who graduated in 2018 or earlier and for whom we didn’t have systematic data on their work status, salary, or interests.
From the data collected around the employment status of our graduates, we found out that around 77% of them are working full time and an additional 10% is working either part time, doing freelance or owns her own business. This means that 87% of the alumnae who answered the survey are economically active and generating an income. From the total number of graduates who are working, 96% continue to do so from a role related to the world of technology and 21% are leading a team. The following table shows some of the census results.

15ANALYZING THE SOCIAL AND ECONOMIC RETURNS OF LABORATORIA’S BOOTCAMP 2020
Table 2. 2020 Community Census
Months After Graduation
Number of Graduates
Graduate Re-sponse Rate
Share of Graduates
Working
Share of Unemployed
Graduates Ac-tively looking
for a Job
Share of Unemployed
Graduates NOT looking
for a Job
Average Monthly
Salary
6 months or less 237 45.57% 62.04% 36.11% 1.85% $774.25
Between 7 and 12 months
232 48.28% 93.75% 5.36% 0.89% $885.71
Between 13 and 18 months
304 40.79% 89.52% 8.06% 2.42% $996.62
Between 19 and 24 months
106 30.19% 96.88% 3.13% 0.00% $878.23
Between 25 and 36 months
385 23.64% 92.31% 3.30% 4.40% $1,246.13
Between 37 and 48 months
303 17.82% 94.44% 3.70% 1.85% $1,151.96
Between 49 and 60 months
213 22.07% 89.36% 10.64% 0.00% $1,056.55
61 months or more
28 21.43% 83.33% 16.67% 0.00% $1,350.00
TOTAL 1,808 31.75% 86.41% 11.67% 1.92% $1,003
We continue to face the problem that the census was not answered by the totality of graduates but it is still a valuable source of information for the purposes of the analysis we are conducting. From Table 2 it is possible to see that the percentage of working graduates after 12 months of graduation is never below 83%, that the share of working graduates seems to go down and that average salaries increase over time. These findings are consistent with our 12-month follow up surveys where our placement rate stands above the 80%. The share of working graduates decreases from 93.75% (around 1 year after graduation) to 83.33% (more than 5 years after graduation). Data collected from the census or the follow-up surveys is not enough to know for sure what percentage of graduates stop working year after year. However, considering that a small number of graduates will stop working in tech and perceiving the benefits

16ANALYZING THE SOCIAL AND ECONOMIC RETURNS OF LABORATORIA’S BOOTCAMP 2020
of the bootcamp throughout the years, we must assume a churn rate. Since we do not have an exact one, we have chosen to run the analysis with both a 2% and a 5% annual churn rate, as we predict reality is probably somewhere in between. This means we will discount 2% and 5% of the present value of benefits every year due to possible benefits lost because of graduates leaving their jobs. We chose these two churn rates to run a sensitivity analysis to get a sense of how results change within this churn rate range.
Additionally, the census data shows that graduates achieve better salaries as they have more experience and time working in the sector. Graduates with approximately 2 years in the market reported an average salary of $878 while those who have more than 5 years in the market reported an average salary of $1350. This is a 53.76% average salary increase in a 3 year timeframe. Yet, there is not a clear trend that allows us to calculate the annual benefits increase that our graduates experience after the first year of being active in the labor market. Some years they might have a promotion and experience a 20% salary increase, but some others might not receive an increase at all. In order to complete the exercise we assumed that their benefits increased on an annual basis at the average salary increase rate of the market. The average salary increase rate of the market for Mexico, Peru, Chile and Brazil was 6.6%, 5.2%, 4% and 4.6% respectively. To simplify, we used an annual increase rate of 5% for all cohorts (regional average salary increase).
In order to calculate the present value of benefits received in different time periods and to make them comparable, we used an annual discount rate of 3%. One of the issues found on the different SROI methodologies is that there is no consensus on the discount rate that should be applied. There is no standard method in the SROI literature to calculate the discount rate, but we followed the literature recommendation to use the risk-free rate, which in the United States would be the 10-year Treasury bond rate. For 2018, the risk-free rate was 2.91%.
Tables 3A & B (Present Discounted Value of Benefits) show the 1-year, 5-year and 30-year discounted cumulative value of benefits for two different scenarios of annual churn rate (2% and 5%). See the results by cohort and by graduates placed. The counterfactual has already been accounted for. Taking SAP002 as an example, the cohort had 54 graduates and 46 of them were employed within 6 months of graduation. Calculating the difference between post and pre bootcamp salaries, after discounting the counterfactual, we can see that the cohort received an extra $323.25K after one year of work and using the 2% annual churn rate. If we use a 5% annual churn rate, results show that SAP002 received an extra $313.35K after one year of work. To get an overview per student, we divided that

17ANALYZING THE SOCIAL AND ECONOMIC RETURNS OF LABORATORIA’S BOOTCAMP 2020
quantity by the number of working graduates (placed graduates) and found that, on average, a graduate from the second cohort in São Paulo received $7.03K or $6.81K (2% or 5% churn rate respectively) extra in her first year thanks to Laboratoria’s bootcamp.
Tables 3A & B. Present Discounted Value of BenefitsTable 3A. Results by Cohort
Site Cohort Placed Graduates
Annual Churn Rate
Year ONE Impact: Present
Discounted Val-ue of Benefits
COHORT
Year FIVE Impact: Present
Discounted Val-ue of Cumulative
BenefitsCOHORT
Year THIRTY Impact: Present
Discounted Val-ue of Cumulative
BenefitsCOHORT
Mexico City MEX006 44
2% $333.12K $1,662.35K $9,854.08K
5% $322.92K $1,515.87K $6,322.78K
Mexico City MEX007 40
2% $473.69K $2,363.86K $14,012.48K
5% $459.19K $2,155.56K $8,990.98K
Lima LIM009 26
2% $113.21K $564.97K $3,349.04K
5% $109.75K $515.19K $2,148.88K
Lima LIM010 28
2% $109.68K $547.32K $3,244.41K
5% $106.32K $499.09K $2,081.75K
Santiago de Chile
SCL008 13
2% $83.35K $415.96K $2,465.75K
5% $80.80K $379.31K $1,582.12K
Santiago de Chile
SCL009 25
2% $233.89K $1,167.17K $6,918.76K
5% $226.73K $1,064.32K $4,439.36K
São Paulo SAP001 49
2% $241.39K $1,204.59K $7,140.59K
5% $234.00K $1,098.45K $4,581.69
São Paulo SAP002 46
2% $323.25K $1,613.10K $9,562.10K
5% $313.35K $1,470.95K $6,135.43K
TOTAL 271
2% $1,911.58K $9,539.33K $56,547.20K
5% $1,853.06K $8,698.74K $36,283.00K

18ANALYZING THE SOCIAL AND ECONOMIC RETURNS OF LABORATORIA’S BOOTCAMP 2020
Table 3B. Results by graduate placed
Site Cohort Placed Graduates
Annual Churn Rate
Year ONE Impact: Present
Discounted Val-ue of Benefits
COHORT
Year FIVE Impact: Present
Discounted Val-ue of Cumulative
BenefitsCOHORT
Year THIRTY Impact: Present
Discounted Val-ue of Cumulative
BenefitsCOHORT
Mexico City MEX006 44
2% $7.57K $37.78K $223.96K
5% $7.34K $34.45K $143.70K
Mexico City MEX007 40
2% $11.84K $59.10K $350.31K
5% $11.48K $53.89K $224.77K
Lima LIM009 26
2% $4.35K $21.73K $128.81K
5% $4.22K $19.81K $82.65K
Lima LIM010 28
2% $3.92K $19.55K $115.87K
5% $3.80K $17.82K $74.35K
Santiago de Chile
SCL008 13
2% $6.41K $32.00K $189.67K
5% $6.22K $29.18K $121.70K
Santiago de Chile
SCL009 25
2% $9.36K $46.69K $276.75K
5% $9.07K $42.57K $177.57K
São Paulo SAP001 49
2% $4.93K $24.58K $145.73K
5% $4.78K $22.42K $93.50K
São Paulo SAP002 46
2% $7.03K $35.07K $207.87K
5% $6.81K $31.98K $133.38K
TOTAL 271
2% $7.05K $35.31K $208.66K
5% $6.84K $32.10K $133.89K
19ANALYZING THE SOCIAL AND ECONOMIC RETURNS OF LABORATORIA’S BOOTCAMP 2020
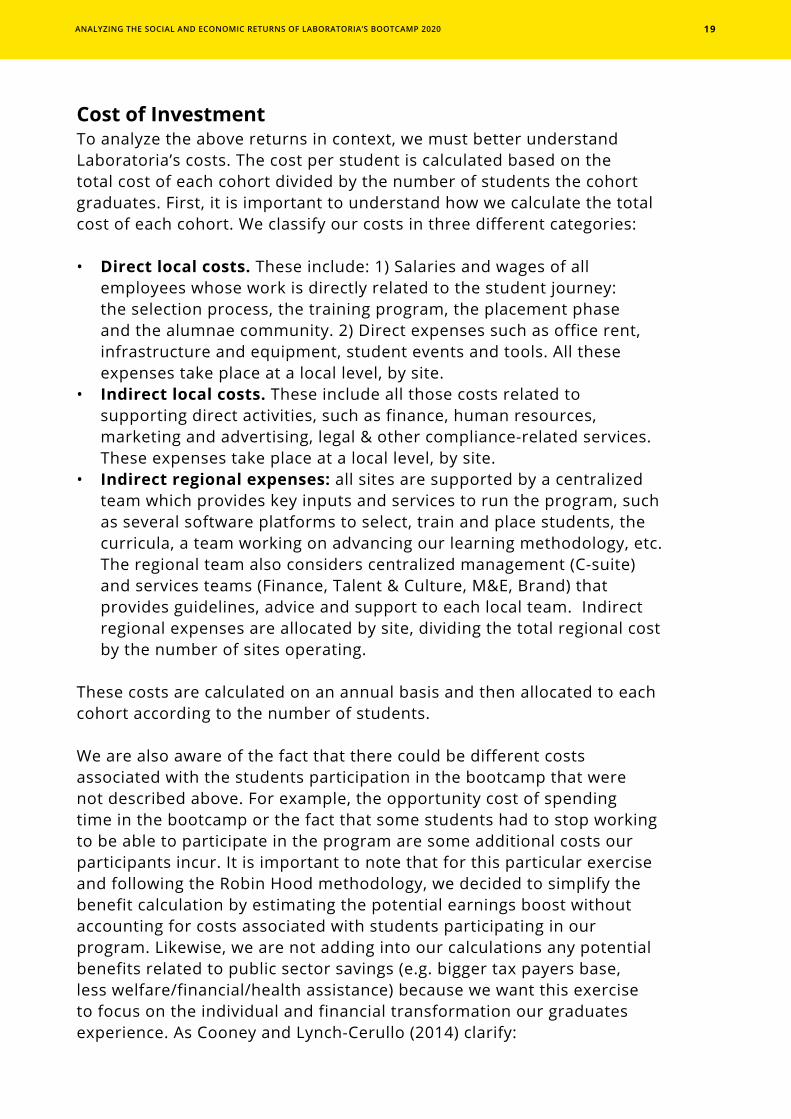
Cost of Investment To analyze the above returns in context, we must better understand Laboratoria’s costs. The cost per student is calculated based on the total cost of each cohort divided by the number of students the cohort graduates. First, it is important to understand how we calculate the total cost of each cohort. We classify our costs in three different categories:
• Direct local costs. These include: 1) Salaries and wages of all employees whose work is directly related to the student journey: the selection process, the training program, the placement phase and the alumnae community. 2) Direct expenses such as office rent, infrastructure and equipment, student events and tools. All these expenses take place at a local level, by site.
• Indirect local costs. These include all those costs related to supporting direct activities, such as finance, human resources, marketing and advertising, legal & other compliance-related services. These expenses take place at a local level, by site.
• Indirect regional expenses: all sites are supported by a centralized team which provides key inputs and services to run the program, such as several software platforms to select, train and place students, the curricula, a team working on advancing our learning methodology, etc. The regional team also considers centralized management (C-suite) and services teams (Finance, Talent & Culture, M&E, Brand) that provides guidelines, advice and support to each local team. Indirect regional expenses are allocated by site, dividing the total regional cost by the number of sites operating.
These costs are calculated on an annual basis and then allocated to each cohort according to the number of students.
We are also aware of the fact that there could be different costs associated with the students participation in the bootcamp that were not described above. For example, the opportunity cost of spending time in the bootcamp or the fact that some students had to stop working to be able to participate in the program are some additional costs our participants incur. It is important to note that for this particular exercise and following the Robin Hood methodology, we decided to simplify the benefit calculation by estimating the potential earnings boost without accounting for costs associated with students participating in our program. Likewise, we are not adding into our calculations any potential benefits related to public sector savings (e.g. bigger tax payers base, less welfare/financial/health assistance) because we want this exercise to focus on the individual and financial transformation our graduates experience. As Cooney and Lynch-Cerullo (2014) clarify:

20ANALYZING THE SOCIAL AND ECONOMIC RETURNS OF LABORATORIA’S BOOTCAMP 2020
In this way, the calculated impacts are not strictly speaking social returns according to the economic understanding that undergirds the traditional CBA approach. This approach is preferred as it allows them to compare similar programs to see how they performed against each other on the most salient metric for the organization – how well the intervention translated into higher earning power for the client group. (p.375)
Our primary goal is for our graduates to secure full-time employment in the tech sector. Despite this, there is often 10% to 20% that do not do so for a number of reasons. Even in that case, women who finish the program take with them valuable new technical and soft skills which strengthen their professional profile. This is why our cost per graduate is a primary indicator. For analysis and financial purposes, however, we also measure the cost per graduate placed. Table 4 (Cost per cohort and graduate) shows an example of how we calculate the cost per graduate and per graduate placed in our latest cohorts.
Table 4. Cost per cohort and graduate
Site Cohort Graduates Direct Local
Costs per Cohort
Indirect Local
Costs per Cohort
IndirectRegional Costs per
Cohort
Total Cost per Cohort
Total Cost per
Graduate
Total Cost per
Graduate Placed
Mexico City MEX006 55 $172.9K $67.8K $125.3K $366.0K $6.65K $8.32K
Mexico City MEX007 45 $169.1K $75.6K $127.0K $371.7K $8.26K $9.29K
Lima LIM009 35 $111.2K $37.8K $70.5K $219.5K $6.27K $8.44K
Lima LIM010 37 $111.2K $37.8K $70.5K $219.5K $5.93K $7.84K
Santiago de Chile
SCL008 17 $75.0K $26.9K $56.4K $158.3K $9.31K $12.18K
Santiago de Chile
SCL009 30 $65.7K $23.4K $49.4K $138.5K $4.62K $5.54K
São Paulo SAP001 51 $44.9K $45.7K $161.1K $251.7K $4.94K $5.14K
São Paulo SAP002 54 $135.5K $79.5K $148.1K $363.1K $6.72K $7.89K
TOTAL 324 885.5K 394.5K 808.3K 2,088.3K $6,44K $7.71K

21ANALYZING THE SOCIAL AND ECONOMIC RETURNS OF LABORATORIA’S BOOTCAMP 2020
Economic return of the bootcampNow that we have calculated the present discounted value of benefits (earning boost) and the cost of investment, we can present the monetary return for every dollar invested per student placed. In Table 5 (Economic return of the bootcamp) we present the results for the cohorts analyzed. For every cohort we have included the results for both annual churn rate scenarios, 2% and 5%.
Site Cohort Annual Churn Rate
Year 1 Impact:
Present Dis-counted Value
of BenefitsPWG
Year 5 Impact: Present Dis-
counted Value of Benefits
PWG
Year 30 Impact: Present
Discounted Value of Ben-
efits - PWG
Cost of Investment
- PWG
Year 1 Impact:
Monetary Return per $
invested
Year 5 Impact:
Monetary Return per $
invested
Year 30 Impact:
Monetary Return per $
invested
Number of Years
to recover 100% of
the invest-ment
Mexico City
MEX0062% $7.57K $37.78K $223.96K
$8.32K$0.91 $4.54 $26.92 1.10
5% $7.34K $34.45K $143.70K $0.88 $4.14 $17.28 1.13
Mexico City
MEX0072% $11.84K $59.10K $350.31K
$9.29K$1.27 $6.36 $37.70 0.78
5% $11.48K $53.89K $224.77K $1.24 $5.80 $24.19 0.81
Lima LIM0092% $4.35K $21.73K $128.81K
$8.44K$0.52 $2.57 $15.26 1.94
5% $4.22K $19.81K $82.65K $0.50 $2.35 $9.79 2.00
Lima LIM0102% $3.92K $19.55K $115.87K
$7.84K$0.50 $2.49 $14.78 2.00
5% $3.80K $17.82K $74.35K $0.48 $2.27 $9.48 2.06
Santiago de Chile
SCL0082% $6.41K $32.00K $189.67K
$12.18K$0.53 $2.63 $15.58 1.90
5% $6.22K $29.18K $121.70K $0.51 $2.40 $9.99 1.96
Santiago de Chile
SCL0092% $9.36K $46.69K $276.75K
$5.54K$1.69 $8.43 $49.95 0.59
5% $9.07K $42.57K $177.57K $1.64 $7.68 $32.05 0.61
São Paulo SAP0012% $4.93K $24.58K $145.73K
$5.14K$0.96 $4.79 $28.37 1.04
5% $4.78K $22.42K $93.50K $0.93 $4.36 $18.20 1.08
São Paulo SAP0022% $7.03K $35.07K $207.87K
$7.89K$0.89 $4.44 $26.33 1.12
5% $6.81K $31.98K $133.38K $0.86 $4.05 $16.90 1.16
TOTAL Annual Churn Rate
1 Year Impact: Present
Discounted Value of
Benefits (8 cohorts)
5 Year Impact: Present
Discounted Value of
Benefits (8 cohorts)
30 Year Impact: Present
Discounted Value of Benefits
PWG
Cost of In-vestment
(8 cohorts)
Year 1 Impact:
Monetary Return
Year 5 Impact:
Monetary Return
Year 30 Impact:
Monetary Return
Number of Years
to recover 100% of the in-
vestment
2% $1,911.58K $9,539.33K $56,547.20K$2,088.30K
$0.92 $4.57 $27.08 1.09
5% $1,853.06K $8,698.74K $36,283.00K $0.89 $4.17 $17.37 1.13
*PWG = Per working graduate
Table 5. Economic return of the bootcamp

22ANALYZING THE SOCIAL AND ECONOMIC RETURNS OF LABORATORIA’S BOOTCAMP 2020
Column 8 of Table 5 (Economic return of the bootcamp) shows the return in the first year for every dollar invested in the bootcamp for each graduate placed. Following the example of SAP002 and the 2% annual churn rate scenario, we see that for every dollar invested a working graduate will receive $0.89 in return after one year and $4.44 after five years. For the 5% annual churn rate scenario, SAP002 presents a return of $0.86 and $4.05 for years one and five respectively. For the cohorts chosen, the minimum return per graduate placed is for LIM010 where we see that every dollar invested will return $0.50 in the first year and $2.49 in the first five years. For all cohorts, the monetary return for the first year is positive and the number of years needed to recover the total amount of investment is between 1.09 years and 1.13 years. Under the assumptions made for this exercise we find that these 271 placed graduates, in a timeframe of five years, will receive as a whole a total amount between $8.70 million and $9.54 million more as a result of the bootcamp. In the lifetime analysis (30-year) the assumptions made play an even more important role and we recognize that the results might differ significantly from what could happen in the future. However, from the exercise we could estimate that for every dollar invested in the bootcamp, students will receive in return from $17.37 to $27.08 after thirty years.
Financing of BootcampNow that we have seen the return of the bootcamp for our working graduates, we want to explain how Laboratoria finances the total costs incurred to run the program.
Laboratoria is a non-profit organization and as explained in the introduction of this paper, our priority is attaining a significant impact in the reduction of the gender gap in tech and in contributing to the employability of lower-income women. To make our program accessible, we have a repayment model where graduates only pay for the bootcamp once they graduate and only if they get a job as developers. To cover the investment needed to reach ~500 students a year (our current capacity), we rely on three different sources of income: the repayment from our graduates, additional earned revenue from external companies, and philanthropic funding.
GRADUATE REPAYMENT
Our repayment program has been designed to fit our students’ financial situation making it affordable for them and taking into consideration that they often become the primary source of income for their families after completing Laboratoria’s bootcamp. Laboratoria charges no up-front fees to the students, and works

23ANALYZING THE SOCIAL AND ECONOMIC RETURNS OF LABORATORIA’S BOOTCAMP 2020
with every graduate to help them secure a suitable job during the six months after graduation. If during this timeframe a job is not found, then the graduate is no longer required to pay anything back to Laboratoria, unless both parties agree to extend this period. The cost they pay is a fixed amount of around $4k, varying by site depending on the conditions of the market and Laboratoria’s history. We have a deferred payment period of 24 months, with flexibility to pause payments if graduates lose their jobs or face a family emergency.
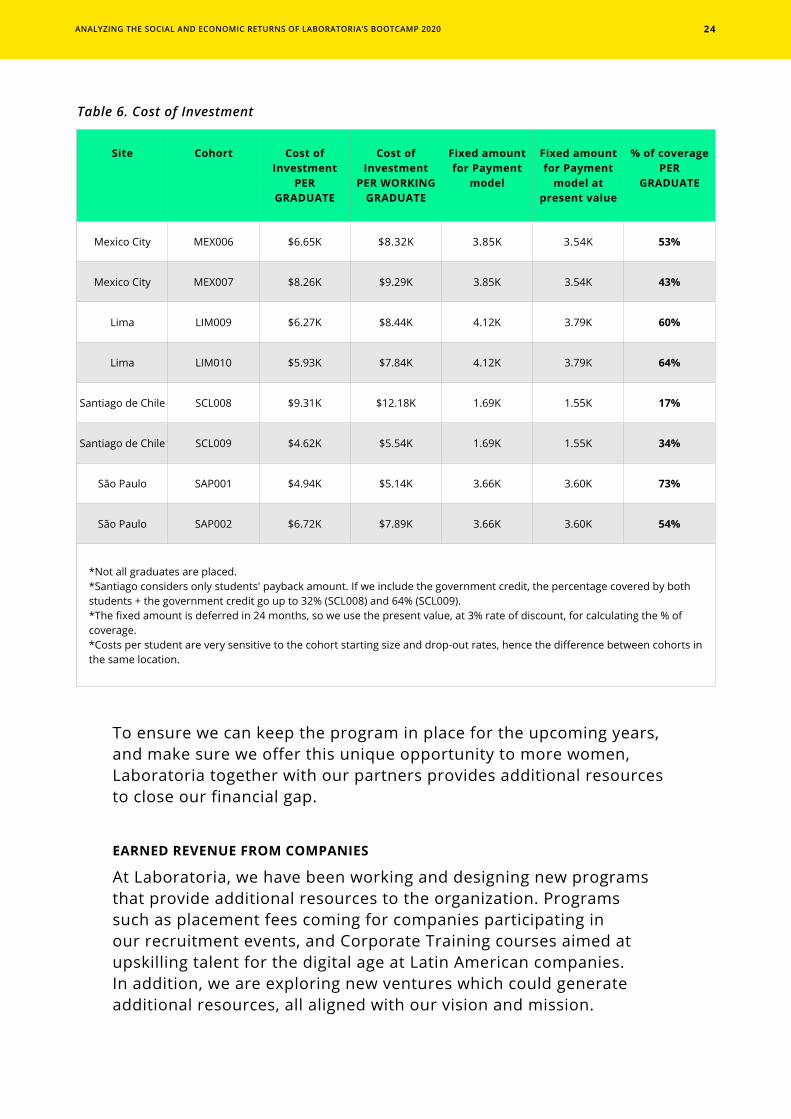
In all cases they pay back only part of the total costs. Charging amounts that represent more than 20% of their monthly salary and for a longer period could translate into very heavy costs for them, even becoming counterproductive to the purpose of the program. Most of these women face complex social and economic situations and some of them have debt incurred before applying to Laboratoria. In other cases, they are the main economic support for their entire family. In Table 6. (Cost of Investment) we can see the present value of the fixed amount charged to our working graduates by cohort and how much it represents for the cost per graduate. Notice that for Santiago the amount charged is much lower because we have a government training credit program which finances approximately 1,400 USD per student graduated.
This payback model maximizes the financial well-being of our graduates, but is insufficient to cover the costs of running a world-class training program. Not only because we charge only part of the investment to our working graduates, but also due to sunk costs we incur for those students who may not graduate, or get or maintain a job, as well as those graduates facing difficulties to complete their payments. To give you a better understanding of the impact, as it was shown in Table 1 (Cohort summary), on average 17% of the students graduated may not find a job in tech within 6 months of graduation, costing Laboratoria between $6K to $7K per student not placed. In addition, based on our historic numbers, around 22% of students placed might fall behind on their payments and around 13% eventually abandon the repayment, representing a loss in earnings for Laboratoria. In addition, given that the bootcamp investment takes place in six months but graduates repay across two years, graduate revenue covers a relatively small percentage of our costs.
24ANALYZING THE SOCIAL AND ECONOMIC RETURNS OF LABORATORIA’S BOOTCAMP 2020
Site Cohort Cost of Investment
PER GRADUATE
Cost of Investment
PER WORKING GRADUATE
Fixed amount for Payment
model
Fixed amount for Payment
model at present value
% of coveragePER
GRADUATE
Mexico City MEX006 $6.65K $8.32K 3.85K 3.54K 53%
Mexico City MEX007 $8.26K $9.29K 3.85K 3.54K 43%
Lima LIM009 $6.27K $8.44K 4.12K 3.79K 60%
Lima LIM010 $5.93K $7.84K 4.12K 3.79K 64%
Santiago de Chile SCL008 $9.31K $12.18K 1.69K 1.55K 17%
Santiago de Chile SCL009 $4.62K $5.54K 1.69K 1.55K 34%
São Paulo SAP001 $4.94K $5.14K 3.66K 3.60K 73%
São Paulo SAP002 $6.72K $7.89K 3.66K 3.60K 54%
*Not all graduates are placed.*Santiago considers only students' payback amount. If we include the government credit, the percentage covered by both students + the government credit go up to 32% (SCL008) and 64% (SCL009).*The fixed amount is deferred in 24 months, so we use the present value, at 3% rate of discount, for calculating the % of coverage.*Costs per student are very sensitive to the cohort starting size and drop-out rates, hence the difference between cohorts in the same location.
Table 6. Cost of Investment
To ensure we can keep the program in place for the upcoming years, and make sure we offer this unique opportunity to more women, Laboratoria together with our partners provides additional resources to close our financial gap.
EARNED REVENUE FROM COMPANIES
At Laboratoria, we have been working and designing new programs that provide additional resources to the organization. Programs such as placement fees coming for companies participating in our recruitment events, and Corporate Training courses aimed at upskilling talent for the digital age at Latin American companies. In addition, we are exploring new ventures which could generate additional resources, all aligned with our vision and mission.

25ANALYZING THE SOCIAL AND ECONOMIC RETURNS OF LABORATORIA’S BOOTCAMP 2020
2020 2021 2022 2023
Program costs 3,562K 3,800K 3,800K 3,800K
Cost per graduate 8.7K 7.6K 7.0K 7.0K
Repayment program 595K (17%) 622K (16%) 700K (18%) 760K (20%)
Earned Revenue from companies
283K (8%) 300K (8%) 500K (13%) 600K (16%)
Philanthropic revenues 2,684K (75%) 2,878K (76%) 2,600K (69%) 2,440K (64%)
*Based on last estimates
Table 7. Financing Structure
PHILANTHROPIC REVENUE
Finally, we have the philanthropic support from our allies and partners. Through grants and foundation programs, corporate and individual donors, we have been able to fully cover our costs and invest in improving and growing our impact.
What does our financing structure look like today and where do we aspire to be in the future?
In 2019, running our bootcamp program, from selection to alumnae and including all indirect services, had a total cost of $3,600K. Of this, the repayment program covered $500K (14%), earned revenue from companies covered $500K (14%), and the remaining $2,600K (72%) were covered through philanthropic funding. In the next three years, sustaining our current capacity of 500 students per year, we are working to consolidate our costs and revenue streams to attain the following:

26ANALYZING THE SOCIAL AND ECONOMIC RETURNS OF LABORATORIA’S BOOTCAMP 2020
Finally, to assess the competitiveness of Laboratoria’s bootcamp, it is important to understand our costs and returns in the context of a competitive market. How does our program compare to other bootcamps in terms of costs? For this we wanted to highlight the uniqueness of Laboratoria’s educational service and present information we have gathered on other bootcamps that operate in the same cities as Laboratoria (see Annex 1). We gathered information about bootcamps that offer technical skills development services similar to Laboratoria’s, graduating certified profiles in front end development and UX design. These bootcamps vary in terms of duration, price, target audience, placement efforts and payment options.
What makes Laboratoria unique?Laboratoria has focused its efforts on designing educational experiences for a group of women who have not been able to develop successful careers, not because they lack the potential, but because the socioeconomic and demographic context they grew up in did not allow them to do so. Laboratoria’s students face high unemployment rates; they work in low paying jobs and they are highly vulnerable to experiencing gender-based violence. What makes Laboratoria's bootcamp unique is our belief that a critical factor in overcoming these social and economic barriers is the development of soft skills, which is a core part of our program. Our students become owners of their own learning path and they develop skills around collaboration, autonomous learning, professionalism and communication. Our goal is to help our students become lifelong learners, which is crucial to ensure they not only get a job but are able to build a career.
We have found significant differences between Laboratoria and other bootcamps in the region. Laboratoria stands out as the most intensive bootcamp, lasting 24 weeks with a full time commitment. Other options have a duration of approximately 9 weeks full-time or 24 weeks part-time. At Laboratoria, students develop technical and socioemotional skills
Competitive Analysis

27ANALYZING THE SOCIAL AND ECONOMIC RETURNS OF LABORATORIA’S BOOTCAMP 2020
as a result of their hard work during six months and the support they receive from technical coaches and personal development coordinators. We believe that having a longer full-time bootcamp responds to the necessity of developing different types of skills that are required for knowledge economy jobs, in a population characterized by not having the opportunity to access high quality education before. Analyzing the other market options, there is a high probability that this population would not be able to access or afford these programs, making Laboratoria’s bootcamp a unique opportunity to build a promising professional career.
In the 2020 Alumnae Community Census we asked questions that helped us better understand our community. Table 8 (2020 Community Census Diversity Highlights) shows some examples of the data we collected. This is a picture of how diverse our alumnae really are. We have students and graduates who are mothers, who have a physical disability, who grew up in a rural area, or that belong to the LGBTIQ+ community. This data presents the uniqueness of our community and is the type of data that we want to take into account when thinking about how to improve the services we offer, making sure we are empowering women from diverse backgrounds who aspire to build a better future.
Alumnae demographic & socio-economic background
• 10% come from indigenous backgrounds• 20% from the LGTB community• 34% are the first person in their family to hold a professional job• 10% are immigrants• 25% are mothers (and 27% of them, single mothers)• 8% grew up in rural area• 1% have a physical disability
Table 8. 2020 Community Census Diversity Highlights
Regarding job placement efforts, none of the other bootcamps analyzed resemble the job placement services that Laboratoria provides. As mentioned above, at Laboratoria many resources are invested to ensure graduates secure high quality jobs. This is such a fundamental priority that only graduates who start to work in technology will pay for the program, and do so retroactively. The vast majority of other bootcamps charge upfront, regardless of whether or not individuals secure a job after graduation. Additionally, Laboratoria has invested in building and maintaining an active alumnae community. Our community of graduates is one of the biggest communities of women in technology in Latin America. We have a team dedicated to making this community a place where women support each other’s career growth and grow in leadership to foster a more diverse and inclusive tech industry.
28ANALYZING THE SOCIAL AND ECONOMIC RETURNS OF LABORATORIA’S BOOTCAMP 2020
Bootcamp ComparisonNow that we have highlighted some unique traits of Laboratoria’s bootcamp, let's take a closer look at some of the characteristics from other bootcamps operating in the same cities as Laboratoria and the associated costs with the service they are providing.
The most time intensive program in Mexico City is a full-time 15-week program, 9 weeks shorter than Laboratoria’s bootcamp. Part time programs last from 17 to 24 weeks, while full time programs range from 9 to 15 weeks. In this particular city, the range of available bootcamps is quite wide and their prices vary between USD 3,559 and USD 5,000, having an average price of USD 4,043. At Laboratoria, in this same city, working graduates pay USD 3,850, meaning that a Laboratoria working graduate pays a slightly lower cost than the ones incurred by graduates from other bootcamps in the market. The placement efforts of these bootcamps consist of coaching sessions, career guidance and job fairs.
In São Paulo, part time programs last 24 weeks, while full time programs last 9 weeks. A Laboratoria working graduate in São Paulo must pay approximately USD 3,660 for the education received, while at similar bootcamps the price is USD 3,330. Something particular about the bootcamps we analyzed in this city is that all of them have an alliance with Provi to promote payment plans for students. Provi is a company in charge of granting educational financing with relatively low interest rates. Some of the placement efforts of these bootcamps are career guidance and job fairs, but none of them resemble the type of job placement efforts provided by Laboratoria.
Lima is the city that shows the most variations in price and types of bootcamps. Bootcamp characteristics differ so much that it is difficult to objectively compare them with Laboratoria’s bootcamp. It is especially difficult to know if Laboratoria has a competitive price compared to the market. The newer bootcamps, with virtual and part-time classes, have lower prices equivalent to USD 1003. On the other hand, the older, full-time and longer-duration bootcamps have prices between USD 6,000 and USD 9,000. The difference in price for these full-time bootcamps depends on the payment method they use, which might include up-front payments or sponsorship agreements. Although the second type of bootcamp is more similar to Laboratoria, it is important to note that there are cheaper options on the market that certify graduates with the same profiles. A Laboratoria working graduate from Lima pays approximately USD 4,120, a higher amount compared to the cheapest options. However, this price is between 31% and 54% less compared to the most expensive ones. The placement services offered by the other organizations in the city are very

29ANALYZING THE SOCIAL AND ECONOMIC RETURNS OF LABORATORIA’S BOOTCAMP 2020
different from the ones offered by Laboratoria. From the information gathered, we found that Laboratoria is the organization that invests the most in terms of helping their graduates prepare to secure a job in the industry. Other bootcamps limit their placement services to job posting communications.
Finally, in Santiago de Chile we found fewer bootcamps in the market, fewer payment options and relatively low prices compared to the prices of the other cities. A singularity of the bootcamps we found in this city is that the programs last 31 weeks with a part time commitment or they are completely self-paced. A working graduate from Laboratoria in Santiago de Chile assumes a cost of approximately USD 1,690, while the other bootcamps have prices between USD 859 and USD 1,226. On average, the bootcamps we found in this city have a price of USD 1,043. In terms of placement services, none of the options offer thorough placement assistance as they are limited to communication platforms where job postings are shared.

30ANALYZING THE SOCIAL AND ECONOMIC RETURNS OF LABORATORIA’S BOOTCAMP 2020
The analysis presented in this paper shows how Laboratoria’s bootcamp has a multidimensional impact that goes beyond the financial and professional benefits our graduates receive. We have described the different dimensions through which Laboratoria has changed not only the lives of those who go through the program but also the communities that surround them. We believe Laboratoria’s impact includes more than just economic benefits for participants. Nevertheless, the economic benefits received by graduates are noteworthy. Using a cost-benefit analysis we were able to quantify the economic return of Laboratoria’s bootcamp, finding that the return on investment is considerably high. In just over a year, through their salaries, working graduates receive the total amount of the investment that Laboratoria has made on their behalf to be able to access high quality jobs in the tech industry. The financial impact these women experience is the result of a combination of factors: they developed the skills necessary to succeed in a high paying industry, they only pay for the education received if the ultimate job placement goal is achieved, and they do not pay for the total investment cost needed for the program to operate.
Looking at the market, Laboratoria stands out as an intensive bootcamp that offers a unique educational and career development service to a population with specific characteristics. The uniqueness of the services offered by Laboratoria, considering other bootcamps in the region, requires a considerable amount of investment that needs to be financed by actors other than the graduates themselves. We have described a financial model where the investment needed to run the program uses financial resources that come from the graduate repayment model, the revenue generated from other services and products offered by the organization and philanthropic support from our allies and partners. If we were to rely only on the repayment from graduates or our own revenue, our social and economic benefits would not be as big or as notable as the ones we presented. The financial resources coming from philanthropic support are key in ensuring that our social impact occurs. We recognize that working towards having a more financially sustainable organization
Conclusions

31ANALYZING THE SOCIAL AND ECONOMIC RETURNS OF LABORATORIA’S BOOTCAMP 2020
will allow us to keep generating economic benefits for our graduates in the years to come. However, we also recognize that investment of resources coming from partners allows us to maintain the uniqueness of the educational services we offer to women from underserved backgrounds in the region. These services have proven to translate the investment into significant financial benefits for women and social and economic benefits for society as a whole.

32A
NA
LYZI
NG
TH
E SO
CIA
L A
ND
EC
ON
OM
IC R
ETU
RN
S O
F LA
BO
RA
TOR
IA’S
BO
OTC
AM
P 20
20
Paym
ent
faci
litie
s
Spon
sors
hip
agre
emen
t: U
SD 2
00 in
adv
ance
and
if y
ou s
ign
up f
or a
job
that
pay
s yo
u m
ore
than
USD
750
, pay
20%
of
your
sal
ary
for
39 m
onth
s or
unt
il yo
u re
ach
the
cap
of U
SD 9
,000
. If
you
don
't ge
t a
sala
ry g
reat
er t
han
USD
750
, you
don
't pa
y an
ythi
ng o
ther
tha
n tu
itio
n.
- 6 in
stal
lmen
ts w
ithou
t int
eres
t.- M
exic
an c
itize
ns o
r re
side
nts
pay
USD
356
+ ta
xes.
- If y
ou c
ompl
ete
the
appl
icat
ion
proc
ess
2 m
onth
s be
fore
the
star
t of t
he b
ootc
amp:
10%
dis
coun
t.- S
cola
rshi
ps 2
0% d
isco
unt f
or w
omen
.- I
f you
ent
er w
ith a
frie
nd, c
olle
ague
or
fam
ily m
embe
r: 1
0% d
isco
unt f
or e
ach
one.
- Cre
dit t
hrou
gh P
rovi
(you
just
hav
e to
be
acce
pted
): 12
x U
SD 3
19 (m
onth
ly in
tere
st o
f 1.8
9%);
18x
USD
228
(mon
thly
inte
rest
of 1
.99%
); 24
x U
SD 1
85 (m
onth
ly in
tere
st o
f 2.1
9%).
- 3 in
stal
lmen
ts w
ithou
t int
eres
t.- I
f you
ent
er w
ith a
frie
nd, c
olle
ague
or
fam
ily m
embe
r: 7
% d
isco
unt f
or e
ach
one.
- 5%
dis
coun
t for
pre
paym
ent.
- Pro
vi s
pons
orsh
ip a
gree
men
t: N
o tu
ition
is p
aid
and
if yo
u ge
t a jo
b th
at p
ays
you
mor
e th
an U
SD
570,
you
pay
15%
or
18%
of y
our
sala
ry (d
epen
ding
on
the
leve
l) fo
r 48
mon
ths
or u
ntil
you
reac
h th
e m
axim
um o
f USD
4,9
95. I
f you
don
't ge
t a s
alar
y hi
gher
than
USD
570
, you
don
't pa
y.
- Edu
pass
fina
nces
100
% a
nd is
pai
d in
36
inst
allm
ents
.- A
cced
e Ed
ucac
ión
finan
ces
100%
and
is p
aid
in 3
6 in
stal
lmen
ts, a
fter
3 m
onth
s of
gra
ce.
- Tui
tion
is n
ot p
aid
and
if yo
u ge
t a jo
b th
at p
ays
you
mor
e th
an U
SD 8
90 y
ou s
tart
pay
ing.
- 10%
dis
coun
t for
wom
en.
- If
ever
ythi
ng is
pai
d in
adv
ance
, USD
380
dis
coun
t.- A
llian
ce w
ith
Prov
i: 12
inst
allm
ents
wit
hout
inte
rest
or
24 in
stal
lmen
ts w
ith
0.72
% in
tere
st.
- Tec
noló
gico
de
Mon
terr
ey A
lum
ni r
ecei
ve a
tuiti
on d
isco
unt o
f USD
222
.- B
anre
gio
offe
rs a
dvan
tage
ous
loan
s fo
r st
uden
ts ta
king
our
cou
rse.
- Stu
dent
s ca
n ar
rang
e to
set
up
a pa
ymen
t pla
n.- I
ndiv
idua
ls w
ho e
nrol
l by
the
earl
y re
gist
ratio
n de
adlin
e an
d pa
y in
full
are
elig
ible
for
a di
scou
nt
of U
SD 2
22.
- Pay
men
t in
inst
allm
ents
: USD
133
for
48 m
onth
s.- 1
0% d
isco
unt f
or c
ash
paym
ent.
- Pay
USD
89
of tu
ition
and
the
rest
3 m
onth
s af
ter
finis
hing
the
boot
cam
p.- S
chol
arsh
ips.
- Pay
men
t in
inst
allm
ents
: CLP
112
,000
for
10 m
onth
s.- D
isco
unt f
or e
arly
pay
men
t.
- Pay
men
t in
inst
allm
ents
: USD
43
for
4 m
onth
s.- D
isco
unt f
or e
arly
pay
men
t.
- 6 o
r 12
inst
allm
ents
with
out i
nter
est
- Fin
anci
ng in
alli
ance
with
Pro
vi. F
irst
inst
allm
ent (
5%) i
n 5
days
and
the
next
in 3
0 da
ys a
fter
fin
ishi
ng th
e co
urse
. 24
inst
allm
ents
.
- 10%
dis
coun
t in
cash
pay
men
t.- F
inan
cing
at 1
2, 1
8, 2
4 an
d 36
mon
ths.
Opt
ion
to a
pply
for
a "c
oder
beca
": U
SD 3
00.
Opt
ion
to a
pply
for
a "
code
rbec
a": U
SD 2
40.
Plac
emen
t ef
fort
s
Care
er g
uida
nce,
job
fair
s, a
lum
ni
expe
rien
ces,
gra
duat
e pr
esen
tatio
ns.
Care
er g
uida
nce,
job
sear
ch p
repa
ratio
n,
ongo
ing
supp
ort,
hiri
ng fa
ir a
nd jo
b op
port
uniti
es.
Supp
ort a
nd c
oach
ing:
por
tfol
io r
evie
ws,
re
sum
e as
sist
ance
, and
tech
nica
l int
ervi
ew
trai
ning
.
Conn
ectio
n w
ith th
e la
bor
mar
ket.
Slac
k ch
anne
l whe
re o
ffer
s ar
e pu
blis
hed.
Acc
ess
to t
he ID
AT
job
empl
oyab
ility
pl
atfo
rm, a
cces
s to
Inte
rcor
p an
d A
van-
tica
job
empl
oyab
ility
pla
tfor
m.
Plac
emen
t Su
ppor
t Pr
ogra
m (f
ree)
and
ex
clus
ive
recr
uiti
ng f
airs
(rec
ruit
men
t da
y).
Recr
uitin
g fa
irs
Acce
ss to
job
empl
oyab
ility
pla
tfor
ms
and
free
lanc
e pr
ojec
ts.
Sala
ry P
ost
Boot
cam
p
USD
1,4
10
USD
891
- U
SD 1
,113
USD
891
- U
SD 1
,113
USD
668
USD
731
USD
573
- U
SD 7
17
Pric
e
"USD
6,0
00 -
Prep
aym
ent
USD
9,0
00 -
Spon
sors
hip
Agre
emen
t
USD
5,0
00
USD
3,3
30
Full-
time:
USD
4,0
04Pa
rt-t
ime:
USD
4,5
82
USD
3,3
30
USD
3,5
59
USD
55
- Non
ref
unda
ble
depo
sit
USD
1,1
71 -
Prep
aym
ent
USD
1,3
66 -
In in
stal
lmen
ts
114
- Pre
paym
ent
172
- In
inst
allm
ents
USD
3,6
07
USD
1,0
03
USD
859
Tim
e
Full-
time:
6
mon
ths
Full-
time:
9
wee
ks
Part
-tim
e:
24 w
eeks
Full-
time:
9
wee
ks
Part
-tim
e:
24 w
eeks
Part
-tim
e:
24 w
eeks
Full-
time:
15 w
eeks
Part
-tim
e:
31 w
eeks
Part
-tim
e:
18 w
eeks
Part
-tim
e:
17 w
eeks
Self
pace
d
Prog
ram
Fulls
tack
Fulls
tack
Fulls
tack
Fulls
tack
UX/
UI d
esig
ner
Fulls
tack
UX/
UI d
esig
ner
Fulls
tack
Fulls
tack
Fron
tend
Fron
tend
& U
X
Fulls
tack
UX
Fulls
tack
Fron
tend
& U
X/U
I
Fron
tend
& U
X/U
I
Boot
cam
p na
me
Code
able
Le W
agon
Le W
agon
Iron
Hac
k
Iron
Hac
k
Iron
Hac
k
Iron
Hac
k
Tecn
ológ
ico
de
Mon
terr
ey B
oot
Cam
ps
Muk
tek
Des
afío
Lat
am
Pach
aQTe
c
Dig
italH
ouse
Dig
italH
ouse
Kode
mia
Code
rHou
se
Code
rHou
se
Site
Lim
a
Mex
ico
City
São
Paul
o
Mex
ico
City
Mex
ico
City
São
Paul
o
São
Paul
o
Mex
ico
City
Mex
ico
City
Sant
iago
de
Chile
Lim
a
São
Paul
o
São
Paul
o
Mex
ico
City
Lim
a
Sant
iago
de
Chile
ANN
EX 1
: Com
peti
tive
Ana
lysi
s - P
rese
nce
of o
ther
boo
tcam
ps

33ANALYZING THE SOCIAL AND ECONOMIC RETURNS OF LABORATORIA’S BOOTCAMP 2020
@laboratoriala
@laboratoriala
www.laboratoria.la/en


