
Analyzing Service Gaps Using the CHAIN Study
Presentation to the HIV Planning Council
David Abramson Gunjeong LeeColumbia UniversityNov 7, 2003
Acknowledgements
This research was supported by grant number H89 HA 0015-12 from the US Health Resources and Services Administration (HRSA), HIV/AIDS Bureau with the support of the HIV Health and Human Services Planning Council, through the New York City Department of Health & Mental Hygiene and the Medical and Health Research Association of New York City, Inc. Its contents are solely the responsibility of the researchers and do not necessarily represent the official views of the U.S. Health Resources and Services Administration, the City of New York, or the Medical and Health Research Association of New York.
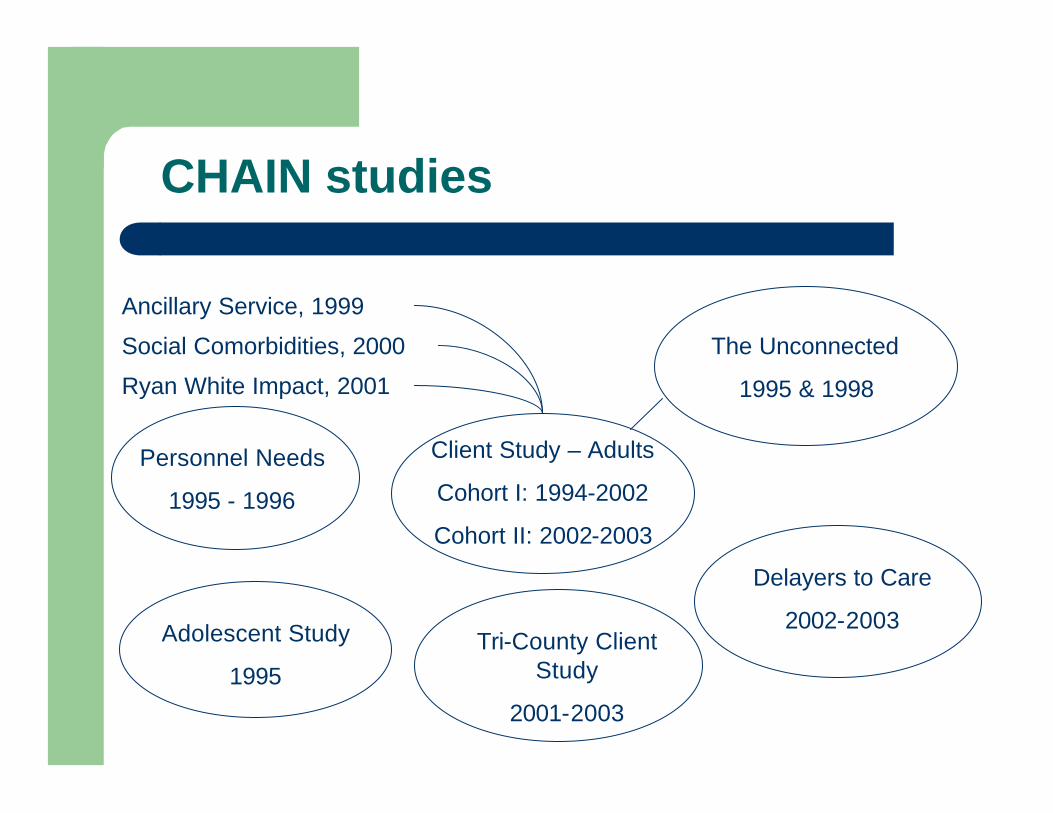
CHAIN studies
Client Study – Adults
Cohort I: 1994-2002
Cohort II: 2002-2003
Adolescent Study
1995Tri-County Client
Study
2001-2003
The Unconnected
1995 & 1998
Ancillary Service, 1999
Social Comorbidities, 2000
Ryan White Impact, 2001
Personnel Needs
1995 - 1996
Delayers to Care
2002-2003

Evaluation Objectives
l To recruit and maintain a representative cohort of HIV positive adults in the system of care in NYC
l To assess the system of HIV care – both health and social services – from the perspective of people living with HIV
l To report on unmet needs, service utilization trends, and outcomes to the Planning Council & its Work Groups

CHAIN Data & Methodology
l Multi-stage stratified samplingl Initial recruitment 1994-95, n=700l Refresher cohort 1998, n=268l 8 waves of interviewing of Cohort Il Cohort II currently being enrolled, 2002-
2003, projected n = 700

What is a Service Gap?
l The difference between the “need” for service, and the receipt of service
l Need may be “subjective,” in that client explicitly wants service (AKA “demand”)
– Ex: “In the last 6 months, have you had a problem or needed assistance with housing?”
l Need may be “objective,” in that client’s circumstances suggest a need for a service, even if client doesn’t demand it
– Ex: Client has had at least one episode of homelessness, being doubled up, or being unstably housed in past 6 mo.

Thinking about Service Gaps
l Is there a service gap?l How large is the gap – what proportion of the
population does it affect?l Is the service gap disproportionately felt by
some groups and not others?l What’s driving the service gap? What
programs or policies can narrow the gap?

Service Gap Comparisons
l Geographically – UHF area, borough, “high need” area
l Subgroup – gender, race/ethnicityl Risk group – drug users, unstably housedl Health status – insurance status, t-cell

Calculating a Service Gap Proportion
# of people not receiving a needed service
Total # of people needing the service

Definition of Needs & Services
Therapeutic or self-help treatmentCurrent drug useAOD
Receipt of professional or supportive mental health service OR resolution of emotional or mental health problem
Very low mental health scoreMental Health
Case manager at least one of three waves
At least one social problem (e.g., housing, legal, financial, child care) OR a barrier that prevented or delayed receipt of a social service
Case Mgmt
Housing problem resolved or improving
Episode of unstable housing AND expressed need for housing service
Housing
Met minimum practice guidelines for at least two of three waves.
HIV positivityMedical Care
ServiceNeedArea

Service Gaps
Case Mgmt
Mental Health
AOD
Housing
Medical Care
Area
20%8177%408
42%9643%227
59%9831%165
64%8725%135
20%109100%532
Among those with need, % with service
gap
# with service gap
% of total n=532 with
need
# with need
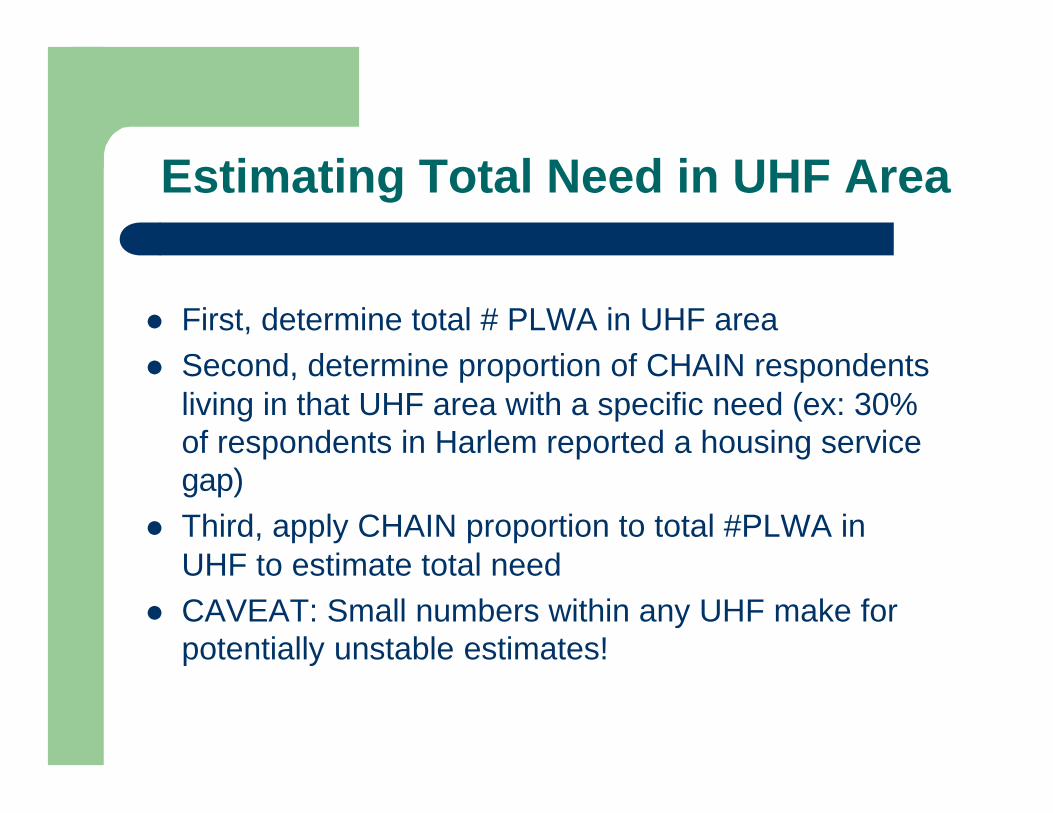
Estimating Total Need in UHF Area
l First, determine total # PLWA in UHF areal Second, determine proportion of CHAIN respondents
living in that UHF area with a specific need (ex: 30% of respondents in Harlem reported a housing service gap)
l Third, apply CHAIN proportion to total #PLWA in UHF to estimate total need
l CAVEAT: Small numbers within any UHF make for potentially unstable estimates!

Mapping RWCA Services
l On all maps, graphic dot or cross represents a geocoded RW-funded service agency
l Represents funding across all RW Titles, by service category (housing, case mgmt, etc)
l Captures funding years FY7 through FY10 l Reported by site of service rather than
funding pass-through


Proportion with Medical Care Service Gap, by Borough
17%953Queens
24%28119Brooklyn
17%24140Manhattan
15%639Staten Island
23%40177Bronx
20%107528NYC
%Number with service gap
Total with need

Proportion with Medical Care Service Gap, by Race/Ethnicity
21%65315Black, non-Hispanic
20%28139Hispanic
21%1573White, non-Hispanic
20%10852Total
%Number with service gap
Total with need

Proportion with Medical Care Service Gap, by Lowest CD4 Count
22%55248200-500
19%31165<200
19%23119501+
20%109532Total
%Number with service gap
Total with need


Proportion with Housing Service Gap, by Borough (sig. diff)
67%46Queens
47%817Brooklyn
76%3850Manhattan
33%26Staten Island
64%3453Bronx
65%86132NYC
%Number with service gap
Total with need

Proportion with Housing Service Gap, by Race/Ethnicity (sig diff)
56%4478Black, non-Hispanic
73%2737Hispanic
82%1417White, non-Hispanic
64%85132Total
%Number with service gap
Total with need

Proportion with Housing Service Gap, by CD4 Count
58%3662200-500
73%3041<200
66%2132501+
64%87135Total
%Number with service gap
Total with need


Proportion with AOD Service Gap, by Borough
71%1217Queens
52%1733Brooklyn
62%3150Manhattan
56%59Staten Island
59%3254Bronx
60%97163NYC
%Number with service gap
Total with need
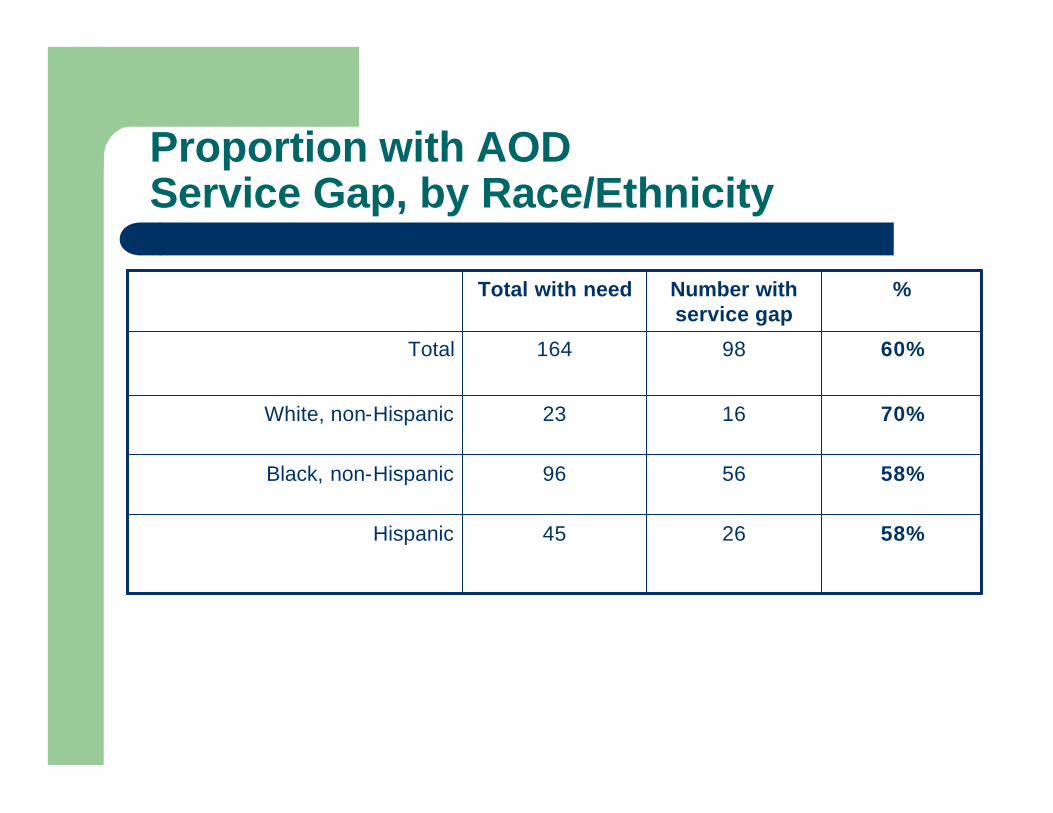
Proportion with AOD Service Gap, by Race/Ethnicity
58%5696Black, non-Hispanic
58%2645Hispanic
70%1623White, non-Hispanic
60%98164Total
%Number with service gap
Total with need
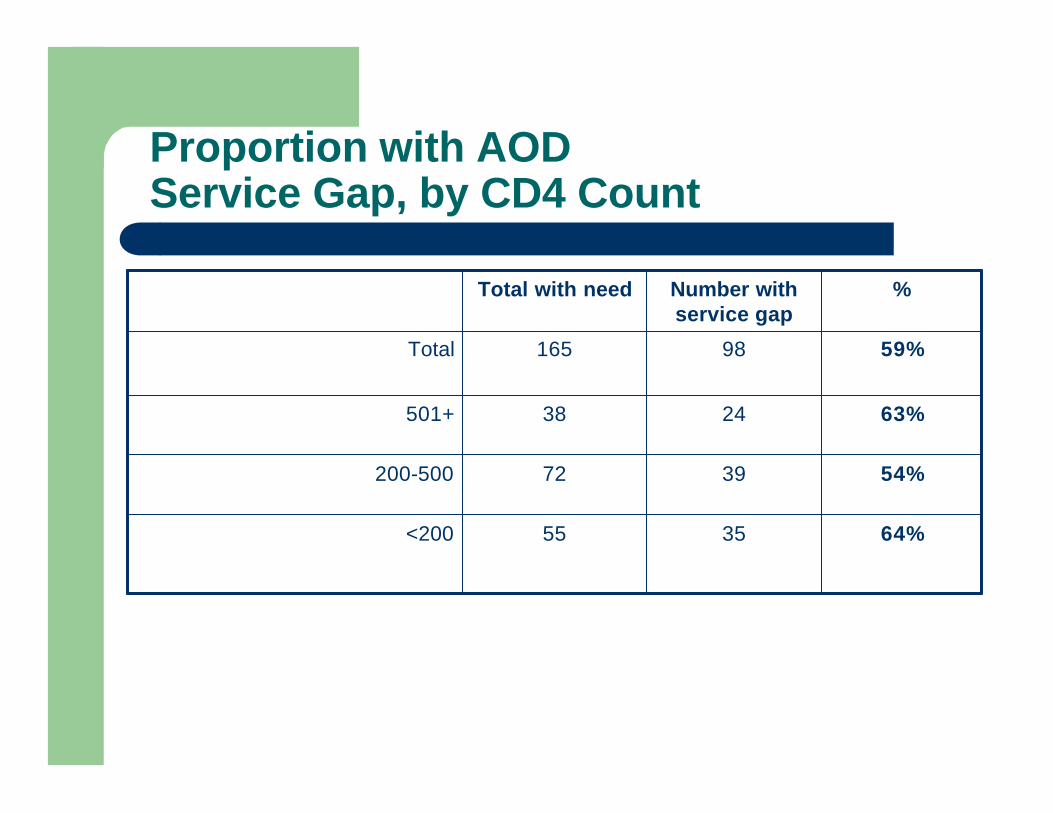
Proportion with AOD Service Gap, by CD4 Count
54%3972200-500
64%3555<200
63%2438501+
59%98165Total
%Number with service gap
Total with need


Proportion with Mental Health Service Gap, by Borough (sig diff)
60%1220Queens
39%1744Brooklyn
40%2562Manhattan
13%215Staten Island
47%4086Bronx
42%96227NYC
%Number with service gap
Total with need
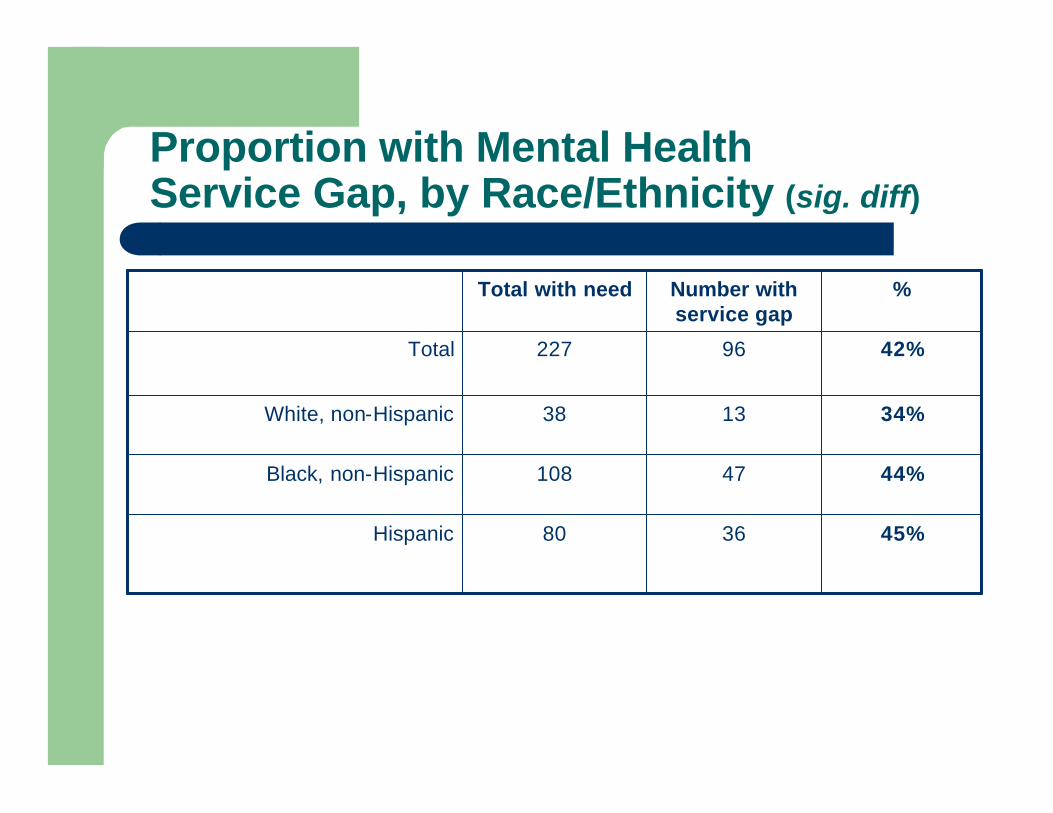
Proportion with Mental Health Service Gap, by Race/Ethnicity (sig. diff)
44%47108Black, non-Hispanic
45%3680Hispanic
34%1338White, non-Hispanic
42%96227Total
%Number with service gap
Total with need
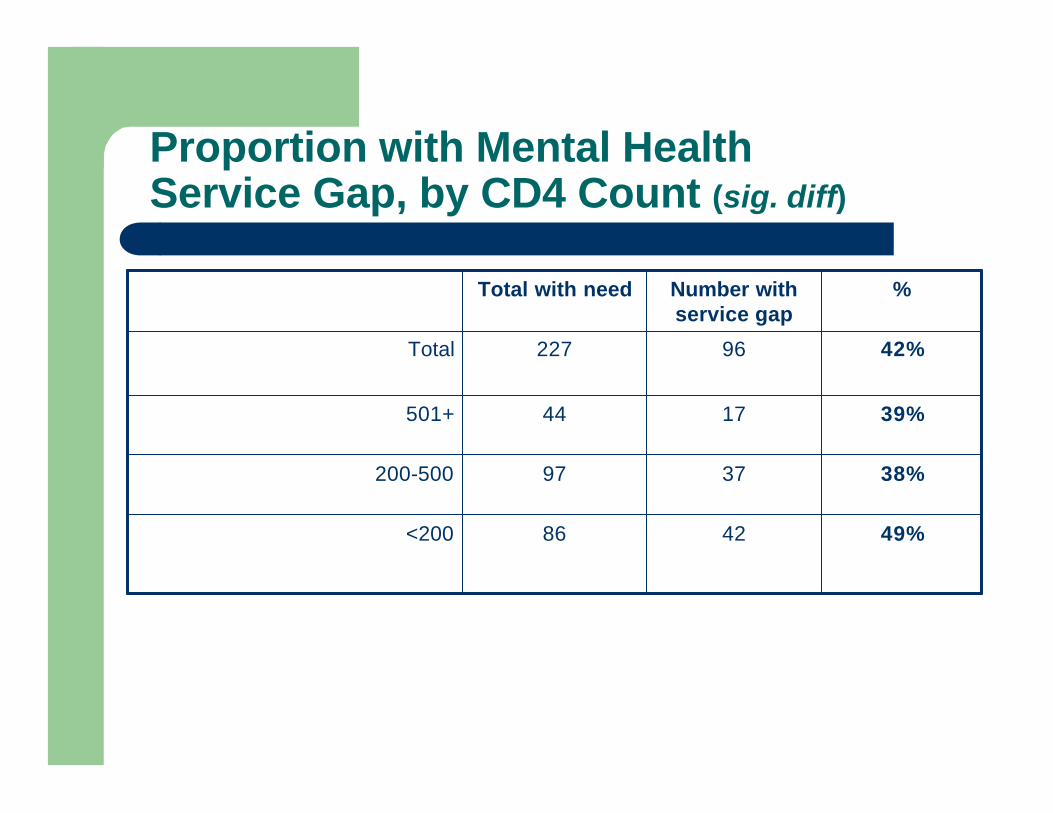
Proportion with Mental Health Service Gap, by CD4 Count (sig. diff)
38%3797200-500
49%4286<200
39%1744501+
42%96227Total
%Number with service gap
Total with need


Proportion with Case Management Service Gap, by Borough
30%1137Queens
13%1188Brooklyn
20%21105Manhattan
13%431Staten Island
23%33143Bronx
20%80404NYC
%Number with service gap
Total

Proportion with Case Management Service Gap, by Race/Ethnicity
19%46242Black, non-Hispanic
18%21114Hispanic
30%1447White, non-Hispanic
20%80404Total
%Number with service gap
Total with need

Proportion with Case Management Service Gap, by CD4 Count (sig diff)
23%45192200-500
13%16128<200
23%2088501+
20%80404Total
%Number with service gap
Total
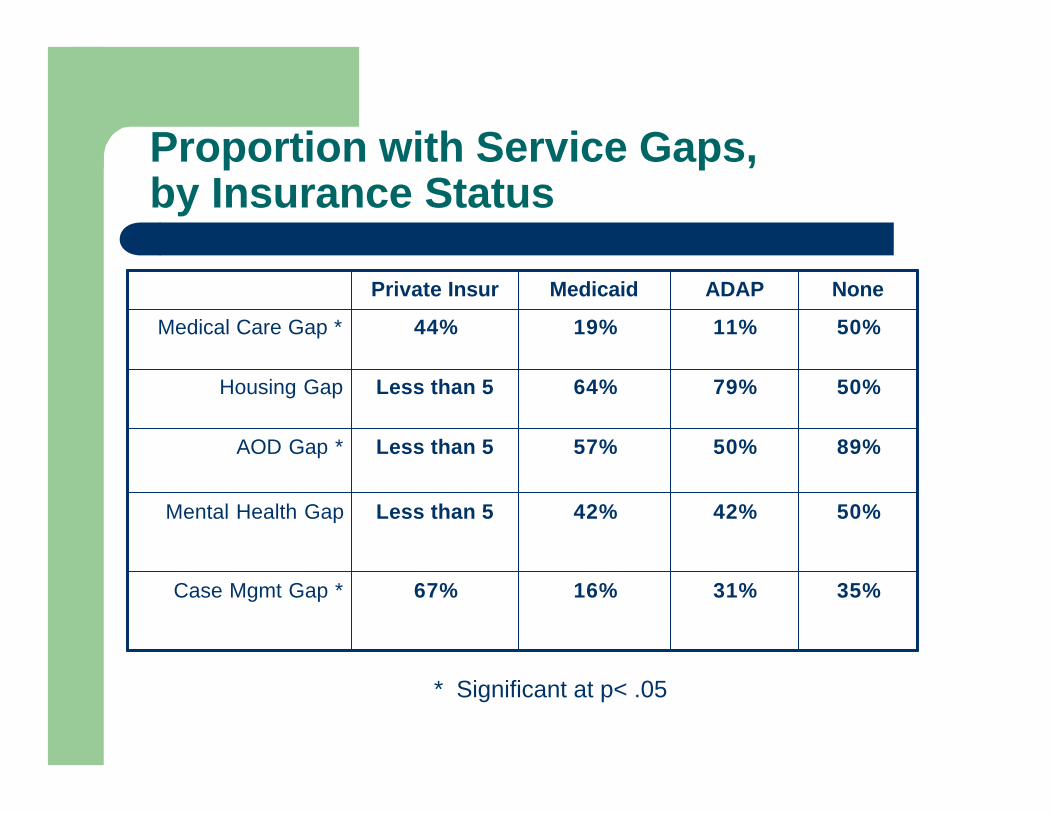
Proportion with Service Gaps, by Insurance Status
31%
42%
50%
79%
11%
ADAP
35%
50%
89%
50%
50%
None
57%Less than 5AOD Gap *
16%67%Case Mgmt Gap *
64%Less than 5Housing Gap
42%Less than 5Mental Health Gap
19%44%Medical Care Gap *
MedicaidPrivate Insur
* Significant at p< .05


