© Lahmeyer International GmbH 2012
Analysis of pre – and post construction wind farm energy yields with focus on uncertainties
Abdelbari Redouane REMENA Master Program 2014
Contact: [email protected] 1

Author: Abdelbari Redouane
Supervisor: Prof. Adel Khalil
Supervisor: Prof. Siegfried Heier
Co-supervisor: Dr. Kurt Rohrig
Supervisor on-site: Dipl. Ing. Nicolás Veneranda
Defense of Master Thesis
Analysis of pre – and post construction wind farm energy yields with focus on uncertainties
Improvement of Lahmeyer’s spreadsheet application software for estimating wind farm energy yield uncertainties
2

• Introduction
• Motivation
• Uncertainty concept
• Model
• Input data for the Model
• Results
• Conclusion
Agenda
3

Data Source: GLOBAL WIND STATISTICS 2013, GLOBAL WIND ENERGY COUNCIL, 05.02.2014
Introduction

Motivation
5
Predict Gross Yield
•Wind speed measurements
•Long Term Prediction Process
•Terrain and surface roughness model
•Wind flow model
•Turbine layout
•Turbine power curve
Calculate Losses and Predict NET Yield
•Wake Effects Availability
•Turbine Performance
•Electrical Environmental
•Curtailment Estimate
Uncertainties
Financial Model
•Site developer
•Independent
•Consultants
•Turbine Manufacturers
•Financiers

Error sources that can contribute in the uncertainty of the final result.
• Incomplete definition of the measurand ;
• Imperfect realization of the definition of the measurand ;
• Non-representative sampling if a sampling is used;
• Inadequate knowledge of the effects of environmental conditions on the measurement or imperfect measurement of environmental conditions;
• Personal bias in handling the instruments;
• Finite instrument resolution or discrimination threshold;
• …
JCGM 100:2008: Evaluation of measurement data – Guide to the expression of uncertainty in measurement (ISO/IEC Guide 98-3)
Uncertainty concept
6
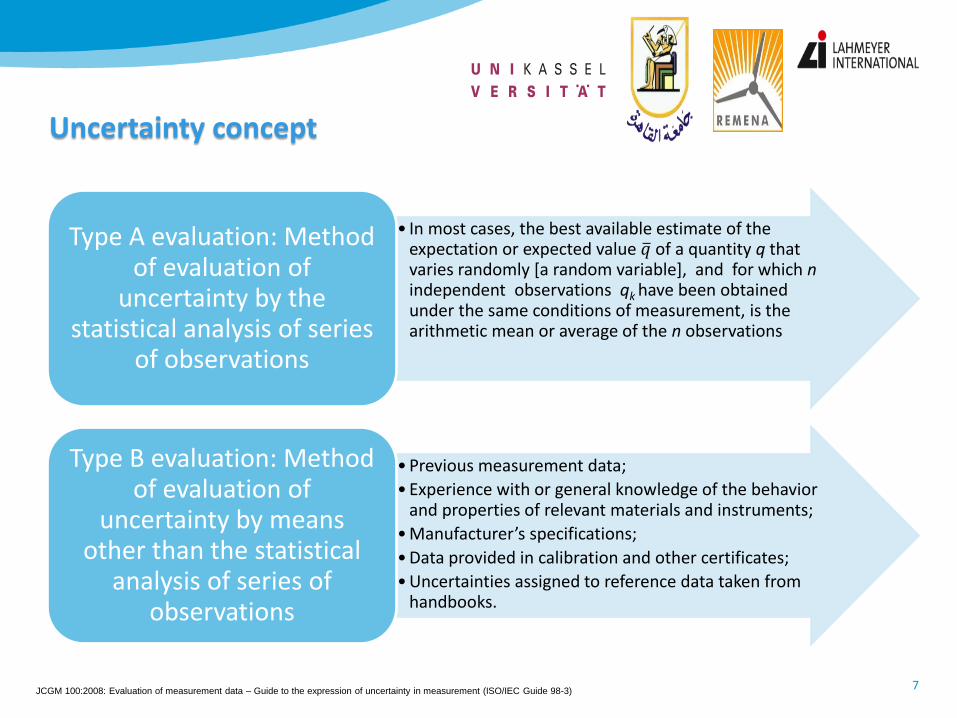
• In most cases, the best available estimate of the expectation or expected value 𝑞 of a quantity q that varies randomly [a random variable], and for which n independent observations qk have been obtained under the same conditions of measurement, is the arithmetic mean or average of the n observations
Type A evaluation: Method of evaluation of
uncertainty by the statistical analysis of series
of observations
• Previous measurement data;
• Experience with or general knowledge of the behavior and properties of relevant materials and instruments;
• Manufacturer’s specifications;
• Data provided in calibration and other certificates;
• Uncertainties assigned to reference data taken from handbooks.
Type B evaluation: Method of evaluation of
uncertainty by means other than the statistical
analysis of series of observations
Uncertainty concept
JCGM 100:2008: Evaluation of measurement data – Guide to the expression of uncertainty in measurement (ISO/IEC Guide 98-3) 7

Model
Win
d S
tud
y U
nce
rtai
nty
Prediction horizon [years]
1-year wind Total Total Uncertainty on Gross
Production (1-year)deviation
N-year wind deviation Total Uncertainty on Gross
Production (N-year)
Total Uncertainty
Measurement and Data Processing wind to Energy
converted
Measurement and Data Processing - wind speed
related
Data Integrity
Data Analysis
Long-term correlation
Measurement - wind speed related
Calibration
Type of Anemometer
Mounting
Flow modeling
Wake modeling
Power curve
8

Production data Variability
Standard deviation of the monthly energy production of a set of turbines
Calculate the different standard deviation and average them and scale the average to the AEP level
Sum the root square of the individual standard deviations
Use of the correlation and the covariance matrices
Wind Study uncertainties
Combining uncertainties
Wind to Energy uncertainties
Sensitivity analysis
Combining uncertainties
Wind related uncertainties
Energy related uncertainties
Model
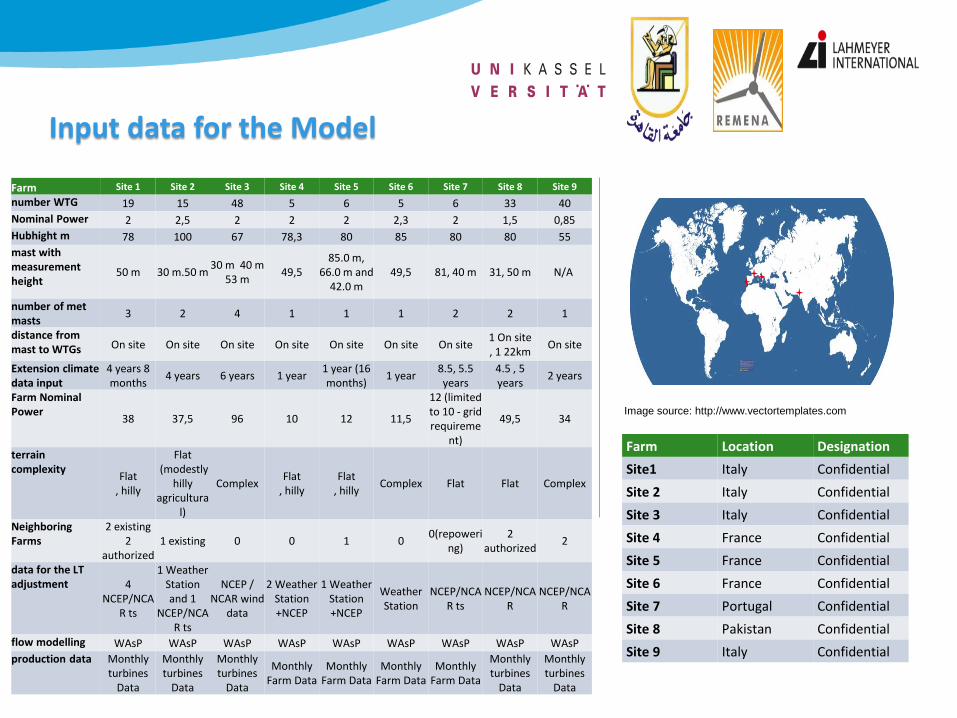
Image source: http://www.vectortemplates.com
Input data for the Model
Farm Location Designation
Site1 Italy Confidential
Site 2 Italy Confidential
Site 3 Italy Confidential
Site 4 France Confidential
Site 5 France Confidential
Site 6 France Confidential
Site 7 Portugal Confidential
Site 8 Pakistan Confidential
Site 9 Italy Confidential
Farm Site 1 Site 2 Site 3 Site 4 Site 5 Site 6 Site 7 Site 8 Site 9
number WTG 19 15 48 5 6 5 6 33 40
Nominal Power 2 2,5 2 2 2 2,3 2 1,5 0,85
Hubhight m 78 100 67 78,3 80 85 80 80 55
mast with measurement height
50 m 30 m.50 m 30 m 40 m
53 m 49,5
85.0 m, 66.0 m and
42.0 m 49,5 81, 40 m 31, 50 m N/A
number of met masts
3 2 4 1 1 1 2 2 1
distance from mast to WTGs On site On site On site On site On site On site On site
1 On site , 1 22km
On site
Extension climate data input
4 years 8 months
4 years 6 years 1 year 1 year (16 months)
1 year 8.5, 5.5 years
4.5 , 5 years
2 years
Farm Nominal Power
38 37,5 96 10 12 11,5
12 (limited to 10 - grid requireme
nt)
49,5 34
terrain complexity
Flat , hilly
Flat (modestly
hilly agricultura
l)
Complex Flat
, hilly Flat
, hilly Complex Flat Flat Complex
Neighboring Farms
2 existing 2
authorized 1 existing 0 0 1 0
0(repowering)
2 authorized
2
data for the LT adjustment 4
NCEP/NCAR ts
1 Weather Station and 1
NCEP/NCAR ts
NCEP / NCAR wind
data
2 Weather Station +NCEP
1 Weather Station +NCEP
Weather Station
NCEP/NCAR ts
NCEP/NCAR
NCEP/NCAR
flow modelling WAsP WAsP WAsP WAsP WAsP WAsP WAsP WAsP WAsP
production data Monthly turbines
Data
Monthly turbines
Data
Monthly turbines
Data
Monthly Farm Data
Monthly Farm Data
Monthly Farm Data
Monthly Farm Data
Monthly turbines
Data
Monthly turbines
Data

Graphs illustrating the monthly production and the variability related to it
Input data for the Model (Example, site 1)
Site 1
6 8
30 31
32 35 37 38
39 40 41
42
43 44
48
54 55
56 57
1-2013 / 8-2014
Farm Site 1
Number of WTG 19
Nominal Power of WTG MW 2
Hub height m 78
Image source: Lahmeyer International
11
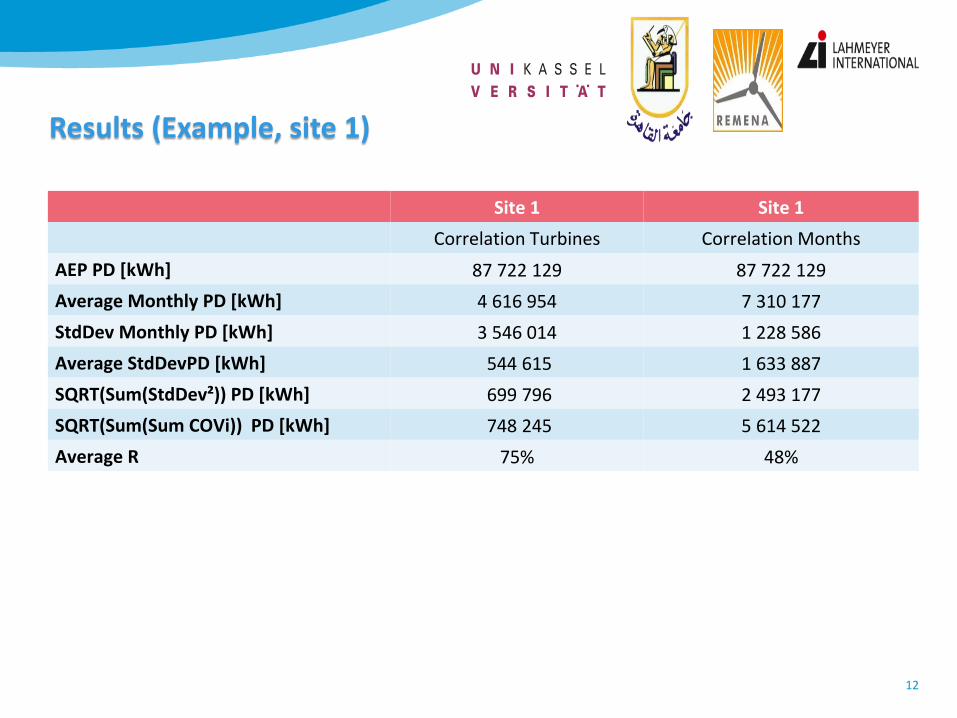
Results (Example, site 1)
Site 1 Site 1
Correlation Turbines Correlation Months
AEP PD [kWh] 87 722 129 87 722 129
Average Monthly PD [kWh] 4 616 954 7 310 177
StdDev Monthly PD [kWh] 3 546 014 1 228 586
Average StdDevPD [kWh] 544 615 1 633 887
SQRT(Sum(StdDev²)) PD [kWh] 699 796 2 493 177
SQRT(Sum(Sum COVi)) PD [kWh] 748 245 5 614 522
Average R 75% 48%
12

Results (Example, site 1)
Site 1 Site 1
PD WS
AEP NET [kWh/a] 87 722 129 110 208 538
StdDev 6 640 563 16 095 082
Variability [%] 8%
Uncertainty WS [%] 15%
Site 1 Site 1
PD WS
PoE AEP NET [kWh/a] AEP NET[kWh/a]
50% 87 722 129 110 208 538
75% 83 243 137 99 352 570
90% 79 211 905 89 581 860
13

Results (Example, site 1)
14
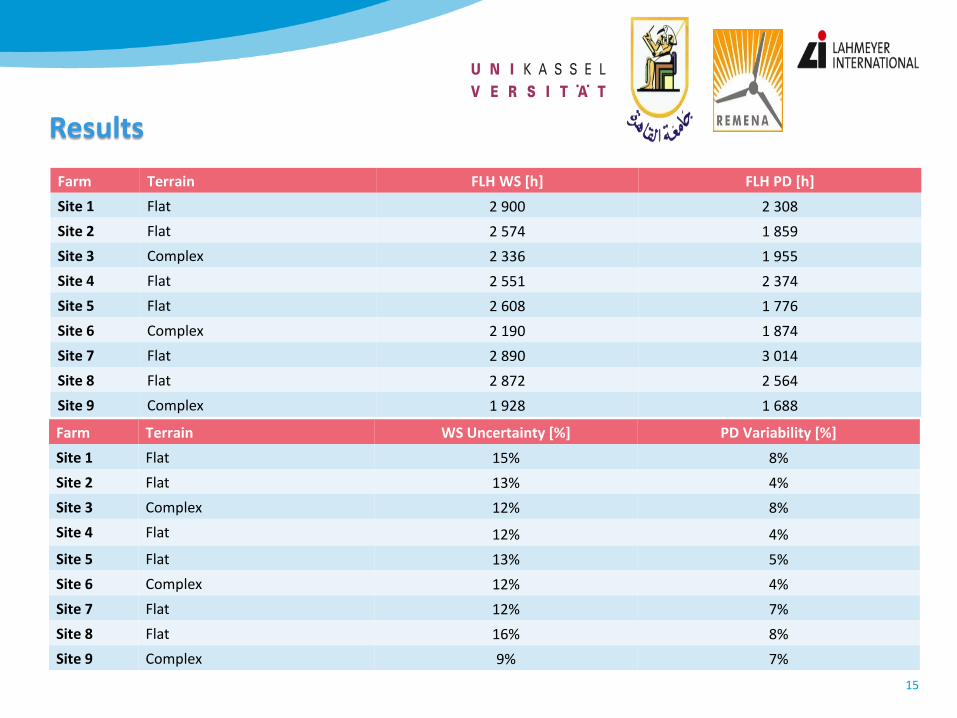
Results
Farm Terrain FLH WS [h] FLH PD [h]
Site 1 Flat 2 900 2 308
Site 2 Flat 2 574 1 859
Site 3 Complex 2 336 1 955
Site 4 Flat 2 551 2 374
Site 5 Flat 2 608 1 776
Site 6 Complex 2 190 1 874
Site 7 Flat 2 890 3 014
Site 8 Flat 2 872 2 564
Site 9 Complex 1 928 1 688
Farm Terrain WS Uncertainty [%] PD Variability [%]
Site 1 Flat 15% 8%
Site 2 Flat 13% 4%
Site 3 Complex 12% 8%
Site 4 Flat 12% 4%
Site 5 Flat 13% 5%
Site 6 Complex 12% 4%
Site 7 Flat 12% 7%
Site 8 Flat 16% 8%
Site 9 Complex 9% 7%
15
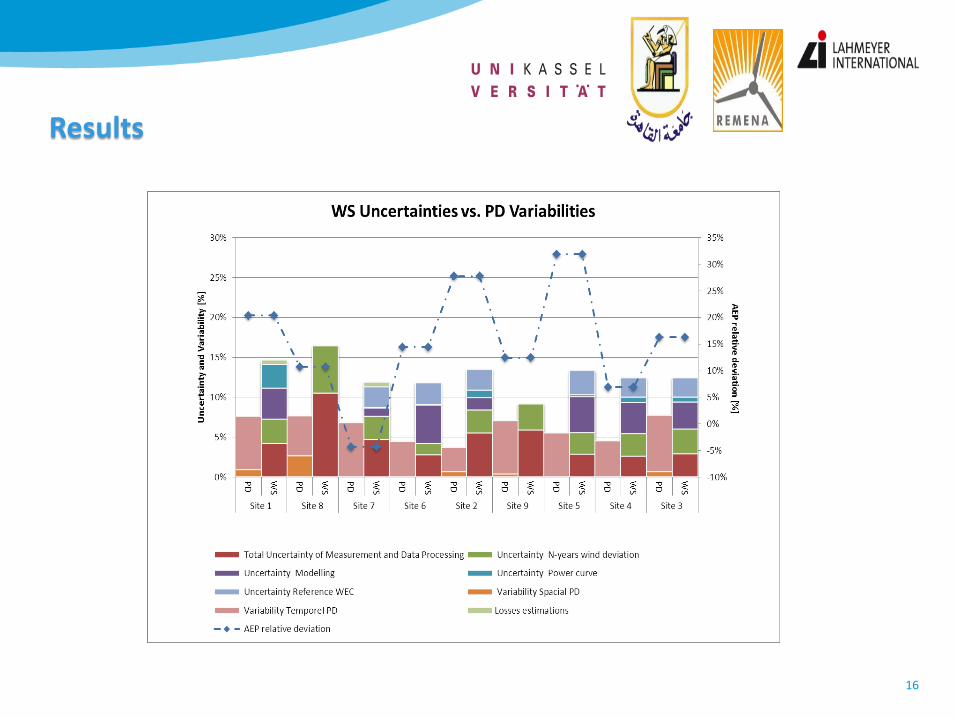
Results
16

Results
17
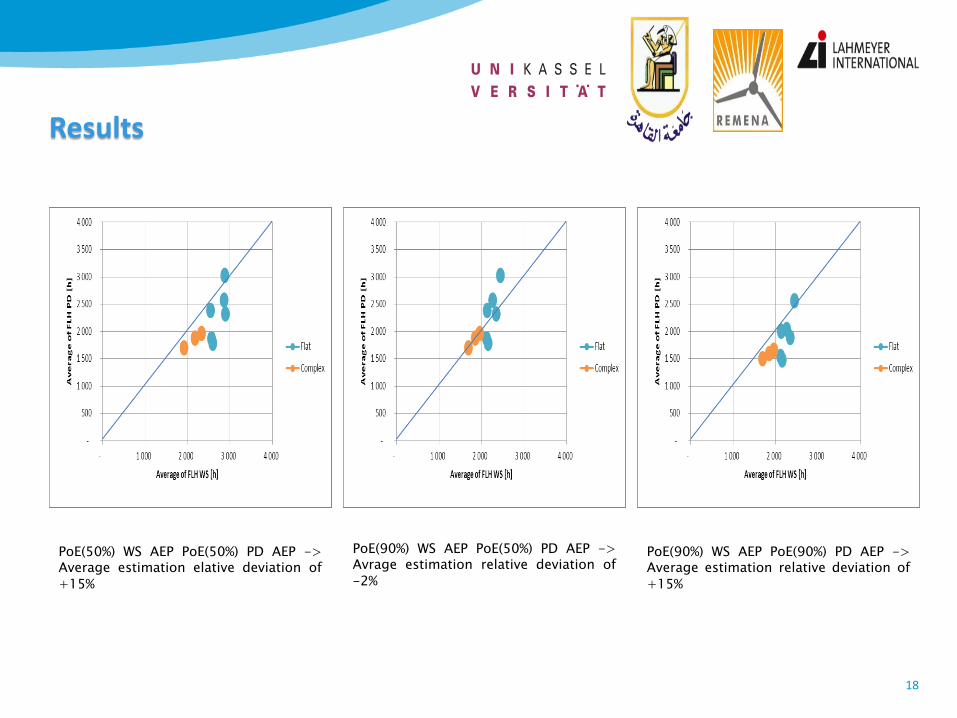
Results
PoE(90%) WS AEP PoE(90%) PD AEP -> Average estimation relative deviation of
+15%
PoE(50%) WS AEP PoE(50%) PD AEP -> Average estimation elative deviation of
+15%
PoE(90%) WS AEP PoE(50%) PD AEP -> Avrage estimation relative deviation of
-2%
18

Conclusion
• Review of the uncertainty analysis tool • New approach for uncertainty learning curve was implemented providing a powerful tool for
comparing wind assessment uncertainties and the production data variabilities. • Two components of the variability were calculated as correlated uncertainties using the
correlation and the covariance matrices • Two main aspects of variability of production data are presented here, temporal and spatial
variability. • A method is presented for combining the variabilities as a combined uncertainty that arises in
wind production as correlated and uncorrelated variabilities. • The variability at the wind farm level and annual energy production is scaled accordingly to the
production data available . • A comparison between the results of many farms with different characteristics is presented.
19
Recommendations
• In the list below some extension areas are given: – Correct the NET estimated PD AEP with the Long Term of Wind Resources correction – Include more sites and deep analysis of the different aspects of every site, and even better if
some aspects could be quantified and statistically processed. – Resolution of the PD and the time stamp for shorter than monthly production data. – Uncertainties details of the wake modeling, curtailment, losses estimation and availability of
the turbines vs. spatial variability. – Including nacelle wind data in the analysis for directional behavior investigation
20

Contact: [email protected]


