
213
CHAPTER VI
Analysis of Economic Value Added (EVA)
and Market Value Added (MVA)
Maximizing shareholders value is becoming the new corporate
standard in India. The corporates, which give the lowest preference to the
shareholders’ inquisitiveness, are now bestowing the utmost inclination to it.
Shareholder’s wealth in terms of the returns they receive depends on their
investment. The returns can either be in the form of dividends or in the form
of capital appreciation or both. Capital appreciation in turn depends on the
subsequent changes in the market value of the shares. This market value of
shares is influenced by a number of factors, which can be company specific,
industry specific and macro-economic in nature1.
An important goal of financial management is to maximise the wealth
of the organisation, highest capital employees wealth and consequently
enhance the value of the firm. Shareholder’s wealth is traditionally reflected
by either standard accounting parameters (such as profits, earnings and cash
flow from operations) or financial ratios (including earnings per share, return
on capital employed, return on net worth, net profit margin, operating profit
margin etc). All these indicators fail to measure the true economic worth due
to manipulative accounting techniques to state higher or lower earnings,
depending on non-meaningful decision on how to record revenues or
expenses. Standard accounting principles fail to reflect the varying cost of
capital among the business within a company or the difference in risk in the
case of alternative business strategies in the earnings.
1. Mangala, Deepa and Joura Simpy, (2002) Linkage between economic value added and
market value: An Analysis in Indian context, Indian Management Studies, Journal,
pp-55-56.

214
This financial information is used by managers, shareholders and other
interested parties to asses their firm’s current performance, and also by
stakeholders to predict its future performance. The question that then arises is,
whether these measures of corporate performance are linked to the
expectation of the shareholders or not. The problem with their performance
measure is the lack of a proper benchmark for comparison. To help corporate
to generate value for shareholders, value-based management system has been
developed. Indeed, value based management, which seeks to integrate finance
hypothesis with strategic economic philosophy, is considered as one of the
most significant contributions to corporate financial planning2.
Over the past several years, an alternative performance measure called
the Economic Value Added (EVA) has been gaining acceptance around the
globe and has also been acknowledged by institutional firms as a credible
performance measure in order to overcome the limitations of accounting
based measures of financial performance. Joel M stern and G. Bennett
Stewart & co., introduced a modified concept of economic profit in 1990, in
the name of Economic Value Added (EVA) as a measure of business
performance. Stern Stewart has claimed that EVA, as a tool of financial
management, is neither ‘just a phenomenon’ nor is it united to ‘for profit’
organizations. Economic value added has been put to use for management
performance evaluation, and more than just a measure of performance, it is
the framework for a complete financial management (for improving scarce
capital allocation; and valuation of a target company at the time of
acquisition).
EVA as a tool of financial performance measurement
Shareholders value creation is the new buzzword today and Economic
Value Added (EVA) is its most popular measure. In simple terms EVA is 2. MC Taggart, James et al., (1994). The Value imperative, Free Press; New York, PP 4-6.
215
nothing but returns generated above cost of capital. It is the Net Operating
Profit After Tax (NOPAT) minus an appropriate change for the opportunity
cost of all capital invested (WACC) in an organization. EVA is an estimate of
“economic profit” or the amount by which earnings exceed or fall short of the
required minimum rate of return that shareholders and lenders could get by
investing capital in other securities of analogous risk3.
EVA as a tool of financial measurement enlightens whether the
operating profit is enough to cover the cost of capital. Shareholders must earn
sufficient returns for the risk they have taken in investing their funds in
companies’ capital. According to business standard-KPMG, if a company’s
EVA is negative, the firm is destroying shareholder’s wealth even though it
may be reporting a positive and growing earning per share and return on
capital employed4. The EVA framework, which is becoming more and more
admired tool for measuring the financial performance of corporate, offers a
consistent approach to set goals and measure performance, communicate with
investors, evaluate strategies, allocate capital valuing acquisitions and
determine incentive bonuses. It is one of the several on going initiatives for
new corporate.
The evaluation and growth of the concept EVA, which may be
realistically in young age in the west has been going through its childhood in
country like India. It may be quite an emerging concept in the minds of Indian
corporate policy makers and managers. Hence this chapter examines in detail
the EVA of selected automobile industry. It consists of sub-parts like EVA-
based ranking of selected companies, industry-wise and sector-wise trends in
EVA-based ranking. Results and discussion on statistically established trends.
3. Jaishweta, (2003). Godrej Retools for Value, Business Standard, P. 6.
4. Purikh, Parag, (2002). The Universe of Wealth Creation, PPFAS-Financial Advisory
Services Ltd-Online P. 2.

216

217

218
This chapter also examines the linear regression analysis in the midst of
Market Value Added (MVA) and other traditional financial variables like
EVA, EPS, ROCE, NOPAT and RONW of sample companies. It also
discusses multiple regression analysis and MVA and other financial variables
of sample companies sector-wise.
EVA of selected companies
EVA-based performance framework not only provides a far more
accurate report card on corporate financial performance than conventional
measures, but also has considerable implications for companies on how to
make strategic decisions and manage the healthier financial performance in
their pursuit of shareholder value. EVA created by the selected automobile
industry during the study period is depicted in Table 6.1. The table shows that
out of twelve industry, eleven industry has generated positive EVA during the
study period except in the year 1998-99, 2002-03, 2004-05 and one company
has destroyed their shareholder’s wealth completely.
It may be observed from Table 6.1 that Ashok Leyland Ltd and Eicher
Motors Ltd out of twelve companies have been generating the positive EVA
all the way throughout the period of study. On the other hand, Daewoo
Motors India Ltd is the only company which has been annihilating the wealth
of shareholders right through the period except in the year 1995-96. Tata
Motors Ltd, Bajaj Auto Ltd, Maharastra Scooters India Ltd created positive
EVA during the major part of eleven years period. Rest of the companies
slightly showed instability on their front.
On the whole the Table 6.1 concludes that about one-third (4 out of
12), of the sample companies have been able to govern affirmative EVA
during period under study whereas remaining companies are feasible to
append a very little to the value of shareholders.

219

220
Table 6.3
EVA-Sector-Wise Trends (1995-96-2005-06)
S.No Industry Mean
(Rs.in.crores) CV CAGR
1. Ashok Leyland Ltd 241.06 0.28 4.14
2. Tata Motors Ltd 233.21 4.22 -6.89
3. Eicher Motor Ltd 22.21 0.66 8.54
4. Swaraj Mazda Ltd 12.05 0.46 5.20
Commercial Vehicles Sector 127.33 2.03 -2.71
5. Hindustan Motors Ltd 10.19 9.73 -6.15
6. Mahindra and Mahindra Ltd 149.55 3.24 -3.10
7. Maruthi Udyog Ltd 49.14 22.16 -22.32
8. Daewoo Motors India Ltd -62.34 1.17 -0.77
Passenger Cars and Multiutility
Vehicles Sector 36.63 11.38 -17.85
9. Bajaj Auto Ltd 541.65 1.36 -12.57
10 Maharastra Scooters Ltd 25.90 1.67 -3.23
11. TVS Motors India Ltd 45.97 3.00 -17.28
12. Hero Honda Motors Ltd 201.02 0.92 24.94
Two and Three Wheelers Sectors 203.65 0.92 -2.21
Whole Automobile Industry 122.54 1.86 -6.15
Source: Computed

221
EVA based ranking of selected companies
Table 6.1 also presents EVA-based ranking of sample companies. It is
evident from the table that companies like Tata Motors Ltd, Ashok Leyland
Ltd are toping in the list during the study period. On the other hand
companies like Hindustan Motors Ltd and Daewoo Motors India Ltd have
been loosing the grounds. Rest of the companies have indexed unsteady
position during the study period.
EVA based frequencies distribution of sample companies are shown in
Table 6.2. It is clear from that seven companies in 1998-99, 2002-03, two in
2003-04 and one company in 2004-05, 2005-06 are reporting negative EVA
and the remaining companies are generating positive EVA during the study
period. It is also observed that more than 33 1/3 per cent of the companies
have added to the economic value between Rs.100-500 crores during the
study period and only two companies in 1995-96, three in 1997-98, four in
1999-2000, two in 2001-02 and one in 2002-03 reported an EVA of over
Rs.500 crores.
Sector wise trends in EVA
Table 6.3 presents sector wise EVA of sample companies. It is evident
from Table 6.3 that the mean EVA generated for the automobile industry is
Rs.122.54 crores during the study period. The mean EVA generated is highest
in two and three wheelers sectors followed by commercial vehicles sectors
and passenger cars and multiutility vehicles sector. Two and three wheelers
sector and commercial vehicles sector should perform well in this regard
because their average is more than the industry average. It is also evident
from the table that all selected sectors and whole industry witnessed very high
fluctuation in their EVA during the study period. Table 6.3 further reported
that the commercial vehicles, passenger cars and multi-utility vehicle sector
and few of two and three wheelers sectors and whole industry registered
negative compound annual growth rate of EVA during the study period.

222
223
The economic value added of selected industry under commercial
vehicles sector during the study period is presented in Table 6.3. The mean
EVA was highest in Ashok Leyland Ltd followed by Tata Motors Ltd, Eicher
Motors Ltd and Swaraj Mazda Ltd. All the industry under the sector had
registered very high fluctuation in their EVA during the study period. It is
also evident from the table that Tata Motors Ltd registered negative
compound annual growth rate of EVA during the study period.
Table 6.3 also depicts the EVA generated by the selected companies
under passenger cars and multiutility vehicles sector during the study period.
It portrays that Daewoo Motors India Ltd showed negative EVA throughout
the study period. The mean of Mahindra and Mahindra Ltd was highest
followed by Maruthi Udyog Ltd and Hindustan Motors Ltd. All the
companies registered very high fluctuation in their EVA during the study
period. All the companies witnessed negative compound annual growth rate
of EVA.
The EVA generated by the companies under two and three wheeler
sector during the study period is presented in Table 6.3. It is evident from the
table that the mean of Bajaj Auto Ltd was highest followed by Hero Honda
Motors Ltd, TVS Motors Company Ltd and Maharastra Scooters Ltd. All the
companies registered very high fluctuation in their EVA during the study
period. The compound annual growth rate of all companies was negative
except Hero Honda Motors Ltd during the study period.
The sector wise paired test provides the value of t test in Table 6.4. The
table exhibits that there has been significant deviation (at 5% level) in the
EVA of respective years except for the year 2001-2002 to 2004-2005.

224

225
Comparison of EVA and conventional method of financial performance
Analysing the corporate performance of Indian automobile industry
based on Return On Capital Employed (ROCE) the conventional benchmarks
and on the new “trendier” one i.e., EVA, the results can be well exhibited in
Table 6.5. From the table, it can be inferred that Indian automobile industry
depicts a ROCE picture in terms of return on capital employed. The mean
value of return on capital employed of automobile industry during the study
period 24.51 per cent i.e., for every Rs.100 investment, the return is Rs.24.51
whereas EVA as a percentage of capital employed is only 7.04 i.e for every
Rs.100 investment the company has added value of Rs.7.04. The same picture
is reflected as in case of all three sectors. Thus, the comparison shows that
divergence is less existent between the performance results given by
traditional measure and EVA. However, the traditional measures do not
reflect the real value addition to shareholders wealth and thus EVA has to be
measured to have an idea about the shareholders value addition.
Market Value Added (MVA) of selected companies
The MVA explains the value added to a particular equity share over its
book value. It informs how much value has been added in the economic value
of the shareholders. In view of that, a company with an objective of pleasing
to the eyes of the shareholders wealth should endeavor to take advantage of
its MVA. MVA can be estimated by subtracting the book value of shares from
the market value of shares. It is silent that EVA helps in pushing up the MVA
of an organisation. Thus, EVA can be considered as an internal measure and
MVA as the external measure of a company’s financial performance.
Table 6.6 presents MVA calculation of selected companies of Indian
automobile industry. On the base of the table, it may be observed that out of
12 companies, 11 companies have registered positive MVA throughout the

226

227
228
study period. It indicates that the market value of these companies is
dominating over the book value. On the other hand, Hindustan Motors Ltd
(1997-98, 1999-00 to 2001-02), Daewoo Motors India Ltd (1997-98, 1999-00
to 2003-04) have registered negative MVA during the study period. It shows
that the book value of these companies is dominated over the market value.
MVA based ranking of selected companies
Table 6.6 also provides MVA based ranking. Glancing all the way
through the table, it is noticed that all companies like Maruthi Udyog Ltd,
Bajaj Auto Ltd, Hero Honda Motors Ltd, Tata Motors Ltd, Ashok Leyland
Ltd are topping the list and on the other side companies like Daewoo Motors
India Ltd, Swaraj Mazda Ltd and Maharastra Scooters India Ltd, are
struggling in terms of MVA over the period.
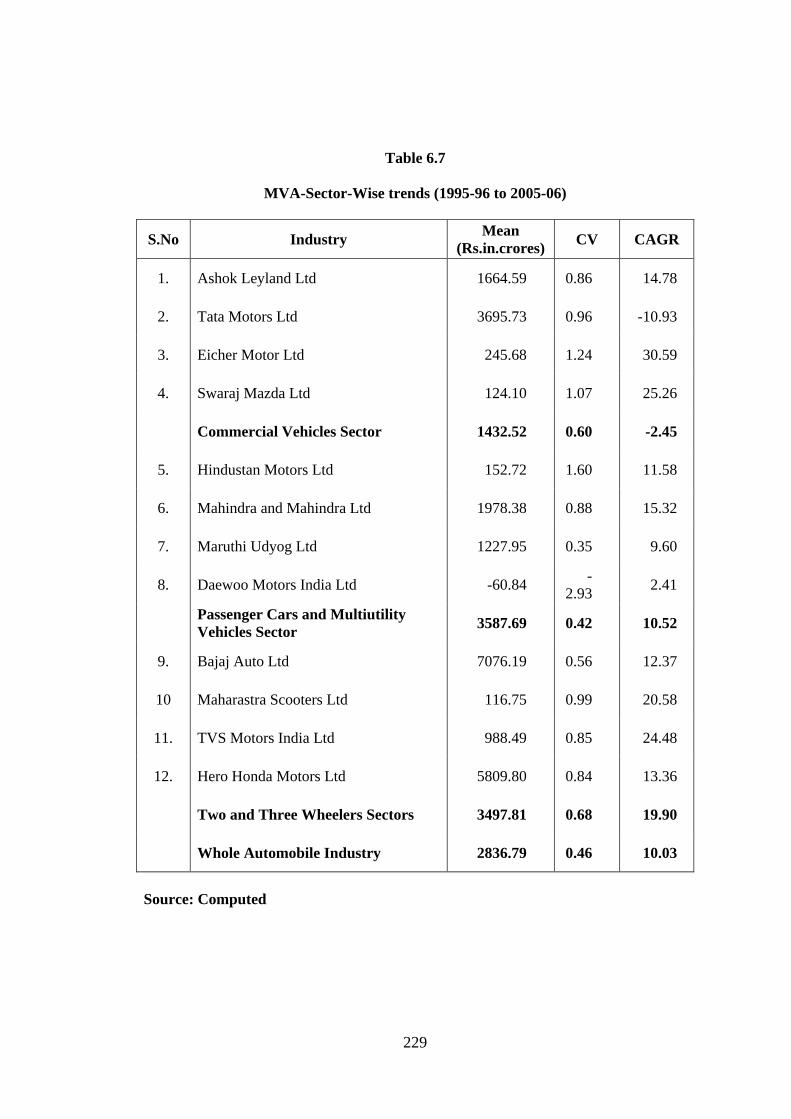
Sector wise trends MVA
Table 6.7 portrays whole automobile industry and sector wise
information pertaining to MVA. It is evident from Table 6.7 that among the
three sectors, passenger cars and multiutility vehicles sector have been
generating highest market value added throughout the study period. This was
due to better market value added of Maruthi Udyog Ltd and Mahindra and
Mahindra Ltd. It was followed by two and three wheeler sector. Table 6.7 also
shows that all the selected sectors of automobile industry have been
generating aggregate MVA throughout the period. The growth of MVA is
consistent in case of passenger cars and multiutility vehicles whereas less
consistent in case of commercial vehicles and two and three wheelers sector.
Table also brings out that only the commercial vehicles sector had registered
negative compound annual growth rate of MVA during the study period.
229
Table 6.7
MVA-Sector-Wise trends (1995-96 to 2005-06)
S.No Industry Mean
(Rs.in.crores) CV CAGR
1. Ashok Leyland Ltd 1664.59 0.86 14.78
2. Tata Motors Ltd 3695.73 0.96 -10.93
3. Eicher Motor Ltd 245.68 1.24 30.59
4. Swaraj Mazda Ltd 124.10 1.07 25.26
Commercial Vehicles Sector 1432.52 0.60 -2.45
5. Hindustan Motors Ltd 152.72 1.60 11.58
6. Mahindra and Mahindra Ltd 1978.38 0.88 15.32
7. Maruthi Udyog Ltd 1227.95 0.35 9.60
8. Daewoo Motors India Ltd -60.84 -
2.93 2.41
Passenger Cars and Multiutility
Vehicles Sector 3587.69 0.42 10.52
9. Bajaj Auto Ltd 7076.19 0.56 12.37
10 Maharastra Scooters Ltd 116.75 0.99 20.58
11. TVS Motors India Ltd 988.49 0.85 24.48
12. Hero Honda Motors Ltd 5809.80 0.84 13.36
Two and Three Wheelers Sectors 3497.81 0.68 19.90
Whole Automobile Industry 2836.79 0.46 10.03
Source: Computed

230
231
The market value added of selected companies under commercial
vehicles sector during the study period is also presented in Table 6.7. This
table reveals that the mean MVA of Tata Motors Ltd were the highest
followed by Ashok Leyland Ltd, Eicher Motors Ltd and Swaraj Mazda Ltd.
Table 6.7 brings out that all the selected companies under the commercial
vehicles sector had registered very high fluctuations in their MVA during the
study period.
Table 6.7 presents MVA of selected companies under passenger cars
and multiutility vehicles sector. The table shows that the companies like
Maruthi Udyog Ltd and Mahindra and Mahindra Ltd are top in the list and it
was followed by Hindustan Motors Ltd and Daewoo Motors India Ltd. All the
selected companies except Maruthi Udyog Ltd has registered very high
fluctuation in their MVA during the study period. Table 6.7 brings out values
relating to compound annual growth rate of MVA selected companies. It is
evident from the table that all the companies had registered positive growth,
rate of MVA during the study period.
Table 6.7 brings out the values relating to MVA of selected companies
under two and three wheelers. Table 6.7 showed that Bajaj Auto Ltd, Hero
Honda Motors Ltd are comparatively top in the list. On the other hand,
Maharashtra Scooters Ltd are struggling on their front with regard to MVA
during the study period. It is also noticed that all the selected companies have
registered very high fluctuations in their MVA during the study period. The
analysis of compound annual growth rate of MVA showed mixed trend
during the study period.
The sector-wise paired test provided the value of the t test in Table 6.8.
The table exhibits that there has been no significant deviation in MVA in
respect of years except for the year 1995-96, 2003-04 and 2004-05.

232
MVA vis-a-vis other financial variables-Linear Regression and Multiple
Regression Analysis
In this section an attempt to find the relevance of Stern and Stewart’s
claim that MVA of the firm is largely positive association with or driven by
its EVA generating capacity and other financial variables like EPS, ROCE,
NOPAT and RONW. Based on the sample of 12 companies of Indian
automobile industry for a period of 11 years, the analysis of this section is
divided into two parts: in the first part, the linear regression analysis between
dependent and particular selected independent variables (s) has been
examined and in the second part multiple regression analysis between MVA
and other financial variables has been looked at for the selected sectors of
automobile industry during the study period.
Linear Regression Analysis of MVA and selected Financial Variables
In this section, results of correlation co-efficient, linear regression,
Durbin-Watson Model, F-Statistics and t-statistics have been determined
between dependent variable (MVA) and Independent variables. The values
hence obtained have their particular statistical sense. The regression co-
efficient for independent variables like EVA, EPS, ROCE, NOPAT and
RONW so worked out portray the temperament of association between the
dependent and particular independent variable. The F statistics and t statistics
so calculated determine the level of significance and insignificance being
associated between the variables. Durbin-Watson Model allows the researcher
to establish the auto-correlation, if any between dependent and independent
variable (the desirable value is two and any value more than two signifies
negative auto-correlation and vice-versa); values of adjusted R2 indicate the
extent of variation in the dependent variable which may be explicated by
independent variables and the standard error speaks about the limits within
which the estimated value as the dependent variable is expected to lie.
233
Table: 6.9
MVA-EVA: Linear Regression Analysis
Dependent variable-Market Value Added (MVA)
Independent variable-Economic Value Added (EVA)
Independent
variable
Co-
efficient t
Multipl
R
R-
Square
Adjusted
R -
Square
Std.
Error
of the
estimate
Durbin-
Watson
F
value
Commercial
Vehicle
EVA 0.97 0.920 0.293 0.09 -0.02 864.22 0.72 0.85
Passenger
Cars and
Multiutility
Vehicles
EVA 0.25 0.207 0.069 0.01 -0.11 1586.28 0.53 0.04
Two and
Three
Wheelers
EVA -1.80 -0.432 0.143 0.02 -0.09 2480.13 0.17 0.19
Whole
Industry
EVA -0.46 -0.241 0.080 0.01 -0.10 1381.10 0.34 0.06
Source: Computed
Table 6.10
MVA- EPS: Linear Regression Analysis
Dependent variable-Market Value Added (MVA)
Independent variable-Earnings Per Share (EPS)
Independent
variable
Co-
efficient t
Multi
R
R-
square
Adjusted
R-square
Std.
Error of
the
estimate
Durbin-
Watson
F
value
Commercial
Vehicle
EPS 45.22 1.60 0.47 0.22 0.14 797.77 0.66 2.56
Passenger
Cars and
Multiutility
Vehicles
EPS -8.57 -0.83 0.27 0.071 -0.032 1532.55 0.67 0.69
Two and
Three
Wheelers
EPS 134.06 1.27 0.39 0.153 0.058 2306.61 0.482 1.62
Whole
Industry
EPS -12.23 -0.43 0.14 0.020 -0.089 1371.82 0.364 0.18
Source: Computed

234
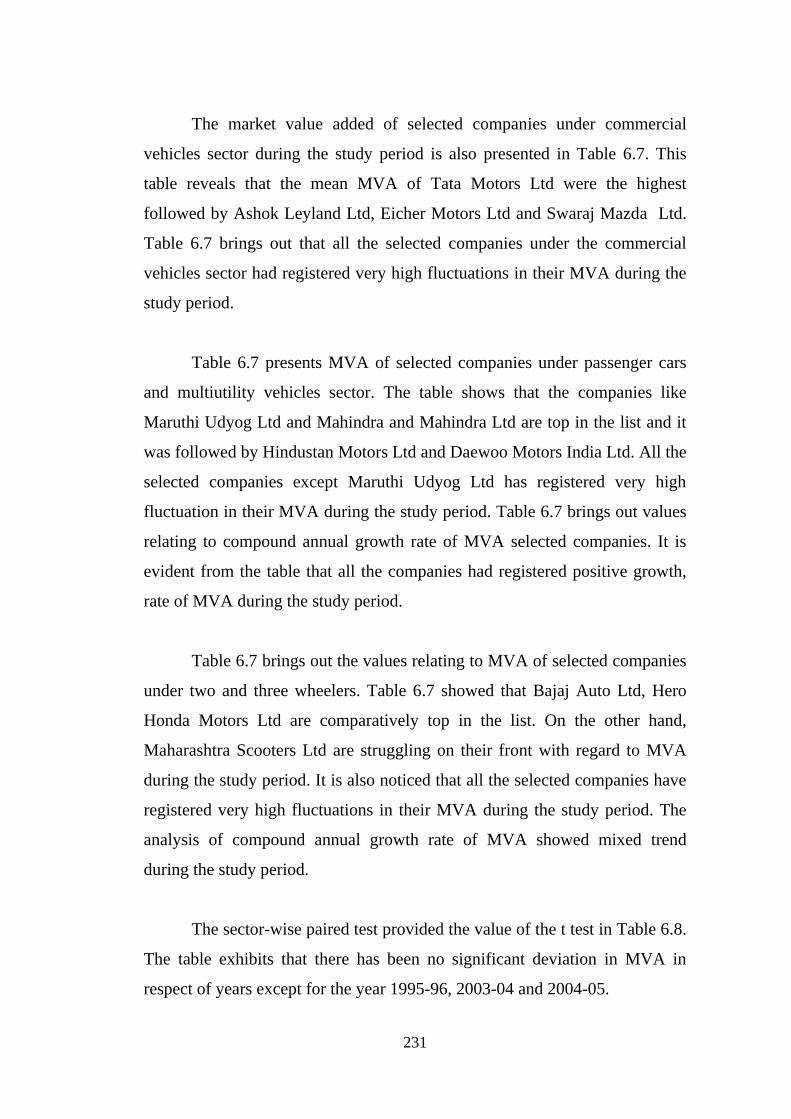
MVA-EVA Analysis
Table 6.9 offers the explanation about the regression on analysis
between MVA and EVA during the study period for the whole automobile
industry and its three sectors. Table 6.9 provides the values of R, R-square
and adjusted R2 for the whole industry 0.080, 0.01, -0.10 respectively. It
sounds that there exists poor relationship between MVA and EVA in
automobile industry, as the value of R-square is negative. Interestingly, the t
and F statistics give the identical results but both of them lead to insignificant
association between the variables under reference. It is evident from the table
that the overall result in passenger cars and multiutility vehicles does not
differ from whole industry and statistical association between MVA and EVA
is again insignificant. Tables 6.9 suggest that the adjusted R2 value is negative
in all cases in all the selected sectors of Indian automobile industry.
MVA-EPS Analysis
The linear regression analysis between MVA and EPS is presented in
Table 6.10 for the study period. It is evident from the Table 6.10 that the
correlation co-efficient between MVA and EPS during the study period is
0.14 and the value of R-Square and adjusted R-Square is very low and may
not be adequate for the fitness of the model. The t and F statistics suggest that
the association between MVA and EPS of automobile industry is not
significant and EPS does not suitably explain MVA. It is evident from the
table that the correlation co-efficient between MVA and EPS in passenger
cars and multiutility vehicles is 0.27 and the adjusted R-Square value is
negative. This shows the poor fitness of the model. Both t statistics and F
statistics certify that the association between these two variables is
insignificant as presented in the table. The t and F statistics are resulting
identical values and secured that EPS of commercial vehicles sector has been
able to describe MVA in better term than the other sectors. The overall results
showed that EPS is positively associated with MVA in all the three sectors
and the whole industry during the study period.

235
Table: 6.11
MVA-ROCE: Linear Regression Analysis
Dependent Variable: Market-Value Added (MVA)
Independent Variable: Return on capital employed (ROCE)
Independent
variable
Co-
efficient t
Multiple
R
R-
square
Adjusted
R-
Square
Std.
Error of
the
estimate
Durbin-
Watson
F
value
Commercial
Vehicle
ROCE 10.493 0.380 0.126 0.02 -0.09 896.80 0.72 0.14
Passenger
Cars and
Multiutility
Vehicles
ROCE 6.359 0.125 0.042 0.01 -0.11 1588.68 0.55 0.02
Two and
Three
Wheelers
ROCE 47.853 0.659 0.214 0.05 -0.06 1353.34 0.34 0.43
Whole
Industry
ROCE -125.179 -0.968 0.307 0.10 -0.01 2384.55 0.35 0.94
Source: Computed
Table 6.12
MVA-NOPAT: Linear Regression Analysis
Dependent Variable: Market-Value Added (MVA)
Independent Variable: Net operating profit after tax (NOPAT)
Independent
variable
Co-
efficient t
Multi
R
R-
square
Adjusted
R-square
Std.
Error of
the
estimate
Durbin-
Watson
F
value
Commercial
Vehicle
NOPAT 3.167 1.745 0.503 0.253 0.170 781.38 0.652 3.045
Passenger
Cars and
Multiutility
Vehicles
NOPAT 9.042 3.758 0.782 0.611 0.568 992.03 0.702 14.12
Two and
Three
Wheelers
NOPAT 18.422 13.997 0.978 0.956 0.951 525.12 2.360 195.92
Whole
Industry
NOPAT 10.478 8.942 0.948 0.899 0.888 440.71 1.201 79.96
Source: Computed

236
MVA-ROCE Analysis
Table 6.11 offers the explanation about the regression analysis between
MVA and ROCE during the study period for the whole automobile industry
and its three sectors. Table 6.11 provides the values of R, R-Square and
adjusted R-Square which are 0.307, 0.10, -0.01 respectively. It sounds that the
value is very low and may not be adequate for the fitness of the model. The
results of whole industry are similar to passenger cars and multiutility
vehicles. Table 6.11 suggests that the variables are clearly correlated in two
and three wheelers but the adjusted R-Square value is negative. However, in
case of passenger cars and multiutility vehicles and commercial vehicles
sector the value of R, R-Square and adjusted R-Square showed that the values
have resulted in poor relationship between MVA and ROCE in these sectors.
The overall results showed that ROCE is negatively associated with MVA in
all the whole industry during the study period.
MVA-NOPAT Analysis
Linear regression analysis between MVA and NOPAT is presented in
Table 6.12. In Table 6.12 the statistical association between MVA and
NOPAT of all the three sectors and the whole industry are provided. The table
reveals that the value of R, R-Square and adjusted R-Square are high and it
may be adequate for the fitness of the model in case of whole industry,
passenger cars and multiutility vehicles sector and two and three wheelers
sector. The t and F statistics also suggest that the association between MVA
and NOPAT is significant and NOPAT is suitable to explain the MVA of
these sectors and the whole industry during the study period. The table reveals
that the value of adjusted R-Square is very low and it may not be adequate for
the fitness of the model, the t and F statistics also suggest that the association
between the MVA and NOPAT is not significant. The overall analysis
showed that NOPAT is positively associated with MVA in all the three
sectors and whole industry.
237
Table: 6.13
MVA-RONW: Linear Regression Analysis
Dependent Variable: Market-Value Added (MVA)
Independent Variable: Return on net worth (RONW)
Independent
variable
Co-
efficient t
Multi
R
R-
square
Adjusted
R-square
Std.
Error of
the
estimate
Durbin-
Watson
F
value
Commercial
Vehicle
RONW 50.435 1.906 0.536 0.288 0.209 762.93 0.982 3.64
Passenger
Cars and
Multiutility
Vehicles
RONW 7.930 0.202 0.067 0.005 -0.106 1586.47 0.529 0.041
Two and
Three
Wheelers
RONW -190.75 -1.392 0.421 0.177 0.086 2272.86 0.571 1.939
Whole
Industry
RONW 36.027 0.592 0.194 0.038 -0.069 1359.330 0.292 0.351
Source: Computed
238
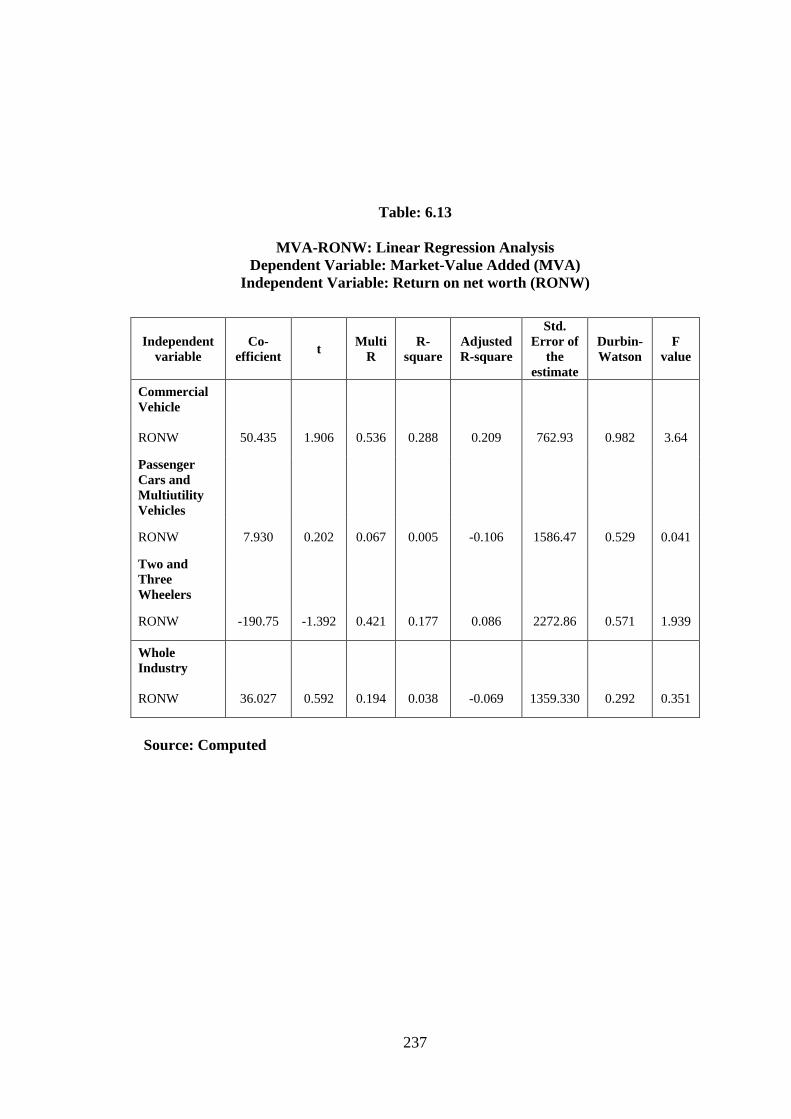
MVA and RONW Analysis
Table 6.13 tenders the elucidation concerning the regression analysis
between the MVA and RONW during the study period. The table 6.13
provides the values of R, R-Square and adjusted R-Square. Table 6.13
suggests that variables are clearly correlated in the whole industry,
commercial vehicles and two and three wheelers sectors and adjusted R-
Square value is positive in two cases. In passenger cars and multiutility
vehicles the value of R, R-Square, adjusted R-Square value is positive in two
cases. In passenger cars and multiutility vehicles the vale of R, R-square,
adjusted R-Square are 0.067, 0.005 and -0.106 respectively. It sounds that
there exists poor relationship between MVA and RONW in passenger cars
and multiutility vehicles sector. The t and F statistics also give identical
results but both of them lead to insignificant association between them. The
overall analysis showed that RONW is negatively associated with MVA only
in case of two and three wheelers sectors during the study period.
MVA vis-à-vis other financial variables-Multiple Regression Analysis
The evidence of the majority of empirical study regarding EVA
suggests that there is a positive relationship between EVA and MVA.
However, when the explaining power of EVA versus traditional performance
measures regarding return is considered, the results are mixed. This is in
continuation with the analysis made in the previous past, an attempt has been
made in this part to find out sector-wise trends as far as the factors affecting
MVA are concerned. The purpose of this analysis whether a particular
independent variable or a set of variables emerges as the most explanatory
variable of the MVA during the study period. In order to meet this objective,
multiple regression analysis has been considered on sector-wise and whole
industry during the study period. The results of multiple regression analysis
are presented in this section.

239
Table: 6.14
Determinants of Market Value Added-Multiple Regression Analysis
(Automobile Industry)
Dependent Variable: Market Value Added (MVA)
Independent variable Co-efficients t-value Significant /
Not significant
Constant 2113.97 4.101
EVA 0.14 1.983 Significant**
EPS 28.76 3.773 Significant*
ROCE 128.89 2.648 Significant*
NOPAT 11.16 5.588 Significant*
RONW 100.48 2.234 Significant*
R2 = 0.98
Adj R2 = 0.97
F = 55.91
DW = 1.88
EVA-Economic Value Added; EPS - Earnings Per share;
ROCE-Return on capital employed; NOPAT-Net operating profit after tax;
RONW-Return on Net worth.
* - significant at 0.05 level; ** - significant at 0.10 level
Source: computed.
Table: 6.15
Determinants of Market Value Added-Multiple Regression Analysis
(Commercial Vehicles)
Dependent Variable: Market Value Added (MVA)
Independent variable Co-efficient t-value Significant /
Not significant
Constant 464.51 1.880
EVA 0.66 2.910 Significant*
EPS 38.87 2.864 Significant*
ROCE 108.88 3.157 Significant*
NOPAT 1.63 1.534 Significant**
RONW 150.79 3.671 Significant*
R2 = 0.81
Adj R2 = 0.63
F = 4.38
DW = 3.09
EVA-Economic Value Added; EPS - Earnings Per share;
ROCE-Return on capital employed; NOPAT-Net operating profit after tax;
RONW-Return on Net worth.
* - significant at 0.05 level ; ** - significant at 0.10 level
Source: computed.

240
Whole Industry
Table 6.14 brings out the determinants of market value added for
whole automobile industry during the study period. It is observed from the
Table 6.14 that all the selected independent variables exerts significant
influence on MVA of automobile industry during the study period. Co-
efficient of determination, R2 in the case 0.98 implies that changes in MVA
are predicted by these independent variables to the extent of 98 per cent. It is
also evident from the table that ROCE is found in strong association with
MVA followed by RONW, EPS, NOPAT and EVA. From the value of
adjusted R2 and F value regression results, it can be concluded that all the
selected independent variables well explain the MVA of automobile industry
during the study period.
Commercial Vehicles
Table 6.15 portrays the results of multiple regression analysis for
commercial vehicles sector. It is revealed from the table that the co-efficient
of determination, R2 value which is 0.81 implies that change in MVA can be
predicted by these independent variables to the extent of 81 per cent only. It is
also found that RONW is strongly associated with MVA followed by ROCE,
EPS, NOPAT and EVA during the study period. The value of F statistic and
adjusted R2 showed the good fitness of the model.
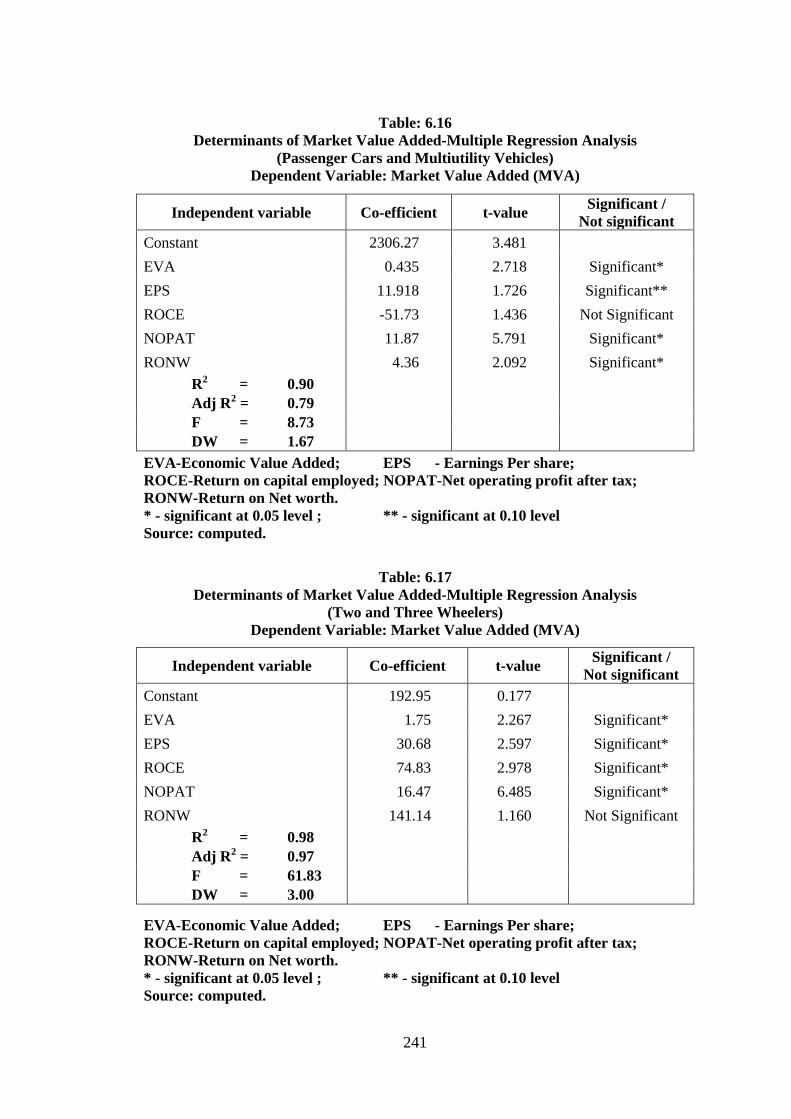
Passenger Cars and Multiutility Vehicles
Table 6.16 gives an account of multiple regression analysis between
MVA and other financial variables in respect of passenger cars and
multiutility vehicles sector. The result provided by this table witnessed that
the variables noticed significantly associated with MVA are EPS, NOPAT,
RONW and EVA. The co-efficient of determination, R2 in this case is 0.90
implying that change in MVA is predicted by these independent variables to
the extent of 90 per cent. The value of R2 and F shows the good fitness of the
model.
241
Table: 6.16
Determinants of Market Value Added-Multiple Regression Analysis
(Passenger Cars and Multiutility Vehicles)
Dependent Variable: Market Value Added (MVA)
Independent variable Co-efficient t-value Significant /
Not significant
Constant 2306.27 3.481
EVA 0.435 2.718 Significant*
EPS 11.918 1.726 Significant**
ROCE -51.73 1.436 Not Significant
NOPAT 11.87 5.791 Significant*
RONW 4.36 2.092 Significant*
R2 = 0.90
Adj R2 = 0.79
F = 8.73
DW = 1.67
EVA-Economic Value Added; EPS - Earnings Per share;
ROCE-Return on capital employed; NOPAT-Net operating profit after tax;
RONW-Return on Net worth.
* - significant at 0.05 level ; ** - significant at 0.10 level
Source: computed.
Table: 6.17
Determinants of Market Value Added-Multiple Regression Analysis
(Two and Three Wheelers)
Dependent Variable: Market Value Added (MVA)
Independent variable Co-efficient t-value Significant /
Not significant
Constant 192.95 0.177
EVA 1.75 2.267 Significant*
EPS 30.68 2.597 Significant*
ROCE 74.83 2.978 Significant*
NOPAT 16.47 6.485 Significant*
RONW 141.14 1.160 Not Significant
R2 = 0.98
Adj R2 = 0.97
F = 61.83
DW = 3.00
EVA-Economic Value Added; EPS - Earnings Per share;
ROCE-Return on capital employed; NOPAT-Net operating profit after tax;
RONW-Return on Net worth.
* - significant at 0.05 level ; ** - significant at 0.10 level
Source: computed.

242
Two and Three wheelers
Table 6.17 describes the results of multiple regressions for
determinants of MVA for two and three wheelers sector during the study
period. It is explicit from the table that all the independent variables are
significantly associated with MVA of two and three wheelers sector during
the study period. Co-efficient of determination, R2 in this case in 0.98
implying that changes in MVA is predicted by selected independent variables
to the extent of 97 per cent. RONW is strongly associated with MVA
followed by ROCE, EPS, NOPAT and EVA. The value of t, F and R2 sounds
the good fitness of the model.


