
Analysis of Dynamic Advisory Messaging – Phase IIFinal ReportAugust 2018
Sponsored byIowa Statewide Transportation Innovation CouncilIowa Department of Transportation(InTrans Project 16-591)

About InTrans and CTREThe mission of the Institute for Transportation (InTrans) and Center for Transportation Research and Education (CTRE) at Iowa State University is to develop and implement innovative methods, materials, and technologies for improving transportation efficiency, safety, reliability, and sustainability while improving the learning environment of students, faculty, and staff in transportation-related fields.
Disclaimer NoticeThe contents of this report reflect the views of the authors, who are responsible for the facts and the accuracy of the information presented herein. The opinions, findings and conclusions expressed in this publication are those of the authors and not necessarily those of the sponsors.
The sponsors assume no liability for the contents or use of the information contained in this document. This report does not constitute a standard, specification, or regulation.
The sponsors do not endorse products or manufacturers. Trademarks or manufacturers’ names appear in this report only because they are considered essential to the objective of the document.
ISU Non-Discrimination Statement Iowa State University does not discriminate on the basis of race, color, age, ethnicity, religion, national origin, pregnancy, sexual orientation, gender identity, genetic information, sex, marital status, disability, or status as a U.S. veteran. Inquiries regarding non-discrimination policies may be directed to Office of Equal Opportunity, 3410 Beardshear Hall, 515 Morrill Road, Ames, Iowa 50011, Tel. 515 294-7612, Hotline: 515-294-1222, email [email protected].
Iowa DOT Statements Federal and state laws prohibit employment and/or public accommodation discrimination on the basis of age, color, creed, disability, gender identity, national origin, pregnancy, race, religion, sex, sexual orientation or veteran’s status. If you believe you have been discriminated against, please contact the Iowa Civil Rights Commission at 800-457-4416 or the Iowa Department of Transportation affirmative action officer. If you need accommodations because of a disability to access the Iowa Department of Transportation’s services, contact the agency’s affirmative action officer at 800-262-0003.
The preparation of this report was financed in part through funds provided by the Iowa Department of Transportation through its “Second Revised Agreement for the Management of Research Conducted by Iowa State University for the Iowa Department of Transportation” and its amendments.
The opinions, findings, and conclusions expressed in this publication are those of the authors and not necessarily those of the Iowa Department of Transportation.

Technical Report Documentation Page
1. Report No. 2. Government Accession No. 3. Recipient’s Catalog No.
InTrans Project 16-591
4. Title and Subtitle 5. Report Date
Analysis of Dynamic Advisory Messaging – Phase II August 2018
6. Performing Organization Code
7. Author(s) 8. Performing Organization Report No.
Skylar Knickerbocker (orcid.org/0000-0002-0202-5872), Shefang Wang
(orcid.org/0000-0002-6178-7447), Neal Hawkins (orcid.org/0000-0003-0618-
6275), Anuj Sharma (orcid.org/0000-0001-5929-5120), and Zach Hans
(orcid.org/0000-0003-0649-9124)
InTrans Project 16-591
9. Performing Organization Name and Address 10. Work Unit No. (TRAIS)
Center for Transportation Research and Education
Iowa State University
2711 South Loop Drive, Suite 4700
Ames, IA 50010-8664
11. Contract or Grant No.
12. Sponsoring Organization Name and Address 13. Type of Report and Period Covered
Iowa Department of Transportation
800 Lincoln Way
Ames, IA 50010
Final Report
14. Sponsoring Agency Code
ITSP-VSLP-(015)--90-00
15. Supplementary Notes
Visit www.intrans.iastate.edu for color pdfs of this and other research reports.
16. Abstract
Transportation agencies spend significant portions of their annual budgets to facilitate safe and efficient travel under hazardous
weather conditions. This project is a continuation of the project titled Evaluation of Dynamic Advisory Messaging – Phase I that
further supports the Iowa Department of Transportation’s (DOT’s) desire to explore how a dynamic advisory system might work
within the Iowa DOT Intelligent Transportation Systems (ITS) platform through data obtained for a segment of I-35.
The evaluation contrasted sensor-driven messages (dynamically derived), based on an algorithm developed in Phase I, with
measurements of speed data under various winter weather conditions. In addition, other data inputs such as friction sensors were
considered by comparing their outputs to traffic sensor data.
Overall, the dynamic advisory messaging system performed as desired by providing alerts of deteriorating conditions during
severe winter events. The system can also identify other sources of traffic impacts outside of winter weather conditions, such as
slow speeds that occur as a result of an incident. The signature of winter events was present in both the friction and traffic data;
however, the friction data at times had more latency. This may be due to the different data reporting frequencies. The findings
showed that speed sensors provided awareness of winter events as well as other non-weather related traffic slowdowns.
17. Key Words 18. Distribution Statement
advisory messaging—traffic operations—winter weather No restrictions.
19. Security Classification (of this
report)
20. Security Classification (of this
page)
21. No. of Pages 22. Price
Unclassified. Unclassified. 51 NA
Form DOT F 1700.7 (8-72) Reproduction of completed page authorized


ANALYSIS OF DYNAMIC ADVISORY
MESSAGING – PHASE II
Final Report
August 2018
Principal Investigator
Skylar Knickerbocker, Research Engineer
Center for Transportation Research and Education, Iowa State University
Co-Principal Investigator
Neal Hawkins, Associate Director
Institute for Transportation, Iowa State University
Anuj Sharma, Research Scientist
Center for Transportation Research and Education, Iowa State University
Zach Hans, Senior Research Engineer and Director
Center for Weather Impacts on Mobility and Safety, Iowa State University
Research Assistant
Shefang Wang
Authors
Skylar Knickerbocker, Shefang Wang, Neal Hawkins, Anuj Sharma, and Zach Hans
Sponsored by
Iowa Department of Transportation
Office of Traffic and Safety
Preparation of this report was financed in part
through funds provided by the Iowa Department of Transportation
through its Research Management Agreement with the
Institute for Transportation
(InTrans Project 16-591)
A report from
Institute for Transportation
Iowa State University
2711 South Loop Drive, Suite 4700
Ames, IA 50010-8664
Phone: 515-294-8103 / Fax: 515-294-0467
www.intrans.iastate.edu


v
TABLE OF CONTENTS
ACKNOWLEDGMENTS ............................................................................................................. ix
EXECUTIVE SUMMARY ........................................................................................................... xi
Winter Storm Event #1 on December 24, 2017 ........................................................................ xi
INTRODUCTION ...........................................................................................................................1
Objective .....................................................................................................................................1
Background .................................................................................................................................1
Existing Performance ..................................................................................................................2
Project Activities .........................................................................................................................5
DATA DESCRIPTION ...................................................................................................................6
Study Corridor .............................................................................................................................6
Data Accessibility .......................................................................................................................7
DYNAMIC ADVISORY ALGORITHM DEVELOPMENT .........................................................8
Comparison between Existing and Proposed Logic....................................................................9
IMPLEMENTATION OF ADVISORY ALGORITHM ...............................................................11
Data Preprocessing Module ......................................................................................................11
Historical Data Analysis Module ..............................................................................................12
Message Display Module ..........................................................................................................12
VERIFICATION OF MESSAGING .............................................................................................13
Winter Storm Event #1 on December 24, 2017 ........................................................................13
Winter Storm Event #2 on December 27, 2017 ........................................................................15
Winter Storm Event #3 on February 6, 2018 ............................................................................16
Summary of Message Verification ...........................................................................................17
ADDITIONAL DATA INPUTS....................................................................................................18
Speed versus Friction Data Comparison ...................................................................................19
Summary of Speed versus Friction Comparison .......................................................................22
CONCLUSIONS............................................................................................................................24
REFERENCES ..............................................................................................................................25
APPENDIX A. MESSAGE VERIFICATION ..............................................................................27
Event #2 on December 27, 2017 ...............................................................................................27
Event #4 on January 24, 2017 ...................................................................................................29
Event #5 on January 11, 2018 ...................................................................................................31

vi
APPENDIX B. SPEED VERSUS FRICTION DATA COMPARISON .......................................35

vii
LIST OF FIGURES
Figure 1. Proposed versus existing logic ....................................................................................... xi Figure 2. Event #1 at I-35 SB @ NE 36th St: Speed profile and roadway surface condition ...... xii
Figure 3. Event #1 at I-35 SB @ NE 36th St: Roadway surface conditions ............................... xiii Figure 4. Performance of existing VSL control logic ......................................................................3 Figure 5. Performance of existing DMS control logic .....................................................................4 Figure 6. Dynamic advisory corridor and sensors ...........................................................................6 Figure 7. Proposed dynamic advisory control logic development flow ..........................................8
Figure 8. Proposed logic versus existing logic ................................................................................9 Figure 9. Dynamic advisory real-time implementation pipeline ...................................................11 Figure 10. Event #1 at I-35 SB @ NE 36th St: Speed profile and roadway surface
condition ........................................................................................................................13
Figure 11. Event #1 at I-35 SB @ NE 36th St: TransSuite TIS software report ...........................14 Figure 12. Event #1 at I-35 SB @ NE 36th St: Roadway surface conditions ...............................14
Figure 13. Event #2 at I-35 SB @ NE 36th St: Speed profile and surface condition ....................15 Figure 14. Event #2 @ I-35 SB @ NE 36th St: TransSuite TIS software report ..........................15 Figure 15. Event #2 @ I-35 SB @ NE 36th St: Camera images of roadway conditions ..............16
Figure 16. Event #3 at I-35 SB @ MP 94: Speed profile ..............................................................16 Figure 17. Map of sites for comparison .........................................................................................18
Figure 18. Site #1 on December 24, 2015 .....................................................................................19 Figure 19. Site #1 on December 28, 2015 .....................................................................................20 Figure 20. Site #3 on December 24, 2015 .....................................................................................20
Figure 21. Site #1 on January 11, 2018 .........................................................................................21 Figure 22. Roadway surface conditions of Site #1 on January 11, 2018 .......................................21
Figure 23. Site #2 on December 24, 2017 .....................................................................................22 Figure 24. Roadway surface conditions of Site #2 on December 24, 2017 ...................................22
Figure 25. Event #2 @ I-35 SB @ MP 94: Speed profile .............................................................28 Figure 26. Event #2 @ I-35 SB @ MP 94: Camera view of traffic event .....................................28
Figure 27. Event #2 @ I-35 SB @ NE 126th Ave: Speed profile and surface condition ..............29 Figure 28. Event #4 at I-35 NB at 1st Ave Ankeny SB: Speed profile .........................................30 Figure 29. Event #4 at I-35 SB @ MP 94: Speed profile ..............................................................30
Figure 30. Event #4 at I-35 SB @ NE 126th Ave: Speed profile ..................................................30 Figure 31. Event #4 at I-35 SB @ NE 158th Ave: Speed profile ..................................................31
Figure 32. Event #5 @ I-35 SB @ NE 36th St: Speed profile and surface condition ...................32 Figure 33. Event #5 @ I-35 SB @ MP 94: Speed profile .............................................................32 Figure 34. Event #5 @ I-35 SB @ NE 126th Ave: Speed profile and surface condition ..............33 Figure 35. Event #5 @ I-35 SB @ NE 158th Ave: Speed profile .................................................34
Figure 36. Site #2 on December 24, 2015 .....................................................................................35 Figure 37. Site #2 on December 28, 2015 .....................................................................................36 Figure 38. Site #1 on December 24, 2017 .....................................................................................36
Figure 39. Roadway surface conditions of Site #1 on December 24, 2017 ...................................37 Figure 40. Site #2 on January 11, 2018 .........................................................................................37 Figure 41. Roadway surface conditions of Site #2 on January 11, 2018 .......................................37

viii
LIST OF TABLES
Table 1. IDs for sensor, location, and TransSuite communication ..................................................6 Table 2. Comparison between proposed and existing logic ..........................................................10
Table 3. Dynamic messaging validation methods .........................................................................13 Table 4. Validation events summary .............................................................................................27

ix
ACKNOWLEDGMENTS
The authors would like to thank the Iowa Department of Transportation Office of Traffic and
Safety and Office of Maintenance for sponsoring this research. The findings and
recommendations within this report are a result of countless discussions and careful attention to
detail brought forward from the project advisory committee.


xi
EXECUTIVE SUMMARY
This project was a continuation of the project titled Evaluation of Dynamic Advisory Messaging
– Phase I. It supported the Iowa Department of Transportation’s (DOT’s) desire to explore how a
dynamic advisory system might work within the Iowa DOT Intelligent Transportation Systems
(ITS) platform through data obtained for a segment of I-35 between the cities of Huxley and
Ankeny. The ultimate deployment of a dynamic system has the potential to advise motorists of
deteriorating roadway conditions (winter weather) and prevent sudden lane departures, braking,
and crashes.
The research team compared the existing logic to the new logic (proposed algorithm) developed
in Phase I. Figure 1 shows a comparison for a specific weather event between the existing logic
(red line) and the proposed advised speed limit control logic (black line).
Figure 1. Proposed versus existing logic
When a big snow event hit the roadway, between 6 a.m. and 8 a.m., most drivers were traveling
at a speed below 20 mph. During this time, the existing logic advised a speed limit of 45 or 55
mph as compared to the proposed logic that advised a more reasonable speed limit of 35 mph.
The research team implemented the new advisory logic for a real-world evaluation where the
messaging was simulated but based on actual weather, traffic, and friction sensing (i.e., messages
were generated; however, no motorists saw these messages along the road).
Winter Storm Event #1 on December 24, 2017
A snow event on December 24, 2017 impacted I-35 near the NW 36th Street interchange. Figure
2 shows the measured traffic sensor (upper chart) and friction data (lower chart).

xii
Figure 2. Event #1 at I-35 SB @ NE 36th St: Speed profile and roadway surface condition
As shown, speeds dropped at around 3 a.m., hovered around 50 mph between 5 a.m. to 8 a.m.,
and then gradually returned to normal around noon. In the chart in Figure 1, the light blue points
were raw sensor data and the solid blue line represented smoothed speeds used to trigger the
advisory messages (straight red line). The new algorithm successfully displayed the message of
“Advised 55 mph” between 3 a.m. to 7 a.m. This was further validated using the TransSuite
Traveler Information System (TIS) software report. The friction conditions illustrated a similar
pattern, changing from the worst condition of snow warning from 3:30 a.m. to 7:15 a.m., then to
ice warning from 7:15 a.m. to almost 8 a.m., to wet, trace moisture, and then finally, dry.
In addition to the quantitative description, the research team downloaded the nearby camera
images during the event. Figure 3 shows this location’s camera view; from top left to bottom
right, it shows the conditions of snow warning, ice watch, wet, and trace moisture, respectively.
The color bordering each camera image can also be related to the friction color shading in Figure
2.

xiii
Figure 3. Event #1 at I-35 SB @ NE 36th St: Roadway surface conditions
Overall, the new dynamic advisory messaging system performed as desired by alerting motorists
of deteriorating conditions during severe events. The system also has the ability to identify other
sources of traffic impacts outside of winter weather conditions. This leads to a responsive system
that can notify motorists, and the agency, of slow speeds for any incident on the roadway.
This effort served as a good starting point toward considering these data streams and the
capability to enhance traveler information during critical travel times.
The use of dynamic message sign (DMS) systems is aimed at providing useful roadway
information, harmonizing traffic flow, and preventing traffic congestion; such goals depend on
realistic, reliable, and real-time traffic messages. The newly designed algorithm for a dynamic
message display system has shown significant improvement over the existing system and its
accuracy was verified using multiple data sources, including surface friction, video cameras, and
the TIS historical messaging reports.
The system developed could be further modified to produce advisory messages (i.e., “slow
traffic,” “traffic delays”) that may be more suitable in a variety of conditions including winter
weather. The benefit of the current system design is the applicability to other situations, such as
work zones or other non-recurring traffic conditions. The system should continue to be improved
by incorporating additional data inputs such as probe speed data, weather data, and friction data.
The current system will continue to be tested and implemented by the Iowa DOT (specifically
related to work zones).


1
INTRODUCTION
This project was a continuation of the project titled Evaluation of Dynamic Advisory Messaging
– Phase I. It supported the Iowa Department of Transportation’s (DOT’s) desire to explore how a
dynamic advisory system might work within the Iowa DOT Intelligent Transportation Systems
(ITS) platform through data obtained for a segment of I-35 between the cities of Huxley and
Ankeny. The ultimate deployment of a dynamic system has the potential to advise motorists of
deteriorating roadway conditions (winter weather) and prevent sudden lane departures, braking,
and crashes.
Objective
The goal was to contrast sensor-driven messages (dynamically derived), based on an algorithm
developed in Phase I, with measurements of both speed and friction data under various winter
weather conditions.
Background
Interstate roadways in Iowa have the highest travel speeds and truck and passenger car volumes
of roadways in the state. They are relied upon each day to accommodate a wide range of vehicle
types. Roadway authorities are acutely aware of the need for reliable travel on the interstate
system and, when problems occur, to provide alerts and warnings to motorists about events that
may impact their travel, such as weather, incidents, and crashes, through the use of dynamic
message signs (DMS). These messages can be manually input, by a traffic management center
operator, or generated automatically based on sensors and set thresholds that are tied to outgoing
message sets.
Dynamic advisory, or variable speed limit (VSL) systems, triggered by atmospheric, surface,
and/or traffic conditions, are a commonly used safety counter-measure to warn drivers about
imminent risks and to suggest an appropriate speed for the existing conditions. Dynamic
advisory systems aim to reduce traffic crashes, postpone or prevent congestion, minimize speed
differences, and harmonize traffic flow during peak periods (Bertini et al. 2006). These systems
can also improve lane utilization and provide a calmer driving experience because of the
measured reductions in crash frequency and severity (Allaby et al. 2007).
Many researchers have studied the effects and logic of VSL in work zones. Lin et al. (2004)
explored the effectiveness of VSL on highway work-zone operations and proposed two online
VSL algorithms to minimize the queue in advance of the work zone and to maximize the
throughput through the work-zone area. Bertini et al. (2006) collected lane-based, 1-minute loop
data on a German autobahn and then extracted information about speed, count, and density
between sensors to drive their VSL logic. Their analysis illustrated a strong correlation between
the displayed speed limit and real traffic dynamics, and they found that a reduced speed limit
before a bottleneck could help manage dense traffic.

2
Wilkie (1997) mentioned that, to provide drivers with realistic, reliable, and real-time roadway
information, the advised speed limit from a VSL system should be based on real-time prevailing
traffic data and/or roadway weather information. The author also proposed several control
strategies such as: setting the data sampling rate to less than or equal to 30 seconds, integrating
weather sensors with each sign, changing speed displays only once per minute, basing smoothing
speed on 1 minute, etc. Katz et al. (2012) provided several guidelines for the use of VSL systems
in wet weather, including displaying changes for at least 1 minute and setting a minimum speed
limit of not less than 30 mph. These authors also reported on several VSL projects related to
weather and their control strategies, based on pavement conditions, weather conditions,
visibility, etc. (Katz et al. 2012, Goodwin and Pisano 2003). For example, the Alabama DOT
operates a 7-mile long corridor with 24 VSL signs along I-10 in Mobile. Based on the visibility
distance, speed limits are changed from 35 mph to 65 mph in increments of 10 mph. The
Washington state DOT has implemented several VSL systems in both urban areas and
mountainous areas. In urban areas, the speed is changed based on speed and occupancy sensors,
whereas in mountainous areas, the speed limits are set manually based on weather information.
The Center for Transportation Research and Education (CTRE) research team developed and
implemented a condition-based dynamic advisory messaging system that could be used to alert
motorists of slow traffic during winter weather conditions. The dynamic advisory messaging was
developed using k-means clustering to label data, which was then used to develop a supervised
learning algorithm. Based on the preprocessed dataset, a support vector machine (SVM) was
then employed to replicate the experts’ engineering judgment, such that as sensor data streamed
in, the proposed dynamic advisory control logic would automatically map the new data to a
proper advisory speed. The performance of the system was evaluated in simulation for multiple
winter weather events over the course of two winter seasons. Due to existing policies, the
dynamic system was not activated for the public, so no evaluation under live conditions was
possible. Friction data were evaluated as an additional input for advisory messaging, and
compared to the speed-based algorithm that was developed.
Existing Performance
The Phase I findings from CTRE about the performance of the existing control logic in real time
are summarized as follows.
The existing logic used to generate sensor-based messages (in this case advisory speeds) is not
designed for the task. Figure 4 displays three advisory speeds, shown as dashed lines, 55 mph, 45
mph, and 35 mph. The solid red lines are messages, which would have appeared on a dynamic
message sign.

3
Figure 4. Performance of existing VSL control logic
Figure 4 indicates room for improvement, especially from 6 a.m. to 8 a.m., when the speed had
already dropped to 10 mph due to the severe snow, but the existing control logic was still posting
messages of 55 mph or 45 mph.
Figure 5 provides another example, although this time the messages would be text based.

4
Figure 5. Performance of existing DMS control logic
The yellow color represents the message of “traffic delay possible,” red represents “slow traffic
ahead,” and blue represents the “stopped traffic ahead” message. The width of each color block
denotes the duration of the message displayed and the DMS performance measures for the day
are reported above the plot. The current control logic generates multiple short-duration messages
and clusters as shown in Figure 5. In addition, the existing messaging strategy did not operate
properly in some situations as a certain message was not displayed at the expected time. The
white strips (no messages displayed) are evidence that the message display control was not
functioning during times of low speed, from 2 p.m. to 4 p.m. at the top and 2 p.m. to 6 p.m. at the
bottom of the left panels.
The above-mentioned examples suggested opportunities for improvement, which prompted the
research team to develop a novel control algorithm based on:
Data smoothing to find the prevailing traffic characteristics
Clustering/Classification to build a data-driven message control logic

5
Project Activities
This report documents the Phase II project findings as follows:
Data Description
Dynamic Advisory Algorithm Development
Implementation of Advisory Algorithm
Verification of Messaging
Additional Data Inputs

6
DATA DESCRIPTION
Study Corridor
Figure 6 shows the study corridor of southbound I-35 between Huxley and Ankeny with four
Wavetronix sensors installed.
Figure 6. Dynamic advisory corridor and sensors
These sensors were associated with four virtual simulated DMS display boards: (1) SIM I-35 NB
@ Millis Civic-OH, (2) SIM I-35 SB @ Corp Woods-OH, (3) SIM I-80 EB @ Jordan Creek-
OH, and (4) SIM I-35 WB @ 4-Mile-OH. By operating these virtual message boards in the
background without display messages, the researchers could verify the accuracy of the messages
before deployment. The posted speed limit for this corridor is 65 mph for the two southern
sensors and 70 mph for the two northern sensors. Table 1 shows the sensor listings used along
with their association with TransSuite Traveler Information System (TIS) software
communication.
Table 1. IDs for sensor, location, and TransSuite communication
Wavetronix ID SIM DMS ID TIS ID
Internal
Comm. ID
I-35 SB @ MP 94 SIM I-35 NB @ Millis Civic-OH 1001 310
I-35 SB @ NE 36th St SIM I-35 SB @ Corp Woods-OH 1002 317
I-35 SB @ NE 126th Ave SIM I-80 EB @ Jordan Creek-OH 1003 309
I-35 SB @ NE 158th Ave SIM I-35 WB @ 4-Mile-OH 1004 389

7
Data Accessibility
Vehicle speed data were collected through a feed from the DOT ITS network on a 20-second
frequency. In contrast, the friction data were not integrated to the ITS network, which prevented
real-time reporting. For this analysis, friction data were obtained from the DOT’s Office of
Maintenance after each winter event. The frequency of data from the friction sensor ranged from
1 minute to 10 minutes but typically was reported every 5 minutes.

8
DYNAMIC ADVISORY ALGORITHM DEVELOPMENT
The dynamic advisory logic was developed following the flowchart shown in Figure 7.
Figure 7. Proposed dynamic advisory control logic development flow
The raw data (Extensible Markup Language [XML] format) from Wavetronix sensors were first
parsed, and then traffic speed and occupancy data were extracted. A wavelet filter was then
applied to de-noise the sensor data. The Iowa DOT decided to use four advisory speed classes to
implement advised speed limits of 70 mph (no message), 55 mph, 45 mph, and 35 mph.
Following this policy, the k-means clustering algorithm was applied to identify distinct groups in
the data. Based on the preprocessed data with labels, a supervised learning algorithm decision
tree was trained to find the underlying function (experts’ engineering judgment) that mapped the
new incoming sensor data (speed and occupancy) to a desired advised speed limit.
To find the prevailing traffic condition, sensor data quality is critical; however, sensor readings
always have inherent noise and a wavelet filter was applied to smooth the sensor data. For the
application of the dynamic advisory message display, real-time noise filtering had to be
performed; therefore, the data were treated as if received in a streaming fashion. To address this
issue, a sliding window approach was used for data smoothing, where the window used a small
subset of recent historical data (previous ~20 minutes).
After smoothing the data, a clustering analysis was applied to assist in the development of the
new DMS control logic. Clustering analyses deal with unlabeled data, whereas supervised
learning algorithms need labeled data, and it is expensive to obtain a labeled dataset. One
approach to labeling data is to apply a clustering method to find reasonable clusters, assign labels
based on the number of clusters, and then use these labeled data for subsequent supervised
classification. Similar to this concept, for this new DMS control logic system, k-means clustering
was applied to cluster unlabeled data into several groups, which could then be used to aid traffic
engineers in assigning specific DMS messages to each cluster.
Based on the preprocessed dataset, a decision tree was used to replicate the engineering
judgment, such that as sensor data streamed in, the improved DMS control logic system
automatically mapped the new data to a proper message and replicated the decision making of a
traffic engineer. The logic was based on different traffic conditions with four types of variable
speed limits generated:

9
Normal condition without display (70 mph)
55 mph advised
45 mph advised
35 mph advised
Comparison between Existing and Proposed Logic
To compare the performance of the generated dynamic message display with the existing system,
three criteria were applied for the number of: (1) total messages, (2) short-duration messages,
and (3) fluctuating clusters. Data from two past snow events in December of 2015 were used for
this preliminary analysis.
Comparisons between the proposed advised speed limit control logic (black line) and the existing
logic (red line) for a weather event are shown in Figure 8.
Figure 8. Proposed logic versus existing logic
The raw speed data and smoothed speed data using wavelet transformation were plotted as light
blue and dark blue lines, respectively. As for the three performance measures, the proposed logic
generated 0 clusters, 0 short messages, and 13 total messages compared with 12 clusters, 27 short
messages, and 120 total messages generated with the existing logic for the winter weather event
in Figure 8. In addition, a closer look at the period between 6 a.m. to 8 a.m., showed a large
speed drop due to a severe snow event and revealed that the proposed logic improved the
relevance of the advisory messaging. Although most drivers were traveling at a speed below 20
mph, the existing logic still advised a speed limit of 45 or 55 mph. On the other hand, the
proposed logic correctly detected the severe traffic condition and provided a more reasonable
advised speed limit of 35 mph.
A comparison of the criteria for both the proposed logic and existing logic, for all four testing
sites along the study corridor, appears in Table 2.

10
Table 2. Comparison between proposed and existing logic
Location Date
Proposed/(Existing)
Cluster Short Msg. Total
I-35 SB @ NE 158th Ave Dec 24, 2015 1/(6) 0/(13) 23/(35)
Dec 28, 2015 0/(1) 0/(2) 14/(33)
I-35 SB @ NE 126th Ave Dec 24, 2015 0/(1) 0/(1) 13/(6)
Dec 28, 2015 1/(1) 0/(1) 22/(30)
I-35 SB @ MP 94 Dec 24, 2015 1/(1) 0/(2) 13/(13)
Dec 28, 2015 0/(12) 0/(27) 13/(120)
I-35 SB @ NE 36th St Dec 24, 2015 0/(0) 0/(0) 3/(5)
Dec 28, 2015 0/(3) 0/(10) 12/(85)
The reason there were no short messages in the proposed control logic was because, besides the
dynamic advisory function, a display time constraint was also implemented (each message was
to be displayed for at least 2 minutes) to avoid short-duration messages.
The preliminary comparison demonstrated a significant improvement of the newly designed
algorithm with the next step of integration within TransSuite and real-time implementation.

11
IMPLEMENTATION OF ADVISORY ALGORITHM
The architecture of real-time implementation shown in Figure 9 includes the following: (1)
downloading the sensor XML data feed, (2) XML parsing, (3) data smoothing, (4) message
classification, and (5) message display.
Figure 9. Dynamic advisory real-time implementation pipeline
The real-time implementation was written in Java with its Weka data mining package for
message classification, JWave for wavelet data smoothing, and TransSuite’s advanced traffic
management system (ATMS) web service application programming interface (API) for posting
classified messages to field DMS signs. The process was grouped into three modules, each of
which will be discussed below.
Data Preprocessing Module
The Iowa DOT maintains over 500 Wavetronix radar sensors statewide with high resolution
traffic data transmitted from these devices every 20 seconds via XML feeds. This program
includes a set of Java methods to download and parse sensor XML files continuously. The need
for data smoothing is critical to find the prevailing traffic conditions (determined by sensor speed
and occupancy), and an example of the smoothing result is shown in the sub-graph in Figure 9,
where the raw data appears in light blue and the smoothed data is shown as a solid black line.

12
Historical Data Analysis Module
The research team applied a data-driven approach to design the control algorithm including (1)
k-means clustering to find a reasonable number of advisory message groups and (2) use of a
classification tree to replicate the experts’ engineering judgment based on smoothed data.
The decision boundaries are illustrated in the bottom-right plot of Figure 9, where the x-axis is
the smoothed sensor occupancy and the y-axis is the smoothed traffic speed. The domain is
coded into four different sections as shown in the left chart, and the decision regions are
represented by color. From top to bottom, the decision regions are: normal conditions with no
message display (red), “Advised 55 mph” (grey), “Advised 45 mph” (light blue), and “Advised
35 mph” (blue).
Message Display Module
Historical data analysis can find functions that are stored in memory by reading the smoothed
speed and occupancy as inputs and then classifies a proper advisory message as output. To send
a message to field DMS signs, TransSuite provides an XML web service interface that allows for
interaction with the Iowa DOT’s ATMS. The messaging history report can be retrieved from the
TransSuite TIS software.

13
VERIFICATION OF MESSAGING
Before deploying the dynamic advisory messaging to the public, the process was implemented in
simulation mode, which allowed for verification of the system without displaying anything to the
public. The real-time dynamic advisory application was launched in fall 2016. The research team
reviewed all events for two winter seasons (2016/2017 and 2017/2018) to validate the accuracy
of the system. In order to validate the accuracy of the real-time implementation, the generated
dynamic messages were compared with multiple data sources, including the roadway weather
information sensor (surface friction), TransSuite TIS internal message logging report, roadway
cameras, and Wavetronix speed sensor profiles. However, these data sources were not available
for all the sites/events; Table 3 summarizes sample data availability for three sample events.
Table 3. Dynamic messaging validation methods
Event ID & Date Location Speed TIS Friction Camera
Event # 1
December 24, 2017 I-35 SB @ NE 36th St
Event # 2
December 27, 2017 I-35 SB @ NE 36th St
Event # 3
February 6, 2018 I-35 SB @ MP 94
Additional event summaries for system verification can be found in Appendix A.
Winter Storm Event #1 on December 24, 2017
A snow event on December 24, 2017 had snow conditions between 1 a.m. and 11 a.m. Figure 10
shows the sensor data during the winter snow event near the 36th Street interchange.
Figure 10. Event #1 at I-35 SB @ NE 36th St: Speed profile and roadway surface condition
14
The speed started to drop around 3 a.m., hovering around 50 mph between 5 a.m. to 8 a.m., and
gradually returned to normal by noon. Meanwhile, the friction conditions illustrated a similar
pattern—changed from the worst condition of snow warning/ice watching to the normal situation
(wet and trace moisture, then dry). In the top plot of Figure 10, the light blue points were raw
sensor data and the solid blue line was smoothed speed that was used to trigger the advisory
messages (straight red line). The new algorithm successfully displayed the message of “Advised
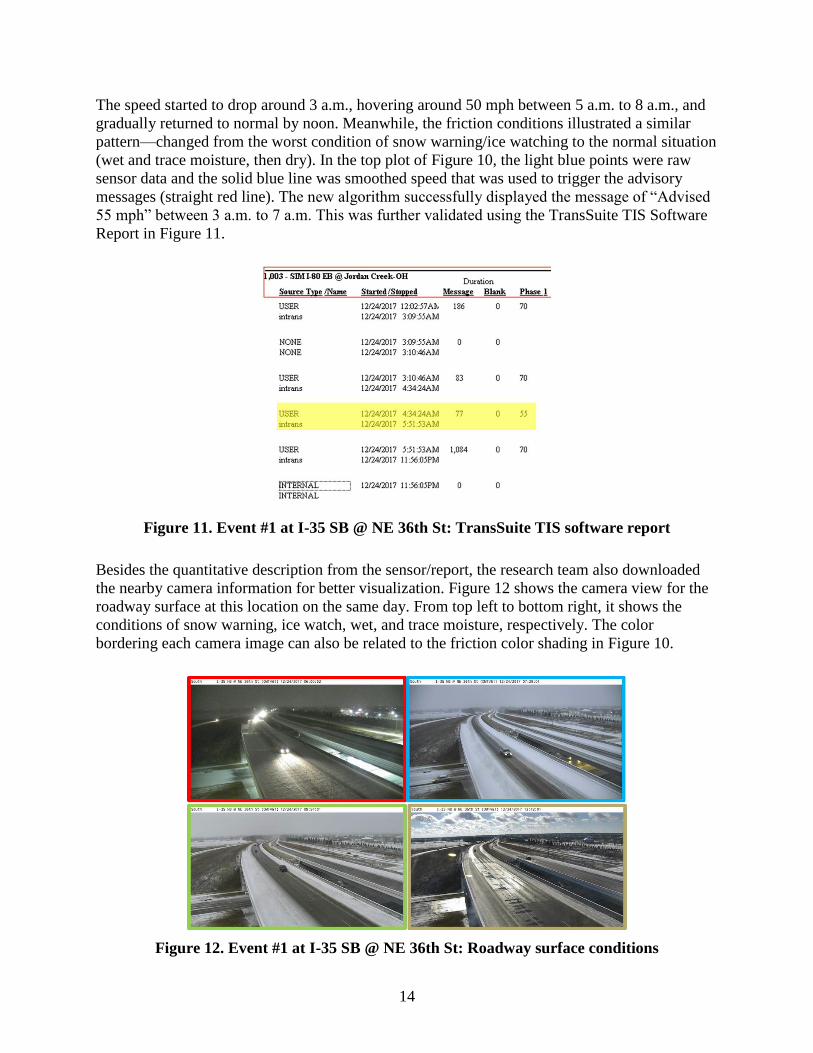
55 mph” between 3 a.m. to 7 a.m. This was further validated using the TransSuite TIS Software
Report in Figure 11.
Figure 11. Event #1 at I-35 SB @ NE 36th St: TransSuite TIS software report
Besides the quantitative description from the sensor/report, the research team also downloaded
the nearby camera information for better visualization. Figure 12 shows the camera view for the
roadway surface at this location on the same day. From top left to bottom right, it shows the
conditions of snow warning, ice watch, wet, and trace moisture, respectively. The color
bordering each camera image can also be related to the friction color shading in Figure 10.
Figure 12. Event #1 at I-35 SB @ NE 36th St: Roadway surface conditions

15
Winter Storm Event #2 on December 27, 2017
Three days after the previous event, another snow storm arrived late at night on December 27,
2017. This section illustrates the advisory messaging results for that day. In addition to the
winter weather advisory messaging, the system was again able to provide alerts for other severe
traffic events that occurred (incidents due to crashes).
Figure 13 illustrates the speed profile at the 36th Street interchange, where the red patched region
indicates the snow warning logged by the roadway friction sensor.
Figure 13. Event #2 at I-35 SB @ NE 36th St: Speed profile and surface condition
This event started around 10 p.m., but speeds were beginning to slow down before that due to the
roadway surface conditions. The advisory messaging logic detected the slow down at 10:20 p.m.
(as the TIS report in Figure 14) and displayed an advisory 55 mph message accordingly.
Figure 14. Event #2 @ I-35 SB @ NE 36th St: TransSuite TIS software report
One highlight from the plot is that, besides responding to the snow storm, the new algorithm also
reacted correctly to a crash around 3:30 p.m. The traffic conditions during the accident are
visible in Figure 13 on the right, where the speed dropped to 20 mph. A nearby camera’s
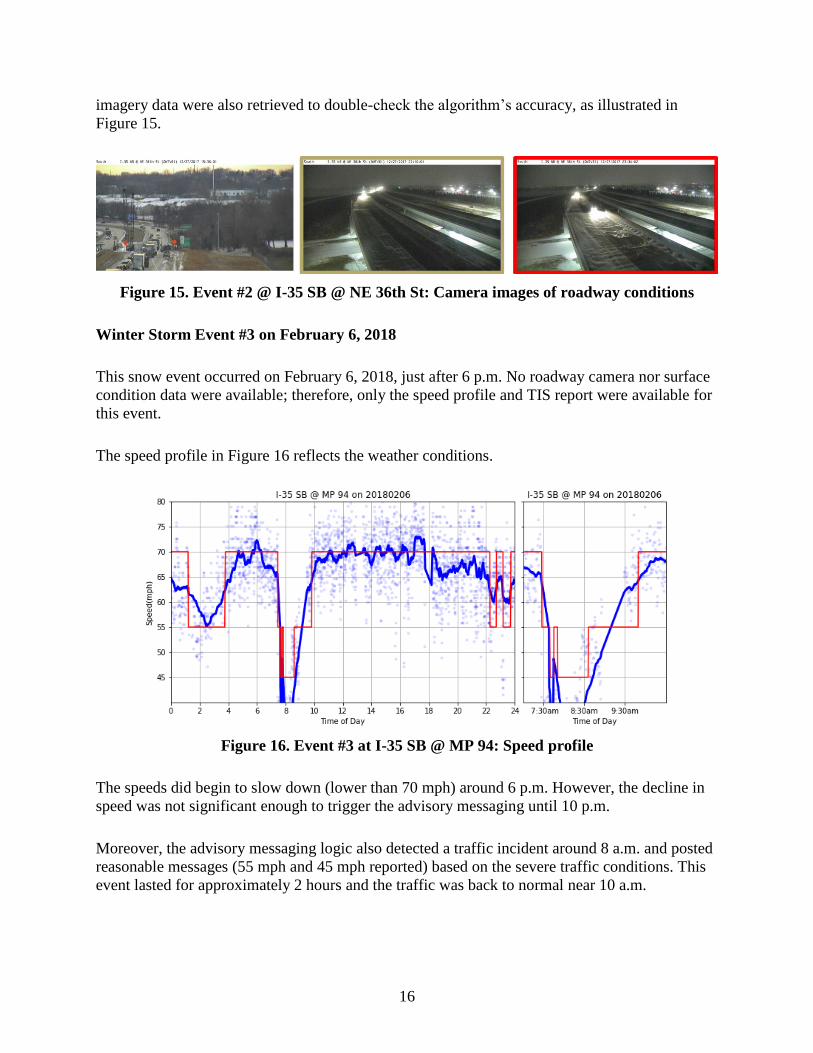
16
imagery data were also retrieved to double-check the algorithm’s accuracy, as illustrated in
Figure 15.
Figure 15. Event #2 @ I-35 SB @ NE 36th St: Camera images of roadway conditions
Winter Storm Event #3 on February 6, 2018
This snow event occurred on February 6, 2018, just after 6 p.m. No roadway camera nor surface
condition data were available; therefore, only the speed profile and TIS report were available for
this event.
The speed profile in Figure 16 reflects the weather conditions.
Figure 16. Event #3 at I-35 SB @ MP 94: Speed profile
The speeds did begin to slow down (lower than 70 mph) around 6 p.m. However, the decline in
speed was not significant enough to trigger the advisory messaging until 10 p.m.
Moreover, the advisory messaging logic also detected a traffic incident around 8 a.m. and posted
reasonable messages (55 mph and 45 mph reported) based on the severe traffic conditions. This
event lasted for approximately 2 hours and the traffic was back to normal near 10 a.m.

17
Summary of Message Verification
Overall, the dynamic advisory messaging system performed as desired by alerting motorists of
deteriorating conditions during severe events. The system also has the ability to identify other
sources of traffic impacts outside of winter weather conditions. This allows for a responsive
system that can notify motorists of slow speeds for any incidents on the roadway.
During light snow events, with minimal impacts to speed, the system did not activate even
though speeds were lower than typically observed. An additional threshold could be defined but
would risk incidental activation due to the characteristics that are similar to free flow conditions.
Additionally, the system was designed for three advisory speeds; however, traffic speeds could
be above or below the advisory speed in any condition, which could cause drivers to go faster
than what conditions allow. It was determined that advisory speeds may not be the most
applicable during these conditions as opposed to providing advisory messaging such as “slow
speeds ahead” and “traffic delays,” which may be preferred.
The Iowa DOT does not currently have policies in place to activate this type of system.
However, a research methodology for this test section of I-35 is in place when implementation
becomes possible.
18
ADDITIONAL DATA INPUTS
Dynamic alerting systems can use a variety of data sources to inform the public depending on the
conditions and rules for alerting (weather, incident, slow speeds, etc.). The dynamic advisory
messaging logic developed by CTRE used traffic data to identify an advisory speed but other
additional data inputs could be used for similar systems. Friction sensors were also installed
along the corridor and were evaluated to determine the suitability of using them in an advisory
messaging system
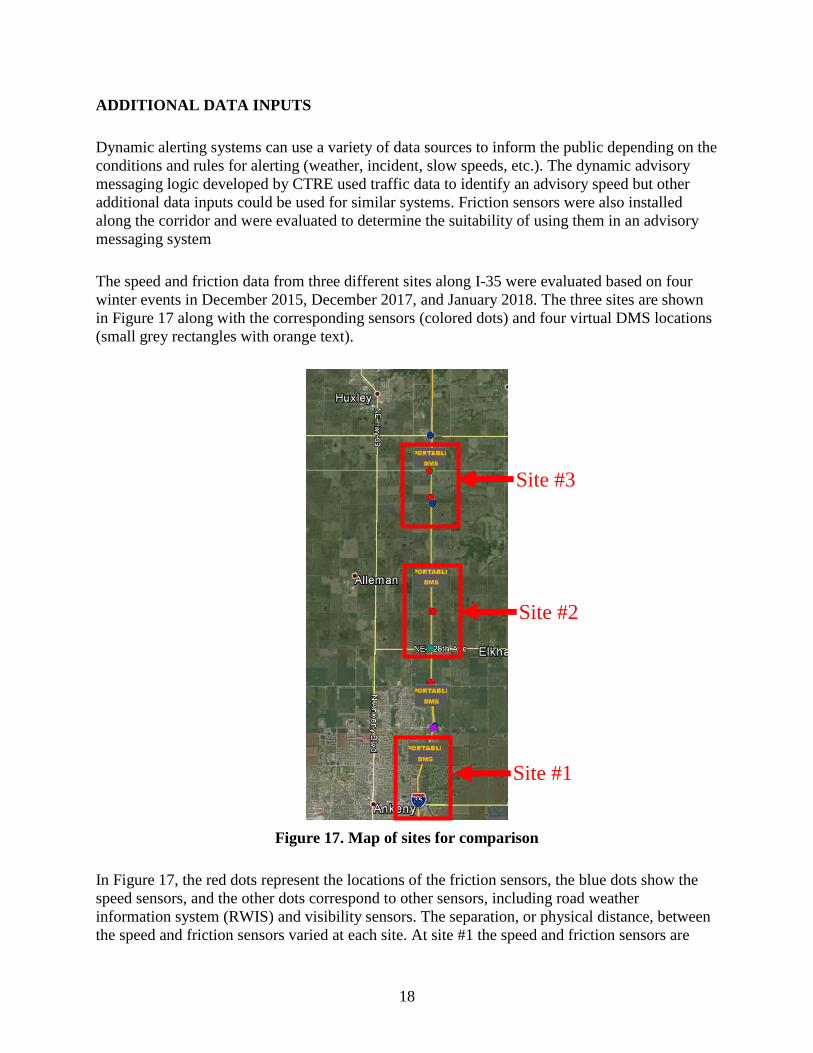
The speed and friction data from three different sites along I-35 were evaluated based on four
winter events in December 2015, December 2017, and January 2018. The three sites are shown
in Figure 17 along with the corresponding sensors (colored dots) and four virtual DMS locations
(small grey rectangles with orange text).
Figure 17. Map of sites for comparison
In Figure 17, the red dots represent the locations of the friction sensors, the blue dots show the
speed sensors, and the other dots correspond to other sensors, including road weather
information system (RWIS) and visibility sensors. The separation, or physical distance, between
the speed and friction sensors varied at each site. At site #1 the speed and friction sensors are
Site #2
Site #3
Site #1

19
located around 2 miles apart, at site #2 the sensors are spaced 1 mile apart, and at site #3 the
sensors are at the same location.
Speed versus Friction Data Comparison
The following section describes some of the events where speed and friction data were
compared. Additional summaries are provided in Appendix B.
Figure 18 and Figure 19 show the speed and friction data at Site 1 on December 24 and 28, 2015,
respectively. The friction sensor for Site #1 is about 2 miles north of the speed sensor. The upper
plot in each figure shows the raw speeds (light blue points) and the smoothed speed (solid blue
line). The lower (line) plot shows the friction sensor values and the (vertical) shading represents
the reported surface condition, which is generated by the sensor (see legend).
Figure 18 shows that vehicle speeds were decreasing prior to any change in reported surface
condition (speed decreased around 10 a.m., which was roughly 30 minutes before the friction
sensor detected that the road was wet).
Figure 18. Site #1 on December 24, 2015
The Figure 18 lower line plot indicates surface changes around the same time as speeds began to
decrease, but were not changed enough to trigger a wet or icy condition (vertical shading). In this
case, it appears that speed provided a better indicator of deteriorating conditions. An RWIS
sensor in the Ames area was also used as a baseline to confirm the surface conditions reported
for December 24 and 28.
Figure 19 shows the speed and friction data during the December 28, 2015 winter event.
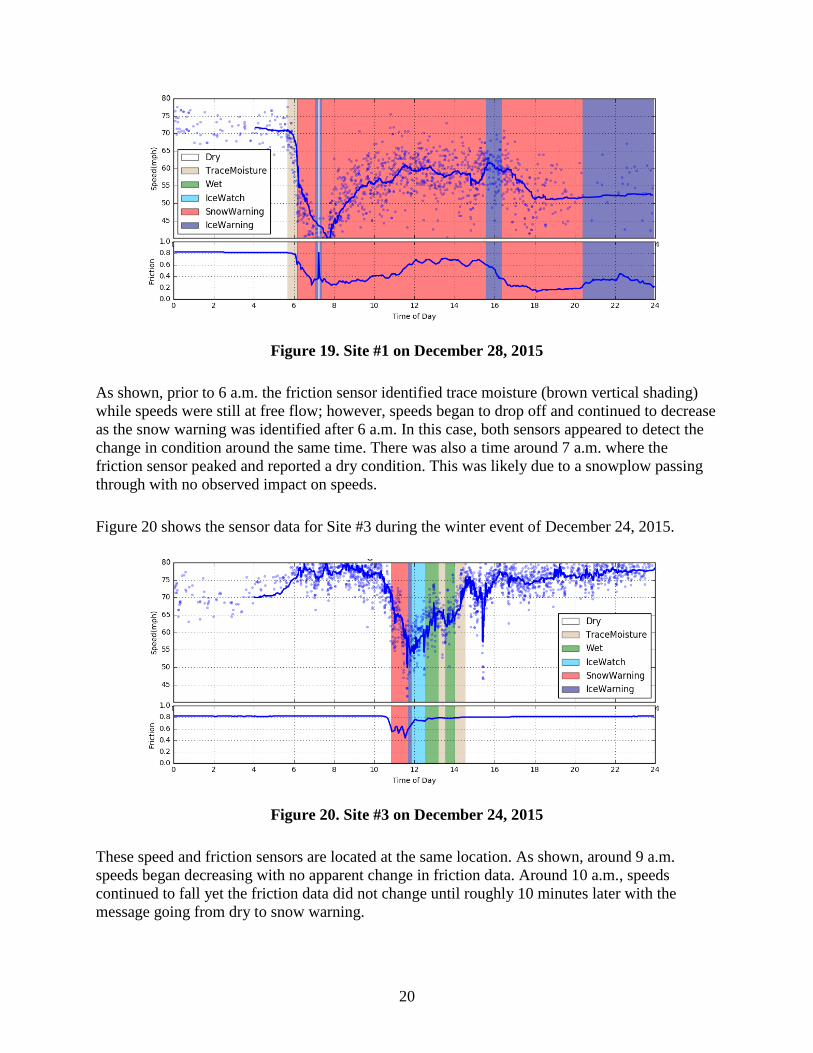
20
Figure 19. Site #1 on December 28, 2015
As shown, prior to 6 a.m. the friction sensor identified trace moisture (brown vertical shading)
while speeds were still at free flow; however, speeds began to drop off and continued to decrease
as the snow warning was identified after 6 a.m. In this case, both sensors appeared to detect the
change in condition around the same time. There was also a time around 7 a.m. where the
friction sensor peaked and reported a dry condition. This was likely due to a snowplow passing
through with no observed impact on speeds.
Figure 20 shows the sensor data for Site #3 during the winter event of December 24, 2015.
Figure 20. Site #3 on December 24, 2015
These speed and friction sensors are located at the same location. As shown, around 9 a.m.
speeds began decreasing with no apparent change in friction data. Around 10 a.m., speeds
continued to fall yet the friction data did not change until roughly 10 minutes later with the
message going from dry to snow warning.

21
Figure 21 illustrates another snow event for Site #1 on January 11, 2018; however, the speed did
not drop significantly due to the weather.
Figure 21. Site #1 on January 11, 2018
The relatively low speed between 2 a.m. to 6 a.m. was probably due to the wet road conditions
and slow driving trucks. The weather during the morning was getting worse, the sensor was
signaling a warning of snow, and drivers were driving at lower speeds (~60 mph). Figure 22
shows the roadway surface conditions of wet, ice watch, and snow warning, from left to right.
The speed remained relatively the same for the entire duration of the winter event but would not
have captured the variance in conditions as reported by the friction sensor.
Figure 22. Roadway surface conditions of Site #1 on January 11, 2018
Site # 2 is about 2 miles to the north of Site #1 and its speed profile in Figure 23 was similar to
Site #1 on December 24, 2017.

22
Figure 23. Site #2 on December 24, 2017
Figure 24 shows a similar pattern where roadway surface conditions changed from the worst
snow warning level to trace moisture and back to normal dry conditions in afternoon.
Figure 24. Roadway surface conditions of Site #2 on December 24, 2017
Speeds began to drop around the same time as the friction sensor but did not decline as
significantly as the friction sensor was reporting. This is an example where the friction sensor
was a better indicator for reporting of the road conditions. Note that at 8:56 a.m., the sensor
reported a quick warning to watch out for ice, where the friction factor was about 0.6. There was
no observed evidence (speed, friction factors, cameras, etc.) indicting this inclement weather
event. Additional information as to how the conditions were detected by the sensor may be
needed to understand why conditions were reported as ice watch.
Summary of Speed versus Friction Comparison
Overall, both the speed and friction sensors did respond to the winter weather events. Adverse
driving conditions were sometimes indicated first by vehicle speeds (turbulence and continual
drop) with the friction data lagging in time, but in some situations, the friction sensor better

23
detected the road conditions and when alerts should be sent. It is important to keep in mind that
the speed and friction data sources are not on equal footing in that the speed data (accessible on
the ITS network and available every 20 seconds) are of superior fidelity to the friction data (not
on the ITS network and reported every 5 minutes). Contrasting these two potential data streams
as a method to drive dynamic messages should correct for this bias. Any comparison should also
recognize the utility of speed sensors in having the flexibility to detect other traffic slowdowns
(which may not be caused by winter weather), such as crashes, disabled vehicles on the shoulder,
towing activities, or other sources of incidents and congestion.
This effort served as a good starting point toward considering these data streams and the
capability to enhance traveler information during critical travel times.

24
CONCLUSIONS
The use of DMS systems is aimed at providing useful roadway information, harmonizing traffic
flow, and preventing traffic congestion; such goals depend on realistic, reliable, and real-time
traffic messages. The newly designed DMS display logic system has shown significant
improvement over the existing system and its accuracy was verified using multiple data sources,
including surface friction, video cameras, and TIS historical messaging reports.
Friction data have the potential to enhance the advisory messaging system, but overall perform
similarly to the traffic data that are already being collected. The Iowa DOT has a vast network of
traffic sensors, which supports a system primarily reliant on traffic data, but friction sensors
could be used in specific locations to provide additional inputs to the advisory messaging system.
The friction data are also currently limited by collection frequency.
The system developed could be further modified to produce advisory messages (“slow traffic,”
“traffic delays”), which may be more suitable for use in a variety of conditions including winter
weather. The benefit of the current system design is the applicability to other situations such as
work zones or other non-recurring traffic conditions. The system should continue to be improved
by incorporating additional data inputs such as probe speed data, weather data, and friction data.
The current system will continue to be tested and implemented by the Iowa DOT (specifically
related to work zones).
25
REFERENCES
Allaby, P., B. Hellinga, and M. Bullock. 2007. Variable Speed Limits: Safety and Operational
Impacts of a Candidate Control Strategy for Freeway Applications. IEEE Transactions on
Intelligent Transportation Systems, Vol. 8, No. 4, pp. 671–680.
Bertini, R., S. Boice, and K. Bogenberger. 2006. Dynamics of Variable Speed Limit System
Surrounding Bottleneck on German Autobahn. Transportation Research Record: Journal
of the Transportation Research Board, No. 1978, pp. 149–159.
Goodwin, L. C. and P. Pisano. 2003. Best Practices for Road Weather Management, Version 2.0.
Federal Highway Administration, Washington, DC.
http://www.velocidade.prp.pt/Sites/velocidade/CentroDocumentacao/InvestigacaoEstudo
s/75%20-%20Best%20Practices%20-%20CaseStudiesFINALv2-RPT.pdf.
Katz, B., C. O'Donnell, K. Donoughe, J. Atkinson, M. Finley, K. Balke, B. Kuhn, and D.
Warren. 2012. Guidelines for the Use of Variable Speed Limit Systems in Wet Weather.
FHWA-SA-12-022. Federal Highway Administration, Washington, DC.
Lin, P-W., K-P. Kang, and G. L. Chang. 2004. Exploring the Effectiveness of Variable Speed
Limit Controls on Highway Work-Zone Operations. Journal of Intelligent Transportation
Systems, Vol. 8, No. 3, pp. 155–168.
Wilkie, J. K. 1997. Using Variable Speed Limit Signs to Mitigate Speed Differentials Upstream
of Reduced Flow Locations. In Compendium of Graduate Student Papers on Advanced
Transportation Systems. Texas Transportation Institute, Texas A&M University System,
College Station, TX.
https://static.tti.tamu.edu/swutc.tamu.edu/publications/technicalreports/compendiums/Co
mpendium1997.pdf.


27
APPENDIX A. MESSAGE VERIFICATION
CTRE reviewed all events for two winter seasons (2016/2017 and 2017/2018) and summarized
these events for validation of the system. Appendix A contains additional event summaries from
the Verification of Messaging section. This includes additional winter events analyzed as well as
additional sensors.
In order to validate the accuracy of the advisory logic real-time implementation, the generated
dynamic messages were compared with multiple data sources, including the roadway weather
information sensor (surface friction), TransSuite TIS internal message logging report, roadway
cameras, and Wavetronix speed sensor profiles. However, these data sources were not available
for all the sites/events with Table 4 summarizing data availability by location (rows) and event
number (columns).
Table 4. Validation events summary
Event ID & Date Speed TIS Friction Camera
Event # 2
December 27, 2017
Event # 4
January 24, 2017
Event # 5
January 11, 2018
Event #2 on December 27, 2017
Three days after a previous winter weather event, another snow event arrived late at night on
December 27, 2017. This section illustrates the advisory logic results for that day. In addition to
the winter weather advisory messaging, the system was again able to provide alerts for other
severe traffic events, including crashes.
Event #2 @ I-35 SB @ MP 94
The sensor at MP 94 is about 1 mile to the north of 36th Street and the crash that happened at
36th Street propagated back to this site as well. There was a significant speed drop due to the
abnormal traffic event and the advisory logic displayed proper advisory messages of 55 mph, 45
mph, and 35 mph based on different traffic conditions (as evidenced in Figure 25 and Figure 26).
Around 4:30 p.m., the traffic returned to normal, and the advisory logic turned off (displaying 70
mph).

28
Figure 25. Event #2 @ I-35 SB @ MP 94: Speed profile
Figure 26. Event #2 @ I-35 SB @ MP 94: Camera view of traffic event
Event #2 @ I-35 SB @ NE 126th Ave
Figure 27 profiles the remaining site where during Event #2 drivers were slowing down at night
due to the light snow event but the traffic conditions (determined by speed and sensor
occupancy) were not severe enough to trigger the advisory message of 55 mph. Hence, the
advisory logic did not generate messages while the friction sensor site did show a snow warning
alert.

29
Figure 27. Event #2 @ I-35 SB @ NE 126th Ave: Speed profile and surface condition
Event #4 on January 24, 2017
The third snow event considered, which occurred in early 2017, was analyzed by parsing the
downloaded historical data in a streaming fashion, implementing the designed advisory logic
locally, and validating the message with speed profiles. This snow event began after 7 p.m. on
January 24, 2017, and the following section summarizes the findings for all four sites along I-35
SB between Huxley and Ankeny.
These generated messages were plotted using a red straight line in the following graphs.
Figure 28, Figure 29, Figure 30, and Figure 31 show the speed profiles for each site as well as
the displayed messages represented by the red line. It was apparent that drivers reduced their
speed when the winter weather event started after 7 p.m. for all sites, which was consistent with
the beginning of snowfall on that day. The advisory logic responded appropriately to the traffic
and displayed the advisory speed messages of 55 mph. The advisory logic significantly reduced
the fluctuation in messages, which were generated through the previous alerting system.

30
Figure 28. Event #4 at I-35 NB at 1st Ave Ankeny SB: Speed profile
Figure 29. Event #4 at I-35 SB @ MP 94: Speed profile
Figure 30. Event #4 at I-35 SB @ NE 126th Ave: Speed profile
31
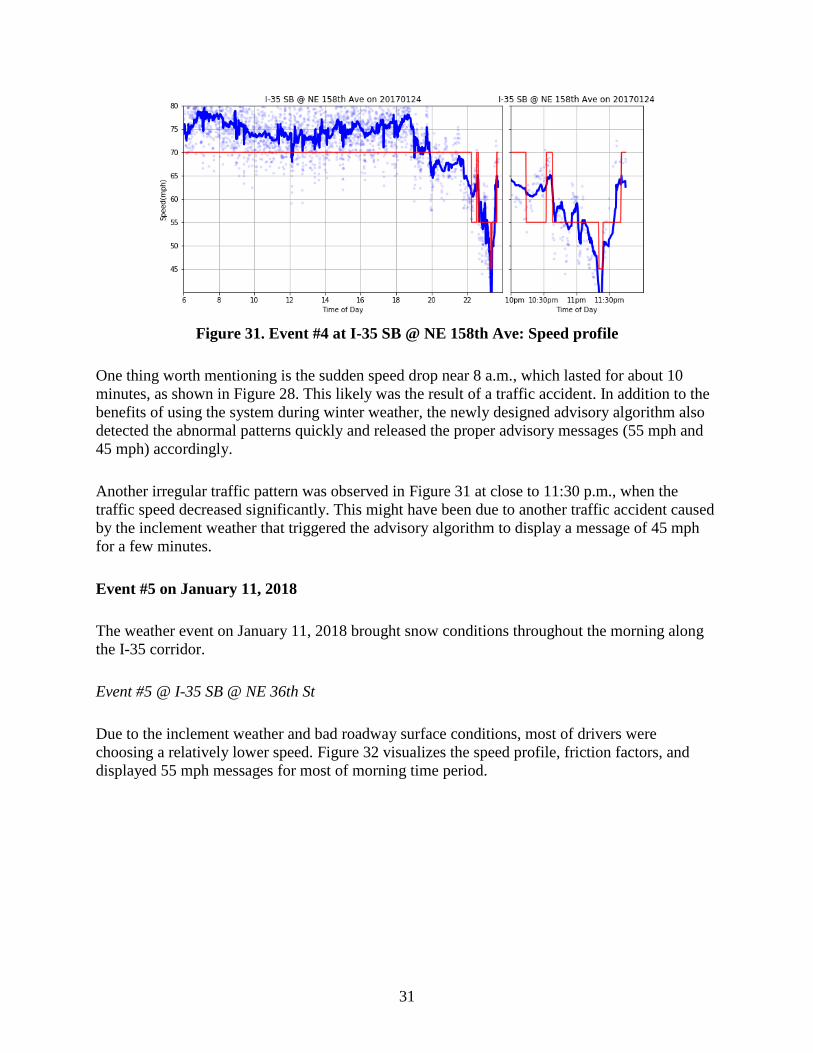
Figure 31. Event #4 at I-35 SB @ NE 158th Ave: Speed profile
One thing worth mentioning is the sudden speed drop near 8 a.m., which lasted for about 10
minutes, as shown in Figure 28. This likely was the result of a traffic accident. In addition to the
benefits of using the system during winter weather, the newly designed advisory algorithm also
detected the abnormal patterns quickly and released the proper advisory messages (55 mph and
45 mph) accordingly.
Another irregular traffic pattern was observed in Figure 31 at close to 11:30 p.m., when the
traffic speed decreased significantly. This might have been due to another traffic accident caused
by the inclement weather that triggered the advisory algorithm to display a message of 45 mph
for a few minutes.
Event #5 on January 11, 2018
The weather event on January 11, 2018 brought snow conditions throughout the morning along
the I-35 corridor.
Event #5 @ I-35 SB @ NE 36th St
Due to the inclement weather and bad roadway surface conditions, most of drivers were
choosing a relatively lower speed. Figure 32 visualizes the speed profile, friction factors, and
displayed 55 mph messages for most of morning time period.

32
Figure 32. Event #5 @ I-35 SB @ NE 36th St: Speed profile and surface condition
Event #5 @ I-35 SB @ MP 94
Unlike 36th Street, this site still had higher observed speeds (~ 65 mph) during the early
morning; thus, the advisory logic was not triggered until 7 a.m. (Figure 33). This advisory
messaging lasted for about 2 hours until 9 a.m. After the morning peak, as speed and occupancy
improved, there were two additional minor speed drops, which triggered the advisory messaging
of 55 mph.
Figure 33. Event #5 @ I-35 SB @ MP 94: Speed profile

33
Event #5 @ I-35 @ SB @ NE 126th Ave
Drops in speed were sporadic at NE 126th Avenue as shown in Figure 34. The advisory logic
detected the speed trend and responded with 55 mph advisory messages as shown in Figure 34.
Note there was another speed drop around 6 a.m.; however, it was still around 65 mph, which
was not significant enough to trigger the messaging system. Compared to the friction sensor, the
advisory messaging was sporadic between 8 a.m. and 12 p.m. The raw friction factors (shown in
the bottom plot) also showed varying friction factors during this time but were not significant
enough to change the snow warning condition.
Figure 34. Event #5 @ I-35 SB @ NE 126th Ave: Speed profile and surface condition
Event #5 @ I-35 SB @ NE 158th Ave
The traffic conditions at 158th Avenue are illustrated in Figure 35. Overall, the speed profile
matched the weather conditions with slower speeds during the morning due to snow, and higher
speeds during afternoon when the weather was getting better without snow. There was a message
cluster around 9:30 a.m., which was likely due to the unstable/complex traffic conditions
(determined by both speed and occupancy). Note that the current message display limit was 2
minutes, a longer setting of display time (for example, forcing the message to display at least 5
minutes) might eliminate the clustering effect.

34
Figure 35. Event #5 @ I-35 SB @ NE 158th Ave: Speed profile

35
APPENDIX B. SPEED VERSUS FRICTION DATA COMPARISON
CTRE reviewed compared friction and speed data for additional events not included in the
Additional Data Inputs section. Appendix B includes the additional event summaries comparing
the performance of speed and friction sensors.
Figure 36 and Figure 37 show the speed and friction data at Site #2 for the winter events of
December 24 and 28, 2015, respectively. For Site #2, the friction sensor is located approximately
1 mile north of the speed sensor. In Figure 36, the speed and friction data both begin to drop at
approximately the same time.
Figure 36. Site #2 on December 24, 2015
Figure 37 shows speeds slowing down just before 6 a.m., and the friction data began dropping
around the same time, but do not show a road condition change or snow warning until almost an
hour after speeds began dropping. A spike in friction data, at around 7 a.m., was likely due to a
snow plow. Also of interest, during the snow storm the friction sensor showed dry conditions
multiple times with significant gaps between 12 a.m. (midnight) and 3 p.m. and again around 10
p.m. Speeds during all of these time periods remained variable and below the free flow speeds,
which was in contrast to the dry condition reported by the friction sensor.

36
Figure 37. Site #2 on December 28, 2015
Figure 38 shows the sensor data for Site #1 during one winter snow event on December 24,
2017. The speed started to drop around 3 a.m., hovered around 50 mph from 5 a.m. to 8 a.m., and
gradually returned to normal by noon. Meanwhile, the friction conditions exhibited a similar
pattern—changed from the worst condition of snow warning/ice watching to the normal situation
(wet and trace moisture, then dry). Both the speed and friction sensors appeared to detect the
impact to traffic at a similar time. Figure 39 provides camera views of the roadway for Site #1 on
the same day. From top left to bottom right, it shows the conditions of snow warning, ice watch,
wet, and trace moisture, respectively. The color bordering each camera image can also be related
to the friction color shading in Figure 38.
Figure 38. Site #1 on December 24, 2017

37
Figure 39. Roadway surface conditions of Site #1 on December 24, 2017
Figure 40 and Figure 41 show the speed profile and roadway surface states for Site #2 on
January 11, 2018. Both the speed and surface condition were in the worst situation during the
morning, when the speed was about 10 mph slower than the posted speed limit (70 mph), and the
sensor was triggered by the snow warning. Once again, at 7:38 a.m., the sensor was sending out
the warning of ice for a very short period of time (shown by an extremely thin purple patch).
Figure 40. Site #2 on January 11, 2018
Figure 41. Roadway surface conditions of Site #2 on January 11, 2018


Visit www.InTrans.iastate.edu for color pdfs of this and other research reports.
THE INSTITUTE FOR TRANSPORTATION IS THE FOCAL POINT FOR TRANSPORTATION AT IOWA STATE UNIVERSITY.
InTrans centers and programs perform transportation research and provide technology transfer services for government agencies and private companies;
InTrans manages its own education program for transportation students and provides K-12 resources; and
InTrans conducts local, regional, and national transportation services and continuing education programs.


