
Econ One Research 1
Analysis of Alaska’s Tax System,
North Slope Investment and
The Administration’s Proposal
HB72
Barry Pulliam
Managing Director
Econ One Research, Inc.
February 13, 2013

Econ One Research 2
Economic Research and Consulting Firm
• Provides Economic Analysis In Energy and Other Industries
Advised the State of Alaska on Petroleum Related Matters For Over
Two Decades
Worked With the Cowper, Hickel, Knowles, Murkowski, Palin, and
Parnell Administrations
Assisted the Legislature Between 2005 and 2008 on Tax and Gas
Development Issues
Energy-Related Work Outside Alaska
• State Governments: Texas, Louisiana, New Mexico, Oklahoma,
California
• Federal Government Agencies: Department of Interior, Federal
Trade Commission
• Energy Companies: Producers, Refiners, Mid-Stream Services,
Pipelines, Chemicals
Econ One: Who We Are

Econ One Research 3
Background

Econ One Research 4
0
2,000
4,000
6,000
8,000
10,000
12,000
14,000
16,0001
96
8
197
1
197
4
197
7
198
0
198
3
198
6
198
9
199
2
199
5
199
8
200
1
200
4
200
7
201
0
(MM
BO
) Alaska North Slope Discovered Resources
by Discovery Year (1969 – 2010)
Orion (209)
Lisburne (192)
Prudhoe Bay (13,867)
Kuparuk River (2,881)
West Sak (541)
Milne Point (530)
Endicott (585)
Pt. Thomson (400) Pt. McIntyre (583)
Alpine (465) Nikaitchuq (180)
Source: DNR: The Historical Resource and Recovery Growth in Developed Fields, Arctic Slope of Alaska, 2004; DOE/NETL-2009/1385; AOGCC.
• The North Slope Has Produced 16.2 Billion
Barrels to Date
• Approximately 5.6 Billion Barrels of
Economically Recoverable Resources Remain
in Known Fields
• Approximately 90% of Resources Discovered
Prior to 1970

Econ One Research 5
Many North Slope Fields are Now at Mature Stages. However, Less Than
Half of its Potential Economic Oil Resources Have Been Produced to Date
In Total, the North Slope Contains Approximately 40 Billion Barrels of
Additional Estimated Economic Recoverable Resources at Today’s Prices
Alaska North Slope Production and Resources
Historical Production(16.2 BBO)
Conventional Resources - Discovered(5.6 BBO est.)
Conventional Resources - Undiscovered(19.2 BBO est.)
ANWR(9.9 BBO est.)
Unconventional Resources(5.5 BBO est.)

Econ One Research 6
Economically Expected
Technically Recoverable Resources Recoverable Typical
P95 Mean P5 @ $90/bbl Field Size
(Million Barrels)
(1) (2) (3) (4) (5)
Central North Slope 2,800 3,400 3,900 3,000 32 - 64
Beaufort Sea 400 8,200 23,200 5,800 -
-
Chukchi Sea 2,300 15,400 40,100 9,900
NPRA 400 900 1,700 500 32 - 64
ANWR 5,900 10,400 15,200 9,900 64 - 128
Total 38,300 29,100
Estimated Undiscovered Conventional Oil Resources
on Alaska North Slope
Source:
USGS Reports 2011–1103 and 2009-1112;
BOEM, Assessment of undiscovered technically recoverable oil and gas resources of the nation’s outer continental shelf.

Econ One Research 7
Estimated Undeveloped Unconventional Oil Resources
on Alaska North Slope
Shale ~ 1 Billion Bbls (Mean Estimated Technically Recoverable Barrels) (USGS, 2012)
Viscous and Heavy Oil (Includes All Schrader/West Sak and Ugnu Reservoirs in the Kuparuk River,
Prudhoe Bay, Milne Point and Nikaitchuq Units, Not Just PAs or Areas
Under Development )
Total In-Place Resource 24 - 27 Billion Bbls (Hartz, et al., 2007; AOGCC)
Economically Recoverable 3.6 - 5.6 Billion Bbls (Assuming 15% Average Recovery)

Econ One Research 8
• Maximum Rate
Increased to 15%
• New Fields at
12.25% for Five Years
1977 1981 1989 2003 2005 2006 2007
• Gross Tax System
• Max Rate 12.25%
• ELF Introduced
• ELF Modified to
Include Field
Size Factor
• Exploration Credits
20-40% Introduced
• Prudhoe Bay
Fields Aggregated
For Calculating ELF
• PPT Introduced
• 22.5% Base Net Tax
Rate, Increasing at
0.25% Per $1 Over
$40 Net
• 20% Capital Credit
• Maximum Rate
Set at 47.5%
A History of Alaska’s Production Tax System: North Slope
• PPT Amended in
Nov 2007; Effective
Jul 2007
• 25% Base Net Tax
Rate, Increasing at
0.4% Per $1 Over
$30 Net, 0.1% Per
$1 Over $92.50 Net
•Maximum Rate
Set at 75%

Econ One Research 9
Benchmarking North Slope Activity
Over The Past Decade
Against Other Areas

Econ One Research 10
Benchmarking
Benchmarking Allows Us to Evaluate Activity in Alaska by Controlling for Significant
Variables That are Common to All Oil Producing Properties
No Two Producing Areas are Exactly Alike. We Attempt to Choose Locations That
Share a Number of Similar Characteristics, Allowing for the Most Meaningful
Comparisons
We Benchmark the North Slope Against Significant Producing Areas in OECD Countries
• The North Sea
• The U.S. and Several Key Producing States / Areas
• Canada and Producing Provinces
• Australia
All of These OECD Areas Have Many Characteristics in Common With North Slope
• Similar Political and Legal Structure / Risk
• Significant Prospectivity
• But, Much of the “Low-Hanging” Fruit Has Been Produced
• Development of Remaining Resources are Largely High-Cost, Either
Conventional or Unconventional
• Resources are Developed in Large Part by the Private Sector

Econ One Research 11
Country/Area Profile
Alaska North Slope
0
1,000
2,000
3,000
4,000
5,000
6,000
7,000
8,000
9,000
10,000
2002 2003 2004 2005 2006 2007 2008 2009 2010 2011 2012
(Em
plo
yees)
0
200
400
600
800
1,000
1,200
2002 2003 2004 2005 2006 2007 2008 2009 2010 2011 2012
(Th
ou
san
d B
arr
els
Per
Day)
0
500
1,000
1,500
2,000
$2,500
2002 2003 2004 2005 2006 2007 2008 2009 2010 2011 2012
( M
illio
n D
oll
ars
)
0
50
100
150
200
250
2002 2003 2004 2005 2006 2007 2008 2009 2010 2011 2012
(Well
s D
rill
ed
)
Crude Oil Production Capital Spending
Petroleum Sector Employment Drilling / Development Activity
Mature Units
New Units
Mature Units
New Units

Econ One Research 12
Country/Area Profile
Northwest Europe (North Sea)
0
5,000
10,000
15,000
20,000
25,000
2002 2003 2004 2005 2006 2007 2008 2009 2010 2011 2012
(Em
plo
yees)
0
1,000
2,000
3,000
4,000
5,000
6,000
2002 2003 2004 2005 2006 2007 2008 2009 2010 2011 2012
(Th
ou
san
d B
arr
els
Per
Day)
0
10,000
20,000
30,000
40,000
50,000
60,000
2002 2003 2004 2005 2006 2007 2008 2009 2010 2011 2012
( M
illio
n D
oll
ars
)
0
50
100
150
200
250
300
350
2002 2003 2004 2005 2006 2007 2008 2009 2010 2011 2012
(Well
s D
rill
ed
)
Crude Oil Production Capital Spending
Drilling / Development Activity
United
Kingdom
Norway
Denmark
Norway
United Kingdom
Denmark
United
Kingdom
Norway
Norway
United Kingdom
Denmark
Petroleum Sector Employment
Note: 2012 figures are preliminary.

Econ One Research 13
Country/Area Profile
United States Excluding Alaska North Slope
0
10,000
20,000
30,000
40,000
50,000
60,000
70,000
80,000
90,000
100,000
110,000
2002 2003 2004 2005 2006 2007 2008 2009 2010 2011 2012
(Em
plo
yees)
0
1,000
2,000
3,000
4,000
5,000
6,000
7,000
8,000
2002 2003 2004 2005 2006 2007 2008 2009 2010 2011 2012
(Th
ou
san
d B
arr
els
Per
Day)
0
20,000
40,000
60,000
80,000
100,000
120,000
$140,000
2002 2003 2004 2005 2006 2007 2008 2009 2010 2011 2012
( M
illio
n D
oll
ars
)
0
2,000
4,000
6,000
8,000
10,000
12,000
14,000
16,000
18,000
2002 2003 2004 2005 2006 2007 2008 2009 2010 2011 2012
(Well
s D
rill
ed
)
Crude Oil Production Capital Spending
Drilling / Development Activity
Texas
North
Dakota
GOM OCS California
Texas North Dakota
Other States
California Louisiana
Exploration and
Development
Petroleum Sector Employment
Texas
North Dakota
California GOM OCS
Note: 2012 figures are preliminary.
South Texas

Econ One Research 14
Country/Area Profile
Canada
0
10,000
20,000
30,000
40,000
50,000
60,000
70,000
80,000
2002 2003 2004 2005 2006 2007 2008 2009 2010 2011 2012
(Em
plo
yees)
0
500
1,000
1,500
2,000
2,500
3,000
3,500
4,000
2002 2003 2004 2005 2006 2007 2008 2009 2010 2011 2012
(Th
ou
san
d B
arr
els
Per
Day)
0
10,000
20,000
30,000
40,000
50,000
60,000
70,000
80,000
$90,000
2002 2003 2004 2005 2006 2007 2008 2009 2010 2011 2012
( M
illio
n D
oll
ars
)
0
500
1,000
1,500
2,000
2,500
3,000
3,500
2002 2003 2004 2005 2006 2007 2008 2009 2010 2011 2012
(Well
s C
om
ple
ted
)
Crude Oil Production Capital Spending
Drilling / Development Activity
Saskatchewan
Alberta Bitumen Saskatchewan
Newfoundland and Labrador Alberta Conv.
Other Provinces
Total Canada
Alberta Saskatchewan
Alberta
Rest of
Provinces
Bitumen
Oil Sands Saskatchewan
Newfoundland and Labrador Alberta Conv.
Other Provinces
Petroleum Sector Employment
Note: 2012 figures are preliminary.

Econ One Research 15
Country/Area Profile
Australia
0
50,000
100,000
150,000
200,000
250,000
2002 2003 2004 2005 2006 2007 2008 2009 2010 2011
(Em
plo
yees)
0
200
400
600
800
1,000
1,200
2002 2003 2004 2005 2006 2007 2008 2009 2010 2011
(Th
ou
san
d B
OE
Per
Day)
0
500
1,000
1,500
2,000
2,500
3,000
3,500
$4,000
2002 2003 2004 2005 2006 2007 2008 2009 2010 2011
(Mil
lio
n D
oll
ars
)
0
50
100
150
200
250
300
350
2002 2003 2004 2005 2006 2007 2008 2009 2010 2011
(Well
s D
rill
ed
)
Production Capital Spending
Drilling / Development Activity
Mining
Exploration
Exploration and
Development
Petroleum Sector Employment
Crude/Condensate/LPG LNG

Econ One Research 16
0
20
40
60
80
100
$120
2003 2004 2005 2006 2007 2008 2009 2010 2011 2012
0
25
50
75
100
125
150
(Do
llars
Per B
arre
l) (I
nd
ex 2
003 =
100)
Alaska North Slope
United States
OECD Countries
WC ANS Crude
Crude Oil Production
Alaska North Slope vs. United States and OECD Countries
2003 - 2012
Crude Oil Price

Econ One Research 17
0
20
40
60
80
100
$120
2003 2004 2005 2006 2007 2008 2009 2010 2011 2012
0
50
100
150
200
250
300
350
400
450
500
(Do
llars
Per B
arre
l) (I
nd
ex 2
003 =
100)
Alaska North Slope
United States
Worldwide
WC ANS Crude
Estimated Capital Spending for Exploration and Development
Alaska North Slope vs. United States and Worldwide Spending*
2003 - 2012
* North Slope based on tax return information; U.S. based on top 50 public companies; worldwide based on top 75 public companies
Crude Oil Price

Econ One Research 18
Fundamentals of ACES
Calculation

Econ One Research 19
Tax is Calculated on “Net Value” of Taxable Production
• Taxable Production is Total Production Less Royalties
• Net Value is Gross Wellhead Value Less Cost of Production
• Costs of Production are Capital Expenses, Operating Expenses and Property
Tax Payments
Base Tax Rate of 25%
Progressive Tax Rate of 0.4% Per $1/Barrel (4% Per $10/Barrel) Increase Over
$30/Barrel Net Value and 0.1% Per $1/Barrel (1% Per $10/Barrel) Over $92.50,
Capped at 50% Total
Example: Taxable Value = $100/Barrel “Production Tax Value”
Base Rate = 25%
Progressive Rate = ($92.50 - $30) x 0.4% + ($100 - $92.50) x 0.1% = 25.75%
Total Rate = 25% + 25.75% = 50.75%
Credit of 20% for Capital Expenditures (Taken Over 2 Years)
Small Producer Credit of $12 Million Per Year (Phased Out for Production over 50 MBD)
State Purchases Credits and Net Operating Losses (NOLs) From Companies Without
Tax Obligation
• Equals 45% of Capital Expenditures and 25% of Operating Expenditures
How ACES Works

Econ One Research 20
Calculation of ACES Tax: Varying Prices
Annual Taxable Production (Bbls) 50,000,000 50,000,000 50,000,000
West Coast ANS Price ($/Bbl) $80.00 $100.00 $120.00
Transportation Costs ($/Bbl) - 10.00 10.00 10.00
Wellhead Value ($/Bbl) = $70.00 $90.00 $110.00
Operating Costs ($/Bbl) - $15.00 $15.00 $15.00
Capital Expenditures ($/Bbl) - 15.00 15.00 15.00
Taxable Value ($/Bbl) = $40.00 $60.00 $80.00
ACES Base Tax Rate (%) 25.0% 25.0% 25.0%
ACES Progressive Tax (%) + 4.0% 12.0% 20.0%
Total Tax Rate (%) = 29.0% 37.0% 45.0%
Total Wellhead Value ($) $3,500,000,000 $4,500,000,000 $5,500,000,000
Operating Expenditures ($) - 750,000,000 750,000,000 750,000,000
Capital Expenditures ($) - 750,000,000 750,000,000 750,000,000
Production Tax Value ($) = $2,000,000,000 $3,000,000,000 $4,000,000,000
Production Tax Before Credits (PTV x Total Tax Rate) ($) $580,000,000 $1,110,000,000 $1,800,000,000
Capital Credits (20% x Capital Expenditures) ($) - 150,000,000 150,000,000 150,000,000
Production Tax After Credits ($) = $430,000,000 $960,000,000 $1,650,000,000
Effective Tax Rate After Credits (%) 21.5% 32.0% 41.3%

Econ One Research 21
Calculation of ACES Tax: Varying Costs
$100 West Coast ANS Price
Annual Taxable Production (Bbls) 50,000,000 50,000,000 50,000,000
West Coast ANS Price ($/Bbl) $100.00 $100.00 $100.00
Transportation Costs ($/Bbl) - 10.00 10.00 10.00
Wellhead Value ($/Bbl) = $90.00 $90.00 $90.00
Operating Costs ($/Bbl) - $10.00 $20.00 $30.00
Capital Expenditures ($/Bbl) - 10.00 15.00 20.00
Taxable Value ($/Bbl) = $70.00 $55.00 $40.00
ACES Base Tax Rate (%) 25.0% 25.0% 25.0%
ACES Progressive Tax (%) + 16.0% 10.0% 4.0%
Total Tax Rate (%) = 41.0% 35.0% 29.0%
Total Wellhead Value ($) $4,500,000,000 $4,500,000,000 $4,500,000,000
Operating Expenditures ($) - 500,000,000 1,000,000,000 1,500,000,000
Capital Expenditures ($) - 500,000,000 750,000,000 1,000,000,000
Production Tax Value ($) = $3,500,000,000 $2,750,000,000 $2,000,000,000
Production Tax Before Credits (PTV x Total Tax Rate) ($) $1,435,000,000 $962,500,000 $580,000,000
Capital Credits (20% x Capital Expenditures) ($) - 100,000,000 150,000,000 200,000,000
Production Tax After Credits ($) = $1,335,000,000 $812,500,000 $380,000,000
Effective Tax Rate After Credits (%) 38.1% 29.5% 19.0%

Econ One Research 22
Calculation of ACES Tax: Varying Costs
$80 West Coast ANS Price
Annual Taxable Production (Bbls) 50,000,000 50,000,000 50,000,000
West Coast ANS Price ($/Bbl) $80.00 $80.00 $80.00
Transportation Costs ($/Bbl) - 10.00 10.00 10.00
Wellhead Value ($/Bbl) = $70.00 $70.00 $70.00
Operating Costs ($/Bbl) - $10.00 $20.00 $30.00
Capital Expenditures ($/Bbl) - 10.00 15.00 20.00
Taxable Value ($/Bbl) = $50.00 $35.00 $20.00
ACES Base Tax Rate (%) 25.0% 25.0% 25.0%
ACES Progressive Tax (%) + 8.0% 2.0% 0.0%
Total Tax Rate (%) = 33.0% 27.0% 25.0%
Total Wellhead Value ($) $3,500,000,000 $3,500,000,000 $3,500,000,000
Operating Expenditures ($) - 500,000,000 1,000,000,000 1,500,000,000
Capital Expenditures ($) - 500,000,000 750,000,000 1,000,000,000
Production Tax Value ($) = $2,500,000,000 $1,750,000,000 $1,000,000,000
Production Tax Before Credits (PTV x Total Tax Rate) ($) $825,000,000 $472,500,000 $250,000,000
Capital Credits (20% x Capital Expenditures) ($) - 100,000,000 150,000,000 200,000,000
Production Tax After Credits ($) = $725,000,000 $322,500,000 $50,000,000
Effective Tax Rate After Credits (%) 29.0% 18.4% 5.0%

Econ One Research 23
Calculation of ACES Tax: Additional Capital Spending
Annual Taxable Production (Bbls) 50,000,000 50,000,000 50,000,000
Initial Expenditure ($) $1,500,000,000 $1,500,000,000 $1,500,000,000
Additional Expenditure ($) + 250,000,000 250,000,000 250,000,000
Total Lease Expenditure ($) $1,750,000,000 $1,750,000,000 $1,750,000,000
WC ANS Price ($/Bbl) $80.00 $100.00 $120.00
Tax Value Prior To Additional Expenditure ($/Bbl) $40.00 $60.00 $80.00
Additional Capital Spending Per-Barrel of Existing Production ($/Bbl) - 5.00 5.00 5.00
Tax Value After Additional Expenditure ($/Bbl) = $35.00 $55.00 $75.00
Taxes Before Additional Expenditure
Tax Rate (%) 29.0% 37.0% 45.0%
Production Tax Before Credits ($) $580,000,000 $1,110,000,000 $1,800,000,000
Capital Credits (20% x Capital Expenditures) ($) - 300,000,000 300,000,000 300,000,000
Production Tax After Credits ($) = $280,000,000 $810,000,000 $1,500,000,000
Taxes After Additional Expenditure
Tax Rate (%) 27.0% 35.0% 43.0%
Production Tax Before Credits ($) $472,500,000 $962,500,000 $1,612,500,000
Capital Credits (20% x Capital Expenditures) ($) - 350,000,000 350,000,000 350,000,000
Production Tax After Credits ($) = $122,500,000 $612,500,000 $1,262,500,000
Reduction in Taxes From Additional Expenditure
Before Credits $107,500,000 $147,500,000 $187,500,000
Additional Credits + 50,000,000 50,000,000 50,000,000
Total Reduction in Taxes After Credits = $157,500,000 $197,500,000 $237,500,000
Reduction in Tax as % of Expenditure 63% 79% 95%
Due to Change in Taxes (Buy Down Effect) 43% 59% 75%
Due to Additional Credits 20% 20% 20%

Econ One Research 24
PFC Costs
Various Projects
Source: Excerpted from January 31, 2013 PFC Presentation to Senate TAPS Throughput Committee.

Econ One Research 25
Effective Tax Rates For New Development Under ACES
Additional Tax as % of Production Tax Value: Incumbent Producer
-40%
-30%
-20%
-10%
0%
10%
20%
30%
40%
50%
60%
$70 $80 $90 $100 $110 $120 $130 $140
(Pe
rce
nt)
West Coast ANS Price ($2012 Dollars Per Barrel)
Light Conventional
High Cost Heavy Oil
Light Conventional Oil: $16 Per Barrel Development Capex; $14 Per Barrel Opex; 16.67% Royalty Rate; 50 MMBO New Development by Existing Owner With
Initial Ongoing Production of Approximately 100 MBD and Costs Consistent with Prudhoe Bay/Kuparuk River Units
High Cost Heavy Oil: $34 Per Barrel Development Capex; $19 Per Barrel Opex; 12.5% Royalty Rate; $10 Below Stream Price; 50 MMBO New Development by
Existing Owner With Initial Ongoing Production of Approximately 100 MBD and Costs Consistent with Prudhoe Bay/Kuparuk River Units
High Cost Light Oil
High Cost Light Oil: $34 Per Barrel Development Capex; $19 Per Barrel Opex; 16.67% Royalty Rate; 50 MMBO New Development by Existing Owner With
Initial Ongoing Production of Approximately 100 MBD and Costs Consistent with Prudhoe Bay/Kuparuk River Units

Econ One Research 26
Analysis of Potential Investments
In Alaska Under ACES
Versus Other Areas

Econ One Research 27
Summary of Production Profiles Examined
For Alaska and Benchmark Developments
0%
5%
10%
15%
20%
25%
30%
35%
40%
1 2 3 4 5 6 7 8 9 10 11 12 13 14 15 16 17 18 19 20 21 22 23 24 25 26
(An
nu
al
as P
erc
en
t o
f To
tal)
(Years From Initial Production)
Alaska
Eagle Ford
Bakken
Canada
Oil Sands
(SAGD)
North
Sea
Alaska Development:
Light Conventional Oil
Heavy High Cost Oil
Benchmark Areas:
Lower-48: Eagle Ford Unconventional
Lower-48: Bakken Unconventional
North Sea: U.K. & Norway
Canada: Oil Sands (SAGD)
Cumulative Production After
22%
22%
68%
54%
35%
10%
(Percent)
3 Years 5 Years 10 Years
38%
38%
80%
66%
54%
18%
67%
67%
94%
84%
81%
38%
Development
Cost
($2012/Bbl.)
$16
$34
$16
$19
$25
$11

Econ One Research 28
Producer NPV-12 Per BOE
Internal Rate of Return (IRR)
5-Year Cash Margins
Profitability Index-12
Government Take
State NPV-12 Per BOE
Investment Measures Analyzed

Econ One Research 29
Summary of Investment Measures
* Brownfield Allowance applied to 100 MMBOE development.
Note: Analysis of incumbent production includes “buy-down” impact for reduced taxes on existing production.
Alaska 50 MMBO U.K. Development & Fiscal System
Light Conventional Oil Heavy High Cost Oil Canada Pre-1993 Post-1993
West Coast New Incumbent New Incumbent Unconventional Lower-48 Oil Sands w/ Brownfield w/ Brownfield
ANS Price Participant Participant Participant Participant Eagle Ford Bakken SAGD Norway Pre-1993 Allowance* Post-1993 Allowance*
(1) (2) (3) (4) (5) (6) (7) (8) (9) (10) (11) (12)
Producer NPV-12 / BOE (Dollars Per BOE)
$80 $2.55 $3.71 ($4.51) ($2.43) $3.61 $0.67 ($0.93) $0.24 $1.20 $4.81 $2.41 $4.62
$100 $3.85 $6.14 ($2.45) $2.48 $6.75 $4.29 $0.46 $2.34 $3.02 $7.09 $6.04 $8.25
$120 $5.48 $8.82 ($1.09) $6.53 $11.17 $9.16 $2.01 $4.44 $4.83 $9.09 $9.67 $11.88
Profitability Index-12
$80 1.19 1.28 0.84 0.91 1.25 1.04 0.88 1.01 1.06 1.22 1.11 1.21
$100 1.29 1.46 0.91 1.09 1.47 1.28 1.06 1.14 1.14 1.33 1.28 1.38
$120 1.41 1.67 0.96 1.23 1.78 1.60 1.26 1.27 1.22 1.42 1.45 1.55
IRR (Percent)
$80 19.7% 26.2% 4.3% 7.1% 29.9% 13.6% 9.7% 12.4% 18.4% 34.5% 18.4% 24.7%
$100 23.4% 41.1% 8.1% 18.2% 46.3% 22.7% 13.1% 16.0% 27.0% 45.2% 27.0% 32.9%
$120 27.6% 65.3% 10.3% 33.6% 73.6% 37.0% 16.3% 19.3% 34.6% 53.5% 34.6% 40.2%
5-Year (2017-2021) Cash Margins (Dollars Per BOE)
$80 $25.84 $24.26 $27.58 $25.52 $23.39 $28.39 $26.07 $34.51 $12.45 $22.94 $24.91 $29.35
$100 $28.84 $27.22 $32.42 $30.33 $29.99 $36.48 $29.14 $39.42 $16.69 $28.85 $33.38 $37.82
$120 $33.13 $31.18 $35.48 $33.41 $36.87 $44.91 $33.37 $44.32 $20.93 $31.29 $41.86 $46.30
Government Take (Percent)
$80 70.8% 68.9% 61.5% 45.0% 71.7% 77.1% 63.4% 67.8% 81.0% 61.0% 62.0% 52.0%
$100 75.8% 73.0% 71.6% 58.3% 67.9% 72.1% 63.5% 71.7% 81.0% 68.6% 62.0% 55.8%
$120 77.2% 73.8% 76.8% 63.4% 65.1% 68.7% 63.0% 73.4% 81.0% 72.0% 62.0% 57.5%
State/Municipal NPV-12/BOE (Dollars Per BOE)
$80 $6.67 $4.88 ($4.61) ($7.81) - - - - - - - -
$100 $13.32 $9.79 $0.86 ($6.73) - - - - - - - -
$120 $19.46 $14.31 $7.41 ($4.31) - - - - - - - -
Econ One Research 30
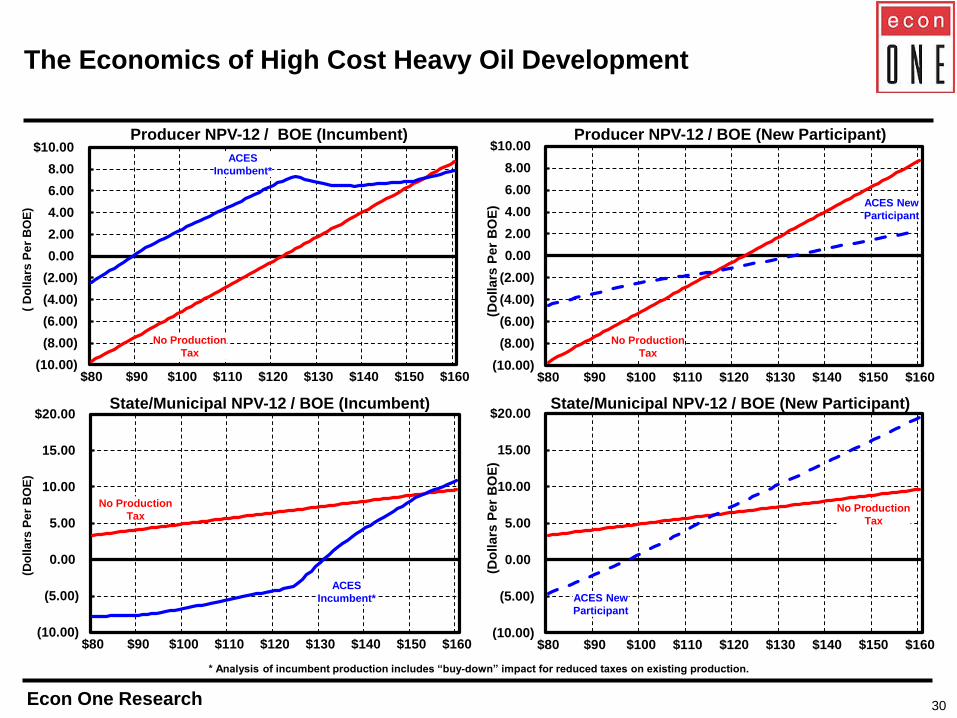
The Economics of High Cost Heavy Oil Development
(10.00)
(5.00)
0.00
5.00
10.00
15.00
$20.00
$80 $90 $100 $110 $120 $130 $140 $150 $160
(Do
llars
Per
BO
E)
(10.00)
(8.00)
(6.00)
(4.00)
(2.00)
0.00
2.00
4.00
6.00
8.00
$10.00
$80 $90 $100 $110 $120 $130 $140 $150 $160
( D
oll
ars
Pe
r B
OE
)
(10.00)
(5.00)
0.00
5.00
10.00
15.00
$20.00
$80 $90 $100 $110 $120 $130 $140 $150 $160
(Do
lla
rs P
er
BO
E)
State/Municipal NPV-12 / BOE (New Participant)
ACES
Incumbent*
No Production
Tax
ACES New
Participant
Producer NPV-12 / BOE (Incumbent)
State/Municipal NPV-12 / BOE (Incumbent)
(10.00)
(8.00)
(6.00)
(4.00)
(2.00)
0.00
2.00
4.00
6.00
8.00
$10.00
$80 $90 $100 $110 $120 $130 $140 $150 $160
(Do
llars
Per
BO
E)
Producer NPV-12 / BOE (New Participant)
ACES New
Participant
ACES
Incumbent*
* Analysis of incumbent production includes “buy-down” impact for reduced taxes on existing production.
No Production
Tax
No Production
Tax
No Production
Tax

Econ One Research 31
The Economics of High Cost Light Oil Development
(10.00)
(5.00)
0.00
5.00
10.00
15.00
$20.00
$80 $90 $100 $110 $120 $130 $140 $150 $160
(Do
llars
Per
BO
E)
(10.00)
(8.00)
(6.00)
(4.00)
(2.00)
0.00
2.00
4.00
6.00
8.00
$10.00
$80 $90 $100 $110 $120 $130 $140 $150 $160
( D
oll
ars
Pe
r B
OE
)
(10.00)
(5.00)
0.00
5.00
10.00
15.00
$20.00
$80 $90 $100 $110 $120 $130 $140 $150 $160
(Do
lla
rs P
er
BO
E)
State/Municipal NPV-12 / BOE (New Participant)
ACES
Incumbent*
No Production
Tax
ACES New
Participant
Producer NPV-12 / BOE (Incumbent)
State/Municipal NPV-12 / BOE (Incumbent)
(10.00)
(8.00)
(6.00)
(4.00)
(2.00)
0.00
2.00
4.00
6.00
8.00
$10.00
$80 $90 $100 $110 $120 $130 $140 $150 $160
(Do
llars
Per
BO
E)
Producer NPV-12 / BOE (New Participant)
ACES New
Participant
ACES
Incumbent*
* Analysis of incumbent production includes “buy-down” impact for reduced taxes on existing production.
No Production
Tax
No Production
Tax
No Production
Tax

Econ One Research 32
10.00
20.00
30.00
40.00
50.00
60.00
$70.00
$70 $80 $90 $100 $110 $120 $130 $140 $150 $160
Cas
h M
arg
in (
Do
lla
rs P
er
Barr
el)
West Coast ANS Price ($2012 Dollars Per Barrel)
Projected Cash Generation From Ongoing North Slope
Production (2017-2021) Under ACES and
Other Jurisdictions
Alaska
ACES
Canada
SAGD Norway
Eagle Ford
Bakken
UK Post-93
w/ Brownfield
Allowance

Econ One Research 33
Source: Excerpted from page 225 of IHS CERA Report.
IHS CERA 2011 Report to the U.S. Department of Interior

Econ One Research 34
IHS CERA 2011 Report to the U.S. Department of Interior (cont’d)
Source: Excerpted from page 24 of IHS CERA Report.

Econ One Research 35
The Administration’s
Proposed Changes
SB21/HB72

Econ One Research 36
Key Aspects of Administration’s Proposal
Establishes 25% Flat Net Tax Rate; No Progressivity
Eliminates Capital Credit and State Purchase of Losses
Establishes 20% Gross Revenue Exclusion (GRE) to Incent
Production of New Oil
Losses May be Carried Forward and Applied Against Tax
Obligation When Production Occurs
Extends New Entrant Credits Through 2022
No Change Outside of North Slope

Econ One Research 37
Key Aspects of Administration’s Proposal (cont’d)
Provides Balance Between State and Producers
• Reduction of Tax Rates at High Prices, Balanced with Elimination of Credits
• State Continues to Receive Largest Percentage of Oil Production Revenues
at Any Price
• Provides Tax Relief and Higher Margins in Sustainable Price Ranges
Simplifies Tax System and Provides Clarity for Planning
• Eliminates Question of Marginal Tax Rate / Take for Investment Planning
• Eliminates Incentives for “Gold Plating” Caused by High Marginal Rates
Maintains Alignment Between State and Producer Incentives
• Net Tax Allows for Deduction of Costs Against Tax
Provides Incentive for Development of New Resources Without Taxing State Treasury
• GRE Provides Lower Effective Tax Rate for New Development
• New Developers can Recover Costs of Development Once Production Begins
• Does Not Require State to Fund Development Costs Through Potentially
Expensive Credit Purchases
Extremely Positive Message to Potential Investors
• Will Encourage Broader Participation in Development of Alaska’s North Slope
• Economics of New Participants Closer to Incumbents’

Econ One Research 38
50%
55%
60%
65%
70%
75%
80%
70 80 90 100 110 120 130 140 150 160
(Pe
rce
nt)
West Coast ANS Price ($2012 Dollars Per Barrel)
Average Government Take
ACES v. SB21/HB72 for All Existing Producers (FY2015-FY2019)
SB21/HB72
ACES

Econ One Research 39
Average Government Take at $100 Per Barrel
Other Jurisdictions
Source: PFC Energy.

Econ One Research 40
50%
55%
60%
65%
70%
75%
80%
$70 $80 $90 $100 $110 $120 $130 $140 $150 $160
(Pe
rce
nt)
West Coast ANS Price ($2012 Dollars Per Barrel)
Average Government Take
ACES v. SB21/HB72 for All Existing Producers (FY2015-FY2019)
and Other Jurisdictions
SB21/HB72
ACES
Average
All Jurisdictions
per PFC
Average Major
OECD Jurisdictions
per PFC*
* Australia, Canada (Alberta Conventional), Norway, United Kingdom and United States.

Econ One Research 41
10.00
20.00
30.00
40.00
50.00
60.00
$70.00
$70 $80 $90 $100 $110 $120 $130 $140 $150 $160
Cas
h M
arg
in (
Do
lla
rs P
er
Barr
el)
West Coast ANS Price ($2012 Dollars Per Barrel)
Projected Cash Generation From Ongoing North Slope
Production (2017-2021) Under ACES v. SB21/HB72 and
Other Jurisdictions
Alaska
ACES
Canada
SAGD Norway
Eagle Ford
Bakken
UK Post-93
w/ Brownfield
Allowance
SB21/HB72

Econ One Research 42
(600)
(400)
(200)
0
200
$400
1 2 3 4 5 6 7 8 9 10 11 12 13 14 15 16 17 18 19 20 21 22 23 24 25 26 27 28 29
(Mil
lio
n D
oll
ars
) Annual State Revenues and Producer Cash Flows at $100 West Coast ANS
Light Conventional Oil Alaska Development
New Participant in Alaska
ACES
(600)
(400)
(200)
0
200
$400
(Mil
lio
n D
oll
ars
)
Producer Cash Flows
State Revenues
$981M
$192M
$1,574M
$309M
Total Revenues (ACES)
NPV-12 (ACES)
Total Revenues (SB21/HB72)
NPV-12 (SB21/HB72)
Total Cash Flows (ACES)
NPV-12 (ACES)
Total Cash Flows (SB21/HB72)
NPV-12 (SB21/HB72)
$2,540M
$666M
$1,629M
$486M
SB21/HB72

Econ One Research 43
(600)
(400)
(200)
0
200
$400
1 2 3 4 5 6 7 8 9 10 11 12 13 14 15 16 17 18 19 20 21 22 23 24 25 26 27 28 29
(Mil
lio
n D
oll
ars
) Annual State Revenues and Producer Cash Flows at $100 West Coast ANS
Light Conventional Oil Alaska Development
Incumbent Participant in Alaska
SB21/HB72 ACES
(600)
(400)
(200)
0
200
$400
(Mil
lio
n D
oll
ars
)
Producer Cash Flows
State Revenues
Total Revenues (ACES)
NPV-12 (ACES)
Total Revenues (SB21/HB72)
NPV-12 (SB21/HB72)
$2,366M
$489M
$1,720M
$485M
Total Cash Flows (ACES)
NPV-12 (ACES)
Total Cash Flows (SB21/HB72)
NPV-12 (SB21/HB72)
$1,094M
$307M
$1,514M
$310M

Econ One Research 44
Summary of Investment Measures for New Participant
Light Conventional Oil Alaska Development
ACES and SB21/HB72 v. Benchmark Areas
* Brownfield Allowance applied to 100 MMBOE development.
U.K. Development & Fiscal System
Canada Pre-1993 Post-1993
West Coast SB21/HB72 Unconventional Lower-48 Oil Sands w/ Brownfield w/ Brownfield
ANS Price ACES With GRE Without GRE Eagle Ford Bakken SAGD Norway Pre-1993 Allowance* Post-1993 Allowance*
(1) (2) (3) (4) (5) (6) (7) (8) (9) (10) (11)
Producer NPV-12 / BOE (Dollars Per BOE)
$80 $2.55 $2.54 $1.94 $3.61 $0.67 ($0.93) $0.24 $1.20 $4.81 $2.41 $4.62
$100 $3.85 $6.18 $5.34 $6.75 $4.29 $0.46 $2.34 $3.02 $7.09 $6.04 $8.25
$120 $5.48 $9.74 $8.71 $11.17 $9.16 $2.01 $4.44 $4.83 $9.09 $9.67 $11.88
Profitability Index-12
$80 1.19 1.19 1.15 1.25 1.04 0.88 1.01 1.06 1.22 1.11 1.21
$100 1.29 1.47 1.40 1.47 1.28 1.06 1.14 1.14 1.33 1.28 1.38
$120 1.41 1.74 1.66 1.78 1.60 1.26 1.27 1.22 1.42 1.45 1.55
IRR (Percent)
$80 19.7% 17.1% 16.1% 29.9% 13.6% 9.7% 12.4% 18.4% 34.5% 18.4% 24.7%
$100 23.4% 23.9% 22.6% 46.3% 22.7% 13.1% 16.0% 27.0% 45.2% 27.0% 32.9%
$120 27.6% 30.0% 28.6% 73.6% 37.0% 16.3% 19.3% 34.6% 53.5% 34.6% 40.2%
5-Year (2017-2021) Cash Margins (Dollars Per BOE)
$80 $25.84 $36.94 $34.44 $23.39 $28.39 $26.07 $34.51 $12.45 $22.94 $24.91 $29.35
$100 $28.84 $45.89 $42.59 $29.99 $36.48 $29.14 $39.42 $16.69 $28.85 $33.38 $37.82
$120 $33.13 $54.69 $50.89 $36.87 $44.91 $33.37 $44.32 $20.93 $31.29 $41.86 $46.30
Government Take (Percent)
$80 70.8% 61.9% 66.0% 71.7% 77.1% 63.4% 67.8% 81.0% 61.0% 62.0% 52.0%
$100 75.8% 61.1% 64.7% 67.9% 72.1% 63.5% 71.7% 81.0% 68.6% 62.0% 55.8%
$120 77.2% 60.8% 64.0% 65.1% 68.7% 63.0% 73.4% 81.0% 72.0% 62.0% 57.5%
State/Municipal NPV-12/BOE (Dollars Per BOE)
$80 $6.67 $6.68 $7.60 - - - - - - - -
$100 $13.32 $9.72 $11.02 - - - - - - - -
$120 $19.46 $12.89 $14.48 - - - - - - - -

Econ One Research 45
Summary of Investment Measures for Incumbent
Light Conventional Oil Alaska Development
ACES and SB21/HB72 v. Benchmark Areas
Note: Analysis of incumbent production includes “buy-down” impact for reduced taxes on existing production.
* Brownfield Allowance applied to 100 MMBOE development.
U.K. Development & Fiscal System
Canada Pre-1993 Post-1993
West Coast SB21/HB72 Unconventional Lower-48 Oil Sands w/ Brownfield w/ Brownfield
ANS Price ACES With GRE Without GRE Eagle Ford Bakken SAGD Norway Pre-1993 Allowance* Post-1993 Allowance*
(1) (2) (3) (4) (5) (6) (7) (8) (9) (10) (11)
Producer NPV-12 / BOE (Dollars Per BOE)
$80 $3.71 $2.71 $2.02 $3.61 $0.67 ($0.93) $0.24 $1.20 $4.81 $2.41 $4.62
$100 $6.14 $6.20 $5.30 $6.75 $4.29 $0.46 $2.34 $3.02 $7.09 $6.04 $8.25
$120 $8.82 $9.69 $8.58 $11.17 $9.16 $2.01 $4.44 $4.83 $9.09 $9.67 $11.88
Profitability Index-12
$80 1.28 1.20 1.15 1.25 1.04 0.88 1.01 1.06 1.22 1.11 1.21
$100 1.46 1.47 1.40 1.47 1.28 1.06 1.14 1.14 1.33 1.28 1.38
$120 1.67 1.73 1.65 1.78 1.60 1.26 1.27 1.22 1.42 1.45 1.55
IRR (Percent)
$80 26.2% 18.5% 16.9% 29.9% 13.6% 9.7% 12.4% 18.4% 34.5% 18.4% 24.7%
$100 41.1% 25.8% 24.1% 46.3% 22.7% 13.1% 16.0% 27.0% 45.2% 27.0% 32.9%
$120 65.3% 32.5% 30.6% 73.6% 37.0% 16.3% 19.3% 34.6% 53.5% 34.6% 40.2%
5-Year (2017-2021) Cash Margins (Dollars Per BOE)
$80 $24.26 $30.63 $28.57 $23.39 $28.39 $26.07 $34.51 $12.45 $22.94 $24.91 $29.35
$100 $27.22 $40.27 $37.61 $29.99 $36.48 $29.14 $39.42 $16.69 $28.85 $33.38 $37.82
$120 $31.18 $49.90 $46.65 $36.87 $44.91 $33.37 $44.32 $20.93 $31.29 $41.86 $46.30
Government Take (Percent)
$80 68.9% 64.1% 68.1% 71.7% 77.1% 63.4% 67.8% 81.0% 61.0% 62.0% 52.0%
$100 73.0% 62.6% 66.1% 67.9% 72.1% 63.5% 71.7% 81.0% 68.6% 62.0% 55.8%
$120 73.8% 61.9% 65.1% 65.1% 68.7% 63.0% 73.4% 81.0% 72.0% 62.0% 57.5%
State/Municipal NPV-12/BOE (Dollars Per BOE)
$80 $4.88 $6.42 $7.49 - - - - - - - -
$100 $9.79 $9.70 $11.08 - - - - - - - -
$120 $14.31 $12.98 $14.67 - - - - - - - -

Econ One Research 46
Appendix

Econ One Research 47
Crude Oil Production Comparisons to Alaska
30
40
50
60
70
80
90
100
110
2002 2003 2004 2005 2006 2007 2008 2009 2010 2011 2012
(2002 =
100)
50
75
100
125
150
175
200
2002 2003 2004 2005 2006 2007 2008 2009 2010 2011 2012
(2002 =
100)
Alaska North Slope v. Northwest Europe Alaska North Slope v. United States
Alaska North Slope v. Canada Alaska North Slope v. Australia
AK North Slope
Norway
United Kingdom
Northwest Europe
AK North Slope
Texas
GOM OCS
California
N. Dakota Bakken
U.S. ex Alaska
2006:
2007:
2008:
2009:
2010:
2011:
2012:
365
1,181
4,305
7,878
13,595
20,355
34,378
50
75
100
125
150
175
200
225
250
2002 2003 2004 2005 2006 2007 2008 2009 2010 2011 2012
(2002 =
100)
50
100
150
200
250
300
2002 2003 2004 2005 2006 2007 2008 2009 2010 2011 2012
(2002 =
100)
AK North Slope
Alberta Conv.
Alberta Bitumen
Saskatchewan
Other Provinces
Canada
AK North Slope
Australia Crude/Cond/LPG
Australia LNG

Econ One Research 48
Capital Spending Comparisons to Alaska
40
90
140
190
240
290
340
390
2002 2003 2004 2005 2006 2007 2008 2009 2010 2011 2012
(2003 =
100)
0
100
200
300
400
500
600
2002 2003 2004 2005 2006 2007 2008 2009 2010 2011 2012
(2003 =
100)
Alaska North Slope v. Northwest Europe Alaska North Slope v. United States
Alaska North Slope v. Canada Alaska North Slope v. Australia
AK North Slope
Norway
United Kingdom
Northwest Europe
AK North Slope
U.S. ex Alaska
0
100
200
300
400
500
600
700
800
900
2002 2003 2004 2005 2006 2007 2008 2009 2010 2011 2012
(2003 =
100)
50
100
150
200
250
300
350
400
450
500
550
2002 2003 2004 2005 2006 2007 2008 2009 2010 2011 2012
(2003 =
100)
AK North Slope
Alberta Conv.
Oil Sands
Saskatchewan
Canada
AK North Slope
Australia Exploration

Econ One Research 49
Employment Comparisons to Alaska
60
80
100
120
140
160
180
200
220
2002 2003 2004 2005 2006 2007 2008 2009 2010 2011 2012
(2002 =
100)
75
100
125
150
175
200
2002 2003 2004 2005 2006 2007 2008 2009 2010 2011 2012
(2002 =
100)
Alaska North Slope v. Northwest Europe Alaska North Slope v. United States
Alaska North Slope v. Canada Alaska North Slope v. Australia
Alaska North Slope
Norway
United Kingdom
Northwest Europe
Alaska North Slope
Texas
California
North Dakota
U.S. ex Alaska
2008:
2009:
2010:
2011:
2012:
213
218
332
505
676
80
100
120
140
160
180
200
2002 2003 2004 2005 2006 2007 2008 2009 2010 2011 2012
(2002 =
100)
50
100
150
200
250
300
350
2002 2003 2004 2005 2006 2007 2008 2009 2010 2011 2012
(2002 =
100)
Alaska North Slope
Alberta
Saskatchewan
Canada
Alaska North Slope
Australia Mining

Econ One Research 50
Drilling / Development Activity Comparisons to Alaska
50
60
70
80
90
100
110
120
130
2002 2003 2004 2005 2006 2007 2008 2009 2010 2011 2012
(2002 =
100)
0
100
200
300
400
500
600
2002 2003 2004 2005 2006 2007 2008 2009 2010 2011 2012
(2002 =
100)
Alaska North Slope v. Northwest Europe Alaska North Slope v. United States
Alaska North Slope v. Canada Alaska North Slope v. Australia
Alaska
Norway
United Kingdom
0
50
100
150
200
250
2002 2003 2004 2005 2006 2007 2008 2009 2010 2011 2012
(2002 =
100)
50
70
90
110
130
150
170
190
210
2002 2003 2004 2005 2006 2007 2008 2009 2010 2011 2012
(2002 =
100)
Alaska
Alberta
Bitumen
Canada
Alaska
Australia
Saskatchewan
AK North Slope
Texas
GOM OCS
California
N. Dakota
U.S. ex Alaska
2008:
2009:
2010:
2011:
2012:
923
860
1,646
2,110
2,885
2011:
2012:
1,023
1,639 South Texas

Econ One Research 51
Investment Measures
Light Conventional Oil Alaska Development
v. Unconventional Lower-48
55%
60%
65%
70%
75%
80%
85%
$70 $80 $90 $100 $110 $120 $130 $140
(Perc
en
t)
(2.00)
0.00
2.00
4.00
6.00
8.00
10.00
12.00
14.00
$16.00
$70 $80 $90 $100 $110 $120 $130 $140
( D
oll
ars
Pe
r B
OE
)
20.00
30.00
40.00
50.00
60.00
$70.00
$70 $80 $90 $100 $110 $120 $130 $140
(Do
lla
rs P
er
BO
E)
ACES
Incumbent*
ACES New
Participant
ACES
Incumbent*
ACES New
Participant
0%
10%
20%
30%
40%
50%
60%
70%
80%
90%
100%
$70 $80 $90 $100 $110 $120 $130 $140
(Perc
en
t)
ACES
Incumbent*
ACES New
Participant
ACES
Incumbent*
Eagle Ford
ACES New
Participant
Government Take
Producer NPV-12 / BOE Internal Rate of Return (IRR)
Bakken
Eagle Ford
Bakken
* Analysis of incumbent production includes “buy-down” impact for reduced taxes on existing production.
Eagle Ford
Bakken
Eagle Ford
Bakken
Cash Margins (2017-2022)
SB21/HB72
Incumbent
SB21/HB72 New
Participant
SB21/HB72
Incumbent
SB21/HB72 New
Participant
SB21/HB72
Incumbent
SB21/HB72 New
Participant
SB21/HB72
Incumbent
SB21/HB72 New
Participant
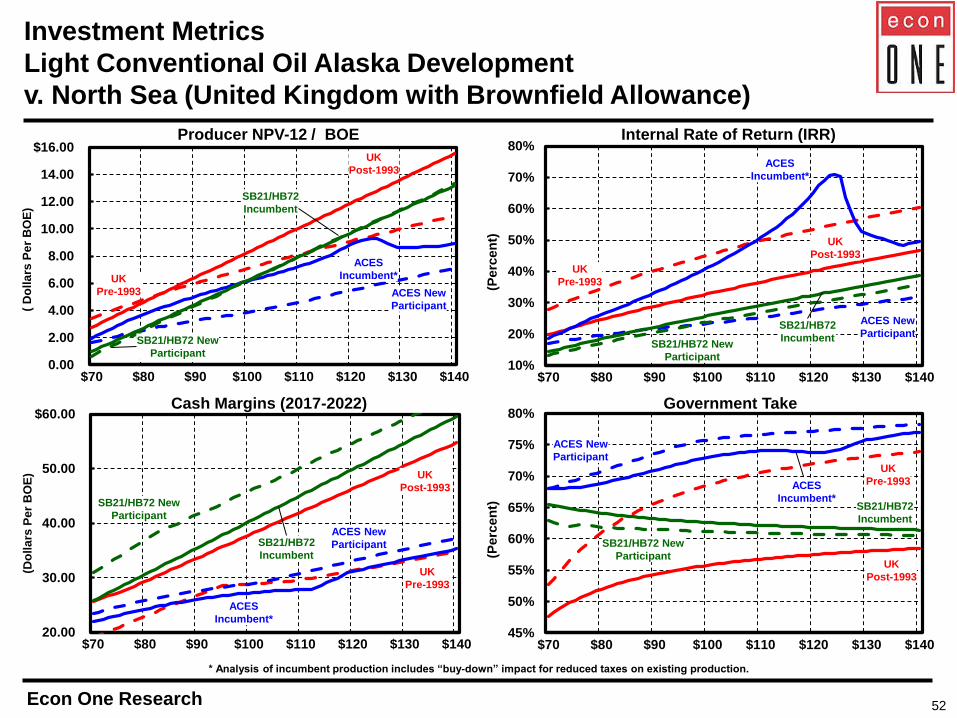
Econ One Research 52
Investment Metrics
Light Conventional Oil Alaska Development
v. North Sea (United Kingdom with Brownfield Allowance)
45%
50%
55%
60%
65%
70%
75%
80%
$70 $80 $90 $100 $110 $120 $130 $140
(Perc
en
t)
0.00
2.00
4.00
6.00
8.00
10.00
12.00
14.00
$16.00
$70 $80 $90 $100 $110 $120 $130 $140
( D
oll
ars
Pe
r B
OE
)
20.00
30.00
40.00
50.00
$60.00
$70 $80 $90 $100 $110 $120 $130 $140
(Do
lla
rs P
er
BO
E)
ACES
Incumbent*
ACES New
Participant
ACES
Incumbent*
ACES New
Participant
10%
20%
30%
40%
50%
60%
70%
80%
$70 $80 $90 $100 $110 $120 $130 $140
(Perc
en
t)
ACES
Incumbent*
ACES New
Participant
ACES
Incumbent*
UK
Post-1993
ACES New
Participant
UK
Pre-1993
UK
Pre-1993
UK
Post-1993
Government Take
Producer NPV-12 / BOE Internal Rate of Return (IRR)
* Analysis of incumbent production includes “buy-down” impact for reduced taxes on existing production.
Cash Margins (2017-2022)
UK
Pre-1993
UK
Post-1993
UK
Pre-1993
UK
Post-1993
SB21/HB72
Incumbent
SB21/HB72 New
Participant
SB21/HB72
Incumbent SB21/HB72 New
Participant
SB21/HB72
Incumbent
SB21/HB72 New
Participant SB21/HB72
Incumbent
SB21/HB72 New
Participant

Econ One Research 53
Investment Metrics
Light Conventional Oil Alaska Development
v. North Sea (Norway)
55%
60%
65%
70%
75%
80%
$70 $80 $90 $100 $110 $120 $130 $140
(Perc
en
t)
(2.00)
0.00
2.00
4.00
6.00
8.00
10.00
12.00
$14.00
$70 $80 $90 $100 $110 $120 $130 $140
( D
oll
ars
Pe
r B
OE
)
20.00
25.00
30.00
35.00
40.00
45.00
50.00
55.00
$60.00
$70 $80 $90 $100 $110 $120 $130 $140
(Do
lla
rs P
er
BO
E)
ACES
Incumbent*
ACES New
Participant
ACES
Incumbent*
ACES New
Participant
10%
20%
30%
40%
50%
60%
70%
80%
$70 $80 $90 $100 $110 $120 $130 $140
(Perc
en
t)
ACES
Incumbent*
ACES New
Participant
ACES
Incumbent*
Norway
ACES New
Participant
Norway
Norway
Norway
Government Take
Producer NPV-12 / BOE Internal Rate of Return (IRR)
* Analysis of incumbent production includes “buy-down” impact for reduced taxes on existing production.
Cash Margins (2017-2022)
SB21/HB72
Incumbent
SB21/HB72 New
Participant
SB21/HB72
Incumbent SB21/HB72 New
Participant
SB21/HB72
Incumbent
SB21/HB72 New
Participant
SB21/HB72
Incumbent
SB21/HB72 New
Participant

Econ One Research 54
Investment Metrics
Light Conventional Oil Alaska Development
v. Canada Oil Sands (SAGD)
55%
60%
65%
70%
75%
80%
$70 $80 $90 $100 $110 $120 $130 $140
(Perc
en
t)
(2.00)
0.00
2.00
4.00
6.00
8.00
10.00
12.00
$14.00
$70 $80 $90 $100 $110 $120 $130 $140
( D
oll
ars
Pe
r B
OE
)
20.00
25.00
30.00
35.00
40.00
45.00
50.00
55.00
$60.00
$70 $80 $90 $100 $110 $120 $130 $140
(Do
lla
rs P
er
BO
E)
ACES
Incumbent*
ACES New
Participant
ACES
Incumbent* ACES New
Participant
0%
10%
20%
30%
40%
50%
60%
70%
80%
$70 $80 $90 $100 $110 $120 $130 $140
(Perc
en
t)
ACES
Incumbent*
ACES New
Participant ACES
Incumbent*
Canada
SAGD
ACES New
Participant
Canada
SAGD
Canada
SAGD
Canada
SAGD
Government Take
Producer NPV-12 / BOE Internal Rate of Return (IRR)
* Analysis of incumbent production includes “buy-down” impact for reduced taxes on existing production.
Cash Margins (2017-2022)
SB21/HB72
Incumbent
SB21/HB72 New
Participant
SB21/HB72
Incumbent
SB21/HB72 New
Participant
SB21/HB72
Incumbent
SB21/HB72 New
Participant
SB21/HB72
Incumbent
SB21/HB72 New
Participant

Econ One Research 55
Investment Measures
Heavy High Cost Oil Alaska Development
v. Unconventional Lower-48
30%
40%
50%
60%
70%
80%
90%
100%
$70 $80 $90 $100 $110 $120 $130 $140
(Perc
en
t)
(10.00)
(5.00)
0.00
5.00
10.00
$15.00
$70 $80 $90 $100 $110 $120 $130 $140
( D
oll
ars
Pe
r B
OE
)
20.00
30.00
40.00
50.00
60.00
$70.00
$70 $80 $90 $100 $110 $120 $130 $140
(Do
lla
rs P
er
BO
E)
ACES
Incumbent* ACES New
Participant ACES
Incumbent*
ACES New
Participant
-20%
0%
20%
40%
60%
80%
100%
$70 $80 $90 $100 $110 $120 $130 $140
(Perc
en
t)
ACES
Incumbent*
ACES New
Participant
ACES
Incumbent*
Eagle Ford
ACES New
Participant
Government Take
Producer NPV-12 / BOE Internal Rate of Return (IRR)
Bakken
Eagle Ford
Bakken
* Analysis of incumbent production includes “buy-down” impact for reduced taxes on existing production.
Eagle Ford
Bakken
Eagle Ford
Bakken
Cash Margins (2017-2022)
SB21/HB72
Incumbent SB21/HB72 New
Participant
SB21/HB72
Incumbent SB21/HB72 New
Participant
SB21/HB72
Incumbent
SB21/HB72 New
Participant
SB21/HB72
Incumbent
SB21/HB72 New
Participant

Econ One Research 56
Investment Metrics
Heavy High Cost Oil Alaska Development
v. North Sea (United Kingdom with Brownfield Allowance)
30%
40%
50%
60%
70%
80%
90%
100%
$70 $80 $90 $100 $110 $120 $130 $140
(Perc
en
t)
(12.00)
(8.00)
(4.00)
0.00
4.00
8.00
12.00
$16.00
$70 $80 $90 $100 $110 $120 $130 $140
( D
oll
ars
Pe
r B
OE
)
20.00
30.00
40.00
50.00
60.00
$70.00
$70 $80 $90 $100 $110 $120 $130 $140
(Do
lla
rs P
er
BO
E)
ACES
Incumbent*
ACES New
Participant
ACES
Incumbent*
ACES New
Participant
-10%
0%
10%
20%
30%
40%
50%
60%
$70 $80 $90 $100 $110 $120 $130 $140
(Perc
en
t)
ACES
Incumbent*
ACES New
Participant
ACES
Incumbent*
UK
Post-1993
ACES New
Participant
UK
Pre-1993 UK
Pre-1993
UK
Post-1993
Government Take
Producer NPV-12 / BOE Internal Rate of Return (IRR)
* Analysis of incumbent production includes “buy-down” impact for reduced taxes on existing production.
Cash Margins (2017-2022)
UK
Pre-1993
UK
Post-1993
UK
Pre-1993
UK
Post-1993
SB21/HB72
Incumbent SB21 New
Participant
SB21/HB72
Incumbent
SB21/HB72 New
Participant
SB21/HB72
Incumbent
SB21/HB72 New
Participant
SB21/HB72
Incumbent
SB21/HB72 New
Participant

Econ One Research 57
Investment Metrics
Heavy High Cost Oil Alaska Development
v. North Sea (Norway)
30%
40%
50%
60%
70%
80%
90%
$70 $80 $90 $100 $110 $120 $130 $140
(Perc
en
t)
(10.00)
(8.00)
(6.00)
(4.00)
(2.00)
0.00
2.00
4.00
6.00
$8.00
$70 $80 $90 $100 $110 $120 $130 $140
( D
oll
ars
Pe
r B
OE
)
20.00
30.00
40.00
50.00
60.00
$70.00
$70 $80 $90 $100 $110 $120 $130 $140
(Do
lla
rs P
er
BO
E)
ACES
Incumbent*
ACES New
Participant
ACES
Incumbent*
ACES New
Participant
-5%
0%
5%
10%
15%
20%
25%
30%
35%
40%
$70 $80 $90 $100 $110 $120 $130 $140
(Perc
en
t)
ACES
Incumbent*
ACES New
Participant
ACES
Incumbent*
Norway
ACES New
Participant Norway
Norway
Norway
Government Take
Producer NPV-12 / BOE Internal Rate of Return (IRR)
* Analysis of incumbent production includes “buy-down” impact for reduced taxes on existing production.
Cash Margins (2017-2022)
SB21/HB72
Incumbent
SB21/HB72 New
Participant
SB21/HB72
Incumbent
SB21/HB72 New
Participant
SB21/HB72
Incumbent
SB21/HB72 New
Participant
SB21/HB72
Incumbent
SB21/HB72 New
Participant

Econ One Research 58
Investment Metrics
Heavy High Cost Oil Alaska Development
v. Canada Oil Sands (SAGD)
-30%
-10%
10%
30%
50%
70%
90%
$70 $80 $90 $100 $110 $120 $130 $140
(Perc
en
t)
(14.00)
(12.00)
(10.00)
(8.00)
(6.00)
(4.00)
(2.00)
0.00
2.00
4.00
6.00
$8.00
$70 $80 $90 $100 $110 $120 $130 $140
( D
oll
ars
Pe
r B
OE
)
20.00
30.00
40.00
50.00
60.00
$70.00
$70 $80 $90 $100 $110 $120 $130 $140
(Do
lla
rs P
er
BO
E)
ACES
Incumbent* ACES New
Participant
ACES
Incumbent*
ACES New
Participant
-5%
0%
5%
10%
15%
20%
25%
30%
35%
40%
$70 $80 $90 $100 $110 $120 $130 $140
(Perc
en
t)
ACES
Incumbent*
ACES New
Participant
ACES
Incumbent* Canada
SAGD
ACES New
Participant Canada
SAGD
Canada
SAGD
Canada
SAGD
Government Take
Producer NPV-12 / BOE Internal Rate of Return (IRR)
* Analysis of incumbent production includes “buy-down” impact for reduced taxes on existing production.
Cash Margins (2017-2022)
SB21/HB72
Incumbent
SB21/HB72 New
Participant
SB21/HB72
Incumbent SB21/HB72 New
Participant
SB21/HB72
Incumbent
SB21/HB72 New
Participant
SP21/HB72
Incumbent
SB21/HB72 New
Participant

Econ One Research 59
Summary of Investment Measures for New Participant
Heavy High Cost Oil Alaska Development
ACES and SB21/HB72 v. Benchmark Areas
* Brownfield Allowance applied to 100 MMBOE development.
U.K. Development & Fiscal System
Canada Pre-1993 Post-1993
West Coast SB21/HB72 Unconventional Lower-48 Oil Sands w/ Brownfield w/ Brownfield
ANS Price ACES With GRE Without GRE Eagle Ford Bakken SAGD Norway Pre-1993 Allowance* Post-1993 Allowance*
(1) (2) (3) (4) (5) (6) (7) (8) (9) (10) (11)
Producer NPV-12 / BOE (Dollars Per BOE)
$80 ($4.51) ($9.80) ($9.89) $3.61 $0.67 ($0.93) $0.24 $1.20 $4.81 $2.41 $4.62
$100 ($2.45) ($5.33) ($5.45) $6.75 $4.29 $0.46 $2.34 $3.02 $7.09 $6.04 $8.25
$120 ($1.09) ($0.85) ($1.29) $11.17 $9.16 $2.01 $4.44 $4.83 $9.09 $9.67 $11.88
Profitability Index-12
$80 0.84 0.65 0.65 1.25 1.04 0.88 1.01 1.06 1.22 1.11 1.21
$100 0.91 0.81 0.81 1.47 1.28 1.06 1.14 1.14 1.33 1.28 1.38
$120 0.96 0.97 0.95 1.78 1.60 1.26 1.27 1.22 1.42 1.45 1.55
IRR (Percent)
$80 4.3% 0.8% 0.4% 29.9% 13.6% 9.7% 12.4% 18.4% 34.5% 18.4% 24.7%
$100 8.1% 6.5% 6.2% 46.3% 22.7% 13.1% 16.0% 27.0% 45.2% 27.0% 32.9%
$120 10.3% 11.2% 10.7% 73.6% 37.0% 16.3% 19.3% 34.6% 53.5% 34.6% 40.2%
5-Year (2017-2021) Cash Margins (Dollars Per BOE)
$80 $27.58 $34.02 $34.02 $23.39 $28.39 $26.07 $34.51 $12.45 $22.94 $24.91 $29.35
$100 $32.42 $46.67 $46.67 $29.99 $36.48 $29.14 $39.42 $16.69 $28.85 $33.38 $37.82
$120 $35.48 $59.32 $59.32 $36.87 $44.91 $33.37 $44.32 $20.93 $31.29 $41.86 $46.30
Government Take (Percent)
$80 61.5% 89.9% 94.6% 71.7% 77.1% 63.4% 67.8% 81.0% 61.0% 62.0% 52.0%
$100 71.6% 64.5% 66.8% 67.9% 72.1% 63.5% 71.7% 81.0% 68.6% 62.0% 55.8%
$120 76.8% 59.1% 62.6% 65.1% 68.7% 63.0% 73.4% 81.0% 72.0% 62.0% 57.5%
State/Municipal NPV-12/BOE (Dollars Per BOE)
$80 ($4.61) $3.53 $3.66 - - - - - - - -
$100 $0.86 $5.29 $5.47 - - - - - - - -
$120 $7.41 $7.05 $7.72 - - - - - - - -

Econ One Research 60
Summary of Investment Measures for Incumbent
Heavy High Cost Oil Alaska Development
ACES and SB21/HB72 v. Benchmark Areas
Note: Analysis of incumbent production includes “buy-down” impact for reduced taxes on existing production.
* Brownfield Allowance applied to 100 MMBOE development.
U.K. Development & Fiscal System
Canada Pre-1993 Post-1993
West Coast SB21/HB72 Unconventional Lower-48 Oil Sands w/ Brownfield w/ Brownfield
ANS Price ACES With GRE Without GRE Eagle Ford Bakken SAGD Norway Pre-1993 Allowance* Post-1993 Allowance*
(1) (2) (3) (4) (5) (6) (7) (8) (9) (10) (11)
Producer NPV-12 / BOE (Dollars Per BOE)
$80 ($2.43) ($7.04) ($7.66) $3.61 $0.67 ($0.93) $0.24 $1.20 $4.81 $2.41 $4.62
$100 $2.48 ($3.37) ($4.21) $6.75 $4.29 $0.46 $2.34 $3.02 $7.09 $6.04 $8.25
$120 $6.53 $0.29 ($0.77) $11.17 $9.16 $2.01 $4.44 $4.83 $9.09 $9.67 $11.88
Profitability Index-12
$80 0.91 0.75 0.73 1.25 1.04 0.88 1.01 1.06 1.22 1.11 1.21
$100 1.09 0.88 0.85 1.47 1.28 1.06 1.14 1.14 1.33 1.28 1.38
$120 1.23 1.01 0.97 1.78 1.60 1.26 1.27 1.22 1.42 1.45 1.55
IRR (Percent)
$80 7.1% 2.2% 1.1% 29.9% 13.6% 9.7% 12.4% 18.4% 34.5% 18.4% 24.7%
$100 18.2% 7.8% 6.6% 46.3% 22.7% 13.1% 16.0% 27.0% 45.2% 27.0% 32.9%
$120 33.6% 12.3% 11.1% 73.6% 37.0% 16.3% 19.3% 34.6% 53.5% 34.6% 40.2%
5-Year (2017-2021) Cash Margins (Dollars Per BOE)
$80 $25.52 $29.32 $27.46 $23.39 $28.39 $26.07 $34.51 $12.45 $22.94 $24.91 $29.35
$100 $30.33 $39.44 $36.95 $29.99 $36.48 $29.14 $39.42 $16.69 $28.85 $33.38 $37.82
$120 $33.41 $49.56 $46.44 $36.87 $44.91 $33.37 $44.32 $20.93 $31.29 $41.86 $46.30
Government Take (Percent)
$80 45.0% 75.3% 88.7% 71.7% 77.1% 63.4% 67.8% 81.0% 61.0% 62.0% 52.0%
$100 58.3% 63.8% 70.3% 67.9% 72.1% 63.5% 71.7% 81.0% 68.6% 62.0% 55.8%
$120 63.4% 61.4% 66.3% 65.1% 68.7% 63.0% 73.4% 81.0% 72.0% 62.0% 57.5%
State/Municipal NPV-12/BOE (Dollars Per BOE)
$80 ($7.81) ($0.73) $0.23 - - - - - - - -
$100 ($6.73) $2.28 $3.57 - - - - - - - -
$120 ($4.31) $5.29 $6.91 - - - - - - - -

Econ One Research 61
(600)
(400)
(200)
0
200
$400
1 2 3 4 5 6 7 8 9 10 11 12 13 14 15 16 17 18 19 20 21 22 23 24 25 26 27 28 29
(Mil
lio
n D
oll
ars
) Annual State Revenues and Producer Cash Flows at $100 West Coast ANS
Heavy High Cost Oil Alaska Development
New Participant in Alaska
ACES
(600)
(400)
(200)
0
200
$400
(Mil
lio
n D
oll
ars
)
Producer Cash Flows
State Revenues
$1,156M
$43M
$933M
$265M
$584M
($122)M
$729M
($266)M
Total Revenues (ACES)
NPV-12 (ACES)
Total Revenues (SB21/HB72)
NPV-12 (SB21/HB72)
Total Cash Flows (ACES)
NPV-12 (ACES)
Total Cash Flows (SB21/HB72)
NPV-12 (SB21/HB72)
SB21/HB72
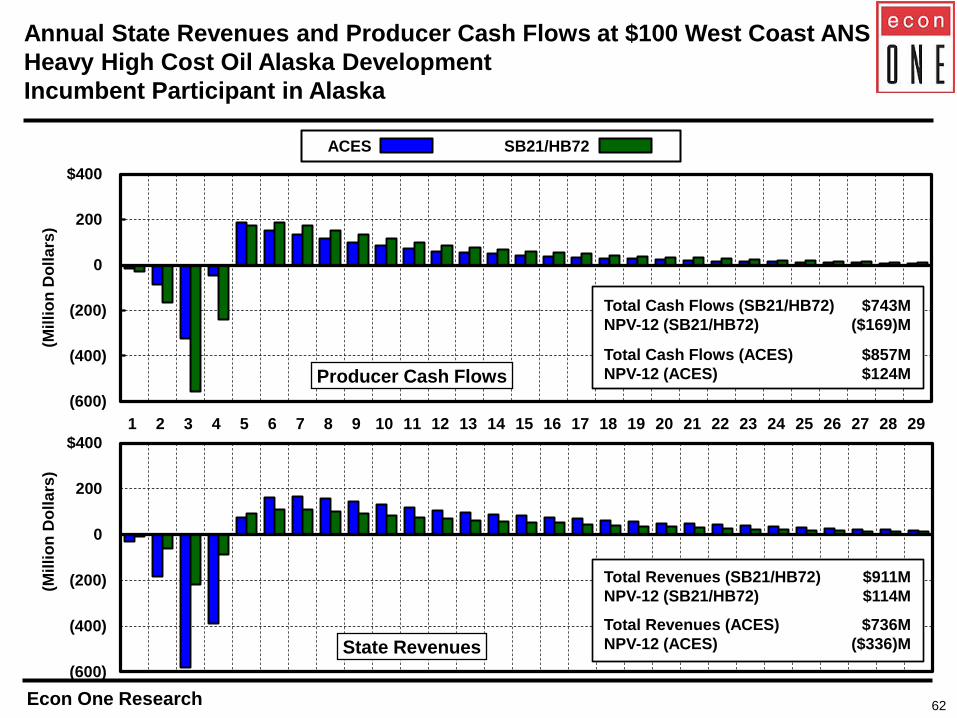
Econ One Research 62
(600)
(400)
(200)
0
200
$400
1 2 3 4 5 6 7 8 9 10 11 12 13 14 15 16 17 18 19 20 21 22 23 24 25 26 27 28 29
(Mil
lio
n D
oll
ars
) Annual State Revenues and Producer Cash Flows at $100 West Coast ANS
Heavy High Cost Oil Alaska Development
Incumbent Participant in Alaska
ACES
(600)
(400)
(200)
0
200
$400
(Mil
lio
n D
oll
ars
)
Producer Cash Flows
State Revenues
$736M
($336)M
$911M
$114M
$857M
$124M
$743M
($169)M
Total Revenues (ACES)
NPV-12 (ACES)
Total Revenues (SB21/HB72)
NPV-12 (SB21/HB72)
Total Cash Flows (ACES)
NPV-12 (ACES)
Total Cash Flows (SB21/HB72)
NPV-12 (SB21/HB72)
SB21/HB72


