Mosaic Public Sector
Dr Peter WelshAnalysis and Information TeamKent County Council

Outline
• What is Mosaic?• What type of people and households does Kent
have?

What is Mosaic?• Market segmentation tool developed by
Experian• Classifies groups of people and
households by their demographics, behaviours, lifestyle characteristics and their attitudes
• Uses over 400 data variables– 54% sourced from 2001 Census– 46% sourced from Consumer Dynamics
Database• Consumer credit activity• Experian’s Lifestyle Survey• House price and council tax information• + more
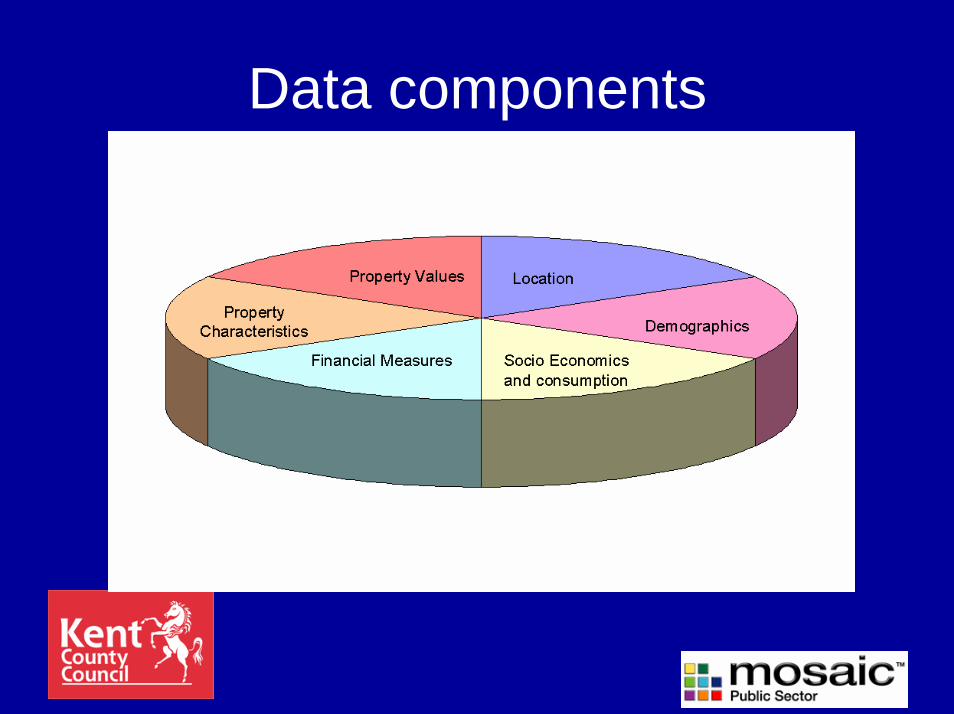
Data components

Mosaic Classification• Every UK postcode is classified into one of:
– 61 Types– 11 Groups
• Analysis on population or household basis

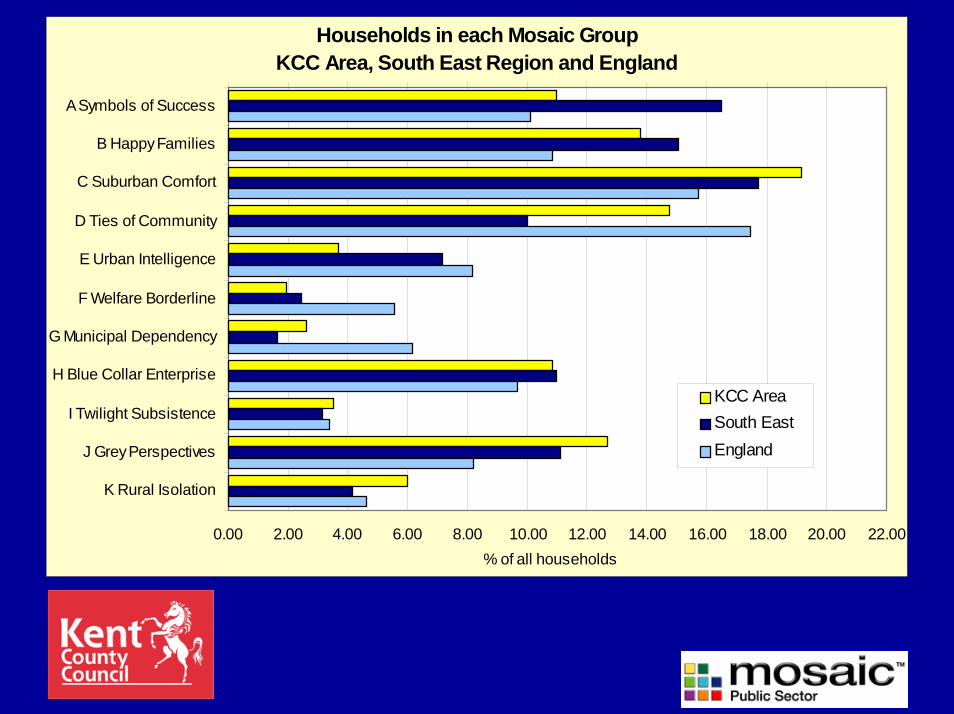
Households in each Mosaic GroupKCC Area, South East Region and England
0.00 2.00 4.00 6.00 8.00 10.00 12.00 14.00 16.00 18.00 20.00 22.00
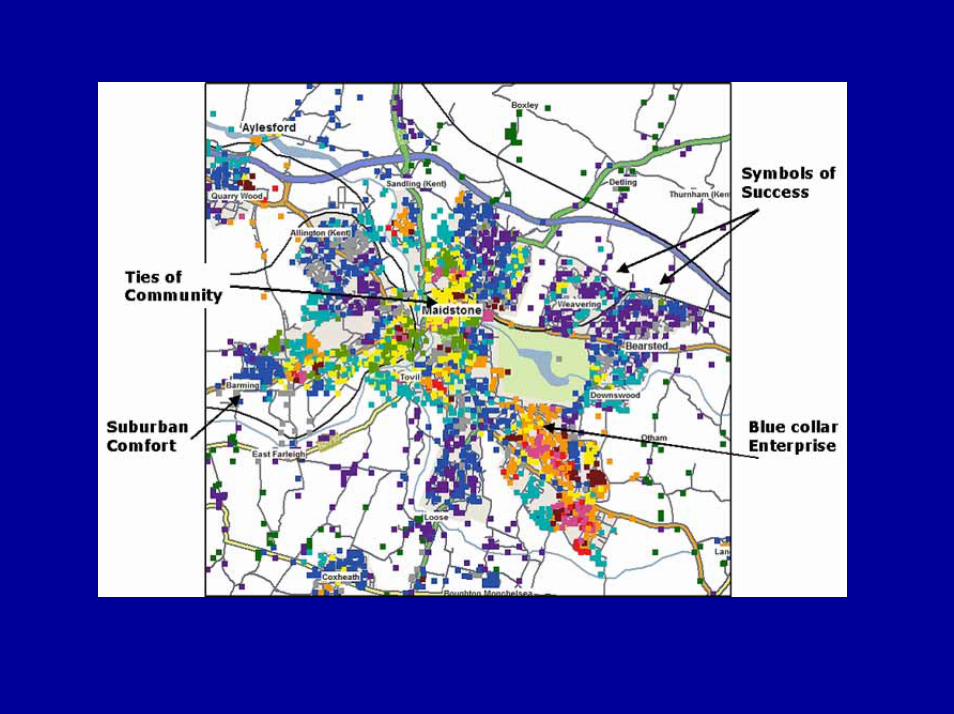
A Symbols of Success
B Happy Families
C Suburban Comfort
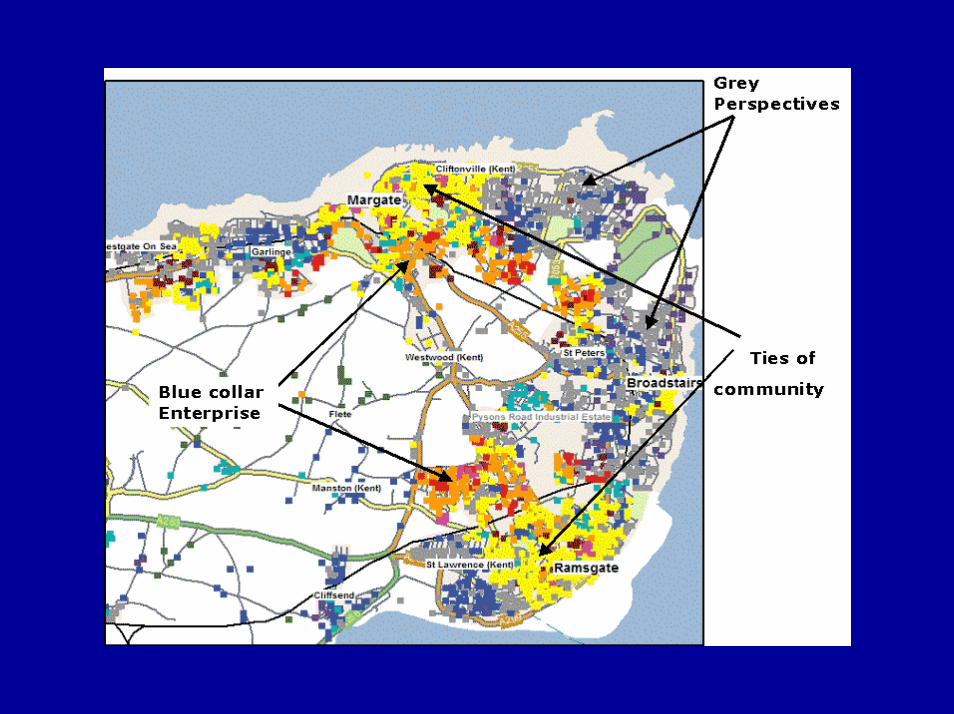
D Ties of Community
E Urban Intelligence
F Welfare Borderline
G Municipal Dependency
H Blue Collar Enterprise
I Twilight Subsistence
J Grey Perspectives
K Rural Isolation
% of all households
KCC AreaSouth EastEngland

Group C – Suburban Comfort
• Married couples
•Older children
•White collar jobs
•Hard working
•Comfortable homes
•Mature Suburbs
•Plan for retirement
•Good place to live
•Environmental charities
Households in each Mosaic GroupKCC Area, South East Region and England
0.00 2.00 4.00 6.00 8.00 10.00 12.00 14.00 16.00 18.00 20.00 22.00
A Symbols of Success
B Happy Families
C Suburban Comfort
D Ties of Community
E Urban Intelligence
F Welfare Borderline
G Municipal Dependency
H Blue Collar Enterprise
I Twilight Subsistence
J Grey Perspectives
K Rural Isolation
% of all households
KCC AreaSouth EastEngland
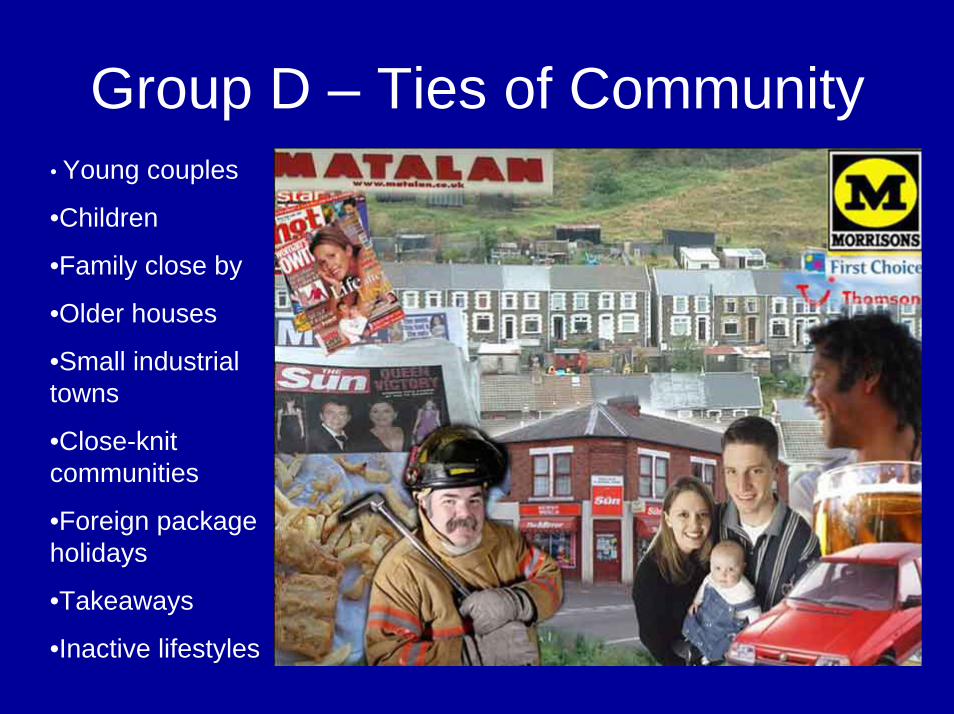
Group D – Ties of Community• Young couples
•Children
•Family close by
•Older houses
•Small industrial towns
•Close-knit communities
•Foreign package holidays
•Takeaways
•Inactive lifestyles

Households in each Mosaic GroupKCC Area, South East Region and England
0.00 2.00 4.00 6.00 8.00 10.00 12.00 14.00 16.00 18.00 20.00 22.00
A Symbols of Success
B Happy Families
C Suburban Comfort
D Ties of Community
E Urban Intelligence
F Welfare Borderline
G Municipal Dependency
H Blue Collar Enterprise
I Twilight Subsistence
J Grey Perspectives
K Rural Isolation
% of all households
KCC AreaSouth EastEngland

Group A – Symbols of Success
• Middle-aged
•Rewarding careers
•Professional occupations
•High incomes
•Choicest housing
•Expensive cars
•Good diet

Group B – Happy Families• Young couples
•Good education
•Corporate careers
•Low
•unemployment
•Modern homes
•Internet
•Enjoy exercise

Group E – Urban Intelligence
•Young singles
•Few Children
•Well Educated
•Cultural Variety
•Cosmopolitan
tastes
•Professionals

Group F – Welfare Borderline
•Families
•Many young
• Low income
•Deprivation
•State Benefits
•Council housing
•Public transport

Group G – Municipal Dependency
• Families
•Low incomes
•Terraces and semis
•Large council estates
•Outer suburbs
•Old fashioned
•Lots TV

Group H – Blue Collar Enterprise• Middle-aged couples
•Poorly educated
•Council estates
•Exercised right to buy
•Self-reliant and capable
•Poor diet
•Heavy TV viewers
•Heavy smokers

Group I – Twilight Subsistence• Older people
•Low incomes
•Low savings
•State benefits
•Some sheltered accommodation
•TV, bingo

Group J – Grey Perspectives
• Pensioners
•Relocated on retirement
•Own their own homes
•Index linked pensions
•Active
•Good health
•Environmental concerns

Group K – Rural Isolation• Older people
•Small communities
•Distinct rural life
•Farming
•Agro-tourism
•Cars important
•Work long hours
•Good diet and lifestyle


Ashford
Barrow Hill

KCC School Governors
0.00 2.00 4.00 6.00 8.00 10.00 12.00 14.00 16.00 18.00 20.00 22.00 24.00 26.00
K Rural Isolation
J Grey Perspectives
I Twilight Subsistence
H Blue Collar Enterprise
G Municipal Dependency
F Welfare Borderline
E Urban Intelligence
D Ties of Community
C Suburban Comfort
B Happy Families
A Symbols of Success
% of govenors
EnglandGovenors

Location and Mosaic Profile of KCC School Governors

Location and Mosaic Profile of KCC School GovernorsKent

Applications
• Profiling customer data• Supplement survey data• Customer targeting

Projects
• Adult Education• Education and schools• Financial stress• Healthy eating• Recycling• Post offices• Tourism / Events
• Country Parks• Supporting
Independence• Kent Benefits
Partnership


