
An Update from the FDA / Industry / Academia Safety Graphics Working Group:
Adverse Event Sub Team
Qi Jiang and Liping Huang
on Behalf of the Adverse Event Sub Team
FDA/QSPI Summit, March 2012
The Disclaimer
The views expressed herein represent those of the presenters and do not necessarily represent the views or practices of the presenters’ employers or any other party

3

How to Achieve This?

Motivations
• Information regarding adverse events in drug development is complex
• Communicating information effectively and efficiently is crucial in detecting safety signals and helping decision-making
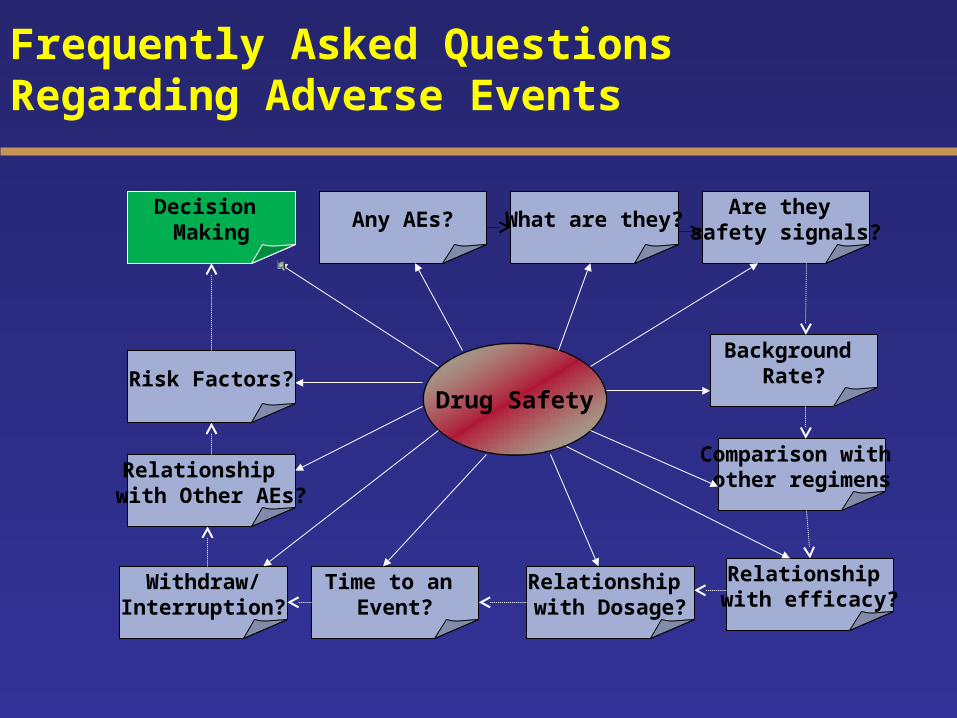
Frequently Asked Questions Regarding Adverse Events
Drug Safety
What are they?
Time to an Event?
Relationship with Dosage?
Any AEs?
Comparison with other regimens
Background Rate?
Are they safety signals?
Relationship with efficacy?
Risk Factors?
Withdraw/Interruption?
Relationship with Other AEs?
Decision Making

Categories of Graph
• Demographics and incidence of AEs• AE occurrence over time across treatment
groups• Dosage and exposure• Potential risk factors and their temporal
relationship to AEs • Withdrawal and interruption of treatment in
relation to the occurrence of AEs• Patient profile

Graphical Displays Addressing Key Clinical and Safety Issues

Most Frequent On-Therapy AE Sorted by Risk Difference
• Clinical Question: Which AEs are elevated in treatment vs. control?
• Type: Grouped Dotplot
• Contributed by: Frank E Harrell, Jr. modification of Amit et al 2008

Alternative Approach: Which AE Could Be A Safety Signal?
Dot Plot: Adverse Event Sorted by Relative Risk to address which AE could be caused by the drug
Source: Amit, Lane, Heiburger
Trt > Plc
Plc.> Trt

Another Alternative: Which AEs Were Elevated?
Dot Plot: Proportions of AE Occurrence Between Treatment and Placebo
Source: Michael O’Connell “Graphical Analysis and Reporting of Safety Data”
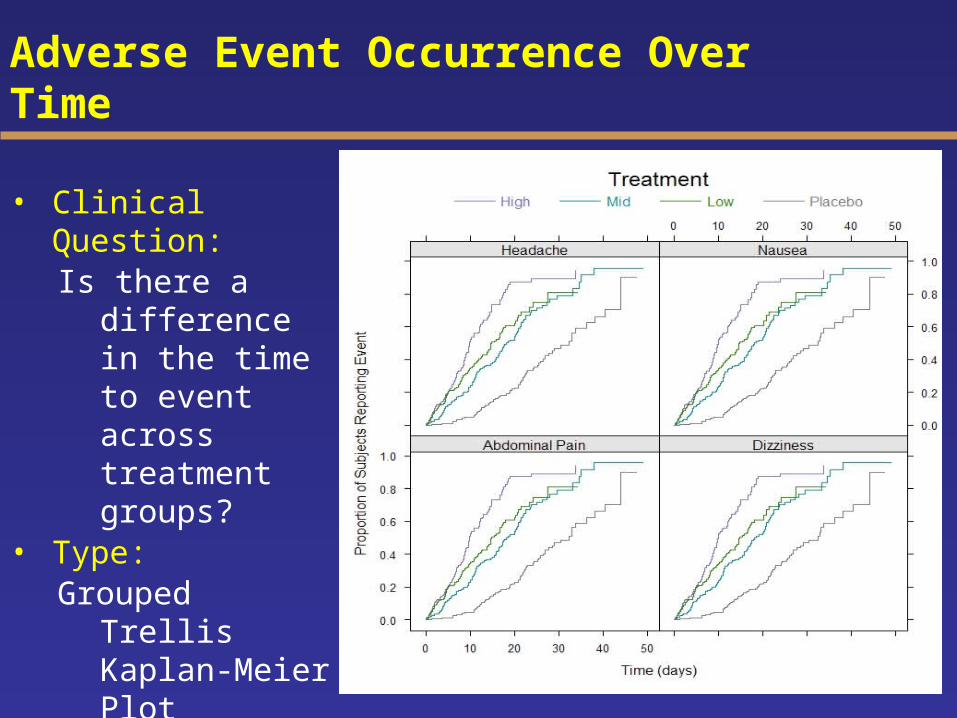
Adverse Event Occurrence Over Time
• Clinical Question:Is there a difference
in the time to event across treatment groups?
• Type: Grouped Trellis
Kaplan-Meier Plot
• Software: R• Contributed by:
Mat Soukup

Cumulative Incidence of AE by Time of Initial Onset
• Clinical Question:• Is there a difference
in the time to event across treatment groups?
• Contributed by: Liping Huang

Summary of Safety Subjects Exposure to Treatment
• Clinical Question:• What is the safety
profile of the drug? Are there any AEs associated with dropouts?
• Contributed by: Qi Jiang

A Few More Graphical Displays Addressing Key Clinical and Safety Issues
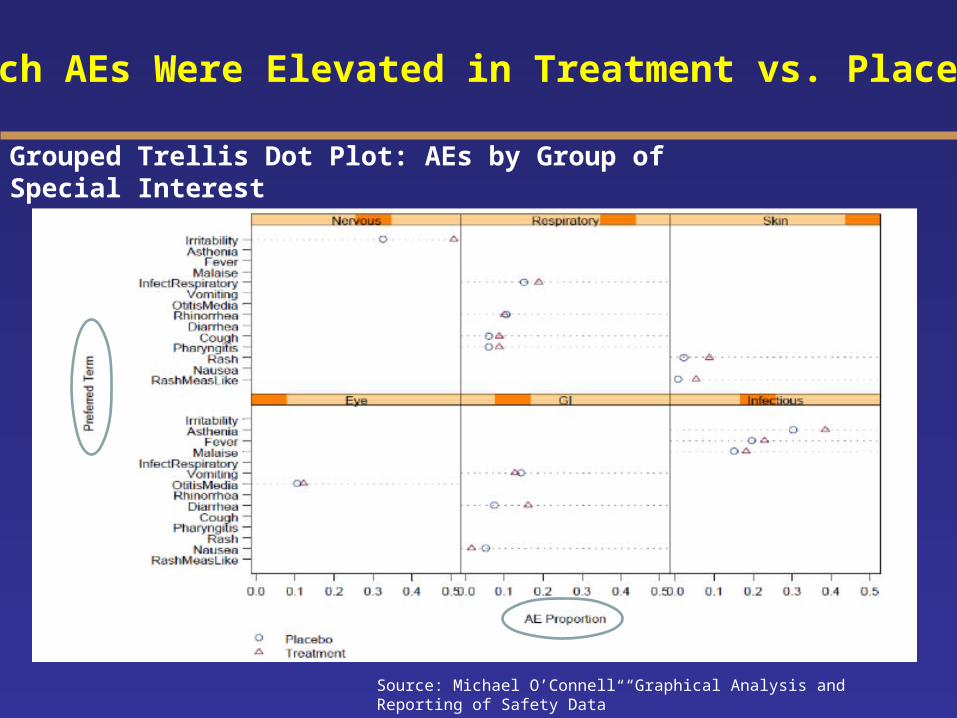
Which AEs Were Elevated in Treatment vs. Placebo?
Grouped Trellis Dot Plot: AEs by Group of Special Interest
Source: Michael O’Connell “Graphical Analysis and Reporting of Safety Data”

Is There A Special Pattern of AE Onset?
Risk Over Time Plot for Adverse Event
Source: Qi Jiang, Amgen
Cumulative
Incidence rate
Hazard

Which AE Could be A Safety Signal?
Volcano Plot: Relationship Between Risk Difference and P-Value for AEs by SOCVisualizations with different adjustments for multiplicity and shows impact of multiplicity adjustments
Source: Qi Jiang, Amgen
Conclusions
• Clear and informative graphs enhance the ability to understand the data
• Suitable graphical presentation for adverse events could increase the likelihood of detecting safety signals
• Graphs convey information more efficiently and better meet regulatory requirements for ongoing safety evaluation

Conclusions

Special ThanksFDA / Industry / Academia Safety Graphics Working Group
Working Group Adverse Events Sub Team Members:Liping Huang (co-lead) - CSL Behring Qi Jiang (co-lead) - Amgen Fabrice Bancken - Novartis Andreas Brueckner - Bayer Healthcare Larry Gould - Merck Kenneth Koury - Merck Mat Soukup - CDER
Former Sub Team Members:Janelle Charles (co-lead) - CDER Stephine Keeton (co-lead) - PPDSuzanne Demko - CDER Navdeep Boparai - Merck Jeff Summers - CDER Yaning Wang - CDER
In addition, Amgen Safety Biostat Graphical Team

Thank You!


