
An individualistic approach to institution formation in public
good games
ABHIJIT RAMALINGAM, SARA GODOY, ANTONIO J. MORALES AND JAMES M. WALKER*
In a repeated public goods setting, we explore whether individuals,
acting unilaterally, will provide an effective sanctioning institution.
Subjects first choose unilaterally whether they will participate in a
sanctioning stage that follows a contribution stage. Only those who
gave themselves the “right” to punish can do so. We find that the
effectiveness of the institution may not require provision of the
institution at the level of the group. Individuals acting unilaterally
are able to provide sanctioning institutions that effectively raise
cooperation. The effectiveness of the institution, however, depends
on whether the “right” to sanction entails a monetary cost or not.
Keywords: public goods, experiment, punishment, institution formation, unilateral provision, cooperation
JEL codes: C72, C91, C92, D02, H41
* Ramalingam (Corresponding author): School of Economics and Centre for Behavioural and
Experimental Social Science, University of East Anglia, Norwich NR4 7TJ, UK
([email protected]), Godoy: EssexLab, University of Essex, Colchester CO4 3SQ, UK
([email protected]), Morales: Facultad de Economía, Universidad de Málaga, Málaga
29007, Spain ([email protected]), Walker: Department of Economics and Vincent and Elinor
Ostrom Workshop in Political Theory and Policy Analysis, Indiana University, Bloomington
IN 47405, USA ([email protected]). The authors thank David Cooper, Enrique Fatas,
Simon Gächter, Ron Harstad, Martin Kocher, Andreas Leibbrandt, Miguel Ángel Meléndez-
Jiménez, Daniele Nosenzo, Charles Noussair, Martin Sefton, Matthias Sutter, Erte Xiao and
seminar participants at the 2014 ESA North American meetings, the 2013 Southern Economic
Association Meetings and the University of Málaga for their helpful comments, suggestions
and advice. Funding from the University of Málaga, the School of Economics at the
University of East Anglia and EssexLab is gratefully acknowledged.
2
1. Introduction
A common feature in most experimental studies of public good games is that
the institution proposed to increase contributions is provided exogenously and
the emphasis is placed on which conditions effectively help to alleviate the
free rider problem (see Chaudhuri, 2011 for a recent survey). Of late, there is a
growing interest in how the institution comes into being. This issue is
important because the formation of the institution is subject to a second-order
free rider problem. Everyone may profit from the institution but each prefers
the others to provide it (see Oliver, 1980).1 The literature on the endogenous
formation of institutions provides an answer assuming that the institutional
choice mechanism is voting: there is ample experimental evidence showing
that in many cases, the outcome of the voting is a sanctioning institution.2 This
approach however assumes that the group has the capacity to organize the
voting mechanism and to enforce the resulting sanctioning institution. It is
problematic that this approach explains the emergence of one institution by
assuming the existence (from the outset) of another.
Individuals in many societies can and do act on their own – such as deciding
on contributions to the public good – without the need for the group to
aggregate individual preferences. In addition, in many settings, individuals
discontented with the contribution levels of her peers, can choose to
unilaterally provide and enforce efficiency-enhancing institutions such as
sanctioning.3 It is, therefore, perhaps more natural to take individual actions as
1 Other early works on this issue are Yamagashi (1986), where subjects were offered the possibility to voluntarily fund a sanctioning institution in a public goods game and Ostrom et al. (1992), where in a common pool resource game, subjects had the opportunity to communicate to decide whether to use sanctions. 2 Gürerk et al. (2006), Ertan et al. (2009) and Sutter et al. (2010) are examples where the choice is between no sanctions versus informal sanctions. In Kosfeld et al. (2009), the choice is between no sanctions and formal sanctions imposed by a central authority. Markussen et al. (2014) and Kamei et al. (2014) are recent studies where the choice is between formal vs informal sanction schemes. 3 There are alternative institutions other than sanctioning that can be implemented. Some examples are rewards for high contributors (Sefton et al. 2007), ostracism of low contributors
3
the starting point in analysing the ability of groups to endogenously provide
and enforce efficiency-enhancing institutions such as sanctioning.
In this paper, we examine the effectiveness of the sanctioning institution when
its provision depends on individuals acting independently. Will individuals
unilaterally choose to take a punishment role? If so, what is the effect on
group outcomes in comparison to when the sanctioning institution is
exogenously and universally provided? Finally, how is the effectiveness of the
institution changed if individuals must unilaterally bear the cost of providing
it?
Based on the standard assumptions of own income maximization, individuals
would not be expected to provide the sanctioning institution or to use it to
discipline free-riders. However, previous work has found that individuals do
make use of exogenously provided sanctioning institutions and are able to
enforce high cooperation levels in groups. Fehr and Schmidt (1999), hereafter
FS, rationalise such behaviour using a model of inequity aversion. Extending
their model to our setting, we examine the endogenous provision and use of a
sanctioning institution by individuals. We show that individuals may be
willing to provide the institution even at a cost and, further, that cooperation
can be sustained by targeted punishment.
We then examine the process of endogenous provision of the sanctioning
institution by individuals in a public goods experiment. In our experiment,
before making decisions on contributions, individuals unilaterally decide
whether or not they want to be able to use punishment. The number of such
individuals is then announced before the contribution stage takes place.
Finally, contribution levels are made public and only those individuals who
gave themselves the “right” to make use of sanctioning can assign punishment
(Cinyabuguma et al. 2005), excludability (Croson et al., 2014) and leadership within groups (van der Heijden et al. 2009).

4
to any group member.4 We consider two variants of the sanctioning institution
where individuals choose-to-participate (CTP) - whether the choice to
participate is available at no monetary cost (CTP0) or whether there is a
positive cost (CTP1).5 In addition, we replicate the most common settings in
public goods experiments – the Voluntary Contributions Mechanism (VCM)
and the VCM with an exogenously provided opportunity to punish (StdPun).
In the VCM setting, subjects could only contribute to the public good and
there was no enforcement mechanism available. In the StdPun, all group
members automatically had the right to assign punishment to others in the
group.
One may think of the CTP settings as allowing for extreme cases that
correspond to the provision cost of the sanctioning institution. When the
provision cost approaches infinity, no player will choose to sanction and the
institution will resemble the VCM. When the provision cost approaches zero
as in CTP0, then all players may choose to give themselves the right to
sanction and the institution will resemble StdPun. Hence, a monotonicity
argument on the cost of provision may apply here.
This broad intuition is confirmed by our data. When the provision of the
sanctioning institution is costly, fewer subjects choose to participate in the
punishment stage than when it is costless. In terms of the effects on
cooperation, while both CTP treatments start at the same level, cooperation
4 This is akin to the behaviour of vigilantes who take it upon themselves to enforce a norm and punish others who violate it. A related paper is Masclet et al. (2013), where subjects can make non-binding threats before the contribution stage. Players issue costless detailed threats to other group members as a function of hypothetical contribution levels and these threats are made public before making the contribution decisions. They also find an increase in contributions with respect to a standard VCM. Our setting is much simpler in that signals (that can be interpreted as threats) are voluntary and not targeted at specific individuals. 5 Using standard economic terminology, the punishment technology may entail a fixed per round provision cost (associated with acquiring and having the technology ready to use) and a variable cost (associated with making use of it). The standard approach in the literature is linear variable cost with no provision cost (as in Herrmann et al., 2008). Some papers though consider a positive provision cost but the decision to provide the sanctioning institution is taken at the group level (see for example Kosfeld et al., 2009).

5
levels in the two CTP treatments soon diverge. In CTP0, groups are as
successful in raising cooperation as with automatic universal participation in
punishment (StdPun). In CTP1, groups are unable to raise cooperation levels
and contributions to the public good stagnate at levels close to those observed
in the VCM setting. However, complementary to these general patterns, there
are a number of additional findings that greatly enrich the picture.
First, in the costless treatment, there is less than full provision of the
sanctioning institution; in only 10% of all occasions did all group members
choose to participate in the punishment stage and the overall average
participation rate is 60%. Given that not providing the institution in this case is
weakly dominated (punishment is a right, not an obligation, and there is no
monetary cost), it might be surprising that some subjects did not give
themselves the right to punish. The literature on voting on punishment systems
in public good games sheds some light on this result (see for example, Gurerk
et al., 2006, and Ertan et al., 2009). First, not all groups succeed in
implementing the punishment regime and second, in those cases that the group
implements the punishment system, the institution is not always unanimously
approved (majority rule is usually used). This means that some subjects are
not in favour of sanctioning others as an institution. In our CTP settings, these
subjects may choose to not take on the punisher role.6
Second, some monotonicity results hold between and within the CTP settings.
On one hand, the average number of subjects providing the institution is larger 6 There is a branch of the literature that analyses the performance of the sanctioning institution in VCM settings where exogenously provided punishment networks limit punishment opportunities, as well as the information subjects receive on contributions and punishment imposed/received (e.g., Carpenter et al., 2012, Fatas et al., 2010 and Leibbrandt et al., 2014). Carpenter et al. (2012) find that the complete network, where everybody can punish everyone, is more efficient than incomplete networks that restrict punishment opportunities to a subset of subjects. Leibbrandt et al. (2014) examine complete vs incomplete punishment networks, but in a setting where there are fixed identifiers across round that allows subjects to receive complete information about all other subjects in their group regarding contribution and punishment decisions. They find that the structure of the punishment network significantly affects allocations to the public good and that network configurations are more important than punishment capacities.

6
in CTP0 than in CTP1. This shows that the law of demand previously reported
in the literature with respect to variable punishment costs (Anderson and
Putterman, 2006, and Carpenter, 2007) extends to fixed provision cost.7 On
the other hand, within each CTP treatment, there is a positive relation between
the number of players choosing to provide the institution and group
contribution levels. This result is important because it suggests that subjects
are able to unilaterally develop credible signals.8
Third, for the same number of signals, contributions in CTP0 are higher than
in CTP1. The question is why the development of credible signals increases
contributions in the costless setting but not in the costly one. In CTP0,
participation decisions are not strongly dependent upon having received
punishment in the previous round. In CTP1, however, the participation
decision is strongly contingent on having been punished in the previous round.
Further, in regard to the use of sanctioning, subjects are found to punish high
and low contributors with virtually the same intensity in CTP1, but not in
StdPun or in CTP0. This suggests that “blind revenge” (Ostrom et al. 1992) is
a larger factor in CTP1, diminishing the efficacy of targeted punishment
toward low contributors, the key element for raising contributions.
Fourth, an individual’s decision to provide the sanctioning institution is not
found to be strongly correlated with his/her contribution decision; the
contribution levels of those participating more often in the punishment stage
are not significantly different from those participating less often in the
punishment stage. This suggests that individuals’ cooperation decisions
depend more on the persistent existence of a sanctioning institution and less so
on whether they themselves provide the institution repeatedly.
7 Although in a different context, there are studies showing that zero is a special prize, in the sense that people perceive the benefits associated with free products as higher (Shampanier et al., 2007). 8 Note that there is no reputation building in our experiment because the identity of those players choosing the punisher role was not disclosed, only the number of such players.

7
Finally, in CTP1, the experimental value of the cost of providing the
sanctioning institution was negligible - a twentieth of an individual’s initial
endowment. After completing the initial experiments mentioned above, we
conducted a variant of the costly treatment in which the cost of participation
was higher than in CTP1. We find essentially the same patterns in punishment
and cooperation behaviour as in CTP1. This suggests that the mere existence
of a provision cost hinders the development of an effective sanctioning
institution. The reason for this result appears to be related to both a decrease in
the level of participation in, and use of, the sanctioning institution.
To our knowledge, no previous study explicitly examines treatment conditions
with positive and null provision costs of providing a sanctioning institution.
There is, however, some prior related evidence. Both in Gürerk et al. (2006) -
where players can vote with their feet whether to be in a society with or
without punishment - and in Ertan et al. (2009) - where the group decides
whether punishment is allowed using a majority rule - the provision cost of the
sanctioning institution is zero and it is effectively chosen with positive effects
on contributions and efficiency levels. Kosfeld et al. (2009) consider a positive
provision cost in a setting in which players voted for implementing the
institution. The provision cost, however, is borne by only those who voted for
provision. They find that punishment is successfully implemented by a large
number of groups.9
Our results indicate that an endogenous sanctioning institution can raise
contributions, even without full provision.10 The persistent participation of
players (in CTP0, the average participation rates of the players with the first
and second highest number of decisions to participate are 93% and 81%) and
9 In studies where the subjects’ choice is between formal vs informal sanctioning (Markussen et al., 2014, and Kamei et al., 2014), the cost of providing the formal mechanism affects the choice: formal sanctions are more popular when they carry no up-front cost, whereas informal sanctions are more popular and efficient when adopting the formal scheme entails such a cost. 10 We find efficiency gains with respect to the VCM without punishment in the second half of the experiment.

8
punishment targeted at low contributors are found to be behind the successful
implementation of the institution.
However, our results also suggest that the process of endogenously providing
a sanctioning institution is a complex one. Having the right to punish from the
outset might be interpreted and used differently than when allowing oneself
the right to punish. Granting players the opportunity to unilaterally empower
themselves with the sanctioning institution may induce different behavioural
responses in comparison to situations where all group members are
empowered with the right to sanction. Whether players use the sanctioning
institution for the good (disciplining free riders) or for the bad (blind revenge)
is up to them. We show that endogenous institutional change can be a very
fragile process that is sensitive to subtle details; in our case, to the existence of
a positive provision cost, even if negligible.
The rest of the paper is organised as follows. Section 2 presents a theoretical
analysis of the effects of a provision cost. Section 3 details our experimental
design and procedures and Section 4 presents our hypotheses. Section 5
presents and discusses our results and Section 6 concludes. Appendix A
contains the experimental instructions for our costly endogenous participation
treatment. Instructions for the other treatments simply deleted the irrelevant
parts.
2. Punishment in a Public Goods Game with Endogenous Costly Provision
A group of n ≥ 2 players interact repeatedly over time. In each period, each
player receives an endowment y that he/she can allocate to a private account
with return 1 or to a public good 𝑔!. Each player receives aG from the public
good where 𝐺 = 𝑔!!!!! is the total contribution to the public good and a is
the marginal per-capita return (MPCR), with 0 < a < 1 < an. This implies that
full contribution is socially optimal although no contribution is the dominant
strategy under standard preferences.

9
In games with punishment, a player can also use his earnings from the game to
punish other players (let 𝑝!" denotes the punishment player 𝑘 sends to player
𝑙, 𝑘 ≠ 𝑙). A unit of punishment imposed on a player costs the punishing
player c units (0 < c < 1).11 A player’s monetary payoff in a period is given by
𝜋! 𝑔, 𝑝 = 𝑦 − 𝑔! + 𝑎𝐺 − 𝑐 𝑝!"
!
!!!!!!
− 𝑝!"
!
!!!!!!
Experimental evidence has shown that cooperation can be sustained when the
contribution stage is followed by a punishment stage. This result can be
rationalized using social preferences à la FS, that are defined in terms of final
monetary outcomes. For a profile of monetary payoffs 𝜋!,… ,𝜋! , the utility
to player 𝑖 is
𝑢! 𝜋!,… ,𝜋! = 𝜋! −𝛼!
𝑛 − 1𝑚𝑎𝑥 𝜋! − 𝜋! , 0 −
𝛽!𝑛 − 1
𝑚𝑎𝑥 𝜋! − 𝜋! , 0!
!!!!!!
!
!!!!!!
where 𝛼! measures the utility loss to player i associated with disadvantageous
inequality and 𝛽! measures the utility loss associated with advantageous
inequality, with 𝛼! > 𝛽! and 𝛽! ∈ 0,1 . FS show that any positive contribution
level (ranging from 0 to full contribution) can be supported as a subgame
perfect equilibrium outcome. The key is that some players who dislike
advantageous inequality and do not find it dominant to free ride (conditionally
cooperative) also experience a utility loss associated with disadvantageous
inequality and thus find it optimal to punish free riders in the punishment stage
(enforcers). This threat to punish is credible and potential defectors find it
optimal to contribute in the first stage.
11 We use FS original notation, in particular regarding the description of the punishment technology.

10
This section examines the introduction of an acquisition cost 𝛾 ≥ 0 to the FS
model. We do not perform an equilibrium analysis because such equilibrium
arguments are of little help in understanding behaviour in pure coordination
games where any symmetric contribution profile g is an equilibrium profile.
Rather, we analyse how the introduction of an acquisition cost modifies
players’ incentives to punish, contribute and ultimately to provide the
sanctioning institution.
First, note that if player 𝑖 has spent 𝛾 on acquiring the punishment technology,
the total monetary payoff to this player decreases by the amount 𝛾. This
immediately implies that the results found in the FS setting elegantly carry
over to our setting if the punishment technology is costless, i.e., 𝛾 = 0, or if all
group members have acquired the punishment technology.12
Lemma 1. If the punishment technology is costless or if all players invest in
the punishment technology, then the results from FS apply.
The interesting case is when some players provide the institution while others
don’t. 13 Let us focus on player 𝑖 who has invested in the punishment
technology and player 𝑗 who has not. Prior to any punishment, the monetary
12 Proposition 5 in FS shows that any contribution profile g can be sustained in (subgame perfect) equilibrium. This is achieved if there is a group of conditionally cooperative enforcers that are willing to punish selfish defectors (selfish players are never required to punish, neither in equilibrium nor in out of equilibrium subgames, because it is not rational for them to punish). The consideration of a positive cost 𝛾 > 0 rules out equilibrium outcomes with contribution levels so low that the acquisition cost is not recovered. This is consistent with intuitions from signalling theory (costly signals are more credible) and with forward induction arguments that suggest that a conditionally cooperative enforcer willing to pay a high cost for the sanctioning institution is striving for a large contribution level (to recover the investment cost). 13 All the arguments in this section are based on comparisons of behaviour of providers and non-providers. This seems important because the decision to provide the institution is endogenous in our setting, and is the first decision to be taken by the players. Hence, an evaluation of behaviour under both roles seems pertinent and relevant to explain players’ behaviour in the experiment. Although players did not observe the provision decisions of others, it will be shown later than in the majority of occasions in the costly treatments, there was only one provider (two at most). Hence, often providers had good knowledge that they were surrounded mostly by non-providers.

11
payoffs to players 𝑖 and 𝑗 are 𝜋! 𝑔 = 𝑦 − 𝑔! − 𝛾 + 𝑎𝐺 and 𝜋! 𝑔 =
𝑦 − 𝑔! + 𝑎𝐺, respectively.
If player 𝑖 has contributed more to the public good than has player 𝑗, then
player 𝑖 finds himself in a disadvantageous situation, since 𝜋! 𝑔 > 𝜋! 𝑔 . In
this case, the optimal amount of punishment that player 𝑖 sends to player 𝑗 is
the solution to the following utility maximization problem
𝑀𝑎𝑥!!" 𝜋! 𝑔 − 𝑐𝑝𝑖𝑗 −𝛼!
𝑛 − 1 𝑔! + 𝛾 − 𝑔! + 𝑐𝑝𝑖𝑗 − 𝑝𝑖𝑗
The first order condition with respect to 𝑝 is !!! ∙ !"
= −𝑐 + !!!!!
1− 𝑐 ,
implying that player 𝑖 will find it optimal to punish player 𝑗 if player 𝑖 is
sufficiently upset by the inequality to his disadvantage, e.g. if 𝛼! >! !!!!!!
, or
equivalently if the cost 𝑐 is small enough, 𝑐 < !!!!!!
. These conditions are the
analogue to those found in FS because, in this respect, the acquisition cost is a
sunk cost.14
Lemma 2. The willingness to punish is invariant to the introduction of
acquisition cost 𝛾.
While those players willing to punish in FS will also be willing to punish in
FS with cost 𝛾, a difference is obtained as to the optimal number of points
sent. In fact, they will depend positively on the cost 𝛾. A player willing to
enforce cooperation will punish so that monetary payoffs are equalized; since
the marginal utility does not depend on the punishment points sent, the
maximization problem has a corner solution. The optimal punishment is
14 These equations and the equation for the optimal punishment that will appear below are not exactly the same as those in Proposition 5 of FS. The reason is that Proposition 5 is based on an (equilibrium) strategy where all enforcers punish a defector, and therefore the punishment points sent are symmetrically allocated among all enforcers. The analysis in this section is based on a vis-à-vis comparison. The FS formulae reduce to ours when the group size n is 2.

12
𝑝!"∗ =𝑔! − 𝑔! + 𝛾1− 𝑐
Lemma 3. Punishment is increasing in acquisition cost 𝛾.
Lemma 3 shows that the acquisition cost is not a mere sunk cost, but that it
increases the punishment used to discipline others who have not invested in
the punishment technology. The lemma says that it is not only the defectors
(players 𝑗 with 𝑔! > 𝑔!) who will be disciplined. One of the consequences of
Lemma 3 is that it rationalizes anti-social punishment. Note that there are
contributions 𝑔! < 𝑔! and acquisition cost 𝛾 such that player 𝑖 will find
himself in a disadvantageous situation despite the fact that he has contributed
less than player 𝑗, e.g. when 𝛾 > 𝑔! − 𝑔! > 0.
Lemma 4. Anti-social punishment can be rational behaviour with a positive
acquisition cost.
Lemma 3 is also informative of how the willingness to acquire the punishment
technology is affected by the existence of an acquisition cost. The acquisition
cost negatively impacts the utility of an enforcer through two different
channels: (i) directly, because it is a cost that decreases the monetary payoff,
and (ii) indirectly, through the larger punishment that the enforcer will choose
to direct at defectors. After the punishment, the utility to the enforcer is
𝑢! 𝜋 = 𝜋! 𝑔 − 𝑝∗ = 𝑒 − 𝑔! − 𝛾 + 𝑎𝐺 −𝑔! − 𝑔! + 𝛾1− 𝑐
and the derivative with respect to 𝛾 is −1− !!!!
< 0 negative.15
Lemma 5. The utility to an enforcer is decreasing in the acquisition cost.
In the FS setting without an acquisition decision, any contribution profile can
be supported in equilibrium. This continuum of equilibrium outcomes raises 15 Enforcers are those players for whom zero contribution is not a dominant strategy, e,g, such that 𝛼! + 𝛽! ≥ 1.

13
the issue of selecting equilibria to coordinate on. FS offer a refinement based
on symmetry and efficiency to select the equilibrium with the highest possible
contribution level.
Lemmas 4 and 5 put some stress on any symmetric contribution profile in our
setting, because those players who have invested in the punishment
technology will punish those who haven’t, despite the fact that they all are
contributing the same amounts. This is the case even if all players are fully
contributing to the public good. The introduction of a positive provision cost
thus qualifies the FS argument in that it extends the symmetry to the provision
of the sanctioning institution as well. Even those players who will never find it
optimal to punish (e.g., those who do not care about inequality) are required to
provide the sanctioning institution.16
Selfish players must invest in the punishment technology to signal that they
understand the game and that they must offset the payoff inequality caused by
the cost paid by the conditionally cooperative enforcers. As long as the
number of players willing to provide the sanctioning institution is below n,
two types of (rational) punishment can occur: (i) punishment directed at
defectors in the provision of the public good, i.e., those contributing less to the
public good, and (ii) punishment directed at defectors in the provision of the
sanctioning institution, i.e., those not providing the institution. A
misinterpretation of the reason for why one is punished (punishment cannot
signal why the punishment is sent), particularly by a high contributor
(antisocial punishment), might lead to negative reactions with negative
consequences for efficiency (Rand et al. 2010).
16 In any coordination game, changes in off-equilibrium payoffs are known to affect the equilibrium selection process (see the classical work by Cooper et al. 1990). The introduction of an acquisition cost affects the size of punishment and therefore changes payoffs off the equilibrium path (in equilibrium there is not punishment). This might be a second, and more behavioural, channel by which the existence of an acquisition cost negatively affects the selection of the equilibrium with the highest possible contribution level.

14
Finally, Proposition 5 in FS shows that full cooperation can be achieved and
that under some circumstances, a unique enforcer is enough to achieve it: if his
preferences satisfy 𝑐 < 𝛼!/ 𝑛 − 1 1+ 𝛼! and 𝑎 + 𝛽! ≥ 1.
Lemma 6. When the punishment cost, c, is “small”, high contributions levels
can be enforced by just one player who provides the sanctioning institution.
This analysis reveals the fragility of the sanctioning institution to the
introduction of a positive provision cost: (Full) contribution to the public good
requires all players to provide the sanctioning institution. FS offered
punishment as an institution that solved the public good game contribution.
However, the institution is itself a public good. The introduction of a positive
𝛾 turns the provision of the sanctioning institution into a threshold public good
where the threshold is the highest possible: full provision.
3. Experimental Design and Procedures
This study includes data from four initial experimental treatments, as well as
an additional treatment conducted to examine robustness. In all treatments,
there were 20 rounds with fixed groups and a contribution stage with 𝑛 = 4,
𝑦 = 20, and 𝑎 = 0.5. At the end of the contribution stage, each subject was
informed of her group’s total contribution to the public good in that round, the
individual contributions of the others in her group in descending order and her
individual earnings from her private account and from the public good.
Subjects did not have individual identifiers that could create reputation effects.
In the first treatment (VCM), a round ended after the contribution stage. The
second treatment was the standard exogenously provided sanctioning
institution (StdPun), as in Gächter et al. (2008). In this treatment, after the
contribution stage, subjects could use their earnings from the contribution
stage to reduce the earnings of each other, up to a maximum of 5 tokens for

15
each other group member.17 The term punishment was not used. For brevity
here, however, we will refer to such reductions as punishment. All four
subjects in a group automatically entered this stage, where they decided how
much punishment to assign, if any, to each of the others in their group. Thus,
while the assignment of punishment was endogenous, participation in the
institution itself was exogenously imposed for all group members, and at no
cost. The punishment technology used was 1:3, i.e., one token used to punish a
group member cost the punishing member 1 token and the recipient 3 tokens
(i.e., 𝑐 = 1/3 in terms of FS notation). The costs of assigning and receiving
punishment were deducted from earnings from the contribution stage.18 After
the punishment stage, subjects were informed of the total amount of
punishment they received and their earnings from both stages of the round.
Because no subject identifiers were used, subjects could not associate
punishment received with the particular group member who assigned the
punishment.
The two research CTP treatments required each group member to choose, in
each round, whether or not to provide the sanctioning institution, i.e. to
participate in the punishment stage in a round. Prior to the contribution stage,
each subject chose whether to participate in the punishment stage that
followed the contribution stage. 19 Before making contribution decisions,
subjects were informed only of the number of people in their group who had
chosen to participate in the punishment stage. Only those who indicated a
willingness to participate in the punishment stage in a round could assign
punishment after the contribution stage in that round. These subjects could
then punish any other group member, i.e., all group members could receive
17 cf. Sefton et al. (2007) where subjects were given an additional endowment for punishment. 18 If a player’s earning from the contribution stage was lower than 15 tokens, punishment was limited by his earnings. A player could have negative earnings in a round, but could not earn negative amounts in the experiment. 19 We used neutral language in the instructions and never referred to “contributions” or “punishment”. In Stage 1, subjects were asked “Do you want to make decisions in Stage 3?”

16
punishment, regardless of their choice in the initial stage. If no subject in a
group chose to participate in the punishment stage in a round, the round ended
after the contribution stage.
In the CTP0 treatment, the decision to participate in the punishment stage was
costless (γ = 0) and the institution was provided for free to each group member
who chose to participate. In the CTP1 treatment, each group member choosing
to participate in the punishment stage paid a fee of 1 token, i.e, γ = 1. The fee
was deducted from the earnings of the subject after the contribution stage and
before the punishment stage. This was done to ensure that a subject who gave
herself the right to punish could contribute as much to the public good as
could a subject who chose not to participate in the punishment stage. The
punishment technology-parameters were the same as in the StdPun treatment.
Table 1 summarises the treatments and presents the number of observations in
each.
Table 1. Summary of treatments
Treatment Punishment Opportunity
Participation in Punishment Stage
Punishment Participation
Cost
Number of subjects (groups)
VCM No - - 40 (10)
StdPun Yes All, automatically - 48 (12)
CTP0 Yes Only those who
choose to in Stage 1 0 tokens 52 (13)
CTP1 Yes Only those who
choose to in Stage 1 1 token 52 (13)
All sessions were conducted at EssexLab at the University of Essex. In each
session, 12 to 24 subjects, recruited from the student body at Essex were
randomly and anonymously assigned to four-person groups that stayed fixed
throughout 20 rounds. The repeated nature of the game and the partner

17
matching within groups was common information for all subjects. At the
beginning of each session, instructions for the 20-round public goods game
were read out by an experimenter. Subjects also had a copy of the instructions
that they could refer to at any time during the experiment. Subjects then took a
quiz to ensure understanding. They could not proceed until all questions were
answered correctly. Subjects then made decisions privately at their computer
terminals. At the end of the session, subjects answered a demographic
questionnaire.
The experiment was programmed in z-Tree (Fischbacher, 2007). In all
treatments, the stage game was repeated for 20 rounds and earnings from a
round could not be carried forward to future rounds. Subjects were paid their
earnings from all 20 rounds of the public goods game. Tokens were converted
to Pounds at the rate of 60 tokens to £1. A session lasted about 55 minutes and
subjects earned an average of £12.35 each including a £2.50 show-up fee.
4. Hypotheses
Based on the comparative statics analysis in Section 2 and on previous results
in the literature, we present alternative hypotheses on subject behaviour in our
different treatments.20 We begin with hypotheses on the provision, and use, of
the sanctioning institution in groups and then move on to hypotheses about
their effectiveness in raising cooperation in groups.
In CTP0, players who are not willing to punish may be indifferent between
providing the institution and not providing it. We thus do not have a clear
prediction on the number of providers in CTP0. However, Lemma 5 implies
that a positive provision cost will lead to a lower number of players providing
the institution. This gives our first hypothesis.
20 The null hypothesis is zero contributions and zero punishment in all treatments.

18
Hypothesis 1: The number of subjects providing the sanctioning institution in
CTP1 is lower than four. Further, it is lower than in CTP0.
We now turn to how the institution is used in each case. First, we look at the
amount of punishment used. Lemma 2 implies that, conditional on providing
the institution, players are equally likely to use punishment in all punishment
treatments.
Hypothesis 2: The frequency of punishment use by those providing the
sanctioning institution is similar in all three punishment treatments.
Lemma 3 implies that those providing the institution in CTP1 make more
intense use of punishment than do those in StdPun or in CTP0. On the other
hand, we have no reason to expect such a difference between StdPun and
CTP0.
Hypothesis 3: For those providing the sanctioning institution, the mean level
of punishment imposed on group members is higher in CTP1 than in StdPun
or in CTP0.
From the above hypotheses, the effect on aggregate punishment used in groups
is not clear. While the likelihood of punishment is the same in all treatments,
the number of providers and their intensity of punishment use is expected to
be different across treatments. We thus do not have a clear prediction on
differences in aggregate punishment use across treatments.
Turning to the targets of punishment, previous studies suggest that for
punishment to increase group contributions, it must be targeted effectively at
low contributors to “encourage” higher contribution levels (see, for instance,
Fehr and Gächter, 2000). In line with these studies, we expect that free-riders
(those with lower contributions to the public good) will be targeted for
punishment. While the presence of anti-social punishment cannot be
completely ruled out, Lemma 4 suggests that it is a rational response in the

19
model specified only in CTP1. We thus hypothesize that anti-social
punishment will crowd out some of the punishment of free-riders in CTP1.
Hypothesis 4: Punishment is targeted at free-riders in all punishment
treatments. However, significant anti-social punishment is observed only in
CTP1.
We do not present hypotheses on whether punishment is targeted at those who
do not provide the sanctioning institution. This is because, in our experiment,
subjects are only informed of the number of players providing the institution
and not their identities. Subject identifiers were not provided to avoid issues of
reputation building and targeted revenge in punishment. Moreover, for
cooperation to be sustained in CTP1, it is sufficient to know that all four
players have provided the institution.
We finally turn to the implications of the above for the effectiveness of the
sanctioning institutions that emerge under the different regimes. Based on
previous results in the public goods literature (for instance, Fehr and Gächter,
2000), we expect that contributions in VCM will collapse over time and that
contributions in StdPun will be significantly higher than in VCM. Further,
these patterns can be rationalised by the results in FS. Lemma 1 implies that
the same rationalisation applies to CTP0 as well. This gives our next
hypothesis on the overall effectiveness of the institutions formed.
Hypothesis 5: Contribution levels are similar in StdPun and in CTP0.
Further, they are both significantly higher than in VCM.
From Lemma 1, the FS results apply to CTP1 only when all four players
provide the institution. However, as stated in Hypothesis 1, we expect fewer
than four players to provide the institution in CTP1. Further, we expect
significant anti-social punishment in CTP1 (Hypothesis 4). As shown in Rand
et al. (2010), and as seen in Hermann et al. (2008), the presence of significant

20
anti-social punishment can prevent the evolution of cooperation. For both
reasons, we expect lower contributions in CTP1.
Hypothesis 6: Contributions in CTP1 are lower than in StdPun and in CTP0.
Finally, we address potential heterogeneity among groups in the provision and
effective use of the sanctioning institution. Lemma 6 states that, under some
circumstances, a single enforcer is sufficient to raise cooperation to high
levels. Rearranging the necessary condition, we have 𝑐 𝑛 − 1 < 𝛼!/ 1+ 𝛼! .
Note that in our experimental setting 𝑐 𝑛 − 1 = 1. Thus there are no social
preferences such that a unique enforcer can drive contributions to the highest
level. Successful implementation of the institution therefore requires at least
two enforcers, i.e., two players providing the institution. We hypothesise that
high contribution levels are observed only in those groups where at least two
players provide the institution.
Hypothesis 7: High contributions levels in CTP0 and CTP1 are observed only
when at least two players in the group provide the sanctioning institution.
We thus hypothesise that the exogenously provided sanctioning institution
(StdPun) will be effective in raising contributions over levels observed in
VCM. In addition, we hypothesise that the institution is provided to a lower
extent when its provision is costly. We expect that effective sanctioning
institutions will be provided by individuals in CTP0 and that they will be will
be as effective in CTP0 as in StdPun. However, we do not expect the
emergence of effective sanctioning institutions that can successfully raise
cooperation in CTP1.21
21 We do not present hypotheses on differences in efficiency across treatments. These depend on the magnitudes of punishment used relative to the increases in contributions. Moreover, punishment has been shown to lead to a clear efficiency increase only in very long repeated decision settings (Gächter et al. 2008).

21
5. Results
The presentation of results is organised around the testing of Hypotheses 1
through 7, based on the comparative statics analysis presented in Section 2.
However, we also present additional results that are related to the repeated
nature of the decision setting. Unless otherwise stated, Mann-Whitney
(hereafter MW) tests are used to make comparisons across treatments.
Because subjects did not have information about other groups, each four-
person group represents an independent decision-making unit. For these tests,
an observation is thus the mean (averaged over all 20 rounds) per-round
variable (e.g. contribution, punishment or earnings) by each group in a
treatment.
5.1 Institution Formation by Individuals
Figure 1 presents the mean number of members choosing to provide the
sanctioning institution over time in the two CTP treatments. Aggregating
across rounds, Table 2 presents the distribution of groups according to the
number of participants choosing to participate in the punishment stage.
Figure 1. Mean number of providers of the sanctioning institution
01
23
4
0 5 10 15 20Round
CTP0 CTP1
22
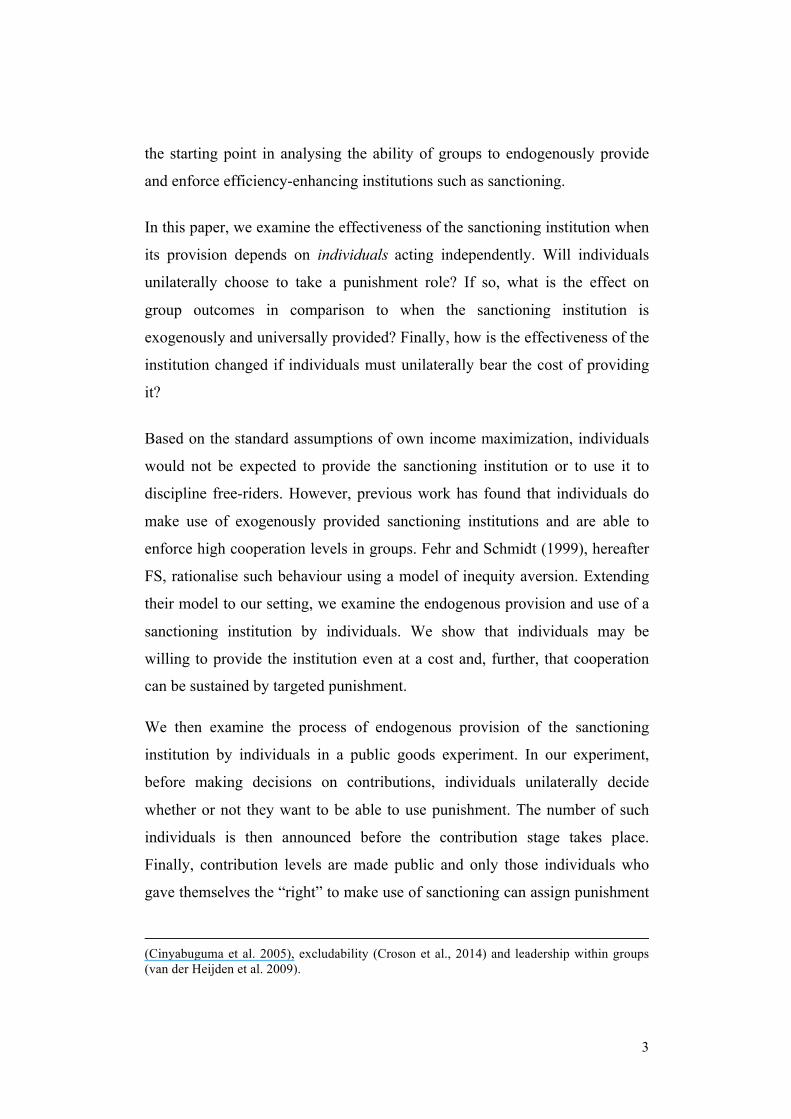
Table 2. Distribution of the number of providers per group across rounds and mean participation in the punishment stage (all 20 rounds)22
% of rounds # providers CTP0 CTP1
0 2.31 16.15 1 15.38 28.85 2 31.54 38.08 3 40.77 12.69 4 10 4.23
Mean Level 2.41 1.60 As Figure 1 shows, after the initial decision rounds, the average number of
participants choosing to be in the punishment stage is consistently lower in
CTP1 than in CTP0. Table 2 shows that there is a shift in the distribution
towards the upper end in CTP0 relative to CTP1. As shown, there are very few
rounds with zero participants in CTP0 and very few rounds with four
participants in CTP1. In particular, in CTP1, there are 4 participants in only 4
percent of all decision rounds and 3 participants in only 13 percent of all
decision rounds. The mean number of participants per-round is 2.41 in CTP0
and is 1.6 in CTP1. Using the group average as the unit of observation, the
difference between CTP0 and CTP1 is statistically significant according to
MW tests (p = 0.0040, n = 13). Further, they are both lower than in StdPun,
i.e., fewer than four people chose to participate in the punishment stage on
average (p = 0.0000 for CTP0 and p = 0.0000 for CTP1). This gives our first
result.
Result 1: The opportunity to choose to provide the sanctioning institution
leads to less than full provision, and average provision is lower in CTP1 than
in CTP0.
22 Figures in the table are percentages of groups in each category. Each group yields 20 observations, one for each period. Thus, each group could be in multiple categories. For instance, a group might have had 3 participants in punishment in round 10 but 2 participants in punishment in round 15.
23
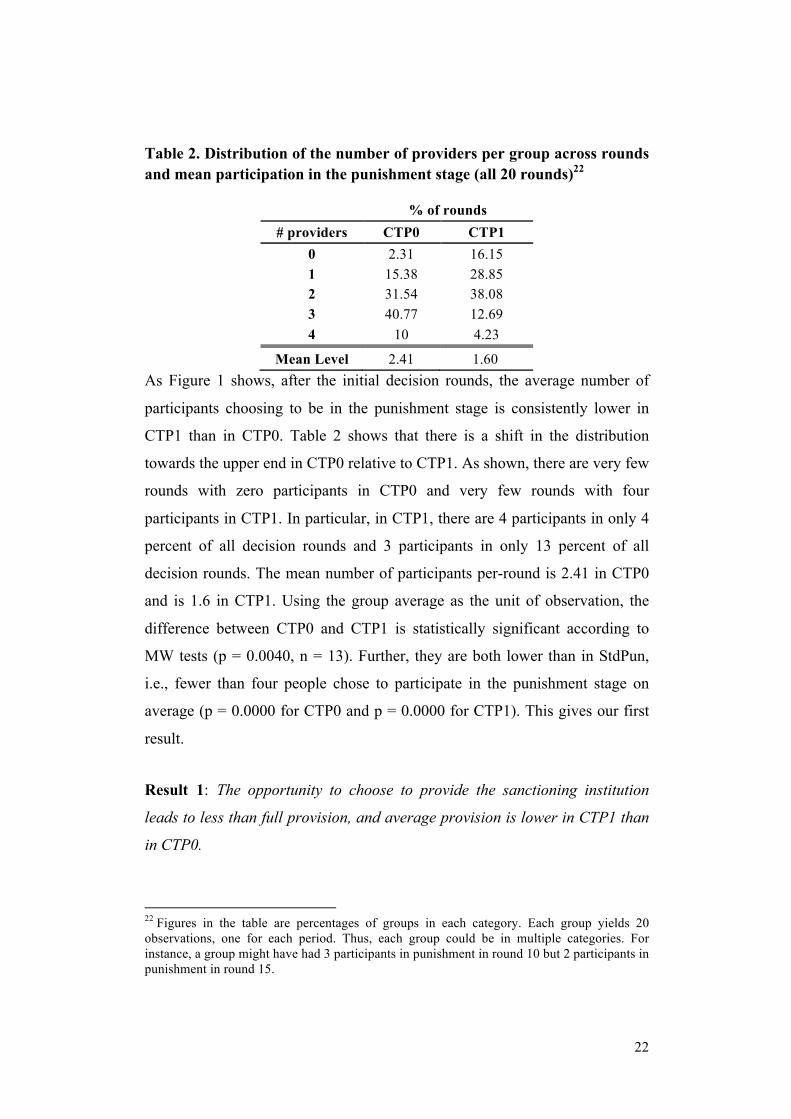
To examine persistence at the individual level within groups, individuals are
ranked in each group by the number of rounds in which they chose to
participate in the punishment stage (1 = highest, 4 = lowest). Figure 2 presents
the average number of rounds in which individuals of each rank chose to
provide the institution.
Figure 2. Mean number of participation rounds by individuals
As Figure 2 shows, individuals in the first three ranks choose to participate in
the punishment stage in a greater number of rounds in CTP0 than in CTP1.
MW tests confirm that the differences are significant (p = 0.0177, 0.0002 and
0.0179 for ranks 1, 2 and 3 respectively).
Result 1a: Individuals provide the punishment institution more persistently in
CTP0 than in CTP1.
In summary, fewer than four individuals provide the sanctioning institution in
both CTP treatments. Further, the introduction of a positive acquisition cost,
though negligible, significantly reduces provision. We thus find support for
Hypothesis 1.
18.62
15.38 15.77
8.077
10.62
5.154
3.154 3.385
05
1015
20
1 2 3 4
Num
ber o
f par
ticip
atio
n ro
unds
Participation rank within group
CTP0 CTP1

24
5.2 Use of the Sanctioning Institution
5.2.1 Amount of punishment used
Figure 3 (a) presents the mean frequency with which those providing the
sanctioning institution assign punishment to others in their groups and Figure
3 (b) presents the mean amount of punishment assigned by those providing the
sanctioning institution. Conditional on providing the institution, Table 3
presents the mean frequency of punishment and mean “per-capita” punishment
in each of the punishment treatments.23 In addition, it also presents mean
punishment used at the group level in each treatment. In Table 3 and in the
MW tests reported below, the unit of observation is the average (over all 20
rounds) for a group. The number of observations is thus the number of groups
in each treatment.
Figure 3. Mean frequency of punishment and mean punishment by
providers
Table 3. Means (standard deviations) at the Group Level
23 We adopt the convention that the number of players providing the institution in StdPun is four.
0
.2
.4
.6
.8
1
Frac
tion
0 5 10 15 20Round
(a) Frequency of punishment
0
1
2
3
4
5
Toke
ns
0 5 10 15 20Round
(b) Mean punishment by providers
StdPun CTP0 CTP1

25
Obs Frequency of punishment
“Per-capita” Punishment
Group Punishment
StdPun 12 0.371 1.739 6.958
(0.268) (1.592) (6.369)
CTP0 13 0.471 2.156 4.931
(0.208) (1.403) (2.791)
CTP1 12 0.624 3.258 5.35
(0.187) (1.912) (3.792) NOTE: There are only 12 observations in CTP1 since there was one group where no one ever provided the sanctioning institution.
Both Figure 3(a) and Table 3 show that, after the initial few rounds, those
providing the institution are more likely to use punishment in CTP1 than in
StdPun or in CTP0. Using the group average (across all 20 rounds) as the unit
of observation, MW tests confirm that the frequency of punishment is
significantly higher in CTP1 than in StdPun (p = 0.0350) and in CTP0 (p =
0.0502). However, the difference between StdPun and CTP0 (p = 0.4626) is
not significant. We thus find partial support for Hypothesis 2.
Result 2: The frequency of punishment use by those providing the institution is
higher in CTP1 than in StdPun and in CTP0. There is no significant difference
between the latter two.
Figure 3(b) and Table 3 show a similar pattern for the mean amount of
punishment used by those providing the institution, i.e., per-capita
punishment. MW tests show that per-capita punishment is significantly greater
in CTP0 than in StdPun (p = 0.0377), but that the difference between StdPun
and CTP0 is not significant (p = 0.2767). However, MW tests also show that
the difference between CTP1 and CTP0 is not significant (p = 0.1278). We
thus find mixed support for Hypothesis 3.
Result 3: Mean punishment by individuals providing the institution is
significantly higher in CTP1 than in StdPun. “Per-capita” punishment levels
are similar in CTP0 and CTP1.
26
While we do not have a hypothesis on aggregate punishment at the group
level, Table 3 shows that aggregate punishment is highest in StdPun and is
lowest in CTP0. However, the combination of lower provision rates and
higher per-capita punishment in CTP1 renders all paired comparisons between
treatments statistically insignificant (MW p > 0.50 in all cases).
Result 3a: Averaging across rounds, there is no significant difference in
aggregate group punishment levels across the three punishment treatments.
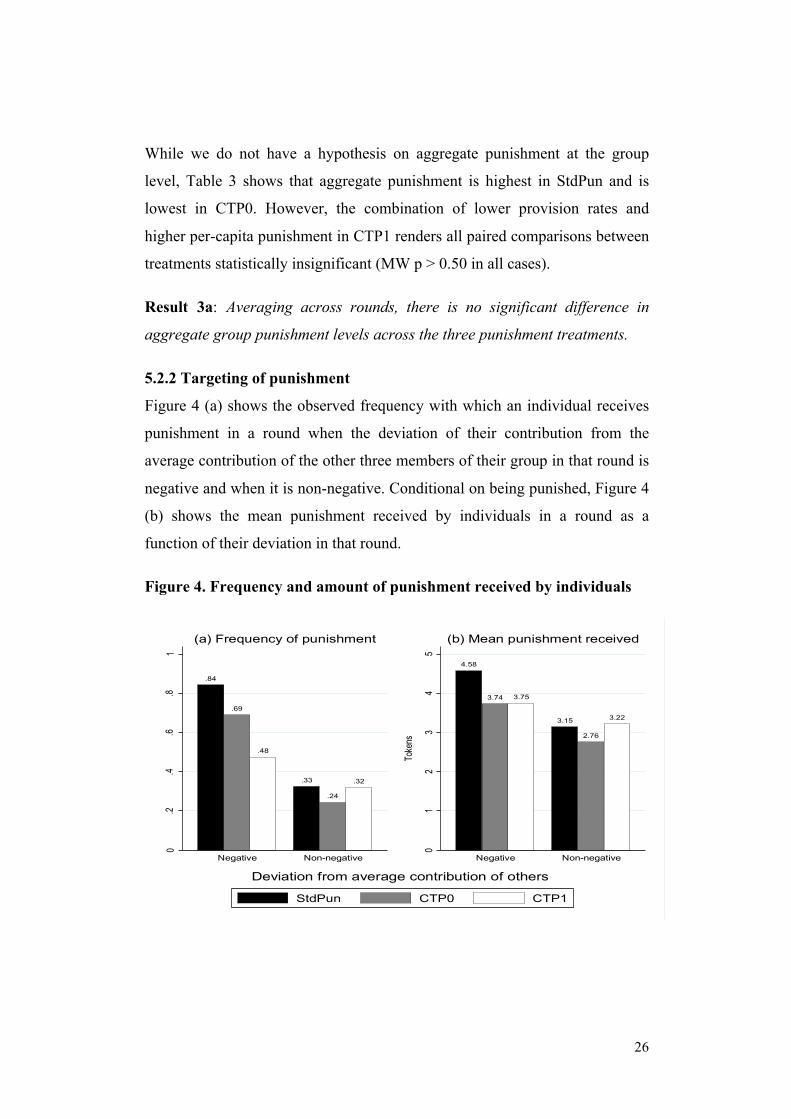
5.2.2 Targeting of punishment
Figure 4 (a) shows the observed frequency with which an individual receives
punishment in a round when the deviation of their contribution from the
average contribution of the other three members of their group in that round is
negative and when it is non-negative. Conditional on being punished, Figure 4
(b) shows the mean punishment received by individuals in a round as a
function of their deviation in that round.
Figure 4. Frequency and amount of punishment received by individuals
.84
.69
.48
.33
.24
.32
0.2
.4.6
.81
Negative Non-negative
Frac
tion o
f indiv
iduals
punis
hed
(a) Frequency of punishment
4.58
3.74 3.75
3.15
2.76
3.22
01
23
45
Negative Non-negative
Toke
ns
(b) Mean punishment received
Deviation from average contribution of others
StdPun CTP0 CTP1

27
Figure 4 (a) shows that across all punishment treatments, those with negative
deviations are punished more frequently than are those with non-negative
deviations. Based on Sign-rank tests, the difference in the frequency of being
punished between negative and non-negative deviations is significant in
StdPun (p = 0.0029) and CTP0 (p = 0.0019), but is not significant in CTP1 (p
= 0.1239). Figure 4 (b) yields a similar result. In all cases, those with negative
deviations receive more punishment than do those with non-negative
deviations. Based on Sign-rank tests, the difference in absolute punishment
received between negative and non-negative deviations is significant in
StdPun (p = 0.0218) and CTP0 (p = 0.0033), but not in CTP1 (p = 0.3465). 24,
25
Similar to previous studies examining sanctioning institutions, the results
reported above indicate that negative deviations are targeted for punishment in
all punishment treatments. However, the frequency and amount of anti-social
punishment in CTP1 is similar to that of punishment directed towards free-
riders. We thus find support for Hypothesis 4.
Result 4: In StdPun and in CTP0, negative deviations are punished more
severely and more often than are positive deviations. In CTP1, however, the
difference in frequency and intensity of punishment between negative and
positive deviations is not significantly different.
Rand et al. (2010) show that significant anti-social punishment can lead to
negative reactions and the prevalence of “spiteful defectors”. In order to more
fully understand differences in CTP0 and CTP1 with regard to choosing to
participate in the punishment stage, we estimate individual level Probit 24 For these tests, an observation is the difference between the average (over all 20 rounds) punishment, or frequency of punishment, received by those with negative deviations and those with non-negative deviations in each group in a treatment. The number of observations in each treatment is thus equal to the number of independent groups in that treatment (see Table 1). Sign-rank tests test if this difference is statistically different from zero. 25 The result is robust to finer partitions of the range of negative and non-negative deviations and to regression analysis.
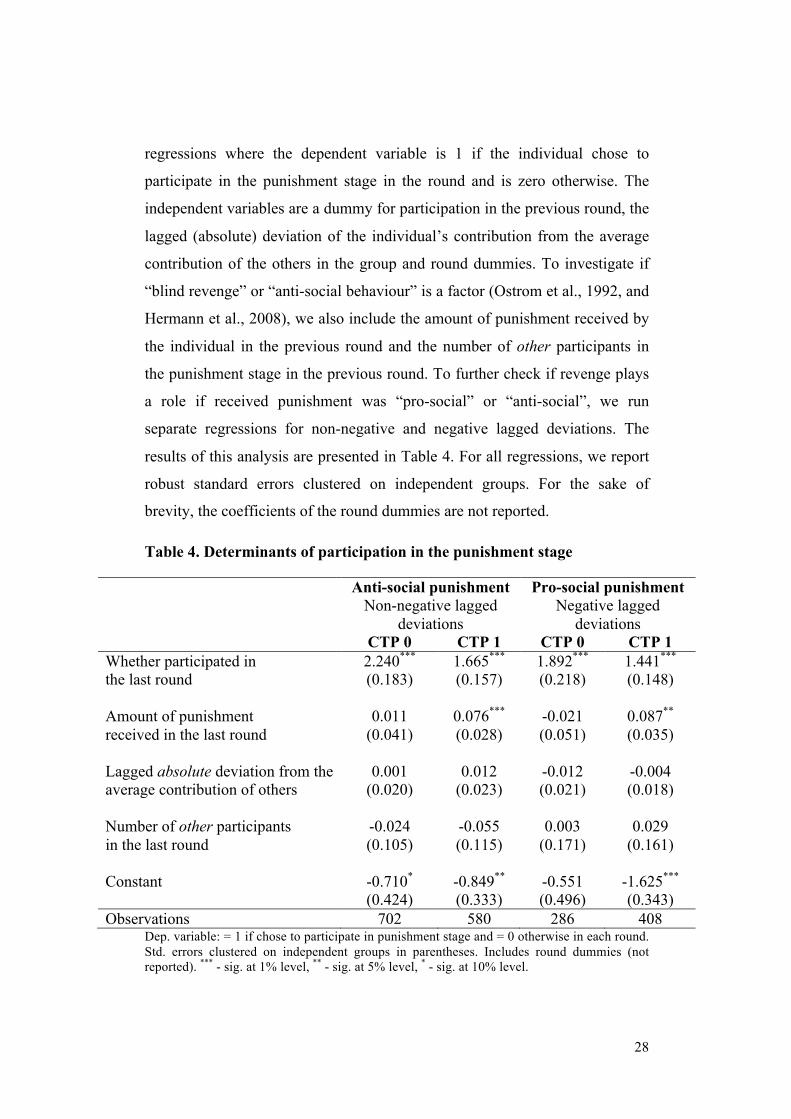
28
regressions where the dependent variable is 1 if the individual chose to
participate in the punishment stage in the round and is zero otherwise. The
independent variables are a dummy for participation in the previous round, the
lagged (absolute) deviation of the individual’s contribution from the average
contribution of the others in the group and round dummies. To investigate if
“blind revenge” or “anti-social behaviour” is a factor (Ostrom et al., 1992, and
Hermann et al., 2008), we also include the amount of punishment received by
the individual in the previous round and the number of other participants in
the punishment stage in the previous round. To further check if revenge plays
a role if received punishment was “pro-social” or “anti-social”, we run
separate regressions for non-negative and negative lagged deviations. The
results of this analysis are presented in Table 4. For all regressions, we report
robust standard errors clustered on independent groups. For the sake of
brevity, the coefficients of the round dummies are not reported.
Table 4. Determinants of participation in the punishment stage
Anti-social punishment Pro-social punishment Non-negative lagged
deviations Negative lagged
deviations CTP 0 CTP 1 CTP 0 CTP 1 Whether participated in 2.240*** 1.665*** 1.892*** 1.441*** the last round (0.183) (0.157) (0.218) (0.148) Amount of punishment 0.011 0.076*** -0.021 0.087** received in the last round (0.041) (0.028) (0.051) (0.035) Lagged absolute deviation from the 0.001 0.012 -0.012 -0.004 average contribution of others (0.020) (0.023) (0.021) (0.018) Number of other participants -0.024 -0.055 0.003 0.029 in the last round (0.105) (0.115) (0.171) (0.161) Constant -0.710* -0.849** -0.551 -1.625*** (0.424) (0.333) (0.496) (0.343) Observations 702 580 286 408
Dep. variable: = 1 if chose to participate in punishment stage and = 0 otherwise in each round. Std. errors clustered on independent groups in parentheses. Includes round dummies (not reported). *** - sig. at 1% level, ** - sig. at 5% level, * - sig. at 10% level.

29
The regressions suggest that there is strong path dependence in both CTP
treatments in regard to participation; subjects who participate in one round are
more likely to participate in the next round. However, the amount of
punishment received in a round is a strong predictor of participation in
punishment in the following round only in CTP1.26 Further, this is the case
whether players were below or above the average contribution level of others
in the previous round.
Result 4a: Those who are punished are more likely to choose to participate in
the punishment stage in the next round in CTP1, but not in CTP0.
Result 4a is complementary to Result 4 which showed that there is significant
anti-social punishment only in CTP1. Result 4a suggests that those choosing
to participate in the punishment stage in CTP1 may have a greater tendency
toward blind revenge or spite, targeting high contributors. The combination of
these two results suggests that, in CTP1, the punishment of low contributors is
crowded out by punishment targeted at those with positive deviations, leading
to less effective use of punishment in increasing group contributions.
5.3 Effectiveness of endogenously provided sanctioning institutions
Figures 5(a) and 5(b) show the evolution of mean group contributions and
earnings (both measured in tokens) over time. Since the initial endowment in
each round was 20 tokens per individual (80 for the group) and all costs were
paid out of this in all treatments, differences in earnings across treatments
directly capture differences in efficiencies across treatments. Table 5 presents
summary statistics of per-round group contributions and earnings.
Figure 5. Mean Group Contributions and Earnings
26 This is so even when the independent variable is a dummy for receiving punishment rather than the amount of punishment received.

30
Note: Group earnings at the Nash equilibrium are 80 tokens.
Table 5. Means (standard deviations) at the group level measured in tokens
Obs Contributions Earnings VCM 10 31.01 111.01
(14.212) (14.212)
StdPun 12 60.021 112.188
(20.472) (41.311)
CTP0 13 60.639 120.915
(11.935) (18.555)
CTP1 13 43.931 100.931
(18.103) (19.897)
Focusing first on contributions to the group fund, in all treatments mean
contributions start at approximately 50% of the group’s endowment of 80
tokens. Thereafter, contributions in the VCM and StdPun treatments follow a
pattern similar to other studies examining these treatments (see, for instance,
Fehr and Gächter, 2000). In VCM, they steadily decline over the course of the
0
20
40
60
80
Toke
ns
0 5 10 15 20Round
(a) Group Contributions
80
100
120
140
160
0 5 10 15 20Round
(b) Group Earnings
VCM StdPunCTP0 CTP1

31
game to below 20% of the endowment. In StdPun, they rise to around 75% of
the endowment by round 5 and stay at that level throughout the rest of the
game. The trajectory of contributions in CTP0 is very similar to that in
StdPun.
MW tests support the observations made above. Compared to VCM, group
contributions are significantly higher in StdPun (p = 0.0056) and in CTP0 (p =
0.0004). However, contributions in StdPun and in CTP0 are not significantly
different from each other (p = 0.4146). We thus find support for Hypothesis 5.
Result 5: Averaging across all 20 rounds, aggregate contributions are similar
in StdPun and in CTP0. Moreover, they are both higher than in VCM.
Mean contributions in CTP1 start similar to those in the other punishment
treatments. They begin to rise in the first 2-3 rounds. While contributions in
StdPun and CTP0 continue to rise, in CTP1 they then remain relatively flat,
above those in the VCM but below those in the other two punishment
treatments throughout the game. However, they are closer to levels observed
in the VCM than in the other two punishment treatments. MW tests show that
group contributions in CTP0 are not significantly different from those in VCM
(p = 0.1069) and that they are significantly lower than in both StdPun (p =
0.0296) and in CTP0 (p = 0.0171). Thus we also find support for Hypothesis
6.
Result 6: Averaging across all 20 rounds, group contributions in CTP1 are
significantly lower than in StdPun and in CTP0. Moreover, they are not
significantly different from contributions in VCM.
We next investigate to what extent increases in contributions to the group fund
are linked to those who persistently choose to provide the sanctioning
institution in their groups. Figure 6 presents mean contributions (over all 20

32
rounds) of individuals in each participation rank, as defined above (see Figure
2).27
Figure 6. Mean individual contributions over all 20 rounds by rank of
participation in the sanctioning institution
The figure suggests that there is no difference in individual contributions by
participation rank in CTP0. This is confirmed by OLS regression (not
reported) where the independent variable is an individual’s mean contribution
over all 20 rounds and the independent variables are dummies for participation
rank within the group (excluded category rank 4). None of the rank dummies
is significant at the 10% level. In CTP1, the figure suggests that average
contributions do not differ across the last three ranks but the average
contribution of individuals with rank 1 is higher than that of the rest. However,
an OLS regression shows that this difference is not significant. As above, none 27 We do not present time trends of contributions of providers and non-providers. This is because an individual can be a provider in some rounds and non-provider in others. Calculating aggregate contributions by providers would thus involve potentially a different set of players in each round. Hence, we calculate separate averages for each individual in a group.
14.62
12.07
15.41
10.46
15.46
10.55
15.15
10.85
05
1015
20
1 2 3 4
Toke
ns
Participation rank within group
CTP0 CTP1

33
of the rank dummies is significant.28 It thus appears that, in both CTP
treatments, group contributions do not differ between those who participate
persistently and those who do not.
However, there is a difference between the two CTP treatments. Figure 7 also
shows that mean individual contributions are higher in CTP0 than in CTP1 for
each participation rank. MW tests show that this difference is not significant
for rank 1 individuals (p = 0.2087) but is significant for each of the other three
ranks (p = 0.0096, 0.0129 and 0.0647 for ranks 2, 3 and 4 respectively). Thus
providers of the sanctioning institutions are more effective raising contribution
levels across ranks in CTP0 than in CTP1.
Result 6a: Within each CTP treatment, group contributions are not
significantly different between those that choose more often to provide the
sanctioning institution and those that do less so. However, the contributions of
those who provide the sanctioning institution more often and less often are
higher in CTP0 than in CTP1.
While we do not have a formal hypothesis on group earnings or efficiencies,
we can nevertheless look at earnings ex-post. When comparing earnings
across treatments, we account for the costs of punishment in the three
treatments that allow players to punish each other. Figure 5(b) implies that
these costs are substantial in the initial few rounds of the game. In the first five
rounds, earnings in VCM are the highest while there is no discernible
difference across the punishment treatments. In the remainder of the decision
rounds, group earnings are lowest in CTP1 and are highest in CTP0. There is
no systematic difference between earnings in VCM and earnings in StdPun.
Further, they both lie in between earnings in the two CTP treatments. This is
28 In regard to the OLS analysis in both treatments, the constant is positive and significant and is equal to the mean contribution of the rank 4 individual presented in Figure 6. The result is robust to individual-level panel random effects regressions that includes the above independent variables and lagged contributions and round dummies.

34
evident from the mean earnings in Table 5 as well. Mann-Whitney tests show
that, across all 20 rounds the only pairwise comparison with a significant
difference is the one between CTP0 and CTP1. In particular, group earnings
are significantly higher in CTP0 than in CTP1 (p = 0.0129). 29
Result 6b: Averaging across all 20 rounds, mean group earnings in the three
punishment treatments are very similar to earnings in VCM. Earnings in
CTP1, however, are significantly lower than in CTP0.
We thus find that the sanctioning institutions provided by individuals in CTP0
are as effective as when there is universal and exogenous participation in the
sanctioning institution, i.e., in StdPun. However, the sanctioning institutions
that endogenously emerge in CTP1 are not effective at raising contributions to
the public good. The use of the sanctioning institution that emerges in CTP0
outperforms that in CTP1 in terms of both contributions and efficiency.
5.4 Contributions: Level and Persistence of the Sanctioning Institution The previous results show that a smaller number of members provide the
sanctioning institution in CTP1 compared to CTP0 and that contributions are
lower in CTP1 than in CTP0. In terms of group outcomes, the question
becomes to what extent contribution levels vary with the number and
persistence of participants in the punishment stage. To examine this issue,
Figure 7 presents mean contributions of groups according to the average
number (over 20 rounds) of participants choosing the sanctioning institution.
Recall, in StdPun, the number of participants is four in every round since all
players automatically enter the punishment stage and is zero in the VCM
treatment. The horizontal lines for these two cases represent reference points
for average contributions.
29 Focusing on the last 10 rounds, earnings in CTP0 are significantly higher than in CTP1 (p = 0.0019) and VCM (p = 0.0053), but not significantly different than in StdPun.

35
Figure 7. Mean group contributions by number of members providing the institution
Note: The number of participants is not always a whole number since it is an average over 20 rounds. Figures in parentheses are the number of groups in each category. There are 13 groups in each of the CTP treatments.
Figure 7 provides evidence that group contributions increase with the average
number of players persistently providing the sanctioning institution. Group
level panel regressions (not reported) of group contributions on lagged
contributions, the lagged amount of punishment used and the number of
providers confirm the positive relationship in both CTP treatments.
Importantly, Figure 7 also provides evidence that group contributions in CTP0
are as high as in StdPun when at least 2 participants provide the sanctioning
institution. MW tests confirm that mean contributions in groups with at least
two providers in CTP0 (n = 10) are not significantly different from group
contributions in StdPun (p = 0.5097). However, mean contributions in groups
with fewer than two providers in CTP1 (n = 9) are significantly lower than in
StdPun (p = 0.0330).
38.85 (1)
52.52 (3)
42.64 (8)
63.01 (8)
47.79 (4)
63.33 (2)
StdPun
VCM
0
10
20
30
40
50
60
0 (0, 1] (1, 2] (2, 3] (3, 4]
Toke
ns
Average number providing the institution
CTP0 CTP1

36
Note that comparisons between StdPun and groups with fewer than two
providers in CTP0 or groups with at least two providers in CTP1 are not very
meaningful due to the small number of observations in the CTP treatments. In
CTP0, 77% of the groups have at least two persistent providers while in CTP1,
only 31% have at least two persistent providers. A proportions test shows that
this difference between the two CTP treatments is significant (n = 13 groups in
each; two-sided p = 0.0183).
Result 7: Groups contributions in CTP0 and CTP1 are significantly and
positively correlated with the number of group members providing the
sanctioning institution. Moreover, group contributions in CTP0 are as high as
in StdPun when at least two players consistently provide the institution.
5.5 The effect of a non-negligible participation fee
Appendix B includes additional experiments that examine the extent to which
the impact of requiring a positive price to provide the sanctioning institution
varies with the magnitude of the price. In a new treatment (CTP5), the
participation fee was raised to 5 tokens, one-quarter of a subject’s per-round
endowment. All other details were identical to those in CTP1.
The results from CTP5 lend support to the overall robustness of the effect of a
positive price for providing the sanctioning institution. In particular, patterns
in contribution, participation and aggregate punishment decisions closely
mirror those observed in CTP1. Further, they also support Hypothesis 3 that an
increase in the acquisition cost increases “per-capita” punishment by
providers.
Result 8: The effects of a positive acquisition cost on the formation of
sanctioning institutions by individuals and their effectiveness in raising
contributions are robust to non-negligible acquisition costs.
37
6. Conclusions
The decentralised sanctioning institution is one of the most widely studied
solutions to the free-rider problem in public goods games. It has been
documented time and time again that the ability of individuals to punish each
other raises contributions (for a recent review of the literature see Chaudhuri,
2011). Given the second-order free-riding problem (Yamagishi, 1986), an
important issue is the emergence of the institution. Unlike previous studies
that have explored exogenous provision of the institution or group choice as to
whether to adopt the institution, this study explores the willingness of
individuals to unilaterally provide and make use of the sanctioning institution.
We find that individuals are willing to unilaterally provide the institution in
their groups. However, the level of utilization and effectiveness of the
institution varies importantly as to whether the provision cost is zero. When
provision is costless group members consistently provide the institution for
themselves, although not at an individual rate of 100%. Further, in this case,
the sanctioning institution is as effective as when it is exogenously and
universally provided. Punishment is effectively targeted at low contributors,
raising contributions to the public good.
We also find, however, that if provision of the institution requires the payment
of a minimal fixed cost, the use and effectiveness of the sanctioning institution
decline. In the presence of a negligible monetary cost, the number of
individuals who are willing to provide the sanctioning institution is
insufficient to raise cooperation. Further, in this case, revenge appears to be a
greater reason for individuals choosing to participate in the sanctioning
institution. This motive renders punishment ineffective as punishment of low
contributors is crowded out to a greater degree by punishment of high
contributors resulting from blind revenge.

38
In a seminal work, Ostrom et al. (1992) established that “self-governance is
possible” in groups faced with a social dilemma. Since then, other work has
examined the effectiveness of exogenously provided sanctioning institutions
across a diverse set of treatment conditions and in situations where the
institution is adopted at the group level through voting mechanisms. Our study
adds to this literature. In particular, the results show that self-governance is
possible under broader and less restrictive conditions that do not depend on the
existence of other institutions such as majority voting or exogenously provided
institutions.
We find that individuals acting unilaterally are able to provide “governance”
in their groups and raise cooperation levels. However, we also find that the
sanctioning institution provided by individuals can be fragile. We identify a
factor in our experimental setting that is crucial for the success of institutional
provision by individuals – the non-existence of pecuniary costs that deter
provision and alter the way in which sanctioning is used. In our setting, even a
negligible cost leads to under-provision and counterproductive use of the
sanctioning institution.
The results of this study may provide additional insight into why some
societies have been able to develop effective institutions to raise cooperation
where none existed, while others have not. Allowing individuals to act
unilaterally to provide the institution can be successful in solving social
dilemmas. However, unilateral provision is by no means sufficient. The results
reported here point to the important role that participation costs may play in
the willingness of individuals to participate in a sanctioning institution and,
importantly, how it is used.
References
Anderson, Christopher M. and Louis Putterman (2006) “Do non-strategic sanctions obey the law of demand? The demand for punishment in the

39
voluntary contributions mechanism”, Games and Economic Behavior, 54(1), 1-24.
Carpenter, Jeffrey (2007) “The demand for punishment”, Journal of Economic Behavior and Organization, 62(4), 522-542.
Carpenter, Jeffrey, Shachar Kariv, and Andrew Schotter (2012) “Network Architecture, Cooperation and Punishment in Public Good Games”, Review of Economic Design, 95(1), 1-26.
Chaudhuri, Ananish (2011) “Sustaining cooperation in laboratory public goods experiments: a selective survey of the literature”, Experimental Economics, 14(1), 47-83.
Cinyabuguma, Matthias, Talbot Page and Louis Putterman (2005) “Cooperation under the threat of expulsion in a public goods experiment”, Journal of Public Economics, 89(8), 1421-1435.
Cooper, Russell W., Douglas V. DeJong, Robert Forsythe and Thomas W. Ross (1990) “Selection Criteria in Coordination Games: Some Experimental Results” American Economic Review, 80(1), 218-233.
Croson, Rachel, Enrique Fatas, Tibor Neugebauer and Antonio J. Morales (2014) “Excludability: A laboratory study on forced ranking in team production”, Working Paper.
Ertan, Arhan, Talbot Page and Louis Putterman (2009) “Who to punish? Individual decisions and majority rule in mitigating the free rider problem”, European Economic Review, 53(5), 495-511.
Fatas, Enrique, Miguel A. Meléndez-Jiménez, Hector Solaz (2010) “An experimental analysis of team production in networks”, Experimental Economics, 13(4), 399-411.
Fehr, Ernst and Simon Gächter (2000) “Cooperation and Punishment in Public Goods Experiments”, American Economic Review, 90(4), 980-994.
Fehr, Ernst and Klaus M. Schmidt (1999) “A Theory of Fairness, Competition and Cooperation”, Quarterly Journal of Economics, 114(3), 817-868.
Fischbacher, Urs (2007) “z-Tree: Zurich toolbox for ready-made economic experiments”, Experimental Economics, 10(2), 171-178.
Gächter, Simon, Elke Renner and Martin Sefton (2008) “The Long-Run Benefits of Punishment”, Science, 322(5907), 1510.
Gürerk, Özgür, Bernd Irlenbusch and Bettina Rockenbach (2006) “The Competitive Advantage of Sanctioning Institutions”, Science, 312(5770), 108-111.
Herrmann, Benedikt, Christian Thöni and Simon Gächter (2008) “Antisocial punishment across societies”, Science, 319(5868), 1362-1367.

40
Kamei, Kenju, Louis Putterman and Jean-Robert Tyran (2014) “State or nature? Endogenous formal versus informal institutions in the voluntary provision of public goods”, Experimental Economics, forthcoming.
Kosfeld, Michael, Akira Okada and Arno Riedl (2009) “Institution Formation in Public Goods Games”, American Economic Review, 99(4), 1335-1355.
Leibbrandt, Andreas, Abhijit Ramalingam, Lauri Sääksvuori and James M. Walker (2014) “Incomplete punishment networks in public goods games: experimental evidence”, Experimental Economics, forthcoming.
Markussen, Thomas, Louis Putterman and Jean-Robert Tyran (2014) “Self-Organization for Collective Action: An Experimental Study of Voting on Sanction Regimes”, Review of Economic Studies, 81(1), 301-324.
Masclet, David, Charles N. Noussair and Marie-Claire Villeval (2013) “Threat and Punishment in Public Good Experiments”, Economic Inquiry, 51(2), 1421-1441.
Oliver, Pamela (1980) “Rewards and Punishments as Selective Incentives for Collective Action: Theoretical Investigations”, American Journal of Sociology, 85(6), 1356-1375.
Ostrom, Elinor, James Walker and Roy Gardner (1992) “Covenants with and without a Sword: Self-Governance is Possible”, American Political Science Review, 86(2), 404-417.
Rand, David G., Joseph J. Armao IV, Mayuko Nakamaru, Hisashi Ohtsuki (2010) “Anti-social punishment can prevent the co-evolution of punishment and cooperation”, Journal of Theoretical Biology, 265(4), 624-632.
Sefton, Martin, Robert Shupp and James M. Walker (2007) “The Effect of Rewards and Sanctions in Provision of Public Goods”, Economic Inquiry, 45(4), 671-690.
Shampanier, Kristina, Nina Mazar and Dan Ariely (2007) “Zero as a Special Prize: The True Value of Free Products”, Marketing Science, 26(6), 742-757.
Sutter, Matthias, Stefan Haigner, and Martin G. Kocher (2010). “Choosing the Carrot or the Stick? Endogenous Institutional Choice in Social Dilemma Situations” Review of Economic Studies, 77(4), 1540–1566.
van der Heijden, Eline, Jan Potters and Martin Sefton (2009) “Hierarchy and opportunism in teams”, Journal of Economic Behavior and Organization, 69(1), 39-50.
Yamagishi, Toshio (1986) “The provision of a sanctioning system as a public good”, Journal of Personality and Social Psychology, 51(1), 110-116.

41
FOR ONLINE PUBLICATION
Appendix A – Instructions for the CTP1 treatment
Thank you for coming! This is an experiment about decision-making. You will
receive £2.5 for showing up on time. If you follow the instructions carefully,
you can earn more money depending both on your own decisions and on the
decisions of others.
These instructions and your decisions in this experiment are solely your
private information. During the experiment you are not allowed to
communicate with any of the other participants or with anyone outside the
laboratory. Please switch off your mobile phone now. If you have any
questions at any time during the course of this experiment, please raise your
hand. An experimenter will assist you privately.
Part 1 of the experiment consists of twenty (20) consecutive decision
rounds. Each decision round consists of three stages described below. Your
total earnings will be the sum of your earnings from all these rounds.
At the beginning of Part 1, participants will be randomly divided into
groups of four (4) individuals. The composition of the groups will remain the
same in each round. This means that you will interact with the same people in
your group throughout the experiment.
Your decisions will be recorded privately at your computer terminal. Other
participants will never be informed about your decisions or earnings from the
experiment. You will be paid individually and privately in cash at the end of
the experiment.
During the experiment all decisions are made in tokens (more details below).
Your total earnings will also be calculated in tokens and, at the end of the
experiment will be converted to Pounds at the following rate:

42
60 tokens = £1
First Stage of each round
Your task in Stage 1 of each decision round will be to decide whether or not
you want to make decisions in Stage 3 of the round. More details regarding
Stage 3 are provided below. If you decide to make decisions in Stage 3, one
token will be deducted from your earnings at the beginning of Stage 3.
Second Stage of each round
You are a member of a group of four participants. At the beginning of each
round, each member receives an endowment of 20 tokens. Your task is to
decide how many tokens you would like to allocate to a Group Project
(GP) and how many to keep for yourself in an Individual Project (IP).
Each token not allocated to the Group Project will automatically be allocated
to your Individual Project (IP).
Before making your decision, you will be informed about how many
members of your group have decided to make decisions in Stage 3.
Your total earnings from Stage 2 include earnings from both your Individual
Project and the Group Project. All participants in your group will
simultaneously face the same decision situation.
Your earnings from the Individual Project in each round
You will earn one (1) token for each token allocated to your Individual
Project. No other member in your group will earn from your Individual
Project.
Your earnings from the Group Project in each round

43
For each token you allocate to the Group Project, you will earn 0.5
tokens. Each of the other three people in your group will also earn 0.5
tokens. Thus, the allocation of 1 token to the Group Project yields a total
of 2 tokens for all of you together. Your earnings from the Group Project are
based on the total number of tokens allocated by all members in your group.
Each member will profit equally from the amount allocated to the Group
Project. For each token allocated to the Group Project, each group member
will earn 0.5 tokens regardless of who made the allocation. This means that
you will earn from your own allocation as well as from the allocations of
others.
Your total earnings in Stage 2 in each round
Your total earnings consist of earnings from your Individual Project and the
earnings from the Group Project.
Your earnings in Stage 2 = Earnings from your Individual Project +
Earnings from the Group Project
The following examples are for illustrative purposes only.
Example 1. Assume that you have allocated 0 tokens to the Group Project.
Suppose that each of the other group members has also allocated 0 tokens to
the Group Project. Thus the total number of tokens in the Group Project in
your group is 0. Your earnings from Stage 2 of this round will be 20 tokens
(20 tokens from your Individual Project and 0 tokens from the Group Project).
The earnings of the other group members in Stage 2 of this round will be 20
tokens each.
Example 2. Assume that you have allocated 10 tokens to the Group Project.
Suppose that each of the other group members has allocated 0 tokens to the
Group Project. Thus the total number of tokens in the Group Project in your
group is 10. Your earnings from Stage 2 of this round will be 15 tokens (= 10

44
tokens from your Individual Project and 10*0.5 = 5 tokens from the Group
Project). The earnings of the other group members from Stage 2 of this round
will be 25 tokens each (= 20 tokens from the Individual Project + 10*0.5 = 5
tokens from the Group Project).
Example 3. Assume that you have allocated 20 tokens to the Group Project.
Suppose that each of the other group members has also allocated 20 tokens to
the Group Project. Thus the total number of tokens in the Group Project in
your group is 80. Your earnings from Stage 2 of this round will be 40 tokens
(= 0 tokens from your Individual Project and 80*0.5 = 40 tokens from the
Group Project). The earnings of the other group members will similarly be 40
tokens each.
After all individuals have made their decisions in the second stage, you will be
informed of the total allocation to the Group Project and your earnings from
Stage 2. You will also be informed of the individual allocation decisions of
each group member, ranked from top to bottom. Individuals in your group will
NOT be identified in anyway. Thus, information about individual allocations
will be completely anonymous.
Third Stage of each round
You will make decisions in this stage only if you decided to do so in Stage
1.
In this stage, one token will be deducted from your earnings from stage 2 and
you can use the remaining tokens to decrease the earnings of any other
member in your group by assigning deductions tokens to them. Each
deduction token assigned by you to a group member will cost you one token

45
and will decrease the earnings of that group member by 3 tokens. If you do not
want to change the earnings of a member of your group, enter zero in the
corresponding box.
You can assign a maximum of 5 deduction tokens to any group member. The
maximum number of deduction tokens you can assign to all members of the
group in total is 15 tokens OR your (Stage 2 earnings – 1 token), whichever is
lower.
Your total earnings in each round
If in Stage 1 you choose to make decisions in stage 3:
Your earnings in the round = Earnings from Stage 2
- 1 token
- Total number of deduction tokens used by you
- 3 × Total number of deductions tokens assigned to you by other group members
If in Stage 1 you choose NOT to make decisions in stage 3:
Your earnings in the round = Earnings from Stage 2
- 3 × Total number of deductions tokens assigned to you by other group members
After all participants have made their decisions in the second decision stage,
you will be informed of the total number of deduction tokens received by you
and of your earnings in the round. You will not be informed of who assigned
deduction tokens to you.

46
The same process will be repeated for a total of 20 rounds. Your earnings from
earlier rounds cannot be used in the following rounds. You will receive a new
endowment of 20 tokens in each round.
Notice that your total calculated earnings in tokens at the end of a decision
round can be negative if the costs from assigned and received deduction
tokens exceed your earnings from the first stage. If your cumulative earnings
from all 20 rounds at the end of the experiment are negative, the computer will
automatically record zero earnings for you from the experiment. Thus, while
your earnings from any particular round can be negative, your earnings from
the experiment CANNOT be negative.
Questions to help you better understand the decision tasks
When everyone has finished reading the instructions, and before the
experiment begins, we will ask you a few questions regarding the decisions
you will make in the experiment. The questions will help you understand the
calculation of your earnings and ensure that you have understood the
instructions.
Please answer these questions on your computer terminal. Please type your
answer in the box next to the corresponding question. Once everyone has
answered all questions correctly we will begin the experiment.

47
APPENDIX B. The effect of a non-negligible participation fee
In CTP1, the participation fee of one token is negligible Nevertheless, it is still
positive. Thus, CTP1 allows us to test if the mere presence of a positive price
impacts behaviour and efficiency. The results discussed above show that when
subjects have to pay to acquire the punishment technology, the sanctioning
institution is provided to a significantly lower extent. Moreover, the use of the
institution and group outcomes are very different. The experiments discussed
in this section examine the extent to which the impact of requiring a positive
price to provide the sanctioning institution varies with the magnitude of the
price. In a new treatment (CTP5), the participation fee was raised to 5 tokens,
one-quarter of a subject’s per-round endowment. All other details were
identical to those in CTP1.
Three sessions of CTP5 were conducted at EssexLab, each lasting
approximately 55 minutes. The average earnings of a subject in this treatment
was £12 including a £2.50 show-up fee. Data were collected on 11
independent groups.
Figure 8 presents the mean number of members providing the sanctioning
institution across rounds in CTP1 and CTP5. As an additional reference, the
figure also presents the information for CTP0. As shown, the monotonicity
argument continues to hold; participation in the punishment stage steadily
declines as the cost of participation rises. The mean number of providers in a
round in CTP5 was 0.36 (st. dev. = 0.24). Based on an MW test, this is
significantly lower than the average of 1.6 participants in CTP1 (p = 0.0005).
Figure 8. Mean number of participants in the punishment stage – CTP
treatments

48
Based on MW tests, the following conclusions can be drawn. As a result of the
low rates of providing the sanctioning institution, the average punishment used
by a group in a round was also significantly lower in CTP5 than in CTP1 (2.42
vs. 5.35, p = 0.0238). However, mean individual punishment by providers in
CTP5 was significantly higher than in CTP1 (5.55 vs. 3.26, p = 0.0051) and in
CTP0 (5.55 vs. 2.16, p = 0.0001). Finally, as in CTP1, the punishment of
individuals with negative deviations from the group’s average contribution are
crowded out by punishment of those with positive deviations in CTP5. While
individuals with negative deviations from the group average were punished
more often than were those with non-negative deviations (in 17% of the
instances vs 15%), this difference is not significant (p = 0.9292). Conditional
on receiving any punishment, those with negative deviations received 3.9
tokens while those with non-negative deviations received 3.66 tokens in
punishment. Once again, this difference is not significant (p = 0.7221).30
Figures 9 (a) and (b) show, respectively, the mean group contributions and
mean group earnings over time in both treatments. As shown, the patterns of
contributions and earnings are quite similar across decision rounds. The mean 30 See Figure 4 for the corresponding values for CTP1. The unit of observation is the difference in average (over all rounds) punishment, or frequency of punishment, received by those with negative deviations and those with non-negative deviations in each group. n = 11 for both tests.
01
23
4
0 5 10 15 20Round
CTP0 CTP1 CTP5

49
per-round group contribution and group earnings in CTP5 were 40.10 tokens
and 108.16 tokens respectively (the corresponding standard deviations were
19.01 and 23.73). Neither of these is significantly different from those
observed in CTP1.31
Figure 9. Mean Group Contributions and Earnings in CTP1 and CTP5
The results from CTP5 lend support to the overall robustness of the effect of a
positive price for providing the sanctioning institution. In particular, patterns
in contribution, participation and aggregate punishment decisions closely
mirror those observed in CTP1. Further, they also support Hypothesis 3 that an
increase in the acquisition cost increases “per-capita” punishment by
providers.
31 For the corresponding values in CTP1, see Table 2. As before, Mann-Whitney tests are used to compare contributions and earnings between treatments. The unit of observation is the mean (over all 20 rounds) per-round group contribution or earning for each group in a treatment. Thus, n = 13 in CTP1 and n = 11 in CTP5.
0
20
40
60
80
0 5 10 15 20
(a) Group Contributions
80
100
120
140
160
0 5 10 15 20
(b) Group Earnings
Toke
ns
Round
CTP1 CTP5


