
Chemical Engineering
Iranian Journal of Oil & Gas Science and Technology, Vol. 6 (2017), No. 2, pp. 46-60
http://ijogst.put.ac.ir
An Evaluation of Four Electrolyte Models for the Prediction of
Thermodynamic Properties of Aqueous Electrolyte Solutions
Kamalodin Momeni1, Seyed Hesam Najibi
2*, and Mohammad Thaghi Sadeghi
3
1 Ph.D. Candidate, Department of Gas Engineering, Petroleum University of Technology, Ahwaz, Iran
2 Professor, Department of Gas Engineering, Petroleum University of Technology, Ahwaz, Iran
3 Associate Professor, Department of Chemical Engineering, Iran University of Science and Technology,
Tehran, Iran
Received: June 28, 2015; revised: October 24, 2015; accepted: November 08, 2015
Abstract
In this work, the performance of four electrolyte models for the prediction of the osmotic and activity
coefficients of different aqueous salt solutions at a temperature of 298 K, at atmospheric pressure, and
in a wide range of concentrations is evaluated. In two of these models, namely electrolyte non-random
two-liquid (e-NRTL) and mean spherical approximation non-random two-liquid (MSA-NRTL), the
association between ions of the opposite charges for simplification purposes is ignored, but in the
other two ones, namely associative mean spherical approximation non-random two-liquid (AMSA-
NRTL) and binding mean spherical approximation (BiMSA), association and solvation effects are
considered. The predictions of these four models for the osmotic and activity coefficients of
electrolyte solutions at a temperature of 298 K and at atmospheric pressure are compared with the
experimental data reported in the literature. This comparison is performed for 28 different aqueous
salt solutions, including thio-cyanates, perchlorates, nitrates, hydroxides, quaternary ammonium salts,
and others. The results show that the performance of the models which consider association effects is
better than the others, especially for higher salt concentrations. However, the best performance
belongs to the BiMSA model, which has some parameters with physical meaning.
Keywords: Electrolyte Models, Osmotic Coefficient, Activity Coefficient, Thermodynamic
Properties
1. Introduction
The reliable prediction of thermodynamic properties of electrolyte solutions is crucial in design and
operation of oil and gas production and processing facilities. Vapor-liquid phase equilibria simulation
is the most important process which needs reliable thermodynamic properties of aqueous electrolyte
solutions. Formation water produced with oil and gas contains dissolved salts, which makes the
vapor-liquid phase equilibria simulation for hydrocarbon systems in the presence of aqueous
electrolyte solutions be a practical case. Therefore, it is needed to have accurate and reliable
theoretical models for the predictions of thermodynamic properties of aqueous electrolyte solutions
* Corresponding Author:
Email: [email protected]

K. Momeni et al. / An Evaluation of Four Electrolyte Models … 47
(Najibi et al., 2015). Different models have been developed and presented so far in the literature
(Loehe and Donohue, 1997; Rafael et al., 1994), but semi-empirical and theoretical models developed
based on mean spherical approximation theory have received more attention in recent years (Bernard
and Blum, 1996; Chen et al., 1982; Papaiconomou et al., 2002; Simonin et al., 2006). The challenge
facing these models is the validity of the results for a wide range of salt concentrations in the aqueous
electrolyte solutions.
Four of the important models developed in this context are e-NRTL proposed by Chen et al. (1982);
MSA-NRTL proposed by Papaiconomou et al. (2002); AMSA-NRTL proposed by Simonin et al.
(2006); and BiMSA proposed by Bernard and Blum (1996). In the first two models, the main
simplifying assumption is that no association of ions of opposite charges will take place in the
aqueous electrolyte solution. In this work, these four models are used to predict the osmotic and
activity coefficients of different aqueous electrolyte solutions, and the results are compared.
2. Electrolyte models
The e-NRTL and MSA-NRTL models are developed based on this assumption that the salt is
completely dissolved in the liquid phase and dissociates into its forming ions, and no ion pairing takes
place in the liquid phase. The dissociation reaction can be written as follows:
aq aqAC
C A
zz
v v C AC A v C v C
(1)
where, νi is the stoichiometric valence of the ions making the salt. The e-NRTL model provides an
expression for the excess Gibbs molar energy of electrolyte systems, which is assumed to be the sum
of two terms
Ge-NRTL = GPDH + GNRTL (2)
where, the effect of long-range electrostatic interactions is described using the Pitzer-Debye-Hückel
(PDH), and short-range interactions are described using the classic NRTL for all the species (ions and
molecules) in the solution. Main assumption made in the classical e-NRTL is that the number of
cations surrounding a central solvent molecule is the same as the number of anions surrounding it, i.e.
local electro neutrality assumption. With this simplification, this model has three basic parameters
which need to be adjusted using experimental data. These parameters are the non-randomness factor
C A and the dimensionless energetic interaction parameters, i.e.
,C A W and
,W C A . The non-
randomness factor in this model is often set to a fixed value of 0.2 (Chen et al., 1982). In this model, it
is assumed that CW= AW (denoted by CA,W) and WC,AC= WA,CA (denoted by W,CA). More details of the
model are described elsewhere (Chen et al., 1982; Chen and Evans, 1986).
The MSA-NRTL model is a combination of the MSA model with the classic NRTL model
(Papaiconomou et al., 2002). The latter is used to take into account the short-range interactions, but
the former describes the long-range electrostatic interactions. The MSA model can yield analytic
expressions in terms of parameters, such as ion size and permittivity, which have physical meaning. In
the MSA-NRTL approach, the molal activity coefficient for each component is given by the following
expression:
M S A N R T Lln ln ln
i i i (3)

48 Iranian Journal of Oil & Gas Science and Technology, Vol. 6 (2017), No. 2
where, M S A
lni
represents the MSA contribution, which has one adjustable parameter, i.e. (mean
ionic diameter), and N R T Lln
i is the NRTL interaction contribution and contains four adjustable
parameters, including ,C W
, ,A W
, and two concentration dependent parameters, i.e. 1
,W C A C and
2
,W C A C as follows:
1 2
, , ,W C A C W C A C W C A C Wτ τ τ x (4)
where, W
x is the mole fraction of water in solution. The non-randomness factor in this model is also
set to 0.2. The details of the model equations are described elsewhere (Papaiconomou et al., 2002).
The AMSA-NRTL model (Simonin et al., 2006) is a modified version of MSA-NRTL, which includes
ionic solvation and physical association for the ions present in the electrolyte solution. The inclusion
of ion pairing causes a better prediction of the thermodynamic properties of aqueous electrolyte
solutions. In this model, the hydration of ions is accounted by introducing a constant hydration
number which is independent of salt concentration, as used in the classical model of Robinson and
Stokes (Robinson and Stokes, 1959). Five adjustable parameters of this model are two dimensionless
interaction energy parameters (τCA,W, τWC,AC); hydration number (h); equilibrium constant of ion-pair
formation reaction (K); and mean ionic diameter (σ). These parameters are optimized by fitting the
data to experimental data. To reduce the total number of model parameters as much as possible, it is
assumed that:
,C W =
,A W =
,C A W (5)
, ,0
P W W P (6)
, , , , ,,
C P C W A P A W C A W (7)
h= hA + hC (8)
where, subscript P represents the molecular species in solution. Hydration numbers for cations and
anions are denoted as hC and hA respectively. The overall equation which describes this model is given
by:
1
1ln ln ln ln ln 1 ln 1
A A
W C
C C
v vhg a y v x vA x
v v v v
(9)
where, 1
y is defined as 11
W A Ay m M v v x h v h , and the fraction of the bounded ion (x) is
obtained by the following equation:
10
1
W C A C A
h
W A A ip W
m M v v x x g gx K
m M v v x h v h g a
(10)
where, gi is fugacity coefficients of ionic species in the model level, and C A
v v v is the total
stoichiometric number; m is molality of salt (mol.kg-1
), and MW stands for the molecular weight of
K. Momeni et al. / An Evaluation of Four Electrolyte Models … 49
water (18.0153 g·mol-1
). The detail description of this model is presented by Simonin and his co-
workers elsewhere (Simonin et al., 2006).
BiMSA model is developed based on the Wertheim formalism theory (Wertheim, 1988, 1987) and is
proposed by Bernard and Blum (1996). The parameters in this model have some physical meaning
from a microscopic point of view. The two important parameters are cation diameter (σC) and the
relative permittivity of the solution (ε), which, in this work, are chosen as a function of salt
concentration (CS) as follows:
0 1
C C C SC (11)
1 1
1W S
C
(12)
where, σC(0)
is the diameter of cation at an infinite dilution of salt, and σC(1)
is the concentration
dependent term of cation diameter; εW is the relative permittivity of the pure solvent and is calculated
using relation proposed by Uematsu and Frank (1980); β accounts for the variation of the permittivity
of solution against concentration. This model can predict the properties of very non-ideal salt
solutions up to high concentrations, and its detail description is presented elsewhere (Bernard and
Blum, 1996; Papaiconomou et al., 2012; Simonin et al., 1998).
3. Results and discussion
The experimental data for the osmotic and activity coefficients of 28 strong electrolyte aqueous
solutions at a temperature of 298 K, at atmospheric pressure, and in a wide range of salt
concentrations are gathered from literature. The model parameters are fitted to the gathered data using
a reliable technique which works based on genetic algorithm (GA) optimization method. This
technique allows finding the global optimum for all the parameters. In this method, the best
parameters for the selected models are found by minimizing the summation of differences between
the calculated and experimental values of the properties. For example, for the activity coefficients, the
following objective function is minimized:
1 ,ex p ,ex p,ca l
A A R D 1 0 0N
j
N j j j
(13)
All the minimizations are performed by using MATLAB software version R2011a. More details about
genetic algorithm technique used herein can be found in the literature (Alvarez et al., 2008).
The performance of four electrolyte models selected in this study is investigated by comparing the
calculated values with the data gathered from literature for the osmotic and activity coefficients of
various aqueous salt solutions (Bonner, 1981a, 1982; Bonner, 1981b; Hamer and Wu, 1972; Kálmán
and Schwabe, 1979; Lindenbaum and Boyd, 1964; Macaskill and Bates, 1986; Rard et al., 2003). All
calculations are performed for single aqueous solution up to the highest concentration for which data
are available at atmospheric pressure (0.1 MPa) and a temperature of 298 K. The fitted parameters
and average absolute relative deviation percent (AARD (%)) of the osmotic and mean activity
coefficients for the four electrolyte models selected in this work are shown in Tables 1 to 4. The
results presented in these tables show that the values of ,C A W
(,C W
and ,A W
in MSA-NRTL model)
for all the solutions are negative, which can be interpreted as the stronger the hydrated ion–solvent
interaction than the solvent–solvent interaction which are basically identical to those given by Chen et
50 Iranian Journal of Oil & Gas Science and Technology, Vol. 6 (2017), No. 2
al. (1982). Moreover, the values of ,W C A C
are positive for all the solutions, which means that the
hydrated cation/anion–solvent interaction is weaker than the hydrated cation–hydrated anion
interaction, and for all the solutions, except for some cases in AMSA-NRTL model, ,C A W
is much
smaller than ,W C A C
, i.e. ,C A W
≪ ,W C A C
.
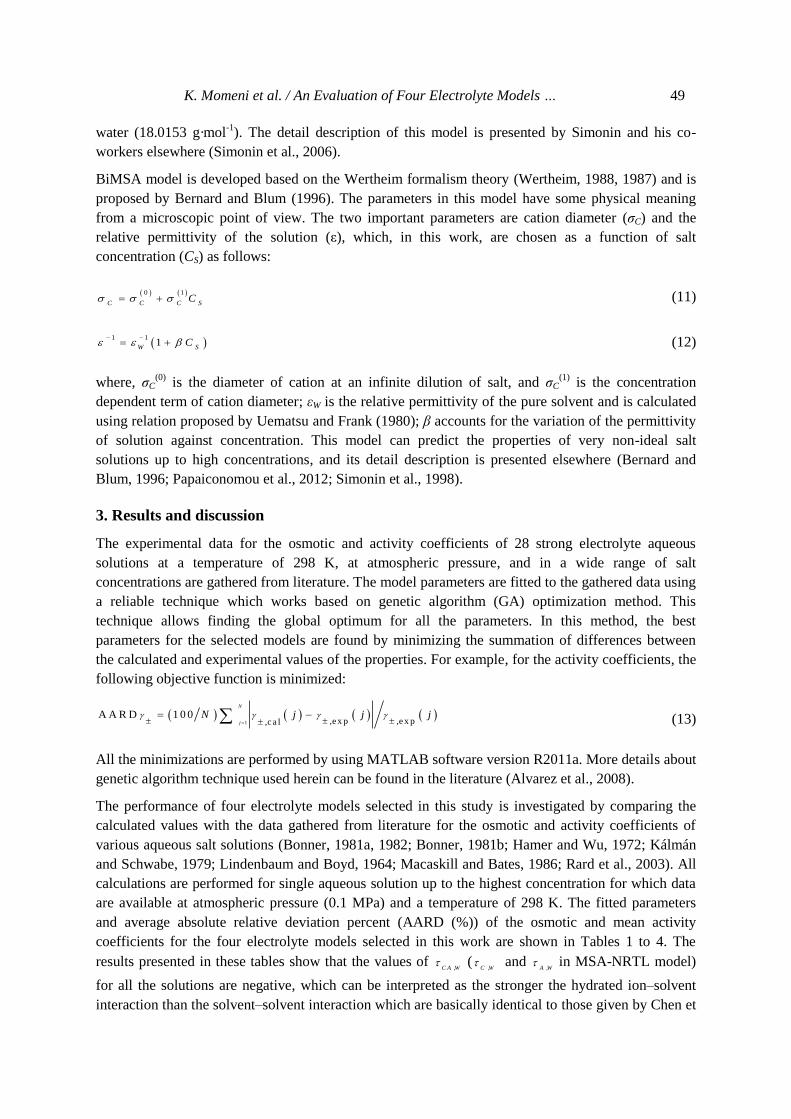
Figure 1
Osmotic coefficients calculated by e-NRTL versus those calculated by MSA-NRTL; the solid line is the 1:1
correspondence line; symbols are define as follows: (○) HCLO4; (□) KOH; (∆) Me4NBr; (◊) Et4NBr; and (*)
Bu4NBr.
For the first two models (e-NRTL and MSA-NRTL), which do not consider ion pairing, the total
AARD (%) of MSA-NRTL is slightly better than that of e-NRTL model. However, the MSA-NRTL
model has five fitting parameters, while e-NRTL needs two parameters to be fitted. Therefore, it can
be concluded that the predictive ability of the MSA-NRTL method is limited and has no special
priority to the e-NRTL model. The performance of e-NRTL model for the prediction of osmotic
coefficients of different single-salt aqueous solutions in the entire range of molality is compared with
the MSA-NRTL model in Figure 1. As shown in this figure, the predictions of these two models for
the osmotic coefficients of different single salt aqueous solutions are quite comparable.
0.4
0.6
0.8
1.0
1.2
1.4
1.6
1.8
2.0
2.2
2.4
0.4 0.6 0.8 1.0 1.2 1.4 1.6 1.8 2.0 2.2 2.4
MS
A-N
RT
L
e-NRTL

K. Momeni et al. / An Evaluation of Four Electrolyte Models … 51
Table 1
e-NRTL model parameters for a number of single electrolyte solutions and AARD (%) of its predictions for
osmotic and activity coefficients at T=298.15 K and P=0.1 MPa.
Electrolyte max m
(mol.kg-1
) W C , A C
τ C A ,W
τ AARDΦ
(%)a
AARDγ±
(%)b
LiBr 17 11.016 -5.545 12.35 26.68
LiCl 20 11.113 -5.524 8.921 20.04
LiOH 4.0 8.962 -4.388 1.259 1.706
LiNO3 20 9.705 -4.961 3.035 5.467
LiCH3SO3 5.5 8.565 -4.549 0.437 0.630
HClO4 16 10.96 -5.546 10.33 21.98
HNO3 28 9.320 -4.767 2.664 4.437
CsBr 5.0 8.468 -4.173 0.426 0.529
CsCl 9.0 8.454 -4.182 0.301 0.389
RbCl 7.8 8.247 -4.153 0.181 0.183
RbNO3 4.5 7.684 -3.454 0.659 0.686
KCl 5.0 8.085 -4.118 0.875 0.340
KF 17.5 9.856 -4.917 4.823 8.115
KOH 20 10.69 -5.349 8.296 17.83
NaClO4 6.0 7.977 -4.112 0.509 0.751
NaCF3SO3 5.4 6.498 -3.754 0.555 0.887
NaSCN 18 9.673 -4.902 3.209 5.531
Me4NBr 5.5 9.017 -4.303 1.241 1.364
Me4NCl 19 9.523 -4.670 2.575 3.591
Et4NBr 12 9.947 -4.653 1.355 1.679
Et4NCl 9.0 10.18 -4.993 2.121 3.813
Pr4NBr 9.0 10.367 -4.856 2.604 3.013
Pr4NCl 18 9.888 -4.992 3.610 6.271
Bu4NBr 10 8.186 -3.617 3.487 3.285
NH3MeCl 20 7.996 -4.059 0.978 1.511
NH3MeNO3 9.5 7.227 -3.530 0.332 0.324
NH2Me2ClO4 7.5 7.683 -3.530 1.704 2.132
NH4SCN 23.5 7.221 -3.712 0.900 2.113
Average 2.848 5.188
a cal exp exp
1
A A R D 100N
j
N j j j
, b
A A R D 1 0 0,ex p ,ex p1 ,ca l
NN j j j
j
,
where, N is the number of experimental data points.

52 Iranian Journal of Oil & Gas Science and Technology, Vol. 6 (2017), No. 2
Table 2
MSA-NRTL model parameters for a number of single electrolyte solutions and AARD (%) of its predictions for
osmotic and activity coefficients at T=298.15 K and P=0.1 MPa.
Electrolyte max m
(mol.kg-1
)
1
W C ,A Cτ
2
W C ,A Cτ C ,W
τ A ,W
τ σ
(Å)
AARDΦ
(%)a
AARDγ±
(%)b
LiBr 17 13.76 -2.383 14.12 -6.792 7.999 7.804 20.97
LiCl 20 11.186 0 -5.477 -5.465 10.00 8.196 18.16
LiOH 4.0 3.775 -0.086 -1.669 -3.162 1.147 0.071 0.051
LiNO3 20 15.18 -4.791 -5.469 -5.057 4.45 0.939 38.03
LiCH3SO3 5.5 9.209 0 -4.254 -4.953 5.136 0.253 0.244
HClO4 16 11.20 0 -5.526 -5.538 9.999 9.550 20.32
HNO3 28 9.560 -0.039 -4.731 -4.729 9.999 1.757 2.495
CsBr 5.0 6.380 0 -4.952 -2.393 3.639 0.613 0.248
CsCl 9.0 9.304 -0.400 -4.386 -4.391 4.171 0.534 0.480
RbCl 7.8 8.200 0 -0.100 -4.973 4.031 0.252 0.315
RbNO3 4.5 7.313 0 -1.685 -3.681 3.096 0.256 0.389
KCl 5.0 8.780 0 -3.195 -4.777 4.545 0.819 0.272
KF 17.5 10.19 -0.039 -4.935 -4.900 9.999 4.134 6.329
KOH 20 11.01 -0.003 -5.375 -5.364 9.999 7.704 16.10
NaClO4 6.0 8.029 0 -4.478 -3.893 5.309 0.265 0.272
NaCF3SO3 5.4 8.048 0 -3.263 -4.626 5.688 0.348 0.147
NaSCN 18 9.850 0 -4.908 -4.823 9.999 2.427 3.537
Me4NBr 5.5 5.490 0.576 -1.203 -3.377 2.408 0.604 0.776
Me4NCl 19 9.604 0 -4.734 -4.598 5.543 2.505 3.264
Et4NBr 12 5.874 0.520 -3.489 -2.729 3.027 1.551 1.612
Et4NCl 9.0 10.346 -0.003 -4.992 -4.997 5.559 1.998 3.561
Pr4NBr 9.0 4.361 0.132 -4.237 -0.613 4.000 1.789 2.081
Pr4NCl 18 6.518 0 -6.139 -2.232 1.551 3.460 2.843
Bu4NBr 10 5.109 0.347 -2.224 -2.224 3.241 3.155 3.155
NH3MeCl 20 5.705 0 -4.961 -2.068 3.506 1.387 0.332
NH3MeNO3 9.5 5.829 0 -4.202 -2.235 4.158 1.294 0.343
NH2Me2ClO4 7.5 7.200 0 -2.421 -3.598 2.817 0.664 2.512
NH4SCN 23.5 6.178 0 -4.424 -2.486 7.117 0.701 0.904
Average 2.322 5.347
a cal exp exp
1
A A R D 100N
j
N j j j
, b
A A R D 1 0 0,ex p ,ex p1 ,ca l
NN j j j
j
,
where, N is the number of experimental data points.

K. Momeni et al. / An Evaluation of Four Electrolyte Models … 53
Table 3
AMSA-NRTL model parameters for a number of single electrolyte solutions and AARD (%) of its predictions
for osmotic and activity coefficients at T=298.15 K and P=0.1 MPa.
Electrolyte max m
(mol.kg-1
) W C , A C
τ C A ,W
τ σ
(Å) h
K
(L.mol-1
) AARDΦ
(%)a
AARDγ±
(%)b
LiBr 17 0.001 -1.595 3.310 3.012 0 1.363 3.743
LiCl 20 0.601 -1.469 3.886 2.987 0 1.201 2.799
LiOH 4.0 3.144 -1.960 1.491 2.000 0.071 0.347 0.206
LiNO3 20 0.558 -1.332 4.723 1.875 0.0002 0.348 0.165
LiCH3SO3 5.5 3.129 -1.777 5.163 4.398 0.013 0.217 0.275
HClO4 16 0.382 -1.567 3.810 3.468 0 1.224 2.708
HNO3 28 3.391 -1.715 5.772 5.160 0.028 0.390 0.570
CsBr 5.0 5.506 -2.666 3.902 2.670 0.208 0.098 0.105
CsCl 9.0 0.214 -0.274 2.831 2.124 0 1.581 0.691
RbCl 7.8 0.527 -0.013 3.705 3.207 0.072 0.149 0.133
RbNO3 4.5 4.659 -1.793 3.942 1.882 0.279 0.192 0.137
KCl 5.0 0.527 -0.010 4.106 2.981 0.021 0.771 0.194
KF 17.5 0.257 -0.715 3.802 2.660 0.001 0.361 0.501
KOH 20 0.169 -1.463 3.248 2.489 0 0.525 1.216
NaClO4 6.0 0.669 -0.010 4.712 3.301 0.019 0.277 0.138
NaCF3SO3 5.4 0.118 -0.820 6.693 3.266 0.040 0.299 0.403
NaSCN 18 0.541 -0.728 5.391 3.011 0.002 0.439 0.503
Me4NBr 5.5 5.455 -2.331 4.973 7.857 1.000 0.565 0.750
Me4NCl 19 0.875 -0.806 2.016 2.570 0.004 2.634 1.150
Et4NBr 12 6.184 -2.797 2.481 2.611 0.068 1.782 1.555
Et4NCl 9.0 0.198 -0.010 1.774 4.991 0.007 2.652 0.941
Pr4NBr 9.0 7.017 -2.978 4.700 11.34 1.224 1.355 1.235
Pr4NCl 18 2.583 -1.999 1.043 3.163 0.002 3.582 3.598
Bu4NBr 10 5.610 -2.040 8.00 2.160 2.710 3.540 1.170
NH3MeCl 20 0.803 -0.541 3.309 2.901 0.089 0.340 0.238
NH3MeNO3 9.5 1.043 -0.010 4.611 1.369 0.316 0.293 0.244
NH2Me2ClO4 7.5 4.085 -1.603 4.771 1.129 0.752 0.347 0.359
NH4SCN 23.5 0.510 -0.010 6.186 2.453 0.169 0.976 0.653
Average 0.997 0.942
a cal exp exp
1
A A R D 100N
j
N j j j
, b
A A R D 1 0 0,ex p ,ex p1 ,ca l
NN j j j
j
,
where, N is the number of experimental data points.

54 Iranian Journal of Oil & Gas Science and Technology, Vol. 6 (2017), No. 2
Table 4
BiMSA model parameters for a number of single electrolyte solutions and AARD (%) of its predictions for
osmotic and activity coefficients at T=298.15 K and P=0.1 MPa.
Electrolyte Max m
(mol.kg-1
)
0
Cσ
(Å)
1
Cσ
(Å.L.mol-1
)
(L.mol-1
)
K
(L.mol-1
)
AARDΦ
(%)a
AARDγ±
(%)b
LiBr 17 4.900 -0.066 0.0001 0.240 0.739 2.301
LiCl 20 4.900 -0.069 0.0001 0.145 1.435 3.306
LiOH 4.0 4.900 -0.104 0.048 1.266 0.236 0.117
LiNO3 20 4.900 -0.074 0.061 0.025 0.504 0.947
LiCH3SO3 5.5 4.900 -0.266 0.127 0.531 0.574 0.138
HClO4 16 5.100 -0.103 0.060 0.347 0.754 2.407
HNO3 28 5.100 -0.076 0.110 0.065 1.488 2.652
CsBr 5.0 5.100 -0.032 0.054 0.667 0.336 0.295
CsCl 9.0 3.842 -0.058 0.092 0.852 0.935 0.421
RbCl 7.8 3.561 -0.025 0.036 0.252 0.176 0.182
RbNO3 4.5 3.561 -0.0003 0.112 0.910 0.375 0.352
KCl 5.0 4.700 -0.064 0.102 0.428 0.737 0.097
KF 17.5 4.700 -0.042 0.033 0.237 0.701 1.202
KOH 20 4.700 -0.040 0.003 0.000 0.375 0.740
NaClO4 6.0 3.550 -0.078 0.102 0.217 0.165 0.123
NaCF3SO3 5.4 3.550 -0.391 0.093 0.196 0.359 0.407
NaSCN 18 5.382 -0.142 0.179 0.439 0.831 1.293
Me4NBr 5.5 5.470 -0.061 0.150 1.531 0.807 0.877
Me4NCl 19 5.470 -0.022 0.075 1.124 0.622 0.921
Et4NBr 12 6.725 -0.050 0.413 2.000 0.778 0.865
Et4NCl 9.0 6.725 -0.013 0.246 1.193 0.670 1.231
Pr4NBr 9.0 8.610 -0.328 0.814 3.350 0.960 0.394
Pr4NCl 18 8.610 -0.286 0.472 2.331 1.187 1.919
Bu4NBr 10 8.292 -0.364 0.677 2.722 4.163 2.429
NH3MeCl 20 4.530 -0.084 0.039 0.594 0.825 0.261
NH3MeNO3 9.5 3.903 -0.030 0.069 0.326 0.422 0.410
NH2Me2ClO4 7.5 3.611 -0.052 0.102 1.072 0.348 0.446
NH4SCN 23.5 3.455 -0.083 0.092 0.061 1.234 1.722
Average 0.812 1.016
a cal exp exp
1
A A R D 100N
j
N j j j
, b
A A R D 1 0 0,ex p ,ex p1 ,ca l
NN j j j
j
,
where, N is the number of experimental data points.

K. Momeni et al. / An Evaluation of Four Electrolyte Models … 55
The results shown in Tables 1 to 4 reveal that the consideration of ion pairing increases the accuracy
of the model, especially at higher concentrations of salt. The accuracy of the four models for the
prediction of mean activity coefficients of KOH and Me4NCl single salt aqueous solutions are
compared versus experimental data in Figures 2 and 3 respectively. As shown in these figures, the
accuracy of e-NRTL and MSA-NRTL models considerably decreases at higher concentrations of salt
solutions.
Figure 2
Mean activity coefficients (γ±) calculated for aqueous KOH solution using the (♦) e-NRTL, (▲) MSA-NRTL,
(■) AMSA-NRTL, and (●) BiMSA models; the experimental values are from Hamer and Wu, (1972) and
Lindenbaum and Boyd (1964).
Figure 3
Mean activity coefficients (γ±) calculated for aqueous Me4NCl solution using the (♦) e-NRTL, (▲) MSA-
NRTL, (■) AMSA-NRTL, and (●) BiMSA models; the experimental values are from Hamer and Wu (1972) and
Lindenbaum and Boyd (1964).
0
5
10
15
20
25
30
35
40
45
50
0 10 20 30 40 50
Ca
lcu
late
d γ
±
Experimental γ±
0.4
0.5
0.6
0.7
0.8
0.9
1.0
1.1
1.2
1.3
1.4
1.5
1.6
1.7
0.4 0.5 0.6 0.7 0.8 0.9 1.0 1.1 1.2 1.3 1.4 1.5 1.6 1.7
Ca
lcu
late
d γ
±
Experimental γ±

56 Iranian Journal of Oil & Gas Science and Technology, Vol. 6 (2017), No. 2
In order to demonstrate the capability of AMSA-NRTL model to predict the thermodynamic
properties of electrolyte solutions, salting out effect of Bu4NBr in a CO2+water system is considered
in this work. As discussed by Lin et al. (2008), the solubility of carbon dioxide in the presence of
Bu4NBr drops. This salting out effect is shown in Figure 4. The interaction parameters between CO2
and water for these predictions are taken from Hou et al. (2013). The solubility data of carbon dioxide
in pure water is predicted by Peng-Robinson equation of state (Melhem et al., 1989), and for the
solution with a mass fraction of 0.09 Bu4NB, solubility is predicted using AMSA-NRTL model. It is
observed that the model results are in satisfactory agreement with the experimental data.
Figure 4
Carbon dioxide solubility versus pressure at a temperature of 283.15 K; symbols represent experimental data
from literature: (●), pure water (Houghton et al., 1957); (■), 0.09 mass fraction Bu4NBr (Lin et al., 2008); solid
line (──) shows PR-EOS prediction for pure water, and dash line (----) denotes AMSA-NRTL model
predictions for the electrolyte solution.
BiMSA is a model based on the Wertheim formalism theory (Wertheim, 1988, 1987) with considering
ion pairing of unlike hydrated ions and chemical association. The capability of this model to predict
the osmotic and activity coefficients of different aqueous salt solutions is reported in Table 4, and it is
plotted in Figure 5 for some cases. Four adjustable parameters of this model, including 0
C , 1
C , ,
and K are fitted using activity coefficients data found in literature for these solutions. The values
obtained for these parameters in this work are very close to the values reported in the literature
(Marcus, 2008; Wright, 2007). The positive value found for is in accordance with the observation
that solution permittivity decreases by increasing salt concentration. The results show that, among the
four investigated models in this study, the BiMSA model can predict the osmotic and activity
coefficients of different aqueous salt solutions better than the others.
0.000
0.002
0.004
0.006
0.008
0.010
0.012
0.014
0.016
0.018
0.020
0.00 0.50 1.00 1.50 2.00 2.50
XC
O2
P (MPa)

K. Momeni et al. / An Evaluation of Four Electrolyte Models … 57
Figure 5
Predictions of the BiMSA model for (a) mean activity coefficient and (b) osmotic coefficient at a temperature of
298.15 K as a function of concentration; symbols represent experimental data: (●), KF(Hamer and Wu, 1972);
(■), NH3MeCl (Macaskill and Bates, 1986); (♦), Pr4NBr (Lindenbaum and Boyd, 1964); (▲), HNO3 (Hamer
and Wu, 1972); solid line (—), model prediction.
0.0
0.5
1.0
1.5
2.0
2.5
3.0
3.5
4.0
4.5
0 5 10 15 20 25 30
γ ±
m (mol.kg-1)
a)
0.8
1.0
1.2
1.4
1.6
1.8
2.0
2.2
0 5 10 15 20 25 30
Ф
m (mol.kg-1)
b)

58 Iranian Journal of Oil & Gas Science and Technology, Vol. 6 (2017), No. 2
4. Conclusions
Electrolyte models are widely used for modelling or predicting the thermodynamic behavior of
chemical mixtures. In this work, the ability of four electrolyte models, including e-NRTL, MSA-
NRTL, AMSA-NRTL, and BiMSA to predict the properties of different aqueous electrolyte solutions
in a wide range of concentrations is comprehensively evaluated. Literature data for osmotic and
activity coefficients of different solutions are used for these evaluations. The results indicate that
models which do not consider association between ions present in the solution have relatively large
errors, especially at higher concentrations of dissolved salt. The results also denote that both AMSA-
NRTL and BiMSA models can accurately predict the experimental data of osmotic and activity
coefficients of different electrolyte solutions. However, the BiMSA model, in comparison to the
AMSA-NRTL model, requires lower number of adjustable parameters, and its parameters have
physical meaning. Therefore, it can be concluded that among the four electrolyte models investigated
for the prediction of 28 systems in this work, the BiMSA model presents the best performance. The
average values of AARD (%) of the BiMSA model in the prediction of osmotic and activity
coefficients of different systems investigated in this work are 0.856 and 1.016 respectively. For a
further progress, it is recommended that the MSA terms be modified to the unrestricted primitive
model, which leads to a more precise description of salt effects at low concentrations. Finally, the
introduction of a hard sphere term could take the missing effect into account.
Nomenclature
A : Anion
C : Cation
K : Equilibrium constant
KB : Boltzmann constant
N : Number of data
P : Ion-pair assuming as neutral species
P : Pressure
S : Salt
T : Temperature
x : Unbound ion fraction
Greek Letter
: Non-randomness factor
: Concentration dependent parameter of permittivity
: Relative permittivity
: Osmotic coefficient
: Mean ionic activity coefficient in the molality scale
: Ionic diameter
: Dimensionless interaction energy parameter
v : Stoichiometric number
Subscript and Superscript
A : Anion
aq : Aqueous phase
C : Cation
i : Component i

K. Momeni et al. / An Evaluation of Four Electrolyte Models … 59
P : Molecular species
W : Water
Z : Ion charge
References
Alvarez, V. H., Larico, R., Ianos, Y., and Aznar, M., Parameter Estimation for VLE Calculation by
Global Minimization: the Genetic Algorithm, Brazilian Journal of Chemical Engineering, Vol.
25, p. 409-418, 2008.
Bernard, O. and Blum, L., Binding Mean Spherical Approximation for Pairing Ions: An Exponential
Approximation and Thermodynamics, Journal of Chemical Physics, Vol. 104, p. 4746-4754,
1996.
Bonner, O.D., Osmotic and Activity Coefficients of Methyl-substituted Ammonium Nitrates at 298.15
K, Journal of Chemical and Engineering Data, Vol. 26, p. 148-149, 1981a.
Bonner, O.D., Osmotic and Activity Coefficients of Methyl-substituted Ammonium Perchlorates at
298.15 K, Journal of Chemical and Engineering Data, Vol. 27, p. 62-64, 1982.
Bonner, O.D., Study of Methane sulfonates and Trifluoro methane sulfonates, Evidence for Hydrogen
Bonding to the Trifluoro Group, Journal of the American Chemical Society, Vol. 103, p. 3262-
3265, 1981b.
Chen, C.C., Britt, H. I., Boston, J. F., and Evans, L. B., Local Composition Model for Excess Gibbs
Energy of Electrolyte Systems, Part I: Single Solvent, Single Completely Dissociated
Electrolyte Systems, AICHE, Vol. 28, p. 588-596, 1982.
Chen, C.C. and Evans, L. B., A Local Composition Model for the Excess Gibbs Energy of Aqueous
Electrolyte Systems, AICHE, Vol. 32, p. 444-454, 1986.
Hamer, W. J. and Wu, Y. C., Osmotic Coefficients and Mean Activity Coefficients of Uni‐univalent
Electrolytes in Water at 25 °C, Journal of Physical and Chemical Reference Data, Vol. 1, p.
1047-1100, 1972.
Hou, S.X., Maitland, G. C., and Trusler, J. P. M., Measurement and Modeling of the Phase Behavior
Of The (Carbon Dioxide+Water) Mixture At Temperatures from 298.15 K To 448.15 K, Journal
of Supercritical Fluids, Vol. 73, p. 87-96, 2013.
Houghton, G., Mclean, A.M., and Ritchie, P.D., Compressibility, Fugacity, and Water-Solubility of
Carbon Dioxide in the Region 0–36 atm. and 0–100 °C, Chemical Engineering Science, Vol. 6,
p. 132-137, 1957.
Kálmán, E. and Schwabe, K., Osmotic and Activity Coefficients of Ammonium Thiocyanate in
Aqueous Solutions at 25 °C, Journal of Solution Chemistry, Vol. 8, p. 1-4, 1979.
Lin, W., Delahaye, A., and Fournaison, L., Phase Equilibrium and Dissociation Enthalpy for Semi-
Clathrate Hydrate of CO2+TBAB, Fluid Phase Equilibria, Vol. 264, p. 220-227, 2008.
Lindenbaum, S. and Boyd, G. E., Osmotic and Activity Coefficients for the Symmetrical Tetra alkyl
Ammonium Halides in Aqueous Solution at 25 °C, Journal of Physical Chemistry, Vol. 68, p.
911-917, 1964.
Loehe, J.R. and Donohue, M. D., Recent Advances in Modeling Thermodynamic Properties of
Aqueous Strong Electrolyte Systems, AICHE Journal, Vol. 43, p. 180-195, 1997.
Macaskill, J. B. and Bates, R., Osmotic and Activity Coefficients of Monomethyl-, Dimethyl-, and
Trimethyl Ammonium Chlorides at 25 °C, Journal Solution Chemistry, Vol. 15, p. 323-330,
1986.
Marcus, Y., Tetra alkyl Ammonium Ions in Aqueous and Non-aqueous Solutions, Journal of Solution
Chemistry, Vol. 37, p. 1071-1098, 2008.

60 Iranian Journal of Oil & Gas Science and Technology, Vol. 6 (2017), No. 2
Melhem, G. A., Saini, R., and Goodwin, B. M., A Modified Peng-Robinson Equation of State, Fluid
Phase Equilibria, Vol. 47, p. 189-237, 1989.
Najibi, H., Momeni, K., Sadeghi, M. T., and Mohammadi, A. H., Experimental Measurement and
Thermodynamic Modelling of Phase Equilibria of Semi-clathrate Hydrates of (CO2 + Tetra-n-
Butyl-Ammonium Bromide) Aqueous Solution, the Journal of Chemical Thermodynamics, Doi:
Http://Dx.Doi.Org/10.1016/J.Jct.2015.03.024, 2015. 2015.
Papaiconomou, N., Simonin, J.P., and Bernard, O., Solutions of Alkyl Ammonium and Bulky Anions:
Description of Osmotic Coefficients Within the Binding Mean Spherical Approximation,
Industrial Engineering Chemistry Research, Vol. 51, p. 9661-9668, 2012.
Papaiconomou, N., Simonin, J. P., Bernard, O., and Kunz, W., MSA-NRTL Model for the Description
of the Thermodynamic Properties of Electrolyte Solutions, Physical Chemistry Chemical
Physics, Vol. 4, p. 4435-4443, 2002.
Rafael, M., Berthold, J.W., Scrivner, N.C., and Grise, S.L., Models for Electrolyte Solutions, in: S.I.
Sandler (ed.), Models for Thermodynamic and Phase Equilibria Calculations, Marcel Dekker,
New York, 1994.
Rard, J.A., Palmer, D.A., and Albright, J.G., Isopiestic Determination of the Osmotic and Activity
Coefficients of Aqueous Sodium Trifluoro Methane Sulfonate at 298.15 K and 323.15 K, and
Representation with an Extended Ion-interaction (Pitzer) Model, Journal of Chemical and
Engineering Data, Vol. 48, p. 158-166, 2003.
Robinson, R.A. and Stokes, R.H., Electrolyte Solutions, 2nd
Edition, Butterworths, London, 1959.
Simonin, J.P., Bernard, O., and Blum, L., Real Ionic Solutions in the Mean Spherical Approximation.
3. Osmotic and Activity Coefficients for Associating Electrolytes in the Primitive Model,
Journal of Physical Chemistry B, Vol. 102, p. 4411-4417, 1998.
Simonin, J.P., Krebs, S., and Kunz, W., Inclusion of Ionic Hydration and Association in the MSA-
NRTL Model for a Description of the Thermodynamic Properties of Aqueous Ionic Solutions:
Application to Solutions of Associating Acids, Industrial Engineering Chemistry Research, Vol.
45, p. 4345-4354, 2006.
Uematsu, M. and Frank, E. U., Static Dielectric Constant of Water and Steam, Journal of Physical
Chemical Reference Data, Vol. 9, p. 1291-1306, 1980.
Wertheim, M.S., Factorization of the Direct Correlation Function. III. Integral Equations and
Thermodynamics, Journal of Chemical Physics, Vol. 88, p. 1214-1222, 1988.
Wertheim, M.S., Thermodynamic Perturbation Theory of Polymerization, Journal of Chemical
Physics, Vol. 87, p. 7323-7331, 1987.
Wright, M.R., An Introduction to Aqueous Electrolyte Solutions, John Wiley and Sons Ltd, the
Atrium, Southern Gate, Chichester, West Sussex PO19 8SQ, England, 2007.


