
i
AN EVALUATION OF DEEP EUTECTIC SOLVENTS
FOR CHARGE/DISCHARGE TESTS USING ALL-
VANADIUM REDOX COUPLES FOR FLOW BATTERIES
LALEH BAHADORI
THESIS SUBMITTED IN FULFILMENT OF THE
REQUIREMENTS FOR THE DEGREE OF DOCTOR OF
PHILOSOPHY
FACULTY OF ENGINEERING
UNIVERSITY OF MALAYA
KUALA LUMPUR
2015
i
UNIVERSITI MALAYA
ORIGINAL LITERARY WORK DECLARATION
Name of Candidate: Laleh Bahadori (Passport No: H95658880)
Registration/Matric No.: KHA100019
Name of Degree: Doctor of Philosophy (Ph.D.)
Title of Project Paper/Research Report/Dissertation/Thesis (“this Wrok”):
AN EVALUATION OF DEEP EUTECTIC SOLVENTS FOR
CHARGE/DISCHARGE TESTS USING ALL-VANADIUM REDOX COUPLES
FOR FLOW BATTERIES
Field of Study: Chemical Engineering
I do solemnly and sincerely declare that:
(1) I am the sole author/writer of this Work;
(2) This Work is original;
(3) Any use of any work in which copyright exists was done by way of fair dealing
and for permitted purposes and any excerpt or extract from, or reference to or
reproduction of any copyright work has been disclosed expressly and sufficiently
and the title of the work and its authorship have been acknowledged in this Work;
(4) I do not have any actual knowledge or ought I reasonably to know that the making
of this Work constitutes an infringement of any copyright work;
(5) I hereby assign all and every rights in the copyright to this Work to the University
of Malaya (―UM‖), who henceforth shall be owner of the copyright in this Work
and that any reproduction or use in any form or by any means whatsoever is
prohibited without the written consent of UM having been the first had and
obtained;
(6) I am fully aware that if in the course of making this Work I have infringed any
copyright whether intentionally or otherwise, I may be subject to legal action or
any other action as may be determined by UM.
Candidate’s Signature Date:
Subscribed and solemnly declared before,
Supervisors’s signature Date: Name:
Designation: Department of Chemical Engineering, Faculty of Engineering, University of Malaya, Kuala Lumpur, 50603, Malaysia Tel./Fax: +60 379675294/ +60 379675319

ii
iii
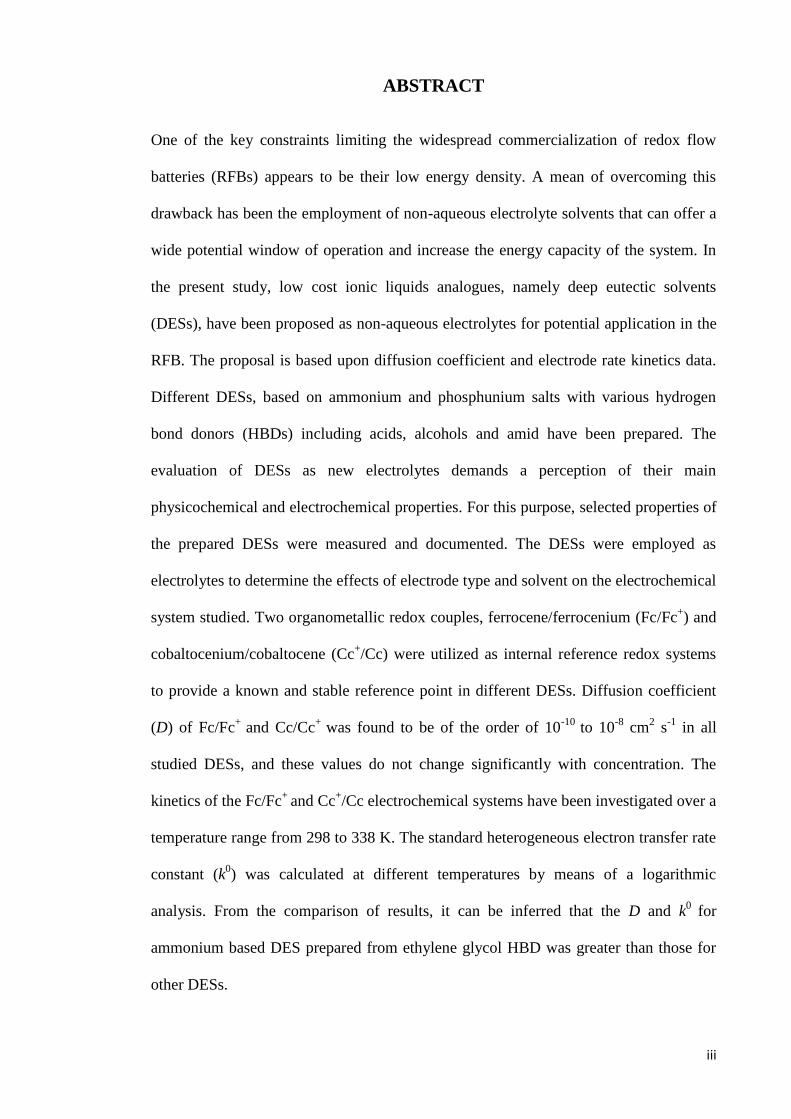
ABSTRACT
One of the key constraints limiting the widespread commercialization of redox flow
batteries (RFBs) appears to be their low energy density. A mean of overcoming this
drawback has been the employment of non-aqueous electrolyte solvents that can offer a
wide potential window of operation and increase the energy capacity of the system. In
the present study, low cost ionic liquids analogues, namely deep eutectic solvents
(DESs), have been proposed as non-aqueous electrolytes for potential application in the
RFB. The proposal is based upon diffusion coefficient and electrode rate kinetics data.
Different DESs, based on ammonium and phosphunium salts with various hydrogen
bond donors (HBDs) including acids, alcohols and amid have been prepared. The
evaluation of DESs as new electrolytes demands a perception of their main
physicochemical and electrochemical properties. For this purpose, selected properties of
the prepared DESs were measured and documented. The DESs were employed as
electrolytes to determine the effects of electrode type and solvent on the electrochemical
system studied. Two organometallic redox couples, ferrocene/ferrocenium (Fc/Fc+) and
cobaltocenium/cobaltocene (Cc+/Cc) were utilized as internal reference redox systems
to provide a known and stable reference point in different DESs. Diffusion coefficient
(D) of Fc/Fc+
and Cc/Cc+
was found to be of the order of 10-10
to 10-8
cm2 s
-1 in all
studied DESs, and these values do not change significantly with concentration. The
kinetics of the Fc/Fc+
and Cc+/Cc electrochemical systems have been investigated over a
temperature range from 298 to 338 K. The standard heterogeneous electron transfer rate
constant (k0) was calculated at different temperatures by means of a logarithmic
analysis. From the comparison of results, it can be inferred that the D and k0
for
ammonium based DES prepared from ethylene glycol HBD was greater than those for
other DESs.
iv
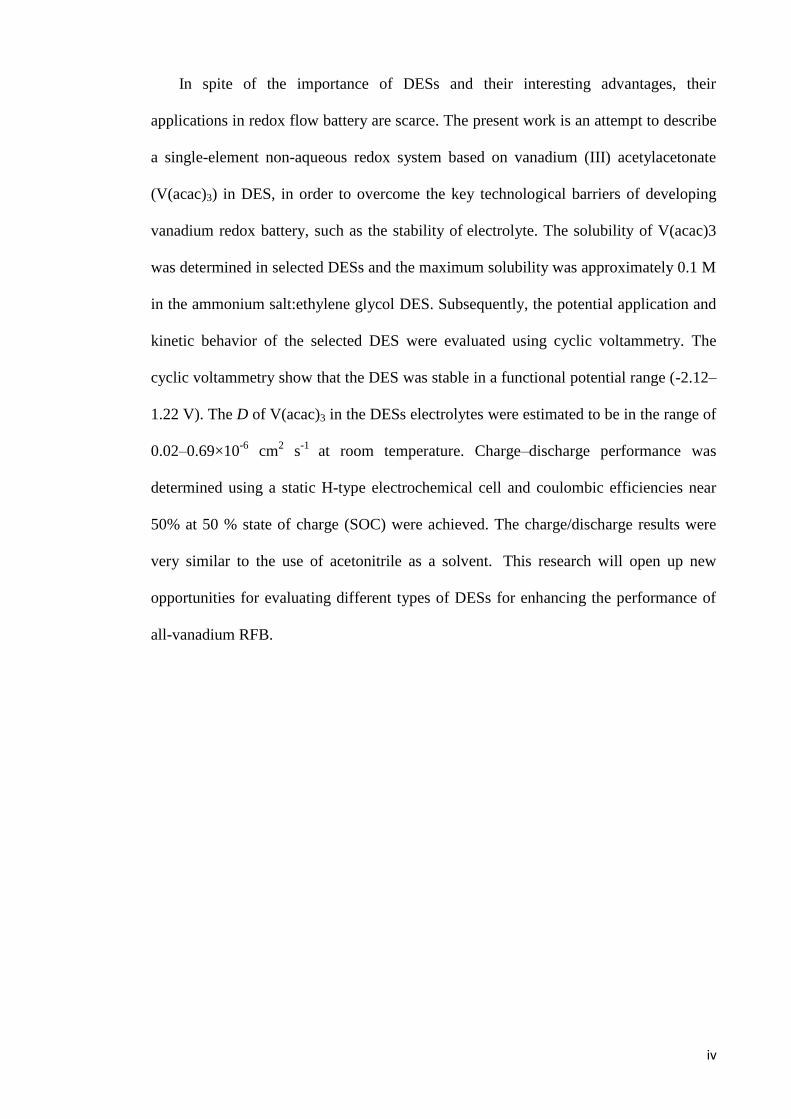
In spite of the importance of DESs and their interesting advantages, their
applications in redox flow battery are scarce. The present work is an attempt to describe
a single-element non-aqueous redox system based on vanadium (III) acetylacetonate
(V(acac)3) in DES, in order to overcome the key technological barriers of developing
vanadium redox battery, such as the stability of electrolyte. The solubility of V(acac)3
was determined in selected DESs and the maximum solubility was approximately 0.1 M
in the ammonium salt:ethylene glycol DES. Subsequently, the potential application and
kinetic behavior of the selected DES were evaluated using cyclic voltammetry. The
cyclic voltammetry show that the DES was stable in a functional potential range (-2.12–
1.22 V). The D of V(acac)3 in the DESs electrolytes were estimated to be in the range of
0.02–0.69×10⁻⁶
cm2 s
-1 at room temperature. Charge–discharge performance was
determined using a static H-type electrochemical cell and coulombic efficiencies near
50% at 50 % state of charge (SOC) were achieved. The charge/discharge results were
very similar to the use of acetonitrile as a solvent. This research will open up new
opportunities for evaluating different types of DESs for enhancing the performance of
all-vanadium RFB.
v
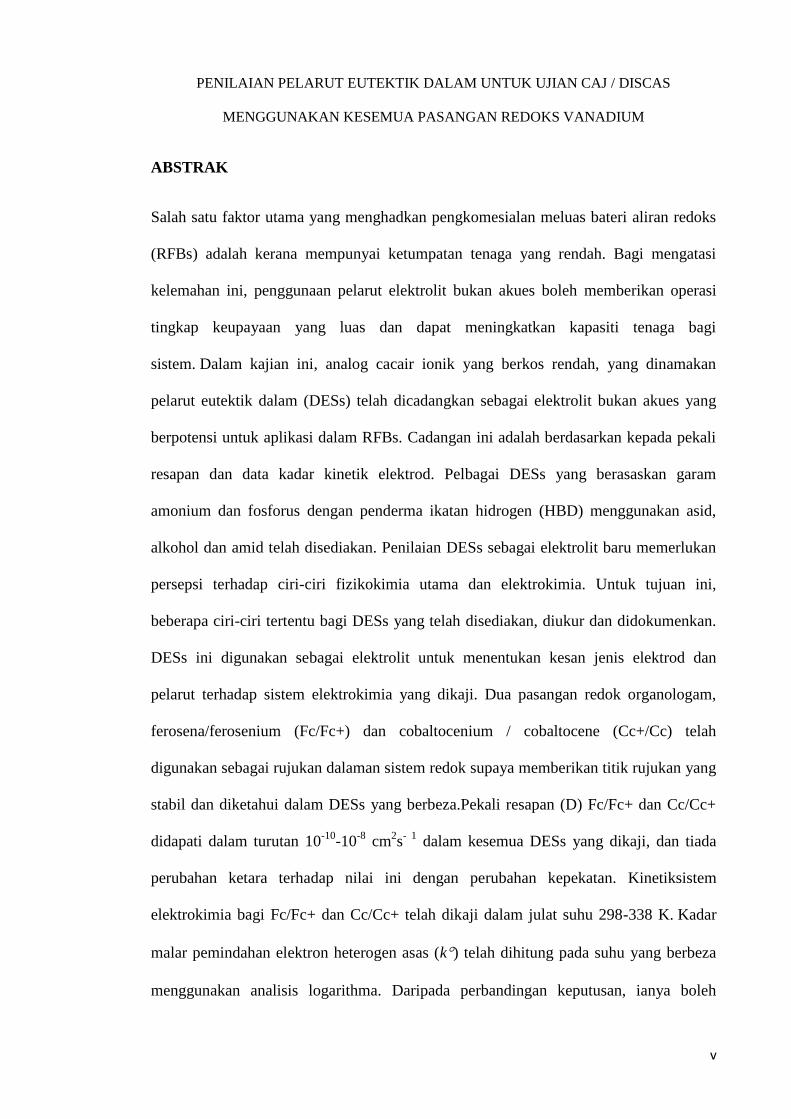
PENILAIAN PELARUT EUTEKTIK DALAM UNTUK UJIAN CAJ / DISCAS
MENGGUNAKAN KESEMUA PASANGAN REDOKS VANADIUM
ABSTRAK
Salah satu faktor utama yang menghadkan pengkomesialan meluas bateri aliran redoks
(RFBs) adalah kerana mempunyai ketumpatan tenaga yang rendah. Bagi mengatasi
kelemahan ini, penggunaan pelarut elektrolit bukan akues boleh memberikan operasi
tingkap keupayaan yang luas dan dapat meningkatkan kapasiti tenaga bagi
sistem. Dalam kajian ini, analog cacair ionik yang berkos rendah, yang dinamakan
pelarut eutektik dalam (DESs) telah dicadangkan sebagai elektrolit bukan akues yang
berpotensi untuk aplikasi dalam RFBs. Cadangan ini adalah berdasarkan kepada pekali
resapan dan data kadar kinetik elektrod. Pelbagai DESs yang berasaskan garam
amonium dan fosforus dengan penderma ikatan hidrogen (HBD) menggunakan asid,
alkohol dan amid telah disediakan. Penilaian DESs sebagai elektrolit baru memerlukan
persepsi terhadap ciri-ciri fizikokimia utama dan elektrokimia. Untuk tujuan ini,
beberapa ciri-ciri tertentu bagi DESs yang telah disediakan, diukur dan didokumenkan.
DESs ini digunakan sebagai elektrolit untuk menentukan kesan jenis elektrod dan
pelarut terhadap sistem elektrokimia yang dikaji. Dua pasangan redok organologam,
ferosena/ferosenium (Fc/Fc+) dan cobaltocenium / cobaltocene (Cc+/Cc) telah
digunakan sebagai rujukan dalaman sistem redok supaya memberikan titik rujukan yang
stabil dan diketahui dalam DESs yang berbeza.Pekali resapan (D) Fc/Fc+ dan Cc/Cc+
didapati dalam turutan 10-10
-10-8
cm2s
- 1 dalam kesemua DESs yang dikaji, dan tiada
perubahan ketara terhadap nilai ini dengan perubahan kepekatan. Kinetiksistem
elektrokimia bagi Fc/Fc+ dan Cc/Cc+ telah dikaji dalam julat suhu 298-338 K. Kadar
malar pemindahan elektron heterogen asas (k) telah dihitung pada suhu yang berbeza
menggunakan analisis logarithma. Daripada perbandingan keputusan, ianya boleh

vi
disimpulkan bahawa D dan k untuk DES berasaskan ammonium yang disediakan
daripada etilena glikol sebagai HBD adalah lebih besar daripada DESs yang lain.
Walaupun DESs berkepentingan dan mempunyai kelebihan yang menarik,
aplikasi pelarut ini dalam bateri aliran redok masih terhad. Kajian ini adalah percubaan
untuk menerangkan sistem redok bukan akues satu elemen berasakan vanadium (III)
acetylacetonate (V(acac)3) dalam DES, dalam usaha untuk menghadapi kekangan utama
teknologi pembangunan bateri redok vanadium, seperti kestabilan pelarut.
Kebolehlarutan V(acac)3 telah dilakukan dalam DESs terpilih dan keterlarutan
maksimum adalah sebanyak 0.1 M dalam eutektik garam ammonium : etilena glikol.
Seterusnya, aplikasi keupayaan dan ciri kinetik DES terpilih telah dinilai dengan
menggunakan kaedah siklik voltammetri. Siklik voltametrik ini menunjukkan DES
beroperasi dengan stabil pada keupayaan (-2.12–1.22 V). Pekali resapan bagi V(acac)3
dalam DES elektolit ini adalah dalam julat 0.02–0.69×10⁻⁶
cm2 s
-1 pada suhu bilik.
Prestasi caj-discaj telah ditentukan menggunakan sel elektrokimia jenis H statik dan
pencapaian kecekapan coulumbic menghampiri 50%. Keputusan caj/discaj adalah
hampir sama apabila acetonitril digunakan sebagai pelarut. Kajian ini akan membuka
peluang yang baru untuk menilai jenis DESs yang berbeza bagitujuan peningkatan
prestasi kesemua RFB vanadium.

vii
ACKNOWLEDGMENTS
I extend my immense gratitude to my supervisors; Prof. Dr. Mohd Ali Hashim, Dr
Mohammed Harun Chakrabarti, Assoc. Prof. Dr. Inas Muen AlNashef, Assoc. Prof. Dr.
Farouq Sabri Mjalli and Dr Ninie Suhana Abdul Manan for their incessant support,
guidance, constructive comments and encouragement.
A special thanks to all my friends and lab mates in the University of Malaya for their
helpfulness and friendship throughout.
Last but definitely not least, my deepest and most heart-felt gratitude to my beloved
mum, dad and brother for their endless love and supports.
viii
TABLE OF CONTENTS
TITLE PAGE……………………………………………………………………………..i
ORIGINAL LITERARY WORK DECLARATION FORM…………………………....ii
ABSTRACT…………………………………………………………………………….iii
ABSTRAK………………………………………………………………………….....…v
ACKNOWLEDGMENT……………………………………………………………….vii
TABLE OF CONTENTS…………………………………………………………...…viii
LIST OF FIGURES……………………………………………………………………xiii
LIST OF TABLES……………………………………………………………………...xv
LIST OF SYMBOLS AND ABBREVIATIONS……………………………………...xvi
NOMENCLATURE…………………………………………………………………..xvii
CHAPTER 1: INTRODUCTION……….………………………………………….....1
1.1 Overview ………………………………………………………………...................1
1.2 Research Objectives………………………………………………...…………...…5
1.3 Research Methodology……………………………………………………………..5
1.4 Thesis Outline……………………………………………………………………....6
CHAPTER 2: LITERATURE REVIEW……………………………………………..8
2.1 Renewable Energy…………………………………………………………………8
2.2 Introduction to Redox Flow Batteries……………………………………………..9
2.3 Vanadium System Overview……………………………………………………..13
2.3.1 The Principle of VRBs……………………………………………..........14
2.3.2 Why vanadium?....................................................................................... 16
2.4 Conventional Electrolytes Used in Redox Flow Batteries and Their Drawbacks.17
2.4.1 Aqueous Electrolytes……………………………………………………..17
2.4.2 Non-aqueous Systems…………………………………………………….22
ix
2.5 Introduction to ILs………………………………………………………………..25
2.5.1 Physical Properties of ILs………………………………………………...29
2.5.2 Applications of ILs in Electrochemical Engineering Based Processes…..33
2.5.2.1 Electrochemical applications of ILs in metal processing……….34
2.5.2.2 Destruction of halogenated hydrocarbons………………………35
2.5.2.3 Electrochemical energy storage application……………………36
2.5.2.4 Dye sensitized solar cells (DSSCs) for renewable
energy storage……………………………………………………………39
2.5.2.5 Applications of ionic liquids in redox flow batteries…………..39
2.6 Definition of DESs……………………………………………………………….42
2.6.1 Physical Properties of DESs……………………………………………...47
2.6.1.1 Melting Point (Freezing Point)………………………………...47
2.6.1.2 Density…………………………………………………………48
2.6.1.3 Viscosity………………………………………………………..49
2.6.1.4 Ionic conductivity……………………………………………...50
2.6.2 Feasibility of Using DES for RFB Applications………………………...51
2.7 Electrochemistry………………………………………………………………….53
2.7.1 Internal reference redox system…………………………………………..53
2.7.2 Reference electrodes……………………………………………………...54
CHAPTER 3: RESEARCH METHODOLOGY……………………………………56
3.1 Synthesis of DESs………………………………………………………………..56
3.1.1 Materials…………………………………………………………………..56
3.1.2 Synthetic Procedure………………………………………………………57
3.2 DESs Characterization……………………………………………………………58
3.2.1 Viscosity…………………………………………………………………59
3.2.2 Electrical Conductivity…………………………………………………..59
x
3.2.3 Melting temperature……………………………………………………….59
3.2.4 Density…………………………………………………………………….60
3.2.5 pH………………………………………………………………………...61
3.3 Electrochemical Experiments…………………………………………………….61
3.3.1 Electrochemical Cell……………………………………………………...61
3.3.2 Cyclic Voltammetry……………………………………………………...61
3.3.3 Chronoamperometic Experiments………………………………………..62
3.4 Measuring the solubility of Vanadium Acetylacetonate Compound in DESs…...62
3.5 Charge/discharge Experiment……………………………………………………..64
3.5.1 Instrumentation……………………………………………………………64
3.5.2 H-type cell………………………………………………………………...64
CHAPTER 4: RESULTS AND DISCUSSIONS…………………………………….67
4.1 Synthesis and Characterization of Different DESs……………………………….67
4.1.1 Density……………………………………………………………………68
4.1.2 Viscosity………………………………………………………………….71
4.1.3 Ionic and Molar Conductivity……………………………………………..75
4.1.4 pH…………………………………………………………………………82
4.2 Electrochemical Behaviour of Fc and Cc+ in DESs……………………………...84
4.2.1 Electrochemical Potential Window……………………………………….85
4.2.2 Cyclic Voltammetry for Oxidation of Fc and Reduction of Cc+ in Various
DESs………………………………………………………………………………91
4.2.3 Chronoamperometric Transients of Fc and Cc+ in DESs…………………96
4.2.4 The Heterogeneous Electron-transfer Rates for the Fc and Cc+ in DESs….97
4.2.5 Temperature Dependence of the Voltammetric Data, D and k0
for Fc/Fc+ and Cc
+/Cc in DESs…………………………………………………..99
4.2.6 Concentration Dependence of D of Fc/Fc+………………………………………………
107

xi
4.2.7 Stokes–Einstein Behaviour of Metallocene Derivatives………………...109
4.3 Electrochemical Behaviour of V(acac)3 in DESs……………………………….111
4.3.1 Voltammetry of Vanadium Electrolytes in DESs………………………..111
4.3.2 Kinetics of Electrode Reactions…………………………………………116
4.4 Charge/discharge Performance………………………………………………….123
CHAPTER 5: CONCLUSIONS
5.1 Summary and Conclusions……………………………………………………...127
5.2 Recommendations for Future Work…………………………………………….131
REFERENCES...……………………………………………………….…………...........132
LIST OF PUBLICATIONS AND PAPERS PRESENTED…………………………..155

xii
LIST OF FIGURES
Figure 2.1 General schematic of a redox flow battery. 11
Figure 2.2 The principle of VRB. 15
Figure 2.3 The main components of the VRB stacks. 16
Figure 2.4 Charging profile for 0.1 M ruthenium acetylacetonate and 1 M
TEABF4 in CH3CN at a current of 1 mA.
24
Figure 2.5 Phase diagram for urea-choline chloride (ChCl/U) system. 45
Figure 2.6 DES includes bulky cations and smaller anions attached to HBD. 46
Figure 3.1 Structures of the salts and hydrogen bond donors applied in this
study.
58
Figure 3.2 (a) The scheme of H-type glass cell battery; (b) Photograph of an
H-type charge/discharge cell.
65
Figure 4.1 Dependence of densities (ρ) on temperature for; (a) DESs based
on ammonium salts and polyol HBDs; (b) ammonium based salts
and acids, amine, amide, zinc nitrate HBDs; (c) phosphonium
based salts and polyol HBDs.
70
Figure 4.2 Dependence of viscosity (η) on temperature for; (a) DESs based
on ammonium salts and polyol HBDs; (b) ammonium based salts
and acids, amine, amide, zinc nitrate HBDs; (c) phosphonium
based salts and polyol HBDs.
72
Figure 4.3 Arrhenius plot of viscosity (η) for; (a) DESs based on
ammonium salts and polyol HBDs; (b) ammonium based
salts and acids, amine, amide, zinc nitrate HBDs; (c)
phosphonium based salts and polyol HBDs.
74
Figure 4.4 Dependence of ionic conductivity (σ) on temperature for; (a)
DESs based on ammonium salts and polyol HBDs; (b)
ammonium based salts and acids, amine, amide, zinc nitrate
HBDs; (c) phosphonium based salts and polyol HBDs.
77
Figure 4.5 Arrhenius plot of viscosity (η) for; (a) DESs based on ammonium
salts and polyol HBDs; (b) ammonium based salts and acids,
amine, amide, zinc nitrate HBDs; (c) phosphonium based salts
and polyol HBDs.
79
Figure 4.6 Walden plot for for; (a) DESs based on ammonium salts and
polyol HBDs; (b) ammonium based salts and acids, amine,
amide, zinc nitrate HBDs; (c) phosphonium based salts and
polyol HBDs.
82
Figure 4.7 Temperature-dependency of pH for; (a) DESs based on
ammonium salts and polyol HBDs; (b) ammonium based salts
and acids, amine, amide, zinc nitrate HBDs; (c) phosphonium
based salts and polyol HBDs.
84
Figure 4.8 PWs of DESs based on ammonium salts and polyol HBDs using
(a) GC working electrode; (b) Pt. microelectrode.
87
Figure 4.9 PWs of DESs based on ammonium salts and acids, amine, amide,
zinc nitrate HBDs (a) GC working electrode; (b) Pt.
microelectrode.
88
Figure 4.10 PWs of DESs based on phosphonium based salts and polyol
HBDs. (a) GC working electrode; (b) Pt. microelectrode.
90
Figure 4.11 Cyclic voltammetry for the; (a) oxidation of 5.21 mM Fc; (b)
reduction of Cc+ in DES11 on a Pt electrode (diameter 20 µm) at
varying scan rates of 10, 30, 50, 70 and 100mV s-1
.
92
xiii
Figure 4.12 Linear dependence of peak current vs. square root of scan rates
(SR) for; (a) Fc and; (b) Cc+ using a Pt electrode in DES11.
95
Figure 4.13 Cottrell plot for the oxidation of Fc in DES3. 96
Figure 4.14 Cyclic voltammetry for; (a) oxidation of Fc and; (b) reduction of
Cc+ in the DES1 at varying temperatures of (i) 298 K, (ii) 308 K,
(iii) 318 K, (iv) 328 K, (v) 338 K and (vi) 348 K, at 100 mV s-1
.
100
Figure 4.15 Double potential step chronoamperometry measured; (a) on the
DES1 across the Fc/Fc+; (b) on the DES11 across the Cc
+/Cc at
temperatures of 298, 308, 318 and 338 K.
104
Figure 4.16 Dependence of diffusion and rate constant on temperature using
Arrhenius rule for; (a) Fc/Fc+ in DES1 and; (b) Cc
+/Cc in DES11
107
Figure 4.17 Experimental () and fitted theoretical (O) chronoamperometric
transients for the oxidation of 1.08, 5.21,10 .13, 20.18 and 30.06
mM Fc in DES11 at a 20 µm Pt microelectrode.
109
Figure 4.18 Plot of D against the inverse of viscosity (η-1
) for the DESs based
on glycerol and ethylene glycol HBDs
110
Figure 4.19 Cyclic voltammograms recorded at a glassy carbon electrode in
0.5 M TEABF4 in CH3CN (- - - -) and 0.01 M V(acac)3 and 0.5
M TEABF4 in CH3CN (—) at 0.1 V s-1
.
112
Figure 4.20 Cyclic voltammograms recorded at 0.1 V s-1
at a glassy carbon
electrode in 0.01 M V(acac)3 and 0.5 M TEABF4 in different
DESs.
116
Figure 4.21 Cyclic voltammetry recorded at a glassy carbon electrode in 0.01
M V(acac)3 and 0.5 M TEABF4 in CH3CN at different scan rate.
117
Figure 4.22 Cyclic voltammograms for (a) V(acac)3 , (b) the V(II)/V(III)
redox couple and (c) the V(III)/V(IV) redox couple at a glassy
carbon electrode in 0.01 M V(acac)3/0.5 M TEABF4 in DES3.
118
Figure 4.23 Cyclic voltammograms at a glassy carbon electrode in 0.01 M
V(acac)3/0.5 M TEABF4 in DES11 at different scan rate.
120
Figure 4.24 Cyclic voltammograms at a glassy carbon electrode in 0.01 M
V(acac)3/0.5 M TEABF4 in DES9 at different scan rate.
120
Figure 4.25 Plot of the Nernst equation for a single-electron
disproportionation reaction with a 2.01 V cell potential (DES3).
122
Figure 4.26 Charge/discharge curves for 0.01 M V(acac)3/0.5 M TEABF4 in
CH3CN. Thecharge current was 1 mA and the discharge current
was 0.1 mA.
123
Figure 4.27 Charge/discharge curves for 0.01 M V(acac)3/0.5 M TEABF4 in
DES3. Thecharge current was 0.1 mA and the discharge current
was 0.01 mA.
124
Figure 4.28 Charge/discharge curves during the 3th and 12th cycles for 0.01
M V(acac)3/0.5 M TEABF4 in DES3. The charge current was
0.1 mA and the discharge current was 0.01 mA.
125

xiv
LIST OF TABLES
Table 2.1 Reduction potentials of vanadium redox couples 17
Table 2.2 Prices of some commercially available ILs prepared at the
Queen's University Belfast and sold by Acros Organics
43
Table 2.3 Commercial prices of DESs manufactured in Leicester and sold
throughout the UK
44
Table 3.1 List of DESs obtained by complexion between hydrogen acceptor
and hydrogen-bond donor molecules
57
Table 3.2 Equipments utilized for characterization of DESs with their
uncertainties.
58
Table 3.3 Properties of AMI-7001S anion exchange membrane. 66
Table 4.1 Physical properties of the different DESs synthesized in this
study.
68
Table 4.2 The adjustable parameters for density of all studied DESs. 70
Table 4.3 Regression parameters for viscosity of studied DESs. 75
Table 4.4 Regression parameters for ionic conductivity of studied DESs. 79
Table 4.5 The adjustable parameters for pH of all studied DESs. 84
Table 4.6 Electrochemical potential windows for the DESs based on
ammonium salts and polyol HBDs obtained by means of GC and
Pt. electrodes.
89
Table 4.7 Cyclic voltammetric data for oxidation of FC in DESs. 93
Table 4.8 Kinetic parameters and D for Fc/Fc+ and Cc
+/Cc in DESs. 98
Table 4.9 The experimental voltammetric data for Fc/Fc+ and Cc
+/Cc in
DESs with different operating temperatures.
101
Table 4.10 Temperature dependence of Kinetic parameters and diffusion
coefficients for Fc/Fc+ and Cc
+/Cc in DESs.
105
Table 4.11 Activation energies of the diffusion coefficients and rate
constants for Fc/Fc+ and Cc
+/Cc in studied DESs.
106
Table 4.12 Concentration dependent of the diffusion coefficients of Fc in
DESs solution.
108
Table 4.13 The Stokes–Einstein products of Fc and Cc+
in some DESs. 111
Table 4.14 Summary of V(acac)3 performance characteristics in selected
DESs.
121
xv
LIST OF ABBREVIATIONS
[MOPMPip+][TFSI
−] 1-(3-methoxypropyl)-1-methylpiperidinium bis(trifluoromethylsulfonyl) imide
[BMIM]Cl 1-butyl-3- methylimidazolium chloride
EMI-FSI 1-ethyl-3-methyl imidazolium bis(fluorosulfonyl)imide
[C2mim]I 1-ethyl-3-methylimidazolium iodide
[C2mim][BF4] 1-ethyl-3-methylimidazolium tetrafluoroborate
[HMPyrr+][TFSI
−] 1-hexyl-1-methyl-pyrrolidinium bis (trifluoromethylsulfonyl) imide
[bmim][PF6] 1-n-butyl-3-methylimidazolium hexafluorophosphate
[bmim][BF4] 1-n-butyl-3-methylimidazolium tetrafluoroborate
CH3CN Acetonitrile
VRB All-vanadium Redox Flow Battery
[N(CF-SO2)2−] Bis(trifluoromethyl)sulfonylamide
ChCl Choline Chloride
CA Chronoamperometry
Cc+/Cc Cobaltocenium/Cobaltocene
CE Coulombic Efficiency
CV Cyclic Voltammetry
DES Deep Eutectic Solvent
DCA Dicyanamide
DSC Differential Scanning Calorimetry
DSSCs Dye Sensitized Solar Cells
EDLC Electric Double layer Capacitor
EE Energy Efficiency
EG Ethylene Glycol
Fc/Fc+ Ferrocene/Ferrocenium
GC Glassy Carbon
AuNPs Gold Nanoparticles
HBD Hydrogen Bond Donor
ICP-AES Inductively Coupled Plasma-Atomic Emission Spectrometer
IEM Ion Exchange Membrane
IL Ionic Liquid
TEA-BF4 N,N,N,N-tetraethylammonium-tetrafluoroborate
PYR14TFSI N-butyl-N-methylpyrrolidinium bis (trifluoromethanesulfonyl) imide
OCP Open-Circuit Potential
Pt Platinum Electrode
PEMFC Polymer Electrolyte Membrane Fuel Cell
PW Potential Window
PC Propylene Carbonate
QRE Quasi-Reference Electrodes
RFB Redox Flow Battery
G2 Second Generation
AgBF4 silver tetrafluoroborate
SEI Solid Electrolyte Interface
SOC State Of Charge
B(CN)4 Tetracyanoborate
TEABF4 tetraethylammonium tetrafluoroborate
SCN Thiocyanate
TCM Tricyanomethanide
V(acac)3 Vanadium (III) acetylacetonate
VE Voltage Efficiency
xvi
NOMENCLATURE
Eη Activation Energy Of Viscosity ( kJ mol-1
)
Epa Anodic Peak Potential
kB Boltzmann Constant(m2 kg s
-2 K
-1)
Epc Cathodic Peak Potential
CO Concentration Of The Electroactive Species (mol cm–3
)
σ Conductivity (mS cm-1
)
ρ Density (g cm-3
)
D Diffusion Coefficient(cm2 s
–1)
A Electrode Area (cm2)
Ve Equivalent Weight (gm)
F Faraday‘s Constant( C mol-1
)
Tf Freezing Point(K)
E1/2 Half Wave Potential (V)
k0 Heterogeneous Rate Constant (cm s
-1)
R Ideal Gas Constant ( kPa.L.mol-1
.K-1
)
Mw Molecular Weight (g mol-1
)
ip Peak Current (A)
ΔEp Peak-to- Peak Potential Separation(V)
ν Scan Rate (mV s-1
)
s Solubility(M)
ηD T−1
Stokes–Einstein Product( g cm s−2
K−1
)
T Temperature(K)
t Time (s)
η Viscosity (mPa s)

1
CHAPTER 1: INTRODUCTION
1.1 Overview
Exploration and development of renewable energies from sources like solar, wind
and wave are amongst a few of the central topics of our time (Skyllas-Kazacos et al.,
2009, Skyllas-Kazacos et al., 2011). However, the variable and intermittent nature of
renewable energy is the most critical issue affecting the final quality of power output, so
there is often the problem of matching the supply to meet the demand (Hart et al,.
2012). Large scale energy storage systems, is the key technology to solve this problem.
Energy storage can increase the stability of energy that can be derived from wind or
other forms of renewable energy. For instance, electricity supply from photovoltaic
cells that convert solar energy can be stabilized significantly if coupled to an efficient
energy storage system (Li et al., 2011). Of all the new energy storage technologies the
all-vanadium redox flow battery (VRB) possesses features such as flexible design, long
life, low pollution emission, high storage capacity and quick response (Kear et al., 2009;
Huang et al., 2008, Rahman and Skyllas-Kazacos, 2004, Fabjan et al., 2001).
The VRB, proposed by Maria Skyllas-Kazacos in 1985, operates on the principle of
two electrolyte tanks containing active soluble species of vanadium in different valence
states (in the positive tank: the V(IV)/V(V) redox couple; in the negative tank: the
V(II)/(III) redox couple) in sulfuric acid solution, two pumps, and a battery stack
section where the redox electrode reaction takes place (Li et al., 2011; Zhao et al.,
2006). The electrolytes are pumped into the stack separated by an ion exchange
membrane. Electrical balance is achieved by the migration of hydrogen ions across the
membrane separating the electrolytes (Rychcik and Skyllas-Kazacos, 1988). All of the
reactants and products of the electrode reactions remain dissolved in one or other of the
two electrolytes and, if solution crossover happened, the vanadium half-cell electrolytes
2
can be mixed again and the system make return to its original state, although with a loss
of energy efficiency. No significant phase change reactions or electro-recrystallization
processes occur in the VRB system (Ponce de Leon et al., 2006). Furthermore, the
difficulty of electrolytes cross contamination through the battery separator was
overcome, because of using only vanadium species in both halves of the cell (Skyllas-
Kazacos et al., 1991, Vafiadis et al., 2006). Based on these attractive features, more and
more attention has been paid to the VRB recently (Herr et al., 2014, Wandschneider et
al., 2014; Wu et al., 2014, Burt et al., 2014).
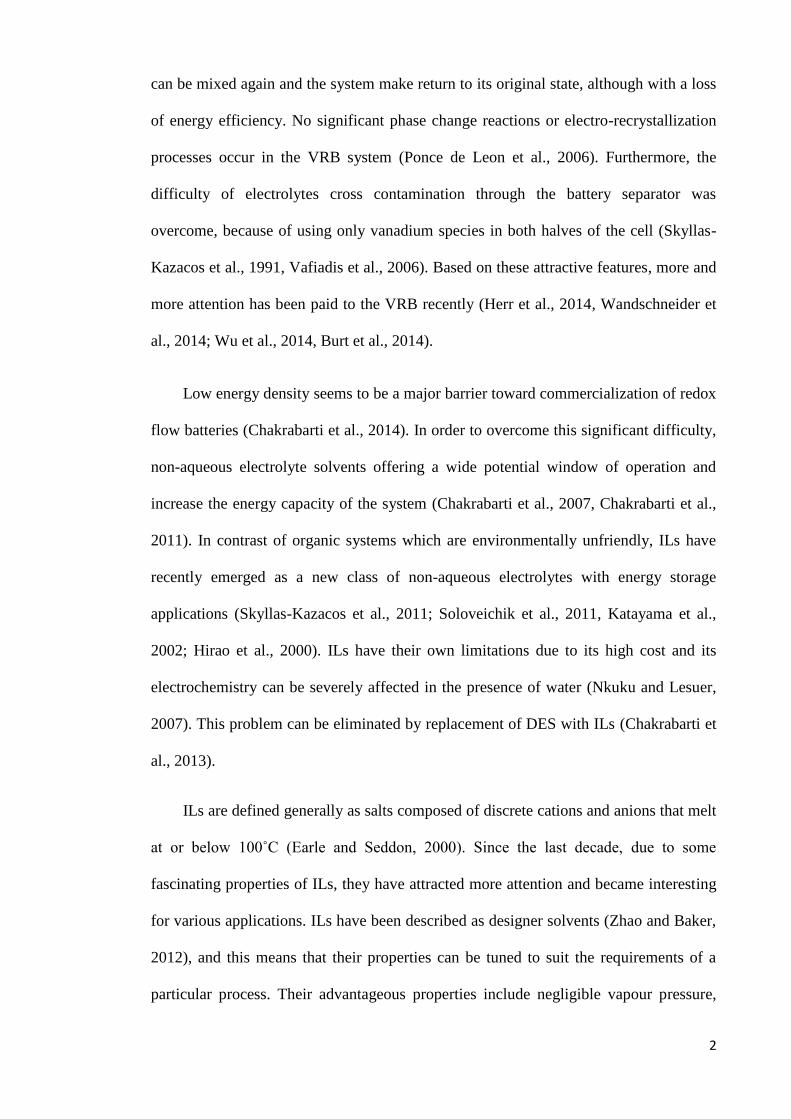
Low energy density seems to be a major barrier toward commercialization of redox
flow batteries (Chakrabarti et al., 2014). In order to overcome this significant difficulty,
non-aqueous electrolyte solvents offering a wide potential window of operation and
increase the energy capacity of the system (Chakrabarti et al., 2007, Chakrabarti et al.,
2011). In contrast of organic systems which are environmentally unfriendly, ILs have
recently emerged as a new class of non-aqueous electrolytes with energy storage
applications (Skyllas-Kazacos et al., 2011; Soloveichik et al., 2011, Katayama et al.,
2002; Hirao et al., 2000). ILs have their own limitations due to its high cost and its
electrochemistry can be severely affected in the presence of water (Nkuku and Lesuer,
2007). This problem can be eliminated by replacement of DES with ILs (Chakrabarti et
al., 2013).
ILs are defined generally as salts composed of discrete cations and anions that melt
at or below 100˚C (Earle and Seddon, 2000). Since the last decade, due to some
fascinating properties of ILs, they have attracted more attention and became interesting
for various applications. ILs have been described as designer solvents (Zhao and Baker,
2012), and this means that their properties can be tuned to suit the requirements of a
particular process. Their advantageous properties include negligible vapour pressure,

3
good thermal and chemical stability, high polarity and non-flammability (AlNashef et
al., 2001, Endres and Zein El Abedin, 2006, MacFarlane et al., 2006). Some ILs also
show no miscibility with water, allowing the development of novel separation processes
(Appetecchi et al., 2006). ILs have been intensively studied as electrolytes due to their
attractive characteristics such as broad potential windows, intrinsic conductivities and
high thermal stabilities (zhao et al., 2008, Galinski et al., 2006) in comparison to
common organic solvents like acetonitrile (Chakrabarti et al., 2007). In addition, some
ILs are so stable with respect to electrochemical decomposition, that reactive metals,
such as sodium and lithium can be deposited from them (Fuller et al., 1997).
ILs have great potential for use as ―green‖ solvents for industrial processes
(AlNashef et al., 2002; Plechkova et al., 2008). However, their large scale applications
in industry have remained a challenge, due to issues associated with high cost, purity
and toxicity (Hou et al., 2008, Abbott et al., 2003). Thus deep eutectic solvents (DESs)
have been identified as alternatives for ILs (Abbott et al., 2009, Abbott et al., 2004). A
DES is a eutectic mixture of an organic salt (ammonium or phosphonium) and a
hydrogen bond donor (HBD), that is, made up of different components such as amides,
metal salts, alcohols, carboxylic acids and amines that may be used as complexing
agents(typically a H-bond donor)(Boisset et al., 2013, Rub and Konig, 2012 ). DESs
have a melting point that is far below that of either individual constituent. The
mechanism is that the complexing agent interacts with the anion and increases its
effective size. This, in turn, decreases the anion interaction with the cation thereby
reducing the melting point of the mixture (Abbott et al., 2003). These liquids are easy to
prepare in a pure state, they are non-reactive with water and most importantly they are
biodegradable due to which, the toxicological properties of the components are well
characterized (Abbott et al., 2007). These compounds share many characteristics of
conventional ILs (e.g. they have intrinsic electrical conductivity, low-volatility,
4
biodegradability, high thermal and chemical stability, good electrochemical stability,
non-flammability) and they are simple to synthesize on a large scale (Leron and Li et
al., 2012, Zhang et al., 2012, Carriazo et al., 2012). These properties have been explored
for promising applications such as solvents for electrodeposition and electropolishing
(Steichen et al., 2011, Abbott et al., 2009), electrochemistry (Nkuku and LeSuer, 2007),
separation processes (Pang et al., 2012), chemical and enzyme reactions (Lindberg et
al., 2010), biochemistry (Dai et al., 2013) as well as organic and inorganic synthesis
(Abbott et al., 2006, Abbott et al., 2005).
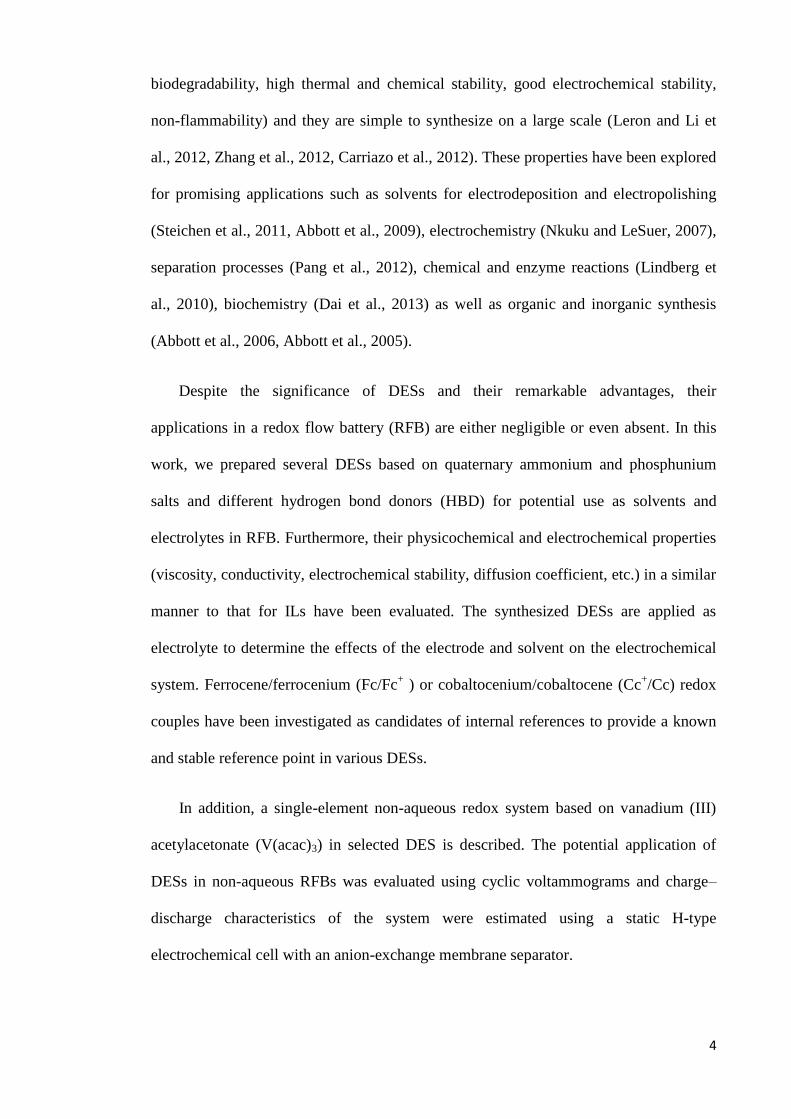
Despite the significance of DESs and their remarkable advantages, their
applications in a redox flow battery (RFB) are either negligible or even absent. In this
work, we prepared several DESs based on quaternary ammonium and phosphunium
salts and different hydrogen bond donors (HBD) for potential use as solvents and
electrolytes in RFB. Furthermore, their physicochemical and electrochemical properties
(viscosity, conductivity, electrochemical stability, diffusion coefficient, etc.) in a similar
manner to that for ILs have been evaluated. The synthesized DESs are applied as
electrolyte to determine the effects of the electrode and solvent on the electrochemical
system. Ferrocene/ferrocenium (Fc/Fc+ ) or cobaltocenium/cobaltocene (Cc
+/Cc) redox
couples have been investigated as candidates of internal references to provide a known
and stable reference point in various DESs.
In addition, a single-element non-aqueous redox system based on vanadium (III)
acetylacetonate (V(acac)3) in selected DES is described. The potential application of
DESs in non-aqueous RFBs was evaluated using cyclic voltammograms and charge–
discharge characteristics of the system were estimated using a static H-type
electrochemical cell with an anion-exchange membrane separator.

5
1.2 Research objectives
This project is an attempt to adapt work from the development of a novel redox
flow battery and uses the H-type electrochemical cell employing DES and a range of
active electrolytes for efficient charge/discharge purposes. In the proposed research,
DESs will be synthesized from different available chemical sources. Then, these DESs
will be utilized as electrolytes for vanadium redox flow battery applications. Thus, in
summary, the objectives of this study are as follows:
1. Synthesis of different DESs in the laboratory.
2. Measure the physical properties of DESs relevant to battery applications.
3. Test the electrochemical behaviours of DES using cyclic voltammetry and
chronoamperometry using reversible redox couple as an internal potential standard.
4. Study the solubility of V(acac)3 in selected DESs.
5. Study the detailed electrochemical kinetics for the V(II)/V(III) and V(IV)/V(V)
couples.
6. Conduct charge/discharge experiments with the DES that shows best performance
obtained from preliminary electrochemical screening tests.
1.3 Research methodology
The methodology that will be followed to obtain the objectives will be considered
comprehensively in chapter three. A summary of the methodology is listed below:
1. Synthesis of DESs.
2. Characterization of physical properties of these electrolytes using several
equipments.
3. Testing Cyclic voltammetry experiments on V(acac)3 in acetonitrile.
6
4. Preparation of solubility experiments of V(acac)3 in DESs.
5. Analysis of the samples using Induced Coupled Plasma (ICP) analysis.
6. Testing electrochemical properties of reversible vanadium species in DESs using
cyclic voltammetry.
7. Fabrication of an H-type electrochemical cell.
8. Performing charge/discharge experiments with electrochemically reversible DES
using the glass cell reactor.
1.4 Thesis outline
This report contains five chapters dealing with different aspects relevant to the topic
of the study as follows:
1. Chapter One - INTRODUCTION: This chapter includes a brief introduction to the
research and objectives of the study.
2. Chapter Two - LITERATURE REVIEW: This chapter presents the literature survey
concerning the renewable energies, vanadium redox flow battery, ionic liquids, deep
eutectic solvents and their application.
3. Chapter Three - METHODOLOGY: this chapter includes chemical and material
used in this work, the synthesis of deep eutectic solvents and measuring their
physical properties, solubility experiment, cyclic voltammetry and
chronoamperometry and Charge/discharge experiments.
4. Chapter Four - RESULTS AND DISCUSSIONS: experimental results are discussed
thoroughly.

7
5. Chapter Five - CONCLUSIONS: conclusions are drawn over the results obtained
and their analysis.
8
CHAPTER 2: LITERATURE REVIEW
2.1 Renewable energy
Renewable energy has been growing in demand throughout the world due to
environmental issues such as global warming or acid rain. These problems have resulted
due to an excessive use of fossil fuels as a consequence of unprecedented growth in
agricultural, domestic and industrial activities especially in emergent countries (Banos
et al., 2011, Liming et al., 2009). In response, there are strong possibilities of replacing
fossil fuels with renewable sources of energy in the future due to their significantly
lesser impact upon the environment (Panwar et al., 2011). Renewable energy also
presents important drawbacks, such as the discontinuity of generation, as most resources
depend on climatic conditions (Marques et al., 2011, Negro et al., 2012). Despite that,
combining these renewable energy sources with back-up units to form a hybrid system
can provide a more economic, environment friendly and reliable supply of electricity in
comparison to the single-usage of such systems (Erdinc and Uzunoglu, 2012). Another
alternative means of improving the sustained supply of the renewable and yet
intermittent energy involves the design and deployment of efficient energy storage
technologies (Lund and Mathiesen, 2009, Hajimolana et al., 2011). Each technology has
some inherent disadvantages that make it practical or economical for only a limited
range of applications (Evans et al., 2012). When combining operation requirements with
cost, electrochemical systems are seen to be superior to the other forms of energy
storage which are mainly mechanical in nature and therefore have relatively longer
response times (Skyllas-Kazacos et al., 2011, Leung et al., 2012).
Efficient renewable energy storage needs to accumulate energy during times when
demand is low (peak shaving) and to supply it when demand is high in order to ensure
efficient energy handling (load leveling) (Skyllas-Kazacos et al., 2011). A number of
9
technologies based on electrical, chemical, electrochemical and mechanical processes
have been proposed to address the energy storage needs of electrical grids (Soloveichik,
2011, Sheikh, 2010, Sahir and Qureshi, 2008). Electrochemical storage systems are
found to be robust due to their relative ease of siting as well as fast response times.
Electrochemical energy storage systems provide direct conversion between chemical
and electrical energy and are therefore particularly suited to the storage of the latter
(Skyllas-Kazacos et al., 2011). Electrochemical storage technologies also offer
additional advantages compared with other types of energy storage systems, including
(Leung et al., 2012):
Modularity whereby they can be used in applications ranging from a few kWh to
several MWh.
Simultaneous application for both power quality and energy management.
Low environmental impact, which means they can be sited near residential
areas.
2.2 Introduction to redox flow batteries
Redox flow batteries (RFBs) are rechargeable electrochemical systems that rely on
the redox states of various soluble species for the purposes of storing and releasing
energy via highly efficient charge/discharge processes (Weber et al., 2011, Bartolozzi,
1989). The use of the redox flow cell can be traced back to the zinc/chlorine system that
was developed in 1884 by Charles Renard and Arthur Krebs to power their army airship
―La France‖ (Yang et al., 2011, Posner, 1955). Later, this concept was re-visited by
Posner in the mid-1950s (Posner, 1955), and an independent investigation was
conducted in Japan around 1968 (Soloveichik, 2011, Bae et al., 2011). The modern
iron/chromium RFB was invented by Lawrence Thaller at the National Aeronautics and

10
Space Administration (NASA) in the USA (Thaller, 1974, Bae al., 2011). In the last two
decades following the invention of this technology, it was developed and used in small
to medium-scale field tests (Diaz-Gonzalez et al., 2012). Because fully soluble redox
couples and inert electrodes are used (Skyllas-Kazacos et al., 2011, Leung et al., 2012,
Chakrabarti et al., 2007), undesirable electrode processes are eliminated (especially
structural changes of the electrode), in contrast with secondary battery systems (Palacin
et al., 2009). The energy storage capacity of the system is determined by the
concentrations of the reactants and the size of the storage tanks, and the system power is
determined by the number of individual cells in the battery stack and their electrode area
(Rychcik and Skyllas-Kazacos, 1988). Consequently, it is possible to independently
optimise the flow cell‘s storage capacity and power output. This feature makes RFBs
unique in their ability to provide specific power and energy requirements for each
application. The storage capacity can be increased to reduce the incremental costs of
each additional energy storage capacity unit relative to other batteries by adding
additional electrolytes. Thus, the cost per kWh of the system substantially decreased as
the storage capacity increased, making the RFB particularly attractive for applications
requiring storage times in excess of 4–6 h (Skyllas-Kazacos et al., 2011).
Furthermore, RFBs are different from other types of rechargeable batteries because
liquid electrolytes supply their energy rather than solid electrodes. For example, in a
lithium-ion cell, lithium ions from the liquid electrolyte are inserted into the electrodes.
The capacity of the lithium-ion battery is controlled by the size of the lithium
component in the electrode and the electrolyte. The power of lithium-ion batteries is
enhanced by increasing the electrode size, which couples the power and energy (Sato et
al., 2004, Garcia et al., 2004, Hayashi et al., 2005).
11
In comparison, the RFB prospect separates the power capacity from the energy
capacity. The electrodes in the reactors supply sources or sinks for electrons and are
theoretically inert. In addition, the number of cell reactors piled together and the sizes of
the electrodes in each cell specify the overall power. The total mass of the electrolytic
solution flowing through the reactor stack specifies the energy-storage capacity (Ponce
de Leon et al., 2006, Li et al., 2011). This separation of energy and power uses flexible
and scalable RFBs to meet client requirements. Due to the relatively low energy
densities of liquid electrolytes, RFBs are mainly employed for stationary applications,
specifically, large power plants. One additional benefit of RFBs is that the
electrochemical reactions at the liquid/solid interface are fast (Ponce de Leon et al.,
2006, Li et al., 2011). Because the electrodes of Li-ion batteries exhibit mechanical
exhaustion with time due to insertion reactions, the electrodes in the RFB should not.
Consequently, the RFB lifetimes are much longer than those in other battery systems
(Ponce de Leon et al., 2006, Li et al., 2011).
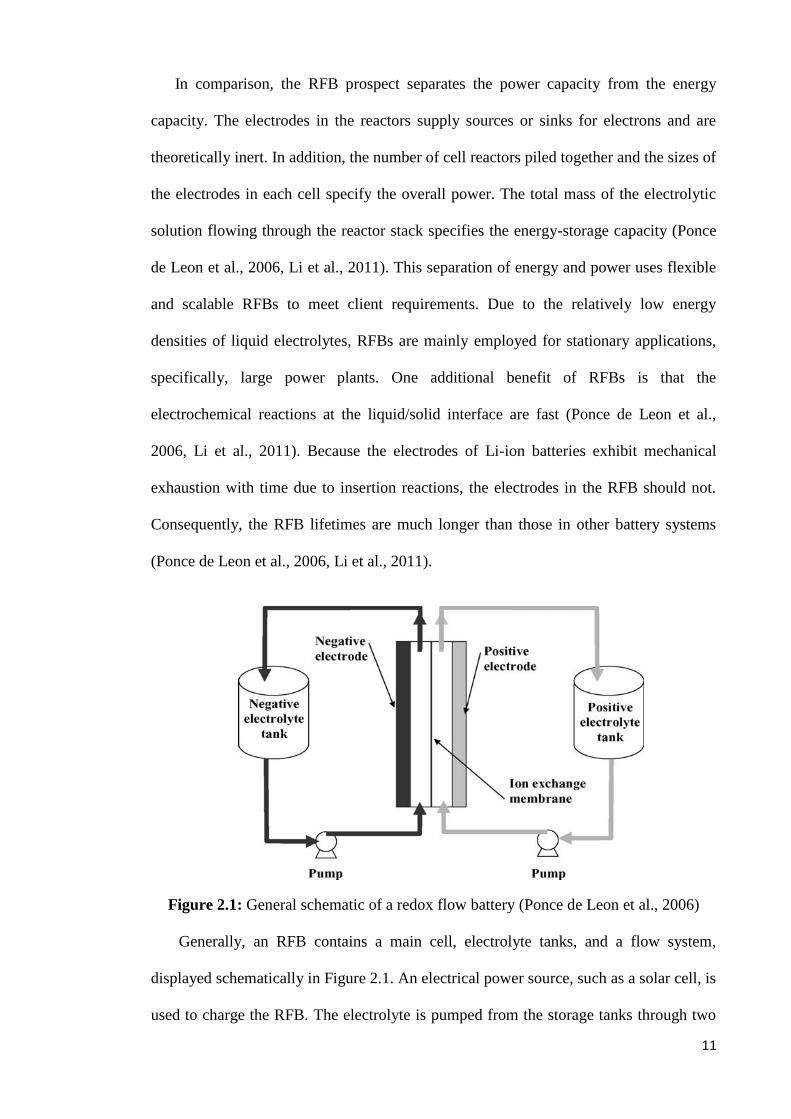
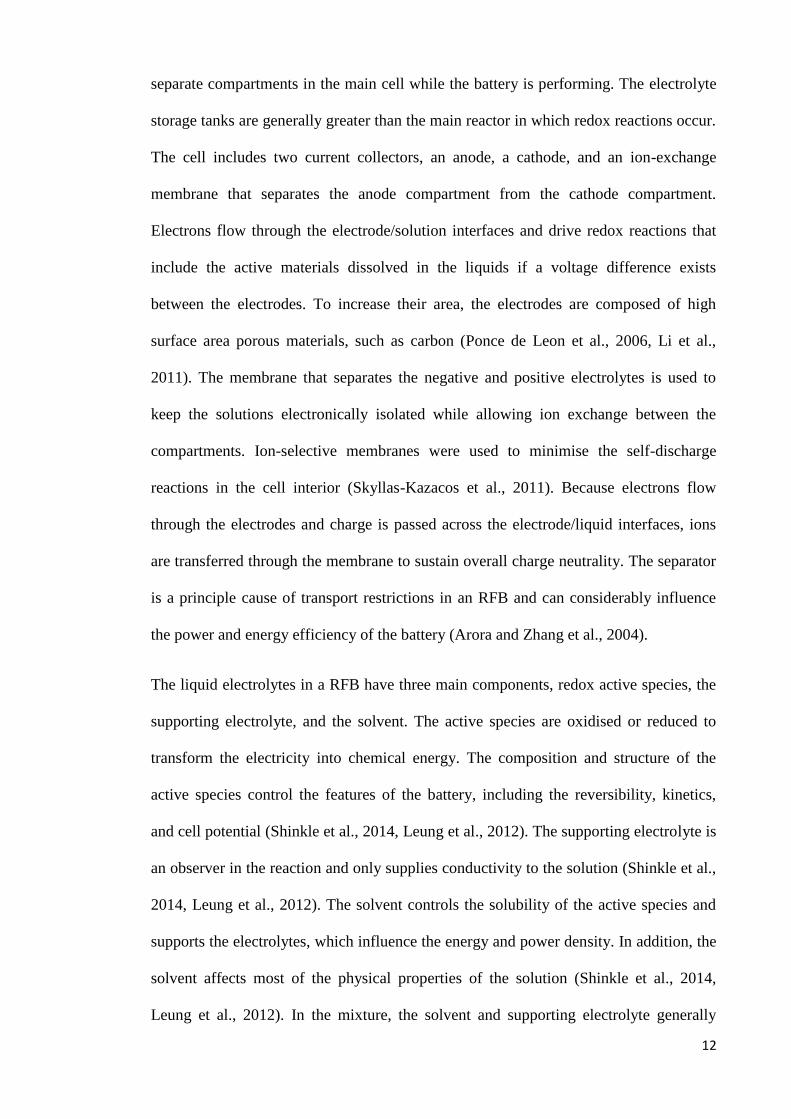
Figure 2.1: General schematic of a redox flow battery (Ponce de Leon et al., 2006)
Generally, an RFB contains a main cell, electrolyte tanks, and a flow system,
displayed schematically in Figure 2.1. An electrical power source, such as a solar cell, is
used to charge the RFB. The electrolyte is pumped from the storage tanks through two
12
separate compartments in the main cell while the battery is performing. The electrolyte
storage tanks are generally greater than the main reactor in which redox reactions occur.
The cell includes two current collectors, an anode, a cathode, and an ion-exchange
membrane that separates the anode compartment from the cathode compartment.
Electrons flow through the electrode/solution interfaces and drive redox reactions that
include the active materials dissolved in the liquids if a voltage difference exists
between the electrodes. To increase their area, the electrodes are composed of high
surface area porous materials, such as carbon (Ponce de Leon et al., 2006, Li et al.,
2011). The membrane that separates the negative and positive electrolytes is used to
keep the solutions electronically isolated while allowing ion exchange between the
compartments. Ion-selective membranes were used to minimise the self-discharge
reactions in the cell interior (Skyllas-Kazacos et al., 2011). Because electrons flow
through the electrodes and charge is passed across the electrode/liquid interfaces, ions
are transferred through the membrane to sustain overall charge neutrality. The separator
is a principle cause of transport restrictions in an RFB and can considerably influence
the power and energy efficiency of the battery (Arora and Zhang et al., 2004).
The liquid electrolytes in a RFB have three main components, redox active species, the
supporting electrolyte, and the solvent. The active species are oxidised or reduced to
transform the electricity into chemical energy. The composition and structure of the
active species control the features of the battery, including the reversibility, kinetics,
and cell potential (Shinkle et al., 2014, Leung et al., 2012). The supporting electrolyte is
an observer in the reaction and only supplies conductivity to the solution (Shinkle et al.,
2014, Leung et al., 2012). The solvent controls the solubility of the active species and
supports the electrolytes, which influence the energy and power density. In addition, the
solvent affects most of the physical properties of the solution (Shinkle et al., 2014,
Leung et al., 2012). In the mixture, the solvent and supporting electrolyte generally
13
define the stability window of the solution, which can restrict the possible active-species
reactions that can be used to store energy (Shinkle et al., 2014, Leung et al., 2012).
2.3 Vanadium system overview
The vanadium redox flow battery (VRB), which was originally proposed by
Skyllas- Kazacos and co-workers, has recently received considerable attention due to its
technical benefits (Sum and Skyllas-Kazacos, 1985, Skyllas-Kazacos et al., 1986).
Since then, research regarding this technology has continued (Kear et al., 2012,
Joerissen et al., 2004, Zhang et al., 2012, Huang et al., 2008). These benefits include the
flexibility in design, the facility to regenerate the electrolyte solution and the reliability
of large-scale energy storage, among others (Mai et al., 2011). In iron/chromium and
bromine/polysulphide systems, a chief concern and liability is the incompatibility
between and the sensitivity of the two electrolyte streams regarding their contamination
of each other. If a species crosses over and reacts irreversibly with the elements in the
opposite stream; it includes an efficiency loss from that special charge/discharge cycle
and a capacity loss and degradation in the overall operation of the system, which may
result in costly electrolyte separation and reactant recovery (Weber et al., 2011). Thus, it
is helpful to develop a system with more than two oxidation states of the same element,
where crossover only represents an efficiency loss because no species are irreversibly
consumed or removed from their reactive electrolytic solutions (Li et al., 2011, Oriji et
al., 2004, Weber et al., 2011). As a promising technology for storing intermittent
renewable energy, VRB systems have potentially received the most attention among
RFBs recently (Watt-Smith et al., 2013, Zhang et al., 2012, Kear et al., 2012). While
energy density is not necessarily an initial effect for stationary, grid applications, the
VRB energy density is limited by the solubility of vanadium in the electrolyte stream
14
and precipitation can occur. In addition, the solubility limits depend on the temperature
and acid concentration (Skyllas-Kazacos et al., 1996).
2.3.1 The principle of VRBs
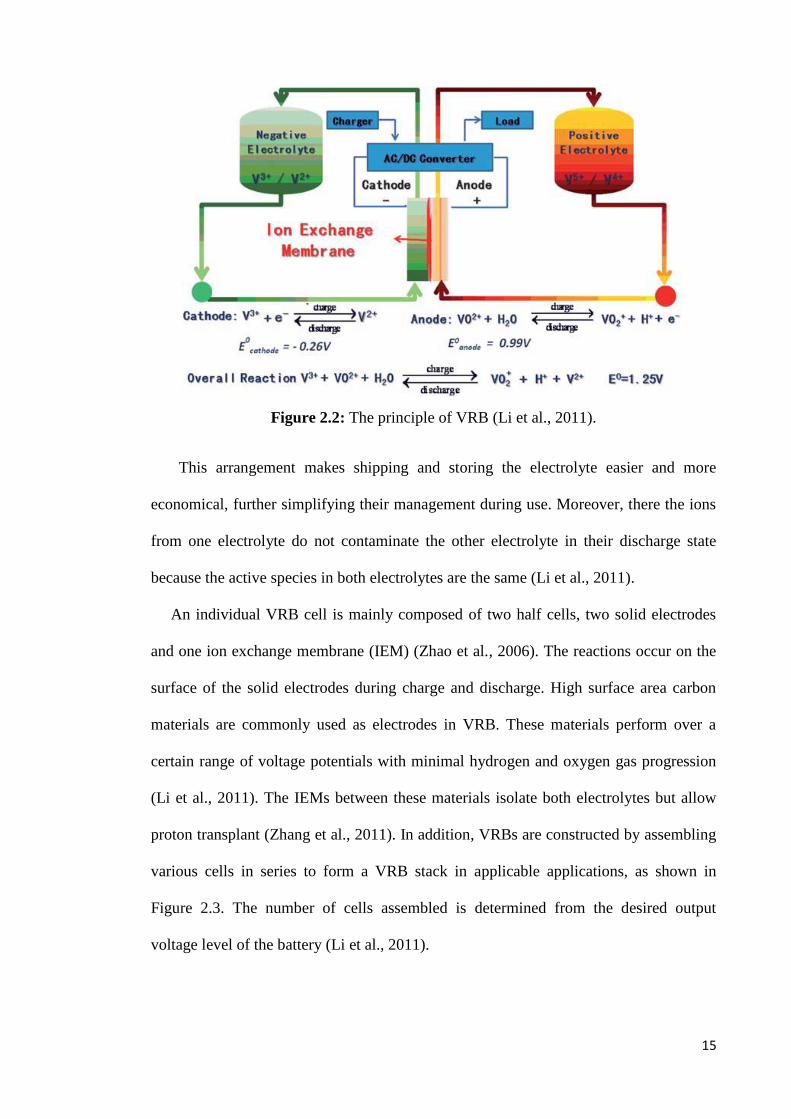
The VRB is an electrochemical system that can comprehend alterations between
chemical energy and electrical energy (Chakrabarti et al., 2014, Zhao et al., 2006). As
shown in Figure 2.2, VRBs have two electrolyte tanks, including active vanadium
species in different valence states. The V(II)/V(III) redox couple is used at the negative
electrode, while the V(IV)/V(V) redox couple is used at the positive electrode (Sum and
Skyllas-Kazacos, 1985, Zhang et al., 2011). All active species are dissolved in a
sulphuric acid medium. The vanadium ion and sulphuric acid concentrations were 1–3
M and 1–2 M, respectively (Li et al., 2011). During the charge/discharge procedures,
the active species are oxidised or reduced to convert between chemical energy and
electrical energy (Ponce de Leon et al., 2016). The electrical balance was obtained by
transporting the protons or sulphate ions for the anion exchange membrane in the
electrolytes across the membrane during the performance of the cell. Characterised by
the dissolved redox species in the re-circulated solution, the flow battery differs from
the other batteries storing the energy in electrode structures, such as lithium-ion
batteries and lead-acid batteries. The characteristic structure of the VRB allows for the
independent design of the power rating and storage capacity (Huang et al., 2008, Weber
et al., 2011, Li et al., 2011). In addition, VRBs have a unique advantage over other flow
batteries because their positive and negative electrolytes are identical in their discharged
states (Vafiadis and Skyllas-Kazacos, 2006, Oriji et al., 2004, Li et al., 2011).
15
Figure 2.2: The principle of VRB (Li et al., 2011).
This arrangement makes shipping and storing the electrolyte easier and more
economical, further simplifying their management during use. Moreover, there the ions
from one electrolyte do not contaminate the other electrolyte in their discharge state
because the active species in both electrolytes are the same (Li et al., 2011).
An individual VRB cell is mainly composed of two half cells, two solid electrodes
and one ion exchange membrane (IEM) (Zhao et al., 2006). The reactions occur on the
surface of the solid electrodes during charge and discharge. High surface area carbon
materials are commonly used as electrodes in VRB. These materials perform over a
certain range of voltage potentials with minimal hydrogen and oxygen gas progression
(Li et al., 2011). The IEMs between these materials isolate both electrolytes but allow
proton transplant (Zhang et al., 2011). In addition, VRBs are constructed by assembling
various cells in series to form a VRB stack in applicable applications, as shown in
Figure 2.3. The number of cells assembled is determined from the desired output
voltage level of the battery (Li et al., 2011).
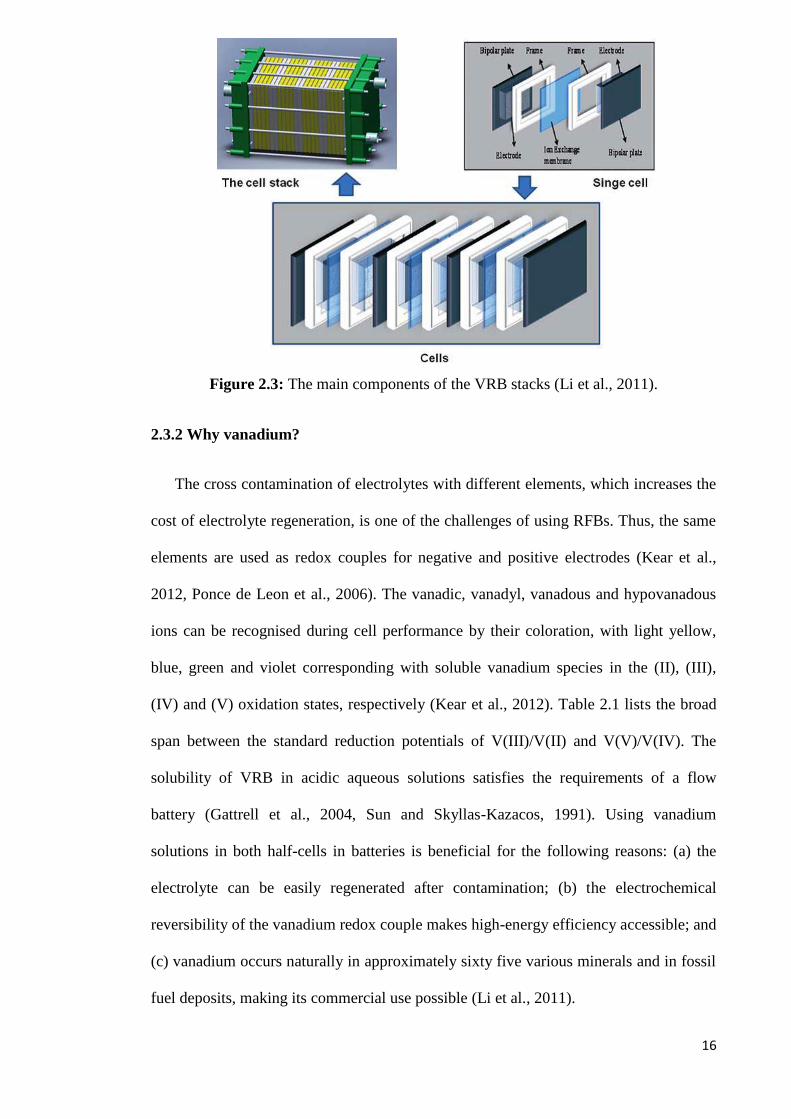
16
Figure 2.3: The main components of the VRB stacks (Li et al., 2011).
2.3.2 Why vanadium?
The cross contamination of electrolytes with different elements, which increases the
cost of electrolyte regeneration, is one of the challenges of using RFBs. Thus, the same
elements are used as redox couples for negative and positive electrodes (Kear et al.,
2012, Ponce de Leon et al., 2006). The vanadic, vanadyl, vanadous and hypovanadous
ions can be recognised during cell performance by their coloration, with light yellow,
blue, green and violet corresponding with soluble vanadium species in the (II), (III),
(IV) and (V) oxidation states, respectively (Kear et al., 2012). Table 2.1 lists the broad
span between the standard reduction potentials of V(III)/V(II) and V(V)/V(IV). The
solubility of VRB in acidic aqueous solutions satisfies the requirements of a flow
battery (Gattrell et al., 2004, Sun and Skyllas-Kazacos, 1991). Using vanadium
solutions in both half-cells in batteries is beneficial for the following reasons: (a) the
electrolyte can be easily regenerated after contamination; (b) the electrochemical
reversibility of the vanadium redox couple makes high-energy efficiency accessible; and
(c) vanadium occurs naturally in approximately sixty five various minerals and in fossil
fuel deposits, making its commercial use possible (Li et al., 2011).

17
Table 2.1: Reduction potentials of vanadium redox couples (Joerissen al., 2004, Li et
al., 2011).
Redox couple Reduction potential (V)
V3+
/V2+
VO2+/VO
2+
VO2+
/V3+
-0.255
0.999
0.337
2.4 Conventional electrolytes used in redox flow batteries and their drawbacks
Generally, most of the RFBs reported in the literature employ aqueous electrolytes.
Therefore, their operating potential is constrained by the electrochemical stability
window of water (depending on pH, generally lower than 2.0 V) (Chakrabarti et al.,
2007). Organic solvents offer a much higher potential window, e.g. 5 V for acetonitrile
(CH3CN), with which, much higher power and energy output can be obtained (Liming
et al., 2009, Low et al., 2013). However, organic solvents tend to be detrimental to the
environment due to high vapor pressures, toxicity and flammability.
2.4.1 Aqueous electrolytes
The most notable aqueous-based systems were the iron/chromium, all-vanadium and
bromide/polysulfide technologies. The all-vanadium system achieved commercial
fruition, while the other two systems faced limitations when scaling up (Yufit et al.,
2013). Despite commercial success, the all-vanadium systems suffer from several
drawbacks, including high costs due to the IEM, a low open-circuit potential (OCP)
(which results in less power output), and a lower energy density (ca. 25 Wh kg-1
)
(Skyllas-Kazacos et al., 2011, Leung et al., 2012). The low energy density problem was
solved by inventing a vanadium/bromine redox system (Skyllas-Kazacos, 2003).
Preliminary studies have been conducted using a 3–4 M vanadium–bromide solution in
the negative half-cell and an 8–10 M HBr solution in the positive half-cell (Skyllas-
Kazacos, 2003) and different membrane materials (Skyllas-Kazacos et al., 2011,
Vafiadis and Skyllas-Kazacos, 2006). For this concentration of active ions, it was

18
possible to reach energy densities of up to 50 Wh kg-1
(Vafiadis and Skyllas-Kazacos,
2006). This cell showed a rapid loss of capacity due to the transfer of vanadium ions
across the membrane to the positive half-cell solution (Skyllas-Kazacos et al., 2011). To
overcome this problem, vanadium–bromide was added to both half-cells, resulting in
the G2 (second generation) V–Br cell technology that employs the same electrolytes in
both half-cells. Similar to the all-vanadium battery, the G2 V–Br overcame this cross
contamination problem. However, the higher solubility of vanadium halides compared
with vanadium sulphate salts resulted in much higher energy densities (Skyllas-Kazacos
et al., 2011). This technology was patented in 2008 (Skyllas-Kazacos, 2008, Skyllas-
Kazacos et al., 2011). Nonetheless, one potential concern of V–Br redox systems is the
release of toxic bromine-vapour during operation. Consequently, Skyllas-Kazacos
(Skyllas-Kazacos et al., 2010) used bromine complexing agents, such as tetra-
butylammonium bromide, polyethylene glycol, N-methyl-N-ethyl morpholinium
bromide, and N-methyl-N-ethylpyrrolidinium bromide, to decrease the hazards
associated with this process (Yufit et al., 2013). A similar problem related to the toxic
discharge of hydrogen sulphide gas was reported for the bromide/polysulfide system
(Lessner et al., 1992). Despite achieving higher energy densities with the V–Br system,
the electrochemical decomposition of water limited its potential power output.
All of the early RFBs used multiple redox-active species in the liquid electrolytes, a
formation known as a ―dual-active-species‖. Samples of dual-active-species RFBs
include RFBs containing iron/titanium (Savinell et al., 1979) and iron/chromium
(O'Donnell et al., 1976), as well as commercial zinc/bromine (Lim et al., 1977,
Besenhard et al., 1977) hybrids and sodium-polysulfide/bromine (Ge et al., 2004, Price
et al., 1999, Zhao et al., 2005) systems. The attendance of distinct active species is
important because the crossover of active species affects all RFBs. Dual-active-species
19
RFBs frequently demand periodical electrolyte reactivation after long-term performance
(Arora, P. and Z. Zhang, 2004, Assink, 198
4, Wiedemann et al., 2005) because they can be irreversibly degraded when constituents
of the catholyte and anolyte merge or reach the electrode surfaces.
The first single-active-species RFB, which was based on vanadium, was first used
by Skyllas-Kazacos and co-workers (Skyllas-Kazacos et al., 1986). The aqueous all-
vanadium chemistry, which was patented in 1986, was recently the most studied RFB
system (Skyllas-Kazacos et al., 1986). In sulphuric acid at a pH of nearly zero, the
following VRB half-reactions occurred (Sum et al., 1985, Sum and Skyllas-Kazacos,
1985, Oriji et al., 2005, Li et al., 2011)
VO2+
+ 2H+ ↔ VO
2+ + H2O E=1.000 V vs. SHE (2.1)
V3+
+ e¯ ↔ V2+
E= -0.291 V vs. SHE (2.2)
Therefore, the overall cell reaction is
VO2+
+ 2H+ + V
2+ ↔ V
3+ + VO
2+ + H2O E = -1.291 V vs. SHE (2.3)
In addition, it is important to observe that the support acid in an all-vanadium RFB
supplies protons for the overall cell reaction, which makes the equilibrium cell potential
pH dependent. At the negative electrode, V(II) oxidises on the electrode surface as
V(III) and frees an electron during its release (Li et al., 2011). The electron crosses the
external circuit to the cathode and hydrogen ions pass through the membrane from the
anode compartment to the cathode compartment to sustain charge neutrality. At the
positive electrode, V(V) is reduced to V(IV), consuming two hydrogen ions and an
electron while producing water. During charging, energetic electrons are provided by an
external source, and the reactions at the positive and negative electrodes are reversed
(Watt-Smith et al., 2013).
20
The aqueous VRB can obtain coulombic efficiencies of 95 %. Thus, the majority of
the current input to the battery can be removed (Skyllas-Kazacos et al., 1986). Skyllas-
Kazacos et al. proposed that the coulombic efficiency was less than 100 %, mainly due
to crossover through the membrane. However, a second reason for reduced efficiency
could be water electrolysis, which occurs near the potential of the V(II)/V(III) redox
couple. Overall, energy efficiencies of 80-85 % were obtained, which were estimated
from the ratio of energy input to energy output (Kazacos and Skyllas-kazacos, 1989).
Many researchers have concentrated on adjusting the original VRB (Watt-Smith et
al., 2013, Huang et al., 2008, Zhao et al., 2006). Recent cell chemistry modifications
replace the V(IV)/V(V) couple because it is not steady in many popular membranes
(Shinkle et al., 2014, Zhang et al., 2012). The use of vanadium/bromide was examined
by Skyllas-Kazacos et al. (Skyllas-Kazacos et al., 2010) but resulted in a lower cell
potential, efficiency, and current density than the all-vanadium chemistry. Xue et al.
(2008) demonstrated that a vanadium/manganese system using manganese on the
positive electrode had an efficiency of 63 %, likely due to crossover through the
membrane. Several researchers reported using a vanadium/cerium (Paulenova et al.,
2002, Fang et al., 2002, Xia et al., 2002) flow cell with a cylindrical geometry. This
system was capable of reaching a coulombic efficiency of 90 % when applying a porous
Vycor frit in place of a costly proton exchange membrane. State-of-the-art RFB systems
use active-species concentrations of up to 3 M (Rahman and Skyllas-Kazacos et al.,
1998). These RFB systems achieved 60-70 % energy efficiencies, 75-85 % coulombic
efficiencies, and discharge potentials of nearly 1.5 V in an H-cell configuration (Hall et
al., 2008, Tsuda et al., 1997). Complex reactor designs have been successfully used to
increase the coulombic efficiencies to up to 97 % and the energy efficiencies to up to 86
% (Kazacos and Skyllas-kazacos, 1997) using IEM (Sukkar and Skyllas-Kazacos, 2003)
or microporous separators (Arora and Zhang, 2004).
21
Aqueous RFB systems are associated with several limitations, such as membrane
cost/stability, membrane crossover, water electrolysis, and low energy densities.
Membranes with small pore sizes and/or functionalization for enhancing ion selectivity
are used to mitigate crossover (Skyllas-Kazacos et al., 2011). The resistance of the
membranes increases as the pore size decreases, which results in an energy loss within
the battery system. Therefore, the chosen membrane must balance the resistance of the
membrane with crossover and the balance depends on the electrolytes used. For
example, the zinc/bromine system demands the use of a flocculent to stop crossover
(Lim et al., 1977, Barnartt and Forejt et al., 1964) or a constant separation process. The
all-vanadium system begins with similar complexes in both electrolytes and is crossover
resistant.
Many recent studies have focused on membrane stability due to the V(V) oxide
species in commercial membranes (Skyllas-Kazacos et al., 2011). Most early research
of VRBs included Nafion membranes (sulfonic-acid ionomer membranes with
perfluorinated backbones), which have low ionic resistances and outstanding selectivity.
However, due to cost cuts, a host of commercially available membranes were examined.
The Nafion and ―New Selemion anion exchange membrane‖ are known to supply
sufficient stability. Both membranes have similar costs (Skyllas-Kazacos et al., 2011).
In addition, membranes based on cross-linked, sulfonated polyethylene (called
―Daramic‖) separator materials have been manufactured (Mohammadi and Skyllas-
Kazacos, 1995).
One fundamental issue with aqueous RFBs is their relatively narrow stability
window (1.23 V, not accounting for the over potential associated with water-splitting),
which is limited by water electrolysis (Sum et al., 1985). Thus, it is difficult to achieve
long term cycling of aqueous VRB without losing some water to the formation of
hydrogen (Sum and Skyllas-Kazacos, 1985).
22
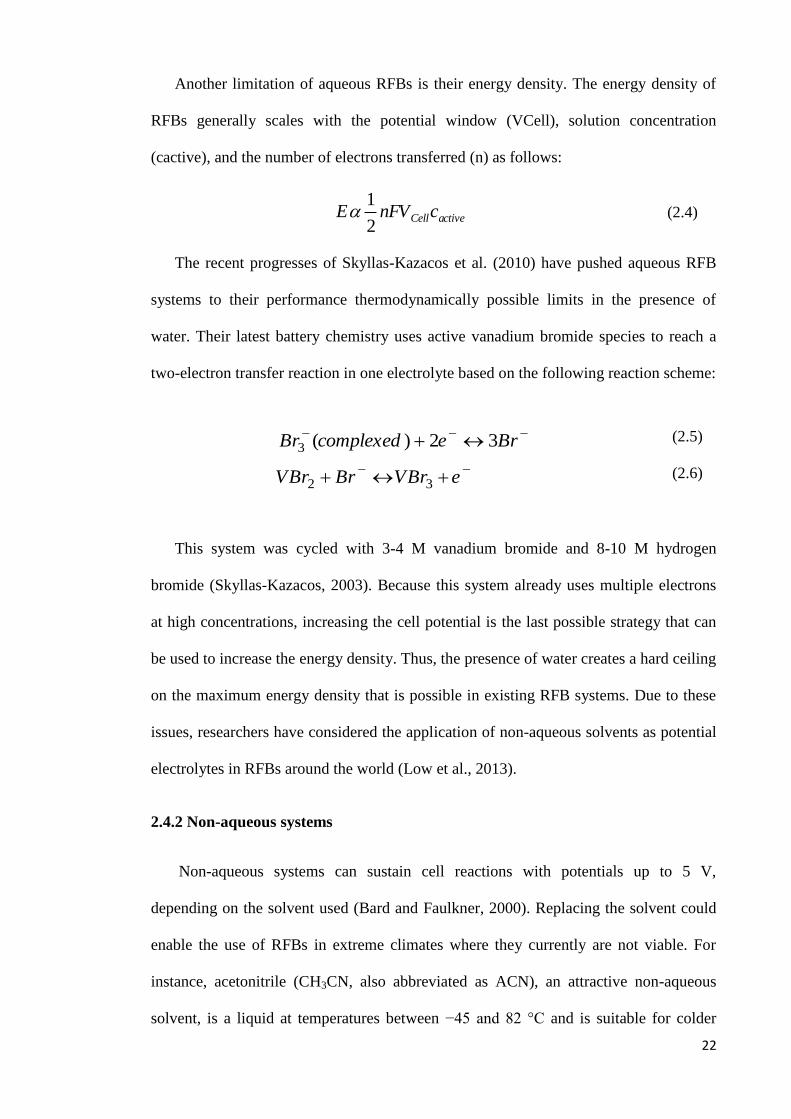
Another limitation of aqueous RFBs is their energy density. The energy density of
RFBs generally scales with the potential window (VCell), solution concentration
(cactive), and the number of electrons transferred (n) as follows:
1
2Cell activeE nFV c
(2.4)
The recent progresses of Skyllas-Kazacos et al. (2010) have pushed aqueous RFB
systems to their performance thermodynamically possible limits in the presence of
water. Their latest battery chemistry uses active vanadium bromide species to reach a
two-electron transfer reaction in one electrolyte based on the following reaction scheme:
This system was cycled with 3-4 M vanadium bromide and 8-10 M hydrogen
bromide (Skyllas-Kazacos, 2003). Because this system already uses multiple electrons
at high concentrations, increasing the cell potential is the last possible strategy that can
be used to increase the energy density. Thus, the presence of water creates a hard ceiling
on the maximum energy density that is possible in existing RFB systems. Due to these
issues, researchers have considered the application of non-aqueous solvents as potential
electrolytes in RFBs around the world (Low et al., 2013).
2.4.2 Non-aqueous systems
Non-aqueous systems can sustain cell reactions with potentials up to 5 V,
depending on the solvent used (Bard and Faulkner, 2000). Replacing the solvent could
enable the use of RFBs in extreme climates where they currently are not viable. For
instance, acetonitrile (CH3CN, also abbreviated as ACN), an attractive non-aqueous
solvent, is a liquid at temperatures between −45 and 82 °C and is suitable for colder
3
2 3
( ) 2 3Br complexed e Br
VBr Br VBr e
(2.5)
(2.6)
23
climates, while dimethylformamide is a liquid between −61 and 153 °C. OCP potential
as high as 2.6 V were reported using acetonitrile, but overall energy efficiency was
limited to 40% (Matsuda et al., 1988). Non-aqueous solvents permit the use of many
high-energy RFB reactions and will thus be the focus of this dissertation. There are
several reports of non-aqueous RFBs using chemistries based on uranium, ruthenium,
manganese, chromium, and vanadium (Chakrabarti et al., 2007, Yamamura et al., 2002,
Liu et al., 2009, Sleightholme et al., 2011, Liu et al., 2010).
Matsuda et al. (1988) studied ruthenium complexes (ruthenium acetylacetonate and
tris(2,2‘-bipyridine) ruthenium (II) tetrafluoroborate) in non-aqueous electrolytes for
RFB applications. They employed tetraethylammonium tetrafluoroborate (TEABF4) as
the supporting electrolyte and CH3CN as the solvent. Cyclic voltammetry experiments
showed a cell voltage of 2.6 V for the system. The conductivity was optimised, and
charge/discharge experiments were performed to determine the efficiency. The optimum
efficiency as a function of active-species concentration occurred in the range of 0.02-
0.05 M, while very low efficiencies were observed for concentrations greater than 0.1 M
or less than 0.01 M. Crossover of active species is expected to be the cause of the low
efficiencies at high concentrations due to the increased diffusion driving force (Matsuda
et al., 1988).
A paper published in 2007 by Chakrabarti and co-workers reported
charge/discharge curves from an investigation of the feasibility for RFBs of ruthenium
and iron complexes (ruthenium acetylacetonate, tris(2,2‘-bipyridine)ruthenium (II)
tetrafluoroborate, tris(2,2‘-bipyridine)iron (II) perchlorate, and rubrene) in CH3CN with
TEABF4 as a supporting electrolyte (Chakrabarti et al., 2007). The results from these
non-aqueous systems were compared with those for aqueous VRB. OCPs of 1.77 V and
2.41 V were measured for the ruthenium and iron complexes, respectively.
Charge/discharge experiments on the ruthenium system revealed the behaviour shown

24
in Figure 2.4. Chakrabarti et al. (2007) attributed the unexpected increase in potential at
1000 minutes to a side reaction and stopped charging at 12% of the theoretical capacity.
The discharge voltage corresponding to this charge cycle was also low (1.3 V).
Figure 2.4: Charging profile for 0.1 M ruthenium acetylacetonate and 1 M TEABF4 in
CH3CN at a current of 1 mA (Chakrabarti et al., 2007).
Chakrabarti et al. (2011) also recently reported the use of a ruthenium active
species (ruthenium acetylacetonate) within a novel cell design. These experiments were
performed using a membrane-less flow cell based on two counter current laminar flow
streams, with the same electrolyte on each side of the battery. To keep the flow laminar,
very low flow rates were employed to reduce the propensity for crossover; in spite of
the control of the flow, the voltage efficiency was 55%. To test the feasibility of the
flow-cell design, Chakrabarti et al. (2013) also studied the operation of several other
RFB chemistries in the laminar flow-cell configuration. The aqueous all-vanadium
system had the highest energy efficiency, at 13.4%, using a 0.02 M vanadium solution.
Yamamura et al. (2002) worked on uranium RFB in 2002 as a creative way to apply
depleted uranium. They succeeded in changing the solubility by three orders of
magnitude by changing the structure of the ligand in the metal complex. Unfortunately,
the electrochemistry resulted in cell potentials of only 1.0 to 1.2 V, and significant

25
amounts of ligand shedding (with corresponding irreversible loss of active material)
occurred with cycling. The reactions were stated to be:
U3+
↔ U4+
+ e¯ E= -0.52 V (2.7)
UO22+
+ e¯↔ UO2 E= 0.16 V (2.8)
Different limitations are associated with non-aqueous RFB technologies. RFBs
have been recognised to have low solubility limits of active species and supporting
electrolytes, resulting in low energy densities. They also have low internal conductivity,
resulting in high overpotentials, and additional safety concerns related to aqueous
systems (Weber et al., 2011, Li et al., 2009, Soloveichik et al., 2011). The high cost of
organic solvents and their high vapour pressures introduce severe restrictions to the
system (Low et al., 2013). For these reasons, as well as concerns regarding the safe
handling of organic and flammable solvents, alternative non-aqueous solvents are
required that could provide a high potential window of operation without having the
inherent disadvantages of their organic counterparts. Ionic liquids and deep eutectic
solvents appear to have some answers to overcome these issues (Chakrabarti et al.,
2014).
2.5 Introduction to ILs
ILs, also called molten salts, are defined as liquid mixtures of cations and anions
that melt below 100 °C and are stable up to 300°C (Galinski et al., 2006, Zhao et al.,
2012). Structurally, they contain cations, which are usually organic compounds, and
anions of inorganic or organic components. The ions in ILs are large and bulky, with the
cationic component inclined to have a very low degree of symmetry (Zhang et al.,
2006). Due to the poor packing associated with the asymmetric nature of ILs, crystal
forming is restrained and ILs remain liquids over a wide range of temperatures. By

26
careful selection of these components, it is possible to prepare ILs that are liquids
around and below room temperature, which has initiated great interest in them
(Plechkova et al., 2008). The first IL formed, [EtNH3] [NO3], which has a freezing point
of 12 °C, was introduced in 1914 by Paul Walden. However, interest in them remained
at a low level until the detection of binary ionic liquids prepared from mixtures of N-
alkylpyridinium and aluminium(III) chloride (Chum, 1975) or 1,3-dialkylimidazolium
chloride (Wilkes, 1982). The key problem of chloroaluminate-based ILs was their
instability in the presence of water and air. In addition, they are reactive towards various
organic compounds, which restricted their application. In 1970, a work was presented
for developing ILs as electrolytes for batteries and space probes (Chen, 2001, Keskin et
al., 2007) that required molten salts to operate. These molten salts were hot enough to
damage nearby materials, so researchers sought salts that remained liquid at lower
temperatures. They ultimately recognised pyridinium and alkyl-substituted imidazolium
cations with tetrahalogenoaluminate or halide anions as suitable for this purpose. Wilkes
and co-workers (1982) upgraded particular ILs for use as battery electrolytes. In the
1980s, imidazolium-based cations were found to have better properties, such as
air/moisture stability and more potential for variation (Kölle and Dronskowski, 2004,
Sheldon et al., 2002, Carmichael and Seddon, 2000, Aki et al., 2001). In the 1990s,
applications of air-stable ILs such as 1-n-butyl-3-methylimidazolium
hexafluorophosphate ([bmim][PF6]) and 1-n-butyl-3-methylimidazolium
tetrafluoroborate ([bmim][BF4]) as well as water-stable ILs were enhanced quickly to
the extent that ILs became among the most promising solvents in chemical processes
(Wasserscheid et al., 2002, Aki et al., 2001).
Common ionic liquids consist of ammonium, phosphonium, sulfonium,
imidazolium, lithium, pyridinium, thiazolium, oxazolium, picolinium, triazolium or
pyrrolidinium as the cationic component and bromide, chloride, nitrate, aluminium
27
chloride, iodide, benzoate, and acetate as the anionic component. ILs are referred to as
designer solvents due to the wide range of possible cation and anion combinations that
enables the tuning of properties such as melting point, viscosity, density, polarity,
refractive index and hydrophobicity to satisfy the requirements of a particular process
(Kirchner et al., 2010, Zhang et al., 2006).
ILs can be sorted into two principal classes: (1) simple salts (single anion and cation)
and (2) binary ILs (salts where equilibrium is included). For example, [EtNH3][NO3] is
a simple salt, while the mixture of 1,3-dialkylimidazolium chloride and aluminium(III)
chloride (a binary IL system) consists of several different ionic species, and its melting
point and properties depend upon the mole fractions of the two components (Earle and
Seddon, 2000).
Due to severe regulations imposed on industry, the application of common organic
solvents such as diethyl ether, toluene or methanol is limited. In contrast, ILs are green
solvents that are not subject to these restrictions (Keskin et al., 2007).
The synthesis of ILs usually includes two phases: the formation of the desired cation
followed by anion exchange to give the desired product. The cation should be
unsymmetrical and have a poorly localised positive charge, stopping the formation of a
regular lattice and thereby decreasing the melting point of the resulting salt (Rauter et
al., 2010).
The synthesis of ILs generally starts with the quaternisation of an amine, an imidazole
or phosphine to produce the cationic component (Wilkes et al., 1982, and Wasserscheid
and Keim, 2000). Examples of ILs that can be formed by direct quaternisation are
[EMIM]CF3SO3 and [BMIM]Cl (Wasserscheid and Keim, 2000). An anion exchange
reaction is another method for synthesising ILs. It is achieved by using one of three
methods:

28
i) Metathesis of a halide salt with a salt of the desired anion:
Generally, imidazolium and pyridinium halides can be acquired using this method.
These types of reactions are divided into two classes depending on the water
solubility of the object IL. One is metathesis by free acids or ammonium salts of alkali
metals, and another one is metathesis by silver salt. The production of water-miscible
ILs is difficult because it demands separation of the by-products from the desired IL.
For instance, 1-ethyl-3-methylimidazolium tetrafluoroborate [C2mim][BF4] was
produced in 1992 by the metathesis reaction of 1-ethyl-3-methylimidazolium iodide
[C2mim]I and silver tetrafluoroborate (AgBF4) in methanol. The metathesis reaction is
able to synthesise novel ILs, but they are contaminated with a small quantity of halide
ions that may react with the solute materials (Wilkes and Zaworotko, 1992, Bao et al.,
2003).
ii) Acid-base neutralisation:
Monoalkylammonium nitrates are produced by the neutralisation of aqueous solutions
of a base with nitric acid. The ILs are separated by removing extra water under vacuum.
In a similar reaction, tetraalkylammonium sulfonates are synthesised mixing sulfonic
acid and tetraalkylammonium hydroxide. To ensure the purity of the ILs, they were
dissolved in either tetrahydrofuran or acetonitrile and treated with activated charcoal for
at least 24 h, and the organic solvent was ultimately removed under vacuum
(Wasserscheid and Keim, 2000).
iii) Direct combination of a halide salt with a metal halide:
Halogenaluminate(III)- and chlorocuprate(I)-based ILs are prepared by this method.
However, chlorocuprate(I) ILs are sensitive to oxygen and have not established
widespread usage in synthesis (Wasserscheid and Keim, 2000).
29
2.5.1 Physical properties of ILs
Recently, much interest has been generated in ILs for their potential use as solvent
media due to their unique combination of properties. As it is possible to change the
structure of ILs, it is also possible to tune their physical properties as needed (Zhao and
Baker, 2013, Menne et al., 2013, Shiddiky and Torriero et al., 2011). They are good
solvents for a wide variety of inorganic and organic components. Therefore, it is
possible to bring unusual combinations of reagents into a single phase. ILs have the
potential to be highly polar yet non-coordinating solvents, as they are composed
principally of poorly coordinating ions. ILs are also immiscible with a large number of
organic solvents and therefore supply a non-aqueous, polar alternative for two-phase
systems. They are ordinarily non-volatile (Bhatt et al., 2007, Bhatt et al., 2008, Earle et
al., 2006, Wasserscheid and Keim, 2000).
ILs have lower melting or freezing points than do traditional inorganic salts. Alkali
metal chlorides such as KCl and NaCl have high melting points of 772 °C and 801 °C,
respectively. When the cation is replaced with a suitable organic cation such as
[BMIM]+ or [EMIM]
+, the melting points drastically decrease to 65 °C and 87 °C,
respectively (Wilkes et al., 1982). Cations with low symmetry and poor intermolecular
bonding are responsible for the lowering of the melting point of ILs. The melting point
can be further reduced by increasing the anion size, such as by replacing the chloride
ions with [BF4], [PF6] or [CF3CO2]. For instance, 1-butyl-3- methylimidazolium
chloride [BMIM]Cl has a melting point of 65 °C, whereas [bmim] [PF6] has a melting
point of 6.5 °C (Wilkes et al., 1982).
The fact that ILs have no measurable vapour pressure is one of their defining
characteristics (Earle et al., 2006, Wasserscheid and Keim, 2000). For instance, [bmim]
[PF6] has an extremely low vapour pressure of 100 Pa at 298 K compared to 3 kPa at

30
298 K for water. However, Earle and co-workers have shown that a number of
imidazolium- and pyridinium-based ILs can be distilled under vacuum at 200-300 °C
and then re-condensed at lower temperatures, for example, the distillation of
[hmim][NTf2] at a pressure of 0.07 mbar and a temperature of 200 °C (Earle et al.,
2006).
The density of ILs is generally on the order of 1 to 1.6 g cm-3
. These values are typically
higher than those of water and organic solvents (Jacquemin et al., 2006, Jacquemin et
al., 2008). The density increases with the decreasing length of the alkyl chain present in
the imidazolium cation (Wilkes, 2004) and with an increase in the molecular mass of
the anion in the approximate order [FAP]> [NTf2] > [PF6] > [OTf] > [BF4] (Barrosse-
Antle et al., 2010). Various groups have reported an approximately linear decrease of
density with temperature. The density is significant in establishing the kinematic
viscosity, which plays an important role in rotating disk and other hydrodynamic forms
of voltammetry experiments (Dzyuba and Bartsch, 2002, Gu and Brennecke, 2002,
Fredlake et al., 2004).
The viscosity of ILs is a significant consideration in electrochemical studies due to
its strong effect on the rate of mass transport within a solution (Wu et al., 2011). ILs
tend to be more viscous than conventional organic solvents. The strength of their van
der Waals interactions and their tendency to form hydrogen bonds are the main factors
that contribute to the viscosity of ILs (Bonhote et al., 1996). The impact of van der
Waals forces on viscosity is apparent in some hydrophobic ILs that include fluorinated
anions, such as [BMIM][CF3SO3], which has a viscosity of 90 cP at 20 °C (Bonhote et
al., 1996). The structure of the cation also affects the viscosity of ILs. Larger or
fluorinated alkyl side chains have stronger van der Waals forces and thus show a higher
viscosity. Lower viscosities are inclined to be the result of low molar mass side chains
that have high mobility. Abbott has proposed an explanation for this using a hole theory

31
that supposes the generation of empty spaces when an ionic component melts due to
thermally generated fluctuations in the local density (Abbott, 2004).
As with any solvent used in an electrochemical process, the conductivity of an IL is
of critical importance (Buzzeo et al., 2004). ILs have conductivities equivalent to
organic solvents with supplemented inorganic electrolytes but not significantly larger
(Endres and Zein El Abedin, 2006). While their absolute conductivity is a small
improvement over conventional non-aqueous solvents, ILs propose the advantage that
this property is inherent to the pure liquid and does not demand the addition of a
separate salt (O'Mahony et al., 2008). This could be advantageous in the investigation of
reactions in which a supporting electrolyte may interfere or can simplify the removal
and purification of the product from an electrosynthetic process. Among several IL
structures, conductivity appears to be most strongly linked to viscosity, most likely
because of the correlation between viscosity and ion mobility (Buzzeo et al., 2004). For
a single anion with a range of cations, conductivity usually increases in the order
tetraalkylammonium > N,N-dialkylpyrrolidinium>1-alkyl-3-methylimidazolium, and
this has been related to an increase in the planarity of the cationic core; the flatness of
the imidazolium ring appears to give a higher conductivity than the tetrahedral
arrangement of alkyl groups in the ammonium salts, with the pyrrolidinium-based ILs
adopting an intermediate geometry and conductivity (MacFarlane et al., 1999).
Hagiwara and co-workers reported the synthesis of an IL that is significantly more
conductive than all of those considered above (Hagiwara et al., 2002). This salt was
produced by the reaction of 1-ethyl-3-methylimidazolium (EMIM) chloride with
anhydrous hydrogen fluoride. A conductivity of 100 mΩ-1
cm-1
at 298 K was reported,
along with a very low viscosity of 4.85 mPa (Hagiwara et al., 2002, Buzzeo et al.,
2004).
32
A solvent is only appropriate for managing a range of electrochemical processes on
species dissolved within it if these species are more simply reduced or oxidised than the
solvent itself. In ILs, it is usually discovered that the component anions are oxidised at
adequately wide potentials and that at sufficiently low ones, the organic cations endure
reduction (Hultgren et al., 2002). An itemised comparison of several potential windows
(PWs) studied in the literature is not feasible for a number of reasons:
i) The presence of electroactive impurities can limit the true PW where the purity of an
IL is uncertain.
ii) The potential for solvent breakdown may differ slightly on different electrode
surfaces.
iii) The data are studied relative to different reference and quasi-reference systems that
cannot be easily interconverted (Hultgren et al., 2002, Evans et al., 2003, Buzzeo et al.,
2004).
Many voltammetric examinations performed in IL solvents have used quasi-reference
electrodes, often silver or platinum wires (Boxall et al., 2002, Quinn et al., 2002,
Bahadori et al., 2013, Zhang et al., 2003). The PWs in an aprotic organic solvent
containing supporting electrolytes can be much wider, for instance, 3.5 V for
dichloromethane, 4.4 V for dimethylsulfoxide and 5.0 V for acetonitrile (Bard and
Faulkner, 2001) Some aprotic ILs also contain wide PWs in the range of 4.0 to 6.0 V
(Buzzeo et al., 2004) due to the strengths of the cations and anions in their structure.
The PWs discovered in protic ILs have been discussed in detail and are usually smaller
than those studied in aprotic ones due to the ease of the reduction of the proton (Zhao et
al., 2008). The size of the window is dependent on the electrode potential and
voltammetric data, as well as the particular cation and anion admixture employed and
the electrode material. Moreover, the PW is calculated in a pure solvent and may differ
from those established in the presence of solutes. For instance, imidazolium salts may
33
be restricted in the negative potential area, as the reduction of this IL cation is catalysed
by radical anions present at negative potentials. Large PWs in ILs have been used in
electrodeposition investigations in which definite metals and semi-conductors have been
deposited at potentials that are out of the range of conventional solvents (Endres and
Zein El Abedin, 2006). Hultgren and co-workers have reported the use of the
organometallic reference redox as a voltammetric reference standard for ILs (Hultgren
et al., 2002). When examined in [BMIM][PF6], a reversible, one-electron reduction
process was achieved for Cc+ with a potential independent of electrode material, scan
rate and concentration. Fc was discovered to be poorly soluble in this metallocene, but it
may function as a less costly alternative to other ILs.
All the discussion above is general and based on the most commonly employed ILs.
Nonetheless, it should be observed that there are many ILs that include different anions
and cations, and their properties cover a large range. Hence, the above statements
should not be applied in a general manner to all synthesised ILs and to those designed in
the future (Keskin et al., 2007).
2.5.2 Applications of ILs in electrochemical engineering based processes
These compounds are liquid over a wide range of temperatures (down to −81 °C),
possess high thermal and chemical stability as well as high density and electrical
conductivity in comparison to other solvents (Suarez et al., 1998, Dullius et al., 1998).
Due to such advantages, ILs have enjoyed plenty of applications as electrolytes in
sensors (Wei and Ivaska, 2008), electrochemical capacitors (Lu et al., 2009), lithium ion
batteries (Galinski et al., 2006), lead acid batteries (Rezaei et al., 2006), dye-sensitized
solar cells (Jhong et al., 2009) and fuel cells (De Souza et al., 2003) amongst many
others (Lloyd et al., 2011, Armand et al., 2009). Several reviews are dedicated to the
electrochemistry of ILs (Armand et al., 2009, Endres, 2004, Buzzeo et al., 2004, Abbott
34
et al., 2007). While ILs have many inherent advantages, issues such as complex
synthetic steps (Shahbaz et al., 2011), cost, lack of toxicity data and availability limit
their practical use for large scale applications (Abbott et al., 2007).
2.5.2.1 Electrochemical applications of ILs in metal processing
Ambient temperature ILs have been applied for the extraction of gold and silver
from a mineral matrix (Whitehead et al., 2004). Some work has also been carried out on
the electrowinning of aluminum from ILs (McCluskey et al., 2002). In the application of
ILs and DESs to metal processing the major advantage is a significant reduction in
the volume of aqueous streams required (Abbott et al., 2011).
Some ILs have been designed to contain ions which are known to have lower
toxicity than normal and these include functionalized imidazoles (Gathergood et al.,
2006), lactams (Du et al., 2005), amino acids (Fukumoto et al., 2005) and
choline (Abbott et al., 2003). It is only the last of these that have been extensively
applied to metal processing (Abbott et al., 2011). Electrodeposition of metals from ILs
became an area of periodic research from the 1930s onwards (Audrieth et al., 1936).
The first major breakthrough was the development of protic haloaluminate eutectics in
the 1950s by Hurley and Wier (1951). A further improvement was the development of
the aluminum chloride and 1-methyl-3-ethylimidazolium chloride (AlCl3 and EMIM-
Cl) system in the 1980s (Lloyd et al., 2011). The biggest drawback of chloroaluminate
systems was their reactivity with water, which drastically limited their applications.
Since the early 1990s attention was shifted to the use of other anions, for instance
bis(trifluoromethyl)sulfonylamide [N(CF-SO2)2−], which resulted in liquids that were
stable in the presence of air and water. Recently, metal nanoparticles stabilized by ILs
have been synthesized with some unique properties (Shan et al., 2008). Dupont and co-
workers reported that iridium nanoparticles stabilized by the imidazolium IL showed a
35
large increase in activity for the biphasic hydrogenation of various olefins and arenes
under mild reaction conditions (Fonseca et al., 2003, Dupont et al., 2002). Itoh and co-
researchers (2004) Synthesized AuNPs (gold nanoparticles) modified by an
imidazolium cationic based IL. The IL-modified AuNPs could change color in aqueous
solutions via anion exchange of the IL moiety (Shan et al., 2008). Tatumi and Fujihara
(2005) reported that gold nanoparticles stabilized by a zwitterionic imidazolium
sulfonate-terminated thiol exhibited a remarkably high stability in aqueous solutions
with high concentrations of electrolytes, ILs, and proteins. Metal nanoparticles, as
discussed above, were all stabilized by small IL derivatives. Other workers synthesized
a gold-nanoparticle-containing an IL derived polymer by conducting the UV irradiation
of 1-decyl-3-vinylimidazolium chloride in the presence of an aqueous solution of
HAuCl4 (chloroauric acid) (Shan et al., 2008, Batra et al., 2007).
2.5.2.2 Destruction of halogenated hydrocarbons
Recently, the superoxide ion was intensively investigated by researchers using
numerous solvents (Hayyan et al., 2012). For ILs, generation of the superoxide ion by
electro-reduction of O2 in imidazolium chloride–aluminum chloride molten salt was
reported by Carter and co-workers. These researchers found that the generated
superoxide ion was unstable and could not be utilized in reactions (Carter et al., 1991).
In spite of this, AlNashef and co-researchers managed to stabilize the generated
superoxide within the imidazolium based ILs in separate investigations (AlNashef et al.,
2001, AlNashef et al., 2002). This work was further extended to report the successful
destruction of chlorobenzenes in ILs such as [MOPMPip+][TFSI
−] {1-(3-
methoxypropyl)-1-methylpiperidinium bis (trifluoromethylsulfonyl) imide} and
[HMPyrr+][TFSI
−] {1-hexyl-1-methyl-pyrrolidinium bis (trifluoromethylsulfonyl)
imide} under ambient conditions (Hayyan et al., 2012).
36
2.5.2.3 Electrochemical energy storage applications
During the last few years there has been increasing interest in ILs as electrolytes for
lithium or lithium-ion batteries (Armand et al., 2009, Lewandowski and Swiderska-
Mocek et al., 2009). The formation of the solid electrolyte interface (SEI) on the anode
surface is critical to the correct operation of the system. ILs used as electrolyte
components in Li-ion batteries are quaternary ammonium salts, such as those based on
the tetraalkylammonium [R4N+] ion or cyclic amines that may be both aromatic
(pyridinium, imidazolium) and saturated (piperidinium or pyrrolidinium) in nature. A
good example of some typical ILs applied for Li-ion batteries is the N-butyl-N-
methylpyrrolidinium bis (trifluoromethanesulfonyl) imide (PYR14TFSI) (Appetecchi et
al., 2009, Kuhnel et al., 2011). PYR14TFSI is an air-stable, hydrophobic IL with very
good thermal stability (up to 300 °C) as well as promising conductivity and viscosity at
20 °C (1.85 mS cm−1
and 95 mPa s, respectively) (Liang et al., 2001). In addition, liquid
imidazolium salts show stability of ca. 4 V, while piperidinium and pyrrolidinium or
tetraalkylammonium salts, especially based on the imide anion, show stability at the
level of ca. 6 V. Such stability is sufficient towards the use of ILs as electrolytes in Li-
ion batteries (Lewandowski and Swiderska-Mocek, 2009). There are no systematic
studies on transport numbers of Li+ containing ILs. This is a significant missing link in
the literature as low values of lithium transportation numbers may lead to a
concentration polarization of the battery (Chakrabarti et al., 2014).
The electric double layer capacitor (EDLC) is an energy storage device based on
the operating principle of the electric double layer that is formed at the interface
between an activated carbon material and an electrolyte (McEwen et al., 1997, Yuyama
et al., 2006, Sato et al., 2004). This device stores electricity physically and lacks the
chemical reactions found in rechargeable batteries during charging and
37
discharging (Yuyama et al., 2006). Various solvents and salts (solutes in other word) are
available, offering specific advantages such as high capacitance and low temperature
performances (Sato et al., 2004). Generally, an organic electrolyte that is a solid
quaternary ammonium salt, such as N,N,N,N-tetraethylammonium-tetrafluoroborate
(TEA-BF4), dissolved in propylene carbonate (PC, which has a high dielectric constant),
has been used for high voltage EDLCs of 2 V or more. When compared to rechargeable
batteries, the EDLC has a remarkably long cycle life and high power density (Sato et al.,
2004, Largeot et al., 2011).
ILs generally have high viscosity so that their ionic conductivity is lower than that
of common organic electrolytes. This may cause a deterioration of power density in
EDLCs (Handa et al., 2008). The decrease in viscosity of ILs is, therefore, essential for
improving the EDLC's performance. In the recent past, ILs based on imidazolium salts
have been widely investigated because they have relatively low viscosity and high ionic
conductivity (Yuyama et al., 2006, Zhou et al., 2004, Ue et al., 2003, Yoshida et al.,
2007, Lockett et al., 2008). For example EDLCs prepared with EMI-FSI [1-ethyl-3-
methyl imidazolium bis(fluorosulfonyl)imide] show good performance despite the
presence of a binder in an activated carbon-based electrode (Handa et al., 2008). The
self-discharge is suppressed by using the IL. A cycling durability test show that the cell
with EMI-FSI keeps over 90% of the initial capacitance even after 10,000 cycles.
As low-volatility conductive media with good thermal stability, ILs are finding
applications as fuel cell electrolytes and as proton conductors in proton exchange
membranes, often in combination with polymer gels (Galinski et al., 2006, MacFarlane
et al., 2007, Devanathan, 2008). Typically, ―protic‖ ILs, formed through the reaction of
a strong acid with a base, is used as proton conductors.
38
Several systematic studies on the use of ILs in fuel cells have been reported and
promising results were obtained (Nakamoto and Watanabe, 2007, Fernicola et al., 2008,
Sekhon et al., 2006). An efficiency of 67% was achieved using ILs such as 1-butyl-3-
methylimidazolium tetrafluoroborate [BMI][BF4] as electrolytes in an alkaline fuel
cell (De Souza et al., 2003) for instance. Watanabe and co-workers show that some ILs
are electro-active for H2 oxidation and O2 reduction under non-humidifying
conditions (Susan et al., 2003). In addition, some reports on utilizing ILs to substitute
water in Nafion™ or directly as a liquid electrolyte for laboratory fuel cells are also
available in literature (De Souza et al., 2003, Doyle et al., 2000). The use of IL aqueous
solutions for wetting the membrane electrode assembly (MEA) used in fuel cells yield
an impressive performance enhancement (Padilha et al., 2010). Compared with the
classic polymer electrolyte membrane fuel cell (PEMFC), which uses only water on the
polymeric membrane, the IL-PEMFC, using [BMI][BF4] IL aqueous solutions,
enhances the current density 50-fold, the power density 73-fold and increases the
overall efficiency by 21% (De Souza et al., 2003, Padilha et al., 2010).
The application of ILs as membranes in fuel cells have also been reported (Ye et al.,
2008). For example polybenzimidazole membranes nano impregnated with phosphoric
acid have been studied as electrolytes in PEMFCs for more than a decade (Asensio et
al., 2010). Novel membranes consisting of an anhydrous proton solvent H3PO4, the
protic IL propyl-3-methylimidazolium di-hydrogen phosphate and polybenzimidazole
(PBI) as a matrix have also been prepared and characterized for PEMFCs intended for
operation at elevated temperatures (120–150 °C) (Ye et al., 2008). More recently,
several copolymers and related derivatives have attracted many researchers‘ attention,
adding variety to the field (Asensio et al., 2010). Besides phosphoric acid, many other
strong inorganic acids, as well as alkaline electrolytes have been used to impregnate
benzimidazole membranes. However, phosphoric acid-doped PBI membrane-based fuel

39
cells are not good for a pure hydrogen feed, and they provide inferior performance to
that of Nafion-based fuel cells. Therefore they do not show much promise in
comparison to perfluorosulfonic acid ionomer membranes, especially at temperatures
less than 80 °C (Zhang and Shen, 2012).
2.5.2.4 Dye sensitized solar cells (DSSCs) for renewable energy storage
Till now, ILs based on imidazolium salts have been widely used as solvents for
DSSCs (Jhong et al., 2009). Unfortunately, pure imidazolium iodide/triiodide ILs are
too viscous and obstruct the diffusion of the redox couple (I−/I3
−) in the electrolyte,
thereby hampering device performance. The use of some binary IL electrolytes allows
the reduction of electrolyte viscosity. It has been reported that ethylmethylimidazolium-
based ILs with anions including tetracyanoborate (B(CN)4), tricyanomethanide (TCM),
dicyanamide (DCA) and thiocyanate (SCN) appear to be promising for high
performance DSSCs incorporating pure imidazolium iodide (Kuang et al., 2006,
Gratzel, 2001, Wang et al., 2005, Wang et al., 2003, Wang et al., 2004). Then again,
their applications as electrolytes in DSSCs are limited by their high costs and
toxicological issues (Jhong et al., 2009, Gratzel, 200). The same is true for ether-
functionalized imidazolium iodides due to their high viscosities and low
conductivities (Tang et al., 2012). Therefore, better alternatives are considered
necessary for practical applications.
2.5.2.5 Applications of ionic liquids in redox flow batteries
A room temperature molten salt consisting of 1-ethyl-3-methylimidazolium chloride
(EMICl) and aluminum trichloride (AlCl3) was found to have low melting point and a
wide electrochemical potential window for applications in RFBs (Katayama et al.,
2002). A number of metal chlorides were found to dissolve in EMICl–AlCl3 molten salt

40
due to its adjustable Lewis acid–base property. Most of the soluble redox couples have
been reported and studied under basic conditions (Gau and Sun, 1996, Anderson et al.,
1991, Sun and Hussey, 1989, Strubinger et al., 1990, Lipsztajn and Osteryoung, 1985)
probably because the metal species of several high oxidation states were stabilized after
forming chloro-complexes (Katayama et al., 2002). This fact was confirmed in a
separate study whereby the Fe(III)/Fe(II) electron transfer process was irreversible in
acidic ionic liquids, while this redox reaction became reversible in basic ionic liquids
probably due to complex formation (Yamagata et al., 2007).
The standard formal potentials of the redox couples of various metal chloro-
complexes were found to be distributed widely within the electrochemical potential
window of a basic EMICl–AlCl3 molten salt (Katayama et al., 2002). As a consequence,
rechargeable RFBs having high cell voltages were envisaged by combining these redox
couples in a basic EMICl–AlCl3 molten salt. The redox reactions of some transition
metals, such as iron, samarium, europium and ytterbium in BMPTFSI [BMP+, 1-n-
butyl-1-methylpyrrolidinium; TFSI−, bis(trifluoromethylsulfonyl)imide] ionic liquid
were investigated as the negative and positive electrode reactions of the RFB (Yamagata
et al., 2006). Among these studies, it was found that the redox reactions of M(III)/M(II)
(M=Fe, Sm, Eu and Yb) were quasi-reversible or irreversible when M(III) or M(II) was
introduced into BMPTFSI by dissolving M(TFSI)n (n=2 or 3) and that the diffusion
coefficients of M(III) or M(II) were less than ~10−7
cm2 s
−1 (Yamagata et al., 2007).
These results suggested that the interaction between these metallic species and
TFSI− anions led to the formation of complexes such as Mx(TFSI)y
−, which caused
slow electrode kinetics and low diffusivity. This complex formation was important for
understanding the redox reactions of metallic species in BMPTFSI. With regard to
bromo- and chloro-aluminate ionic liquids, it was reported that the electrochemical
41
behavior of iron species was affected by the Lewis acidity of the ionic liquids (Laher
and Hussey, 1982, Nanjundiah et al., 1982).
In another study, the redox reactions of some lanthanides were examined as the
candidates for the half cell reactions of the RFB using 1-ethyl-3-methylimidazolium and
1-n-butyl-1-methylpyrrolidinium bis(trifluoromethanesulfone) imide (EMITFSI and
BMPTFSI) molten salt systems. Unfortunately, cyclic voltammetry indicated that the
redox reaction of the Eu(III)/Eu(II) couple was irreversible electrochemically. The slow
electrode kinetics may have been due to the formation of some complexes of Eu(III)
probably with TFSI−, which was suggested by UV–vis spectroscopy (Skyllas-Kazacos
et al., 2011).
Very recently, Sandia National Laboratories have developed new types of metallic
based ionic liquids for applications in RFBs (Pratt et al., 2013). The compounds consist
of manganese, iron, cobalt, nickel, copper, zinc, or cerium coordination cations and
weakly coordinating anions such as 2-ethylhexanoate, triflate, triflimide, or
tetrafluoroborate that may simultaneously act as a solvent and electrolyte(Anderson et
al., 2010, Pratt et al., 2011, Hoogerstraete et al., 2012). Most compounds are quite
inexpensive to produce and some show promising viscosity, conductivity or
electrochemical reversibility (Pratt et al., 2013). Theoretical calculations show that
metal ion concentrations up to 6.5 M are possible in the ILs thereby opening up
windows for future high energy density RFBs. From preliminary investigations that
considered the application of methylimidazolium iron chloride molten salt system in
RFB applications (Katayama et al., 2002), it was predicted that if a sodium chloride–
sodium electrode was combined with this EMICl–FeCl2–FeCl3 molten salt, a high
energy density per unit volume may be expected (Skyllas-Kazacos et al., 2011). Since
Na(I)/Na couple in EMICl–AlCl3 system had the formal potential of −2.15 V at room
temperature(Scordilis-Kelley et al., 1992), the electromotive force of approximately 2 V

42
was expected for the Na/EMICl–FeCl2–FeCl3 battery. Even though this battery
appeared to have the advantage of a low operating temperature and a long cycle life
compared with Na–S and Zebra cells (Wen et al., 2006), further work with this system
appeared to be lacking in the literature. Instead recent work reported upon the
application of 1-ethyl-3-methyl imidazolium hexafluorophosphate ILs as supporting
electrolytes for organic RFBs (Zhang et al., 2012). The efficiencies obtained were not as
good as those reported using standard supporting electrolytes such as
tetrabutylammonium hexafluorophosphate. Further work on this topic has not been
reported to date. One reason for the lack of activity in the area of ionic liquids for RFBs
is the fact that these materials are known to be sensitive to air and moisture, which
makes their handling difficult in large-scale commercial applications (Skyllas-Kazacos
et al., 2011, Leung et al., 2012). These materials also tend to be quite expensive and are
unlikely to be economically viable for RFB applications compared to the lower cost
aqueous-based systems. In contrast, given the large electrochemical window of many
ionic liquids, the possibility of using redox couples that fall outside the decomposition
potential of water may open the way to the development of high voltage flow cells that
offer much higher power and energy densities than current aqueous-based systems
(Skyllas-Kazacos et al., 2011, Leung et al., 2012). Further investigation of such couples
could therefore prove fruitful as long as practical systems can be shown to offer better
performance, cell voltage and cycle life than the all-vanadium RFB to offset the high
costs of these electrolytes (Chakrabarti et al., 2014).
2.6 Definition of DESs
While ILs have many inherent advantages, issues such as complex synthetic
steps (Shahbaz et al., 2011), cost, lack of toxicity data and availability limit their
practical use for large scale applications (Abbott et al., 2007). An alternative approach
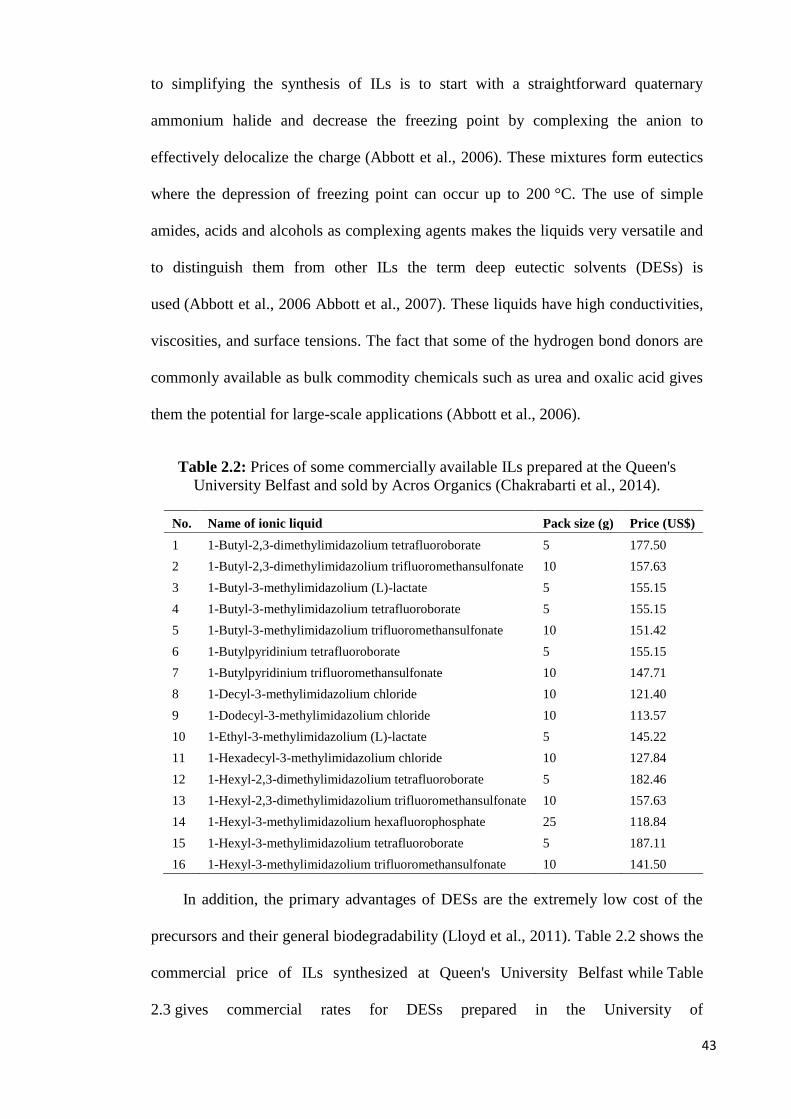
43
to simplifying the synthesis of ILs is to start with a straightforward quaternary
ammonium halide and decrease the freezing point by complexing the anion to
effectively delocalize the charge (Abbott et al., 2006). These mixtures form eutectics
where the depression of freezing point can occur up to 200 °C. The use of simple
amides, acids and alcohols as complexing agents makes the liquids very versatile and
to distinguish them from other ILs the term deep eutectic solvents (DESs) is
used (Abbott et al., 2006 Abbott et al., 2007). These liquids have high conductivities,
viscosities, and surface tensions. The fact that some of the hydrogen bond donors are
commonly available as bulk commodity chemicals such as urea and oxalic acid gives
them the potential for large-scale applications (Abbott et al., 2006).
Table 2.2: Prices of some commercially available ILs prepared at the Queen's
University Belfast and sold by Acros Organics (Chakrabarti et al., 2014).
No. Name of ionic liquid Pack size (g) Price (US$)
1 1-Butyl-2,3-dimethylimidazolium tetrafluoroborate 5 177.50
2 1-Butyl-2,3-dimethylimidazolium trifluoromethansulfonate 10 157.63
3 1-Butyl-3-methylimidazolium (L)-lactate 5 155.15
4 1-Butyl-3-methylimidazolium tetrafluoroborate 5 155.15
5 1-Butyl-3-methylimidazolium trifluoromethansulfonate 10 151.42
6 1-Butylpyridinium tetrafluoroborate 5 155.15
7 1-Butylpyridinium trifluoromethansulfonate 10 147.71
8 1-Decyl-3-methylimidazolium chloride 10 121.40
9 1-Dodecyl-3-methylimidazolium chloride 10 113.57
10 1-Ethyl-3-methylimidazolium (L)-lactate 5 145.22
11 1-Hexadecyl-3-methylimidazolium chloride 10 127.84
12 1-Hexyl-2,3-dimethylimidazolium tetrafluoroborate 5 182.46
13 1-Hexyl-2,3-dimethylimidazolium trifluoromethansulfonate 10 157.63
14 1-Hexyl-3-methylimidazolium hexafluorophosphate 25 118.84
15 1-Hexyl-3-methylimidazolium tetrafluoroborate 5 187.11
16 1-Hexyl-3-methylimidazolium trifluoromethansulfonate 10 141.50
In addition, the primary advantages of DESs are the extremely low cost of the
precursors and their general biodegradability (Lloyd et al., 2011). Table 2.2 shows the
commercial price of ILs synthesized at Queen's University Belfast while Table
2.3 gives commercial rates for DESs prepared in the University of
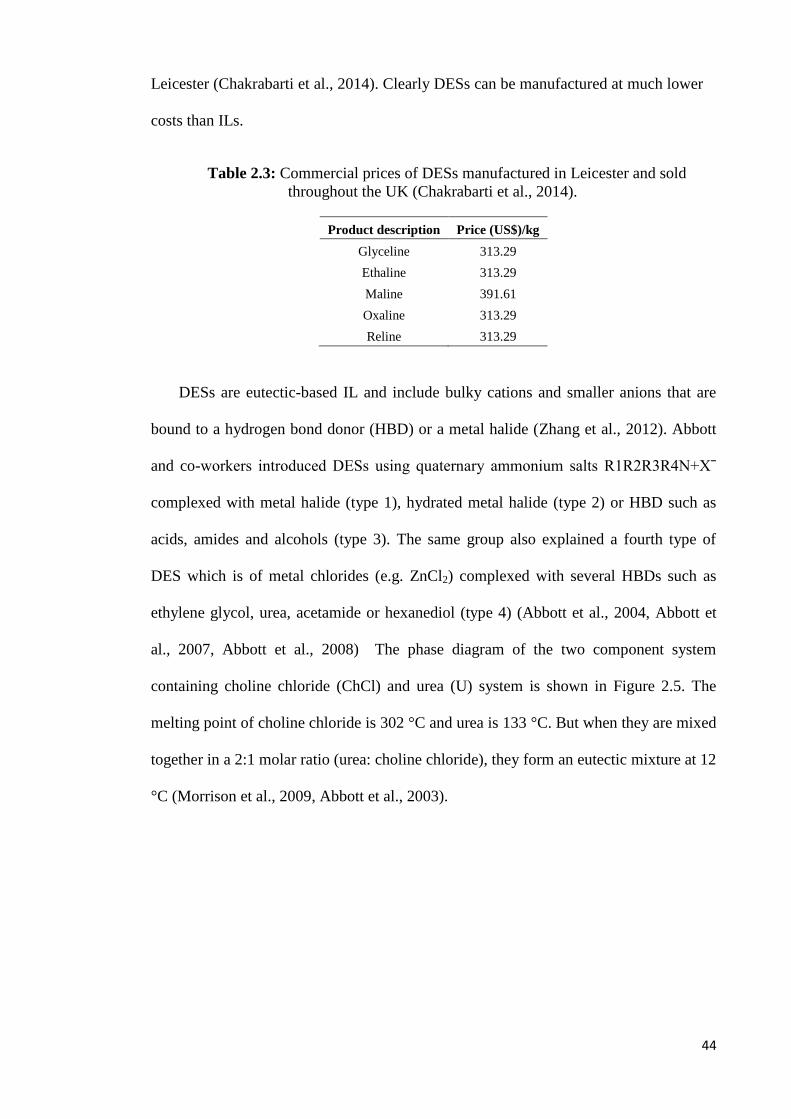
44
Leicester (Chakrabarti et al., 2014). Clearly DESs can be manufactured at much lower
costs than ILs.
Table 2.3: Commercial prices of DESs manufactured in Leicester and sold
throughout the UK (Chakrabarti et al., 2014).
Product description Price (US$)/kg
Glyceline 313.29
Ethaline 313.29
Maline 391.61
Oxaline 313.29
Reline 313.29
DESs are eutectic-based IL and include bulky cations and smaller anions that are
bound to a hydrogen bond donor (HBD) or a metal halide (Zhang et al., 2012). Abbott
and co-workers introduced DESs using quaternary ammonium salts R1R2R3R4N+Xˉ
complexed with metal halide (type 1), hydrated metal halide (type 2) or HBD such as
acids, amides and alcohols (type 3). The same group also explained a fourth type of
DES which is of metal chlorides (e.g. ZnCl2) complexed with several HBDs such as
ethylene glycol, urea, acetamide or hexanediol (type 4) (Abbott et al., 2004, Abbott et
al., 2007, Abbott et al., 2008) The phase diagram of the two component system
containing choline chloride (ChCl) and urea (U) system is shown in Figure 2.5. The
melting point of choline chloride is 302 °C and urea is 133 °C. But when they are mixed
together in a 2:1 molar ratio (urea: choline chloride), they form an eutectic mixture at 12
°C (Morrison et al., 2009, Abbott et al., 2003).

45
Figure 2.5: Phase diagram for urea-choline chloride (ChCl/U) system (Morrison et al.,
2009).
The charge delocalization happening through hydrogen bonding between the halide
anion and the hydrogendonor moiety is responsible for the decrease in the freezing point
of the mixture concerning the melting points of the individual components as shown in
Figure 2.6 (Morrison et al., 2009, Abbott et al., 2003). The melting point of a mixture of
chemical compounds depends on degrees of interaction between the components. When
the interaction between components is weak, the melting point of the mixture including
the components steadily increases or decreases based on the composition (Abbott et al.,
2004, Zhang et al., 2012). Although, when a mixture contains highly interactive
components, the melting point of it presents a large decrement at a specific composition
which is known as the eutectic point, and herein the word eutectic was originated from
the Greek term for ‗easily melted‘ (Endres et al., 2008). Due to ChCl low cost,
biodegradability and low toxicity, ChCl most of the research laboratories around the
world used as an organic salt to produce eutectic mixtures ordinarily with cheap and
safe HBDs such as glycerol, urea, carbohydrate-derived polyols or renewably sourced
carboxylic acids(Zhang et al., 2012, Zhao et al., 2011).
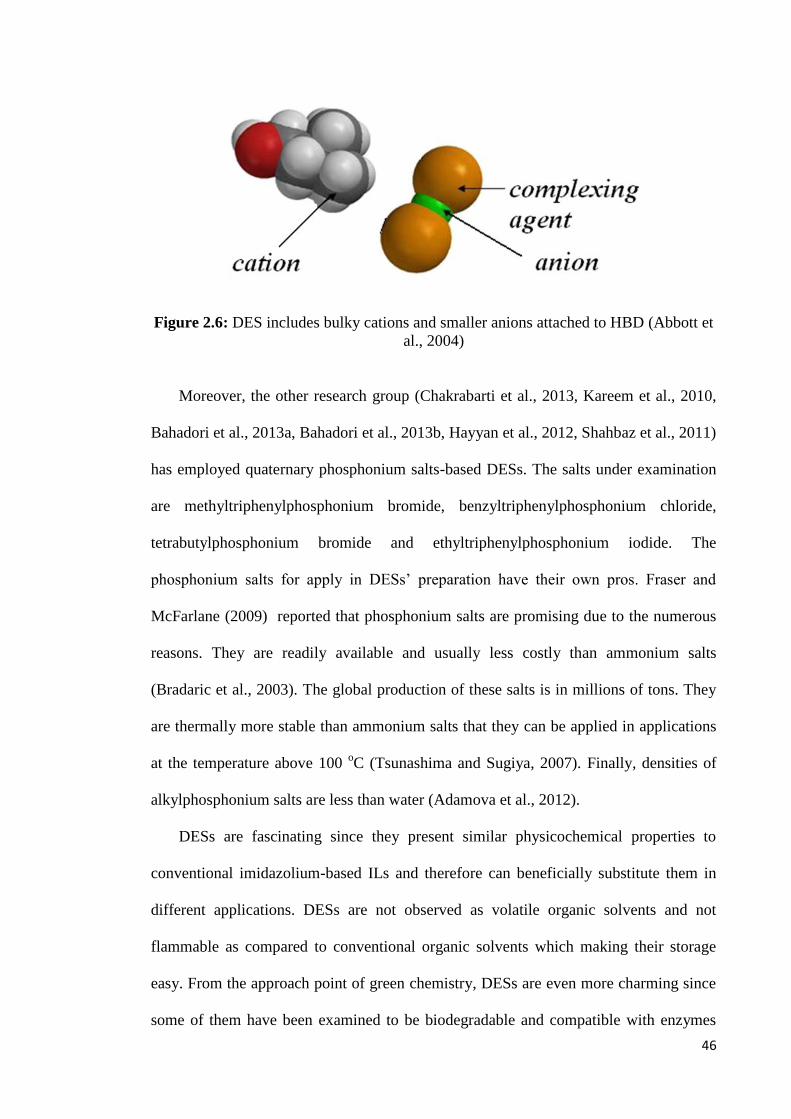
46
Figure 2.6: DES includes bulky cations and smaller anions attached to HBD (Abbott et
al., 2004)
Moreover, the other research group (Chakrabarti et al., 2013, Kareem et al., 2010,
Bahadori et al., 2013a, Bahadori et al., 2013b, Hayyan et al., 2012, Shahbaz et al., 2011)
has employed quaternary phosphonium salts-based DESs. The salts under examination
are methyltriphenylphosphonium bromide, benzyltriphenylphosphonium chloride,
tetrabutylphosphonium bromide and ethyltriphenylphosphonium iodide. The
phosphonium salts for apply in DESs‘ preparation have their own pros. Fraser and
McFarlane (2009) reported that phosphonium salts are promising due to the numerous
reasons. They are readily available and usually less costly than ammonium salts
(Bradaric et al., 2003). The global production of these salts is in millions of tons. They
are thermally more stable than ammonium salts that they can be applied in applications
at the temperature above 100 oC (Tsunashima and Sugiya, 2007). Finally, densities of
alkylphosphonium salts are less than water (Adamova et al., 2012).
DESs are fascinating since they present similar physicochemical properties to
conventional imidazolium-based ILs and therefore can beneficially substitute them in
different applications. DESs are not observed as volatile organic solvents and not
flammable as compared to conventional organic solvents which making their storage
easy. From the approach point of green chemistry, DESs are even more charming since
some of them have been examined to be biodegradable and compatible with enzymes

47
further increasing their interest. Moreover, preparation of DESs is 100% economical,
simple to handle and no extra purification is demanded, therefore making their large-
scale use achievable (Zhang et al., 2012, Carriazo et al., 2012, Zhao and Baker, 2013,
Tang and Row, 2013).
2.6.1 Physical properties of DESs
DESs are chemically designable solvents since they can be formed by combining
different quaternary ammonium and phosphonium salts with HBD in various molar
ratios to tune their physicochemical properties. It was examined that the change in one
of these components or the molar ratios with which the DES is synthesized leads to an
alteration in the physical properties of the resulting DES (Bahadori et al., 2013, Kareem
et al., 2010). Therefore, different DESs with various physicochemical properties, such
as freezing point, viscosity, conductivity and pH can be obtained. Numerous efforts
have been dedicated to the physicochemical characterization of DESs due to their
favorable applications.
2.6.1.1 Melting Point (Freezing Point)
The difference of the lattice energies of the salt and the HBD rely on the anion-
HBD interaction and the entropy changes emerge from the formation of the solvent.
Factors that contribute to the reduction of the melting point are cation with small size
and low symmetry. The anions with high hydrogen bond strength and small size have
also impact the melting point and produce higher freezing temperature depression
(Zhang et al., 2012). For example, in combination with urea, the melting point of a
choline salt derived DES increase in the order BF4¯< Cl¯< NO3 ¯< F¯, recommending a
correlation with the hydrogen bond strength (Zhang et al., 2012). Abbott and co-
workers displayed that DESs of ChCl:U had some unique solvent‘s properties. It was
revealed that the self-association occurring between the salt and the HBD depends on
48
the employed components, and moreover their molar ratios impact in controlling the
melting point of the DES (Abbott et al., 2003). Shahbaz and co-workers (2010) reported
that for DESs prepared from ChCl with either 2,2,2 triflouroacetamide or ethylene
glycol, the difference of the salt:HBD molar ratio has the same impact on the melting
point of the DESs.
Kareem et al. (2010) presented same results for phosphonium-based DESs as well as
Hayyan et al. (2013) validated the controlling role of salt:HBD molar ratio in glucose
based DESs.
2.6.1.2 Density
Densities of DESs are generally investigated by means of a specific gravity meter.
The majority of DESs show higher densities than water (Kareem et al., 2010, Shabaz et
al., 2012a). For example, ZnCl2–HBD eutectic mixtures have densities higher than 1.3 g
cm-3
. Density of ZnCl2–urea (1:3.5) and ZnCl2–acetamide (1:4) are different (1.63 and
1.36 g cm-3
, respectively) (Zhang et al., 2012). This remarkable variation of density
might be ascribed to a different molecular arrangement or packing of the DESs. Both of
DESs have higher density than those of neat HDBs. This fact could be demonstrated by
the hole theory. DESs are comprised of holes or empty vacancies same as imidazolium
based ILs. For example, the average hole radius was decreased when ZnCl2 was
combined with urea, therefore density of the DES increased as compared to that of pure
urea (Abbott et al., 2007b). The variation in organic salt/HBD molar ratio also has an
apparent impact on the densities of DES. This phenomenon was demonstrated by the
work of Shahbaz et al. (2011c). Recently, researchers (Bahadori et al., 2013, Kareem et
al., 2010, Abbott et al., 2011, Shahbaz et al., 2011c, Hayyan et al., 2013) have reported
the investigation of densities of DESs over different range of temperatures.

49
2.6.1.3 Viscosity
Viscosity is a significant issue that needs to be addressed, particularly when fluids
and liquids specifically are used as lubricants. It is defined as the resistivity of a fluid to
flow in streams.
Most DESs systems have relatively high viscosities at ambient temperature, except for
ChCl-ethylene glycol (EG) eutectic mixture (Zhang et al., 2012). The high viscosity of
DESs is ascribed to the attendance of a comprehensive hydrogen bond network between
each component, which causes a lower mobility of free species within the DES. Van der
Waals interactions or electrostatic forces and also the big ion size and tiny void volume
of DESs may contribute to the high viscosity of DES (Ghatee et al., 2010, Sanchez et
al., 2009).
In general, viscosities of eutectic mixtures are strongly influenced by the atomic
structure of its components, organic salt/HBD molar ratio, the water content, and the
operating temperature (Zhang et al., 2012). Hole theory has been applied to account for
viscosity in DES (Abbott et al., 2007c). This theory presumes that DES contains
unoccupied space that is created from thermal fluctuations in local density. The holes
are of random size and location, and in constant flux. As the viscosity is related to the
free volume in the fluid and the probability to find holes of appropriate dimensions for
the ions to move into, it is possible to decrease the viscosity by increasing the free
volume of the solvent (Abbott et al., 2007c).
Viscosities of most DESs alter remarkably as a function of the temperature. The profiles
of viscosity versus temperature also follow an Arrhenius-like behaviour. As the
temperature enhances, the viscosity reduces (Zhang et al., 2012, Bahadori et al., 2013).
50
2.6.1.4 Ionic conductivity
Ionic conductivity is one of the most important physical properties which represent how
well a material can conduct electrical current. It is a functional measurement, as in the
case of applying liquids as electrolytes in electrochemical processes, such as in batteries
or in electroplating process (Galinski et al., 2006, Ju et al., 2012, Ishikawa et al., 2006).
In engineering applications, it is critical to estimate the ionic conductivity of an
electrolyte in order to design, control and optimize the electrolytic processes and the
manufacture of electrochemical power sources (Galinski et al., 2006). For corrosion
protection, ionic conductivity supplies applicable data for estimation the corrosively of
aqueous media and for cathodic protection system (Holbery et al., 2003).
In DES, the ionic conductivity is controlled by the mobility of the charge carriers
rather than by their number. The mobility is restricted by the accessibility of holes of
appropriate measures for the charge transport. Since the fraction of suitable sized holes
at ambient temperature (21° C) is very low, the holes can be presumed to be at infinite
dilution (Abbott et al., 2004).
Most of DESs present poor ionic conductivity due to their relatively high viscosity
around or lower than 2 mS cm-1
at ambient temperature (Zhang et al., 2012). Like
viscosity, molecular structure and changes of the organic salt/HBD molar ratio
dramatically impacts the ionic conductivity of DESs. Abbott and co-workers (2007c)
reported the conductivity of DES increases with increasing the ChCl content.
Ionic conductivity and its behavior as a function of temperature for different
ammonium and phosphonium based DES is demonstrated in Chapter 4 of this thesis.
Conductivity of DESs generally increases significantly as the temperature increases due
to a decline in the viscosity.

51
Therefore, Arrhenius-like equation can also be accustomed to predict the conductivity
behavior of a DES.
2.6.2 Feasibility of using DES for RFB applications
The feasibility of applying DESs in RFBs can be ascertained from both economic
and environmental impact analyses. It is obviously sensible to estimate the performance
of recently reported DESs in RFBs (Lloyd et al., 2013a, Lloyd et al., 2013b) with that of
the commercially developed VRB (Watt-Smith et al., 2013). Assuming a typical
2 kW/30 kWh VRB installation reported by Walsh and co-workers (Kear et al., 2012),
an economic analysis reveals an amortized capital cost of $850 and a cost of stored
electricity of $0.10 kW−1
h−1
. When the cost of electricity from wind power is added to
the energy storage cost a total combined generation/storage cost of $0.15–
0.18 kW−1
h−1
is obtained. From Table 2.3, it is clear that the commercial cost of the
most commonly investigated DES, i.e. ethaline is about an order of magnitude higher
than that of the commonly available VRB electrolyte. However the future of VRBs may
not be very bright considering the high extraction costs of vanadium (Wadia et al.,
2011). For this reason, it is logical to develop simple, cost effective systems using
materials exhibiting fewer supply constraint such as DESs (Lloyd et al., 2013a). In
addition, a recent report has revealed that DESs are environmentally benign as they are
produced naturally by plants and used for their metabolism processes (Choi et al.,
2011). Compare this with the environmental impacts of acidic based electrolytes that are
normally applied in VRBs. Therefore DESs show strong potential as future electrolytes
for RFB applications (Chakrabarti et al., 2014).
So far, there have been two direct reports related to the study of redox species in
DESs for applications in RFBs (Lloyd et al., 2013a, Lloyd et al., 2013b). In addition,
several DESs have been electrochemically characterized using redox couples such as

52
ferrocene/ferrocenium (Nkuku and Lesuer, 2007, Bahadori et al., 2013), copper
(II)/copper (I) (Lloyd et al., 2011) and other metallic ions in ethaline (Abbott et al.,
2011b). The rate kinetics of the copper (II)/(I) redox couple was shown to be
appreciably higher in ethaline (Lloyd et al., 2011b) in comparison to ILs reported in the
literature (Abbott et al., 2009, Nanjundiah and Osteryoung, 1983). Similarly, the
heterogeneous rate constant of ferrocene in DES (Nkuku and Lesuer, 2007) was of the
same order of magnitude as that in ionic liquids (Chakrabarti et al., 2013, Bahadori et
al., 2013, Lewandowski et al., 2013, Fontaine et al., 2009).
The electrochemistry of DES is not severely affected if experiments are conducted
in the open atmosphere (Nkuku and Lesuer, 2007). This gives it an edge over
acetonitrile or ionic liquids as solvents, because in most cases, non-aqueous electrolytes
have been reported to undergo experiments under inert atmospheres (i.e., either purging
the solutions with nitrogen or argon to remove dissolved oxygen and moisture or else
experiments remain confined within expensive glove boxes) (Sleightholme et al., 2011,
Nanjundiah and Osteryoung, 1983). In addition, solubility of metal oxides based on
vanadium, chromium, iron and zinc are reasonably high in DESs based upon urea or
malonic acid, which shows some promise towards applications in RFBs (Abbott et al.,
2011a). Abbott and co-workers also reported that the solubility of such metallic species
can be improved in the presence of iodine as an electrocatalyst (Abbott et al., 2011b).
This would be extremely beneficial in improving the energy densities of RFBs running
on DES-based electrolytes, thereby encouraging their implementation in future electric
vehicles.
In a nutshell, application of DES appears quite promising for RFBs due to the
possibility of manufacturing the materials in bulk at reasonably low costs as well as due
to the high heterogeneous rate constants of several metallic species in such
53
solvents (Bahadori et al., 2013). DESs can also be produced from different salts and
hydrogen bond donors thereby adding versatility to the process.
2.7 Electrochemistry
2.7.1 Internal reference redox system
Establishing solvent independent reference electrodes for the comparison of redox
potentials in aqueous and non-aqueous systems has a long history (Gagne et al.,
1980).In 1947, Pleskov introduced the concept of Rb|Rb+ or Rb(Hg)|Rb
+ as a pilot ion,
followed by the proposal to use organometallic redox couples (Inzelt et al., 2013). In
order to limit the number of possible reference redox systems based on organometallic
redox couples IUPAC recommended that the systems ferrocene/ferrocenium ion
(Fc/Fc+) and bis(biphenyl)chromium
(0)/(I) (BCr/BCr
+) should be used as reference redox
systems in non-aqueous media (Gritzner and Kuta, 1984).
During the last decade a considerable number of papers dealing with ILs were
published, including their possible application as solvent-free electrolytes (Brooks and
Doherty, 2004, Galinski et al., 2006, Fernicola et al., 2006, Waligora et al., 2009, Wu et
al., 2011).
Organometallic redox couples, where both the oxidized and the reduced form are
soluble, have been proposed in non-aqueous solvents and solvent mixtures (Waligora et
al., 2009, Wu et al., 2011). So far, the electrochemical behavior of the redox couples
Cc/Cc+ and ethylferrocene/ethylferrocenium ion on gold, glassy carbon and platinum
disc electrodes in 1-n-butyl-3- methylimidazolium hexafluorophosphate and the
electrochemical behavior of several substituted ferrocenes, which adhered to the
working electrode surface, have been studied (Rogers et al., 2008, Hultgren et al.,
2002). The cobaltocene/cobaltocenium couple was studied and suggested as possible
reference redox couples in 1-n-butyl-3-methylimidazolium hexafluorophosphate in 1-
54
ethyl-3-methylimidazolium bis(trifluoromethanesulphonyl)imide as well as in 1-butyl-
1-methylpyrrolidinium bis(trifluoromethanesulphonyl) imide(Lewandowski et al.,
2013). Current literature indicates that the Fc/Fc+ ion redox couple as possible reference
system for ILs suffers from poor solubility in several ILs (Buzzeo et al., 2004),
prompting the research group to emphasize Cc+/Cc ion as a possible internal potential
standard for electrode potential measurements in ILs (Lewandowski et al., 2013). It
must be kept in mind that a redox couple must fulfill the requirements of a Fc redox
system in many ILs before it may be accepted as a reference redox system. Hopefully, a
redox couple, which has been proposed as reference redox system in organic solvents
could also be employed in ILs (Nagy et al., 2006, Fu et al., 2011, Eisele et al., 2006,
Tsierkezos, 2007).
Additional research is thus needed including organometallic redox couples, for
which data in non-aqueous solvents and solvent mixtures are available. In this work we
sought to investigate the electrochemistry of Nernstian redox couples, Fc and Cc+ in
different DESs to set a benchmark for typical electrochemical behavior in these
solvents.
2.7.2 Reference electrodes
The employment of quasi-reference electrodes, QRE, is a frequent practice in
electrochemical probe in non-aqueous solvents. The case with IL examinations, well-
defined reference electrodes are difficult to supply and stabilize (Torriero et al., 2012).
In most ILs volatility is not an issue contrasted to the condition prevailing in some
organic solvents in which evaporation can alter the composition of the reference
electrode half-cell (Fu et al., 2011, Torriero et al., 2012). However, the small volume of
IL usually used, in general several hundred of microliters, in order to perform simple
and cost-efficient research, justifies the use of this kind of reference system (McHale et
55
al., 2008). Most of studies that use QRE in ILs are established upon platinum (Suarez et
al., 1997, Caban et al., 2004), silver (AlNashef et al., 2002, Chakrabarti et al., 2013,
Bahadori et al., 2013), or lithium metal (Lewandowski and Swiderska-Mocek, 2010)
immersed directly into the IL system. Magnesium is less usually employed (Nuli et al.,
2005). The role of platinum or silver wire as a QRE is established upon the presence of
several compounds on the metal surface, where the precise identity of the redox
couples are not known with any certainty (Snook et al., 2006). Moreover, the quantity of
the oxidized component, which is quite little when contrasted to commercial aqueous
reference electrodes, is also mysterious (Snook et al., 2006). Hence, the potential of the
QRE is probably to alter extremely in the event of:
(a) Reaction with the IL components or impurities present in the media;
(b) Dissolution of the oxidized compounds in the IL;
(C) Polarization, because of shortage of potentiostatic control (Torriero et al., 2012).
These changes can take place dynamically throughout the time period when the wire
is immersed in the IL as a result of the electrochemical experiment. Therefore, the
presumption that the potential of the electrochemical processes of interest inscribed
versus a QRE can be adjusted, at some stage, versus a appropriate reference electrode or
a standard redox compound, cannot always be relied upon to supply an exact potential
value over the whole range of potentials measured (Torriero et al., 2012).
56
CHAPTER 3: RESEARCH METHODOLOGY
In this Chapter, the procedures used to achieve the objectives of this work are
reported. Five main sections will be presented in this chapter. Section 3.1 describes the
syntheses of studied DESs; section 3.2 describes the characterization procedure of the
physical properties of some of the synthesized DESs; Section 3.3 explains
electrochemical experiments; Section 3.4 presents the experimental procedure for
measuring the stability of vanadium acetylacetonate in some of the DESs. Finally,
section 3.5 describes charge/discharge experiments.
3.1 Synthesis of DESs
3.1.1 Materials
Choline chloride (ChCl) (C5H14ClNO), methyltriphenylphosphonium bromide
(C19H18PBr), N,N-diethylenethanol ammonium chloride (C6H16ClNO), glycerin
(C3H8O3), ethylene glycol (C2H6O2), triethylene glycol (C6H14O4), malonic acid
(CH2(COOH)2), oxalic acid (HOOC-COOH), triethanolamine (N(CH2CH2OH)3), zinc
nitrate hexahydrate (Zn(NO3)2.6H2O) and 2,2,2-trifluoroacetamide (F3C-CO-NH2), were
purchased from Merck Chemicals (Germany) with high purity (≥98%). All chemicals
were used as supplied by the manufacturer and utilized for the synthesis of DESs
without further purification and were stored in an inert glove box purged with argon.
The synthesized DESs were stored in tight-capped bottles to prevent them from being
affected by atmospheric humidity. Moreover, the water mass fraction in these
chemicals, as per the manufacturer‘s guide, was < 10-4
%.
3.1.2 Synthesis procedure
The original procedure of synthesizing DESs as reported by Abbott et al. (2004)
was used in this work. A jacketed cup with magnetic stirrer was used to mix both the
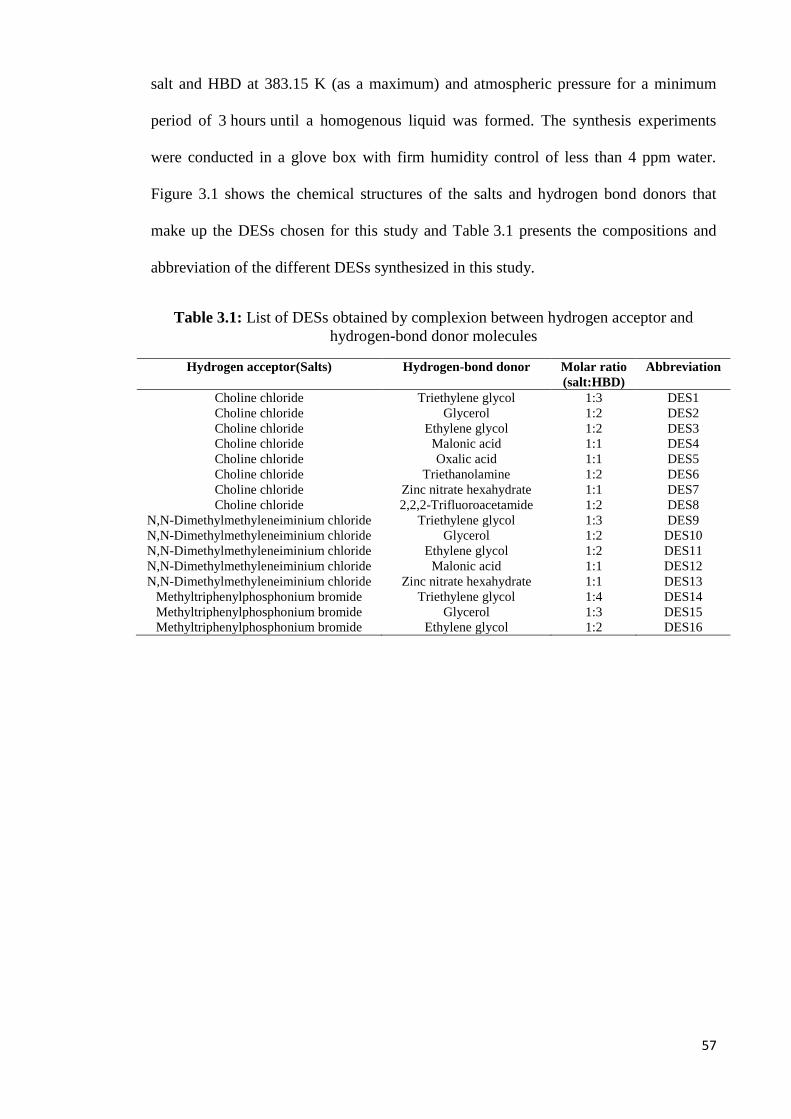
57
salt and HBD at 383.15 K (as a maximum) and atmospheric pressure for a minimum
period of 3 hours until a homogenous liquid was formed. The synthesis experiments
were conducted in a glove box with firm humidity control of less than 4 ppm water.
Figure 3.1 shows the chemical structures of the salts and hydrogen bond donors that
make up the DESs chosen for this study and Table 3.1 presents the compositions and
abbreviation of the different DESs synthesized in this study.
Table 3.1: List of DESs obtained by complexion between hydrogen acceptor and
hydrogen-bond donor molecules
Hydrogen acceptor(Salts) Hydrogen-bond donor Molar ratio
(salt:HBD)
Abbreviation
Choline chloride Triethylene glycol 1:3 DES1
Choline chloride Glycerol 1:2 DES2
Choline chloride Ethylene glycol 1:2 DES3
Choline chloride Malonic acid 1:1 DES4
Choline chloride Oxalic acid 1:1 DES5
Choline chloride Triethanolamine 1:2 DES6
Choline chloride Zinc nitrate hexahydrate 1:1 DES7
Choline chloride 2,2,2-Trifluoroacetamide 1:2 DES8
N,N-Dimethylmethyleneiminium chloride Triethylene glycol 1:3 DES9
N,N-Dimethylmethyleneiminium chloride Glycerol 1:2 DES10
N,N-Dimethylmethyleneiminium chloride Ethylene glycol 1:2 DES11
N,N-Dimethylmethyleneiminium chloride Malonic acid 1:1 DES12
N,N-Dimethylmethyleneiminium chloride Zinc nitrate hexahydrate 1:1 DES13
Methyltriphenylphosphonium bromide Triethylene glycol 1:4 DES14
Methyltriphenylphosphonium bromide Glycerol 1:3 DES15
Methyltriphenylphosphonium bromide Ethylene glycol 1:2 DES16
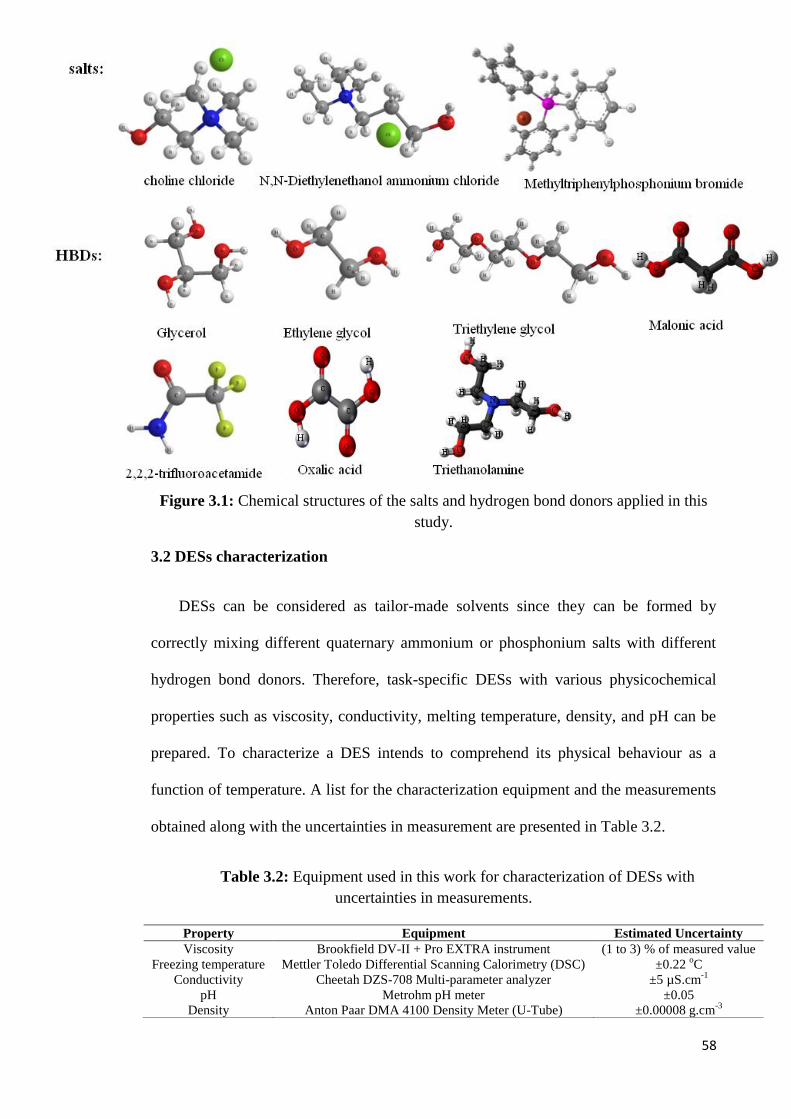
58
Figure 3.1: Chemical structures of the salts and hydrogen bond donors applied in this
study.
3.2 DESs characterization
DESs can be considered as tailor-made solvents since they can be formed by
correctly mixing different quaternary ammonium or phosphonium salts with different
hydrogen bond donors. Therefore, task-specific DESs with various physicochemical
properties such as viscosity, conductivity, melting temperature, density, and pH can be
prepared. To characterize a DES intends to comprehend its physical behaviour as a
function of temperature. A list for the characterization equipment and the measurements
obtained along with the uncertainties in measurement are presented in Table 3.2.
Table 3.2: Equipment used in this work for characterization of DESs with
uncertainties in measurements.
Property Equipment Estimated Uncertainty
Viscosity Brookfield DV-II + Pro EXTRA instrument (1 to 3) % of measured value
Freezing temperature Mettler Toledo Differential Scanning Calorimetry (DSC) ±0.22 oC
Conductivity Cheetah DZS-708 Multi-parameter analyzer ±5 µS.cm-1
pH Metrohm pH meter ±0.05
Density Anton Paar DMA 4100 Density Meter (U-Tube) ±0.00008 g.cm-3

59
In the following sub-sections, the detailed procedures for measuring each physical
property are described.
3.2.1 Viscosity
The viscosities of the DESs were obtained by averaging each measurement at least
three to five times, using a Brookfield DV-II +Pro EXTRA instrument. The temperature
control was achieved by using an external water bath that was connected to the
instrument. Viscometer is supplied with a set of 4 spindles and a narrow guard leg. The
equipment was calibrated with standard values of pure water and glycerol.
3.2.2 Electrical conductivity
The measurement of the electrical conductivity of DESs is performed using
Cheetah multi parameters meter model DZS - 780. This device has a wide temperature
range for measurements, i.e. from -5 oC up to 135
oC. The meter was calibrated by
standard buffer solutions provided by the manufacturer. The measurements of the
electrical conductivities at different temperatures were carried out by placing the DES
on a hot plate, equipped with a temperature controller. To ascertain that the temperature
displayed by the hot plate was accurate, external thermometers were used to measure
the temperature inside the DES.
3.2.3 Melting temperature
The Differential Scanning Calorimetry (DSC) is a device that measures the heat flow
emitted from a sample upon heating over a range of temperatures. The basis of this
method is that when a sample passes through its melting temperature upon heating, it
emits a certain amount of heat which is detectable by micro-scale sensors. A sample of
less than 10 mg is placed inside a particular pan made principally from aluminium and a
hole is made in the cover of that pan. The temperature of the sample is gently increased.
60
The hole permits the heat emitted to transfer outside the pan whereby specific sensors
will estimate this heat and record it. If the sample is liquid at room temperature, then it
must be cooled down till it freezes. The measurement starts from a point at which the
sample is in the solid state. If the sample is solid at room temperature, then the heating
program may start from the ambient temperature to a temperature at which the sample is
in the liquid state. The heating of the sample from below its melting temperature to
above this temperature is carried out through a computerized program. On the initiation
of the program the sample starts to emit a certain amount of heat till it reaches the glass
transition point whereby only a few molecules of the sample change from the solid state
to liquid state. At the glass transition point, the amount of heat emitted will be reduced
sharply to assist in converting the state of the sample. The specialized sensors detect this
sudden depression and it is drawn as a drop in the curve of the heat flow. When the
entire sample has melted down, the heat emission will be uniform again. This sudden
drop in the heat flow curve will be identified on the x-axis which represents the
temperature, and this temperature will be the melting temperature of the sample. In this
work, a Mettler Toledo Differential Scanning Calorimetry (DSC) was used. The DSC
was calibrated versus known standards (water and 2-propanol) to ensure the
measurement‘s accuracy.
3.2.4 Density
Densities of the synthesized DESs in this work were measured using a DMA 4500
vibrating tube density/specific gravity meter (Anton Paar, Austria). Anton Paar U-tube
density meter is an apparatus using sophisticated systems to weigh the mass of the
injected liquid sample in the U-tube. The apparatus can only be utilized for samples
which are liquid at room temperature as the procedure includes injection of the sample
in the apparatus utilizing a syringe until the U-tube is full of the sample. Then a
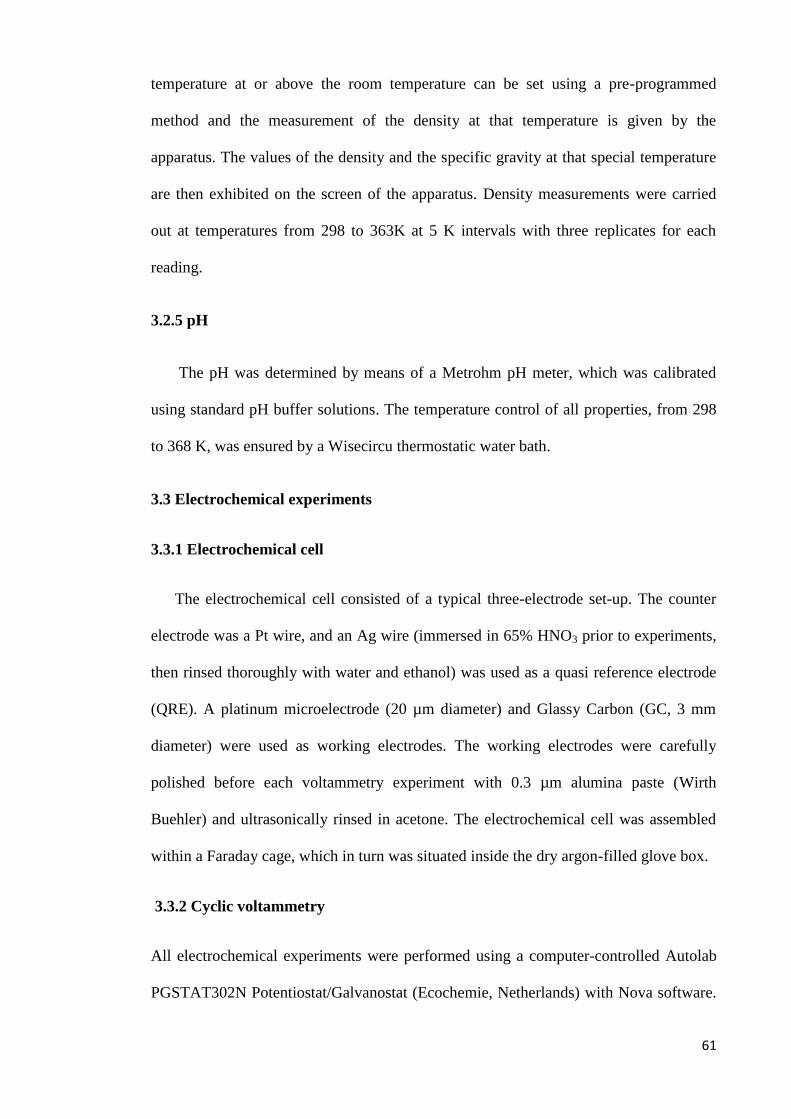
61
temperature at or above the room temperature can be set using a pre-programmed
method and the measurement of the density at that temperature is given by the
apparatus. The values of the density and the specific gravity at that special temperature
are then exhibited on the screen of the apparatus. Density measurements were carried
out at temperatures from 298 to 363K at 5 K intervals with three replicates for each
reading.
3.2.5 pH
The pH was determined by means of a Metrohm pH meter, which was calibrated
using standard pH buffer solutions. The temperature control of all properties, from 298
to 368 K, was ensured by a Wisecircu thermostatic water bath.
3.3 Electrochemical experiments
3.3.1 Electrochemical cell
The electrochemical cell consisted of a typical three-electrode set-up. The counter
electrode was a Pt wire, and an Ag wire (immersed in 65% HNO3 prior to experiments,
then rinsed thoroughly with water and ethanol) was used as a quasi reference electrode
(QRE). A platinum microelectrode (20 µm diameter) and Glassy Carbon (GC, 3 mm
diameter) were used as working electrodes. The working electrodes were carefully
polished before each voltammetry experiment with 0.3 µm alumina paste (Wirth
Buehler) and ultrasonically rinsed in acetone. The electrochemical cell was assembled
within a Faraday cage, which in turn was situated inside the dry argon-filled glove box.
3.3.2 Cyclic voltammetry
All electrochemical experiments were performed using a computer-controlled Autolab
PGSTAT302N Potentiostat/Galvanostat (Ecochemie, Netherlands) with Nova software.
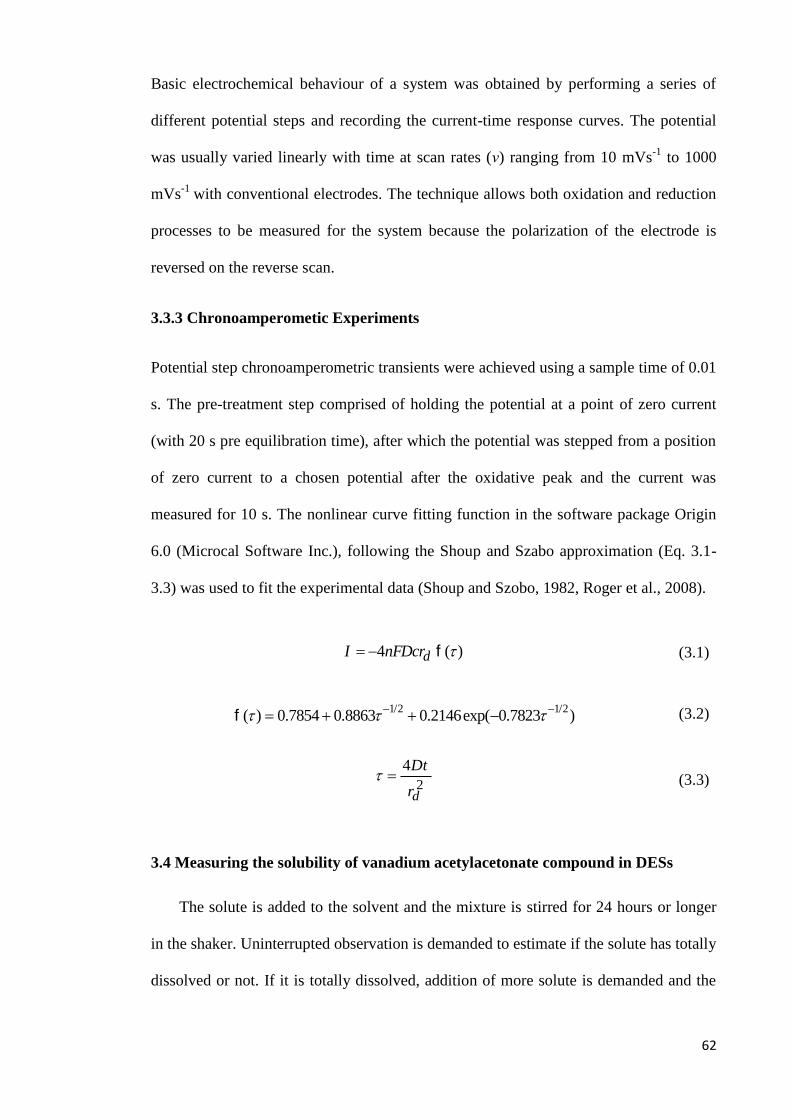
62
Basic electrochemical behaviour of a system was obtained by performing a series of
different potential steps and recording the current-time response curves. The potential
was usually varied linearly with time at scan rates (ν) ranging from 10 mVs-1
to 1000
mVs-1
with conventional electrodes. The technique allows both oxidation and reduction
processes to be measured for the system because the polarization of the electrode is
reversed on the reverse scan.
3.3.3 Chronoamperometic Experiments
Potential step chronoamperometric transients were achieved using a sample time of 0.01
s. The pre-treatment step comprised of holding the potential at a point of zero current
(with 20 s pre equilibration time), after which the potential was stepped from a position
of zero current to a chosen potential after the oxidative peak and the current was
measured for 10 s. The nonlinear curve fitting function in the software package Origin
6.0 (Microcal Software Inc.), following the Shoup and Szabo approximation (Eq. 3.1-
3.3) was used to fit the experimental data (Shoup and Szobo, 1982, Roger et al., 2008).
4 ( )dI nFDcr f (3.1)
1/2 1/2( ) 0.7854 0.8863 0.2146exp( 0.7823 )
f
(3.2)
2
4
d
Dt
r
(3.3)
3.4 Measuring the solubility of vanadium acetylacetonate compound in DESs
The solute is added to the solvent and the mixture is stirred for 24 hours or longer
in the shaker. Uninterrupted observation is demanded to estimate if the solute has totally
dissolved or not. If it is totally dissolved, addition of more solute is demanded and the
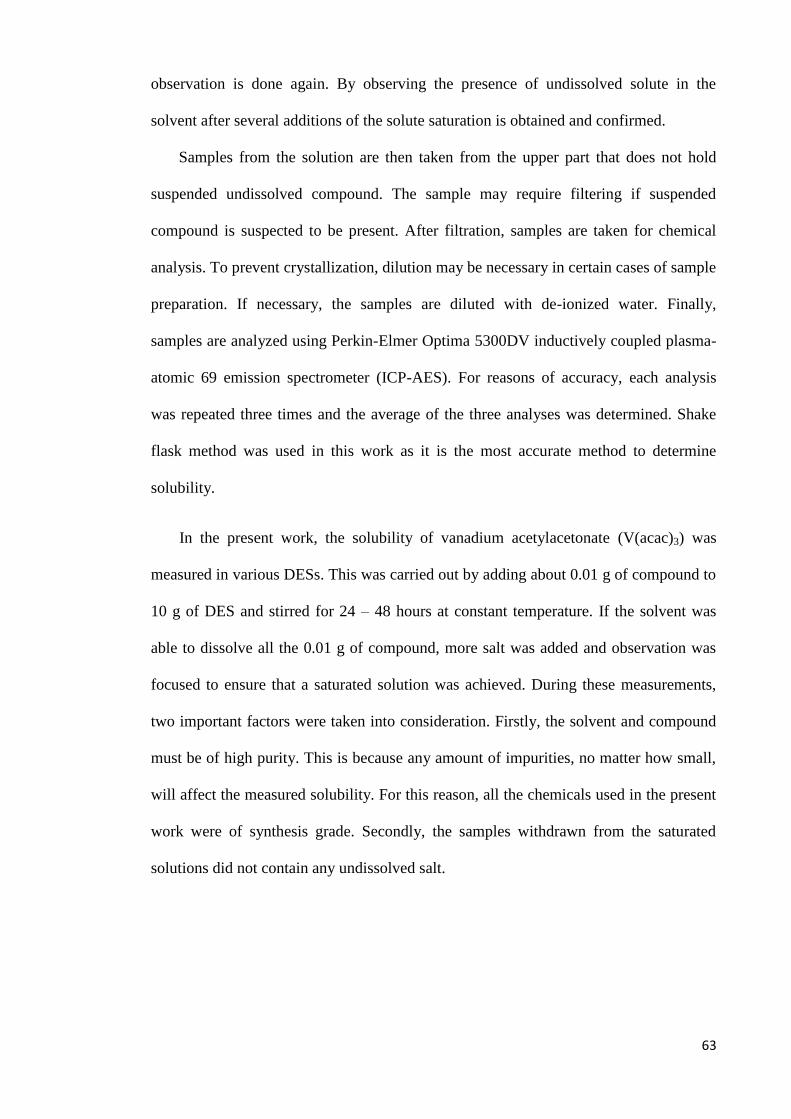
63
observation is done again. By observing the presence of undissolved solute in the
solvent after several additions of the solute saturation is obtained and confirmed.
Samples from the solution are then taken from the upper part that does not hold
suspended undissolved compound. The sample may require filtering if suspended
compound is suspected to be present. After filtration, samples are taken for chemical
analysis. To prevent crystallization, dilution may be necessary in certain cases of sample
preparation. If necessary, the samples are diluted with de-ionized water. Finally,
samples are analyzed using Perkin-Elmer Optima 5300DV inductively coupled plasma-
atomic 69 emission spectrometer (ICP-AES). For reasons of accuracy, each analysis
was repeated three times and the average of the three analyses was determined. Shake
flask method was used in this work as it is the most accurate method to determine
solubility.
In the present work, the solubility of vanadium acetylacetonate (V(acac)3) was
measured in various DESs. This was carried out by adding about 0.01 g of compound to
10 g of DES and stirred for 24 – 48 hours at constant temperature. If the solvent was
able to dissolve all the 0.01 g of compound, more salt was added and observation was
focused to ensure that a saturated solution was achieved. During these measurements,
two important factors were taken into consideration. Firstly, the solvent and compound
must be of high purity. This is because any amount of impurities, no matter how small,
will affect the measured solubility. For this reason, all the chemicals used in the present
work were of synthesis grade. Secondly, the samples withdrawn from the saturated
solutions did not contain any undissolved salt.

64
3.5 Charge/discharge experiment
3.5.1 Instrumentation
Charge–discharge testing is another experimental technique utilized in this work.
These tests will be used to demonstrate how active species perform in an applied RFB
cell over time. Charge/discharge tests are designed to imitate the conditions a battery
would experience under long-term performance. The ‗charge‘ step includes the addition
of energy to the system, while the ‗discharge‘ step includes energy extraction. The
charge/discharge steps can be performed at constant applied potential, current, or
resistive load − or a sequence of any or all of these conditions. In this work,
experiments were accomplished under the frequently utilized constant current condition
(potential response was measured) because the resulting data were more readily
analyzed. Galvanostatic method was performed for charge/discharge tests using an H-
type glass cell. In this work, the galvanostat used was an Autolab PGSTAT302N
Potentiostat/Galvanostat (Ecochemie, Netherlands).
3.5.2 H-type cell
An H-type glass cell was designed and fabricated for the constant current charge
and discharge tests of a small redox battery with vanadium redox couples. This H-type
glass cell consists of principal three parts, the anodic and cathodic compartments and
the membrane placed between the two compartments. The H-type cell is commonly
utilized to screen electrolytes (Skyllas-Kazacos et al., 1986, Shinkle et al., 2012, Zhang
et al., 2012). It is used because it is very easy to set up and versatile (electrodes,
membranes, and liquids are easily changed). The scheme and photograph of H-type
glass cell battery is shown in Figure 3.2.
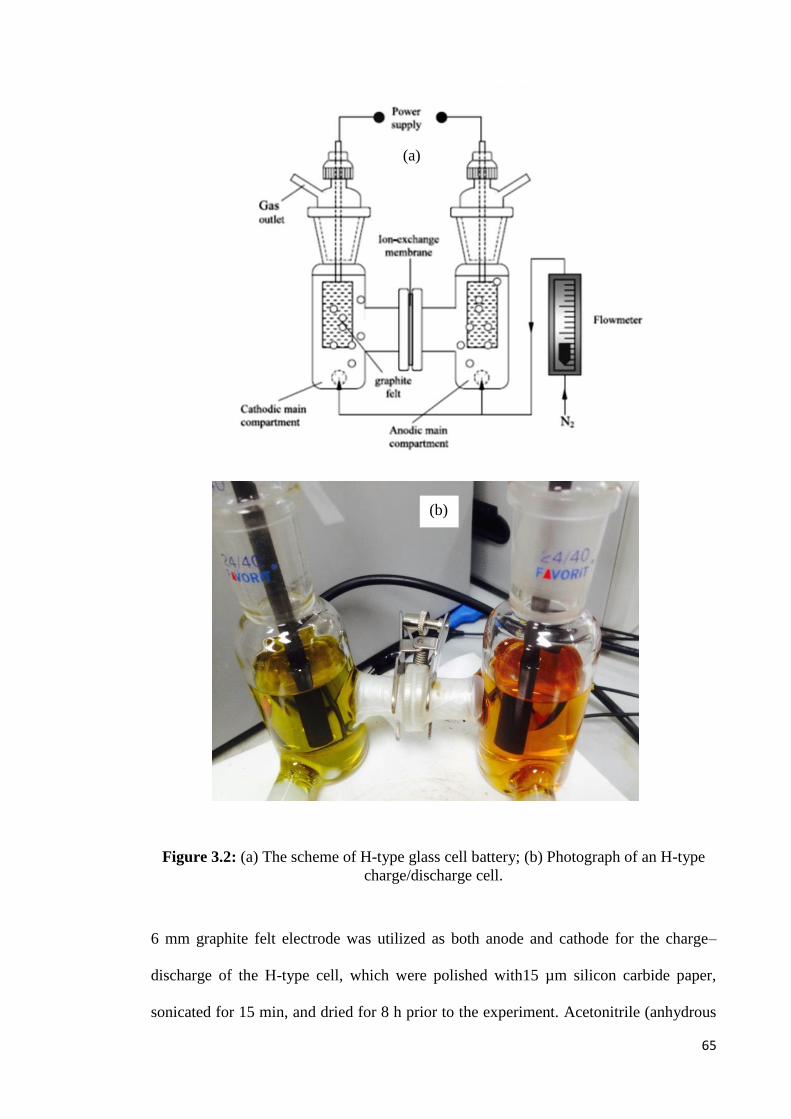
65
Figure 3.2: (a) The scheme of H-type glass cell battery; (b) Photograph of an H-type
charge/discharge cell.
6 mm graphite felt electrode was utilized as both anode and cathode for the charge–
discharge of the H-type cell, which were polished with15 µm silicon carbide paper,
sonicated for 15 min, and dried for 8 h prior to the experiment. Acetonitrile (anhydrous
(b)
(a)
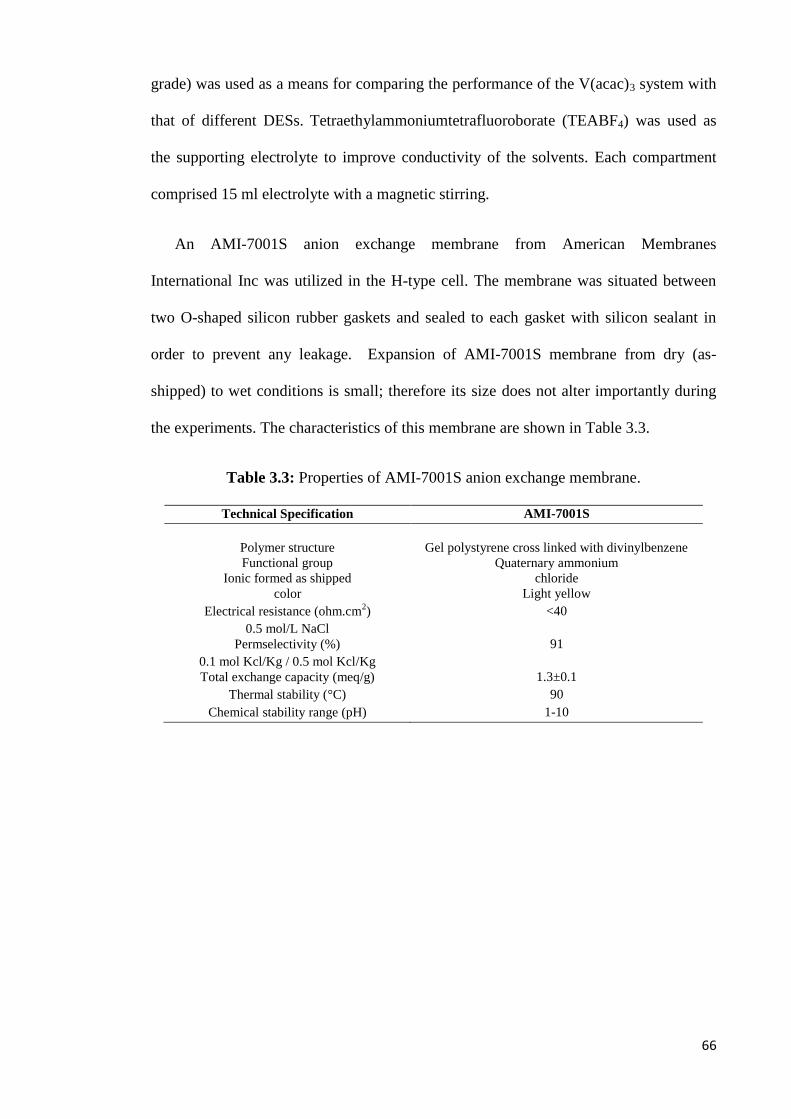
66
grade) was used as a means for comparing the performance of the V(acac)3 system with
that of different DESs. Tetraethylammoniumtetrafluoroborate (TEABF4) was used as
the supporting electrolyte to improve conductivity of the solvents. Each compartment
comprised 15 ml electrolyte with a magnetic stirring.
An AMI-7001S anion exchange membrane from American Membranes
International Inc was utilized in the H-type cell. The membrane was situated between
two O-shaped silicon rubber gaskets and sealed to each gasket with silicon sealant in
order to prevent any leakage. Expansion of AMI-7001S membrane from dry (as-
shipped) to wet conditions is small; therefore its size does not alter importantly during
the experiments. The characteristics of this membrane are shown in Table 3.3.
Table 3.3: Properties of AMI-7001S anion exchange membrane.
Technical Specification AMI-7001S
Polymer structure Gel polystyrene cross linked with divinylbenzene
Functional group Quaternary ammonium
Ionic formed as shipped chloride
color Light yellow
Electrical resistance (ohm.cm2)
0.5 mol/L NaCl
<40
Permselectivity (%)
0.1 mol Kcl/Kg / 0.5 mol Kcl/Kg
91
Total exchange capacity (meq/g) 1.3±0.1
Thermal stability (°C) 90
Chemical stability range (pH) 1-10
67
CHAPTER 4: RESULTS AND DISCUSSIONS
Different types of DESs were synthesized and utilized in different parts of this
research. Of the studied DESs, DES7 and DES13 are novel and have not been reported
before. To simplify the text, each DES was given an abbreviation. These DESs are
summarized in Table 3.1. The results of this study are arranged into four main sections.
Section 4.1 includes the results of the synthesis and characterization of the DESs.
Section 4.2 presents the results of applying DESs as electrolyte for electrochemical
behaviour of Fc and Cc+. Section 4.3 comprises voltammetric behavior of V(acac)3 and
kinetics of electrode reactions in DESs. Section 4.4 deals with the results of
charge/discharge experiments.
4.1 Synthesis and characterization of different DESs
The structures of the DESs prepared in this work and their abbreviations are shown
in Table 3.1. In order to get a better understanding of the interactions in these DESs and
investigate their potential applications in industry, selected important physical
properties of these DESs were measured. The measured properties include: electrical
conductivity (σ), viscosity (η), density (ρ), freezing point (Tf) and pH. The results are
summarized in Table 4.1.
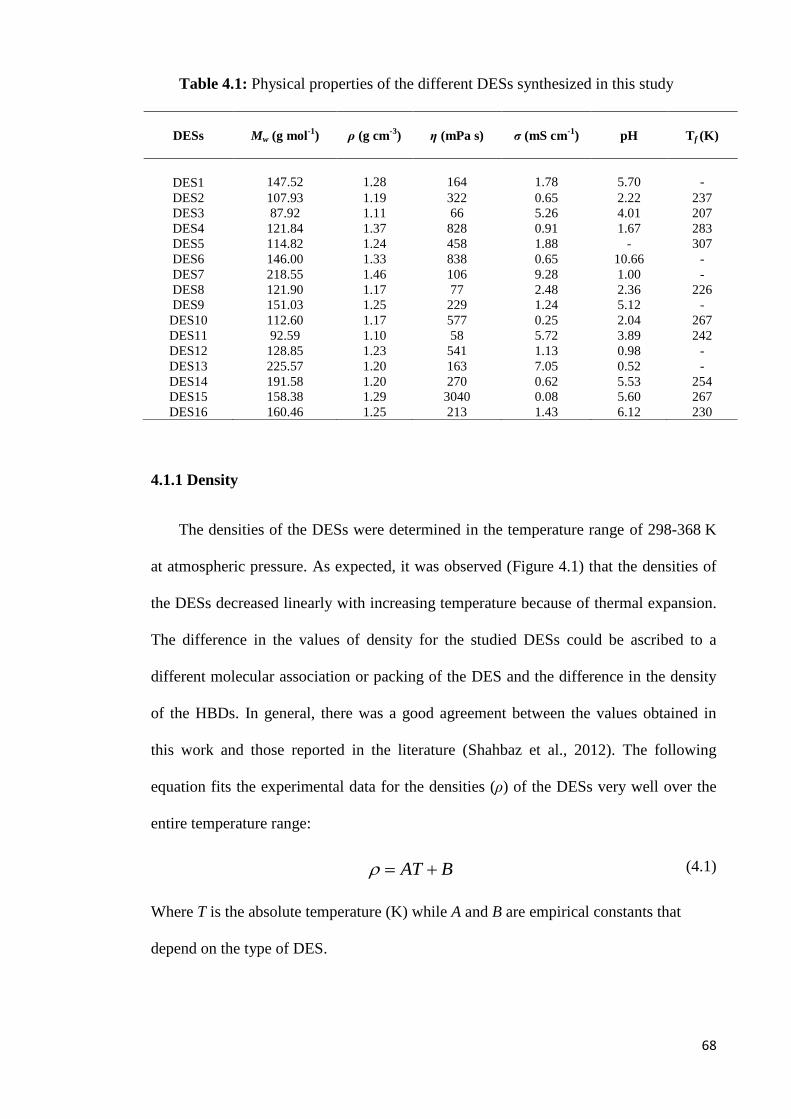
68
Table 4.1: Physical properties of the different DESs synthesized in this study
4.1.1 Density
The densities of the DESs were determined in the temperature range of 298-368 K
at atmospheric pressure. As expected, it was observed (Figure 4.1) that the densities of
the DESs decreased linearly with increasing temperature because of thermal expansion.
The difference in the values of density for the studied DESs could be ascribed to a
different molecular association or packing of the DES and the difference in the density
of the HBDs. In general, there was a good agreement between the values obtained in
this work and those reported in the literature (Shahbaz et al., 2012). The following
equation fits the experimental data for the densities (ρ) of the DESs very well over the
entire temperature range:
Where T is the absolute temperature (K) while A and B are empirical constants that
depend on the type of DES.
DESs Mw (g mol-1
) ρ (g cm-3
) η (mPa s) σ (mS cm-1
) pH Tf (K)
DES1
147.52
1.28
164
1.78
5.70
-
DES2 107.93 1.19 322 0.65 2.22 237
DES3 87.92 1.11 66 5.26 4.01 207
DES4 121.84 1.37 828 0.91 1.67 283
DES5 114.82 1.24 458 1.88 - 307
DES6 146.00 1.33 838 0.65 10.66 -
DES7 218.55 1.46 106 9.28 1.00 -
DES8 121.90 1.17 77 2.48 2.36 226
DES9 151.03 1.25 229 1.24 5.12 -
DES10 112.60 1.17 577 0.25 2.04 267
DES11 92.59 1.10 58 5.72 3.89 242
DES12 128.85 1.23 541 1.13 0.98 -
DES13 225.57 1.20 163 7.05 0.52 -
DES14 191.58 1.20 270 0.62 5.53 254
DES15 158.38 1.29 3040 0.08 5.60 267
DES16 160.46 1.25 213 1.43 6.12 230
AT B (4.1)
(a)
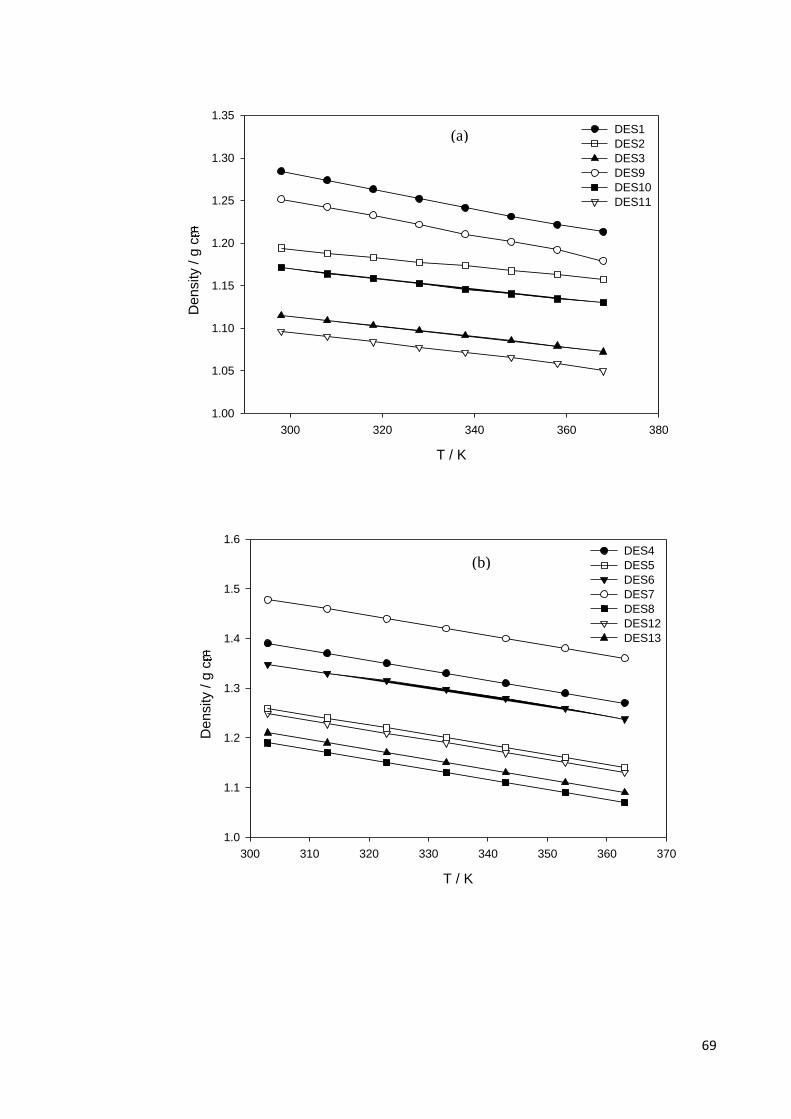
69
T / K
300 310 320 330 340 350 360 370
Density /
g c
m
1.0
1.1
1.2
1.3
1.4
1.5
1.6DES4
DES5
DES6
DES7
DES8
DES12
DES13
(b)
T / K
300 320 340 360 380
Density /
g c
m
1.00
1.05
1.10
1.15
1.20
1.25
1.30
1.35
DES1
DES2
DES3
DES9
DES10
DES11
(a)

70
‗Figure 4.1, continued‘
Figure 4.1: Dependence of densities (ρ) on temperature for; (a) DESs based on
ammonium salts and polyol HBDs; (b) ammonium based salts and acids, amine, amide,
zinc nitrate HBDs; (c) phosphonium based salts and polyol HBDs.
As shown in Table 4.1, DES7 has a higher density due to a higher intermolecular
packing of the compound‘s denser structure. The density of ethylene glycol based DESs
were found to be slightly less than those of other polyol-based counterparts. The
adjustable parameters of equation (3.1) for the density of all studied DESs are displayed
in Table 4.2.
Table 4.2: The adjustable parameters for density of some studied DESs.
DES Density DES Density
A B A B
DES1 -0.0010 1.5740 DES9 -0.0010 1.5530
DES2 -0.0005 1.3417 DES10 -0.0006 1.3503
DES3 -0.0006 1.2938 DES11 -0.0006 1.2852
DES4 -0.0020 1.9960 DES12 -0.0021 1.8459
DES5 -0.0019 1.8660 DES13 -0.0020 1.8160
DES6 -0.0018 1.8962 DES14 -0.0005 1.3582
DES7 -0.0020 2.0786 DES15 -0.0007 1.5077
DES8 -0.0019 1.7960 DES16 -0.0007 1.4578
T / K
300 320 340 360
De
nsity /
g c
m-
1.14
1.16
1.18
1.20
1.22
1.24
1.26
1.28
1.30
1.32
DES14
DES15
DES16
(c)
(c)

71
4.1.2 Viscosity
The viscosity is a very important parameter in electrochemical studies due to its
strong effect on the rate of mass transport within the solution. It significantly influences
the diffusion coefficient of species which are dissolved or dispersed in a media such as
an IL (Wu et al., 2011). The viscosity can be influenced by various parameters such as
the relative capacity to form hydrogen bonds, anionic species, size, higher alkalinity,
van der Waals forces and the size of the cation (Bandres et al., 2011). The viscosity is
generally affected by the interaction of the salt with the HBD and their ability to
coordinate. Figure 4.2 indicates that as the temperature increases from 298 to 368 K,
the viscosity of the DESs decreases due to the higher mobility of ions. DESs with the
glycerol HBD exhibits higher viscosities than other polyol based DESs, thus resulting in
lower conductivities (Figure 4.2(a)). Moreover, choline chloride based DESs show
lower viscosities in comparison to diethylenethanol ammonium chloride based DESs.
The value of viscosity at 298 K follows the order DES15 > DES6 > DES4 > DES10 >
DES12 > DES5 > DES2 > DES14 > DES9 > DES16 > DES1 > DES13> DES7 >
DES8 > DES3 > DES11.
T / K
300 320 340 360 380
mP
a s
0
100
200
300
400
500
600
700
DES 1
DES 2
DES 3
DES 9
DES 10
DES 11
(a)
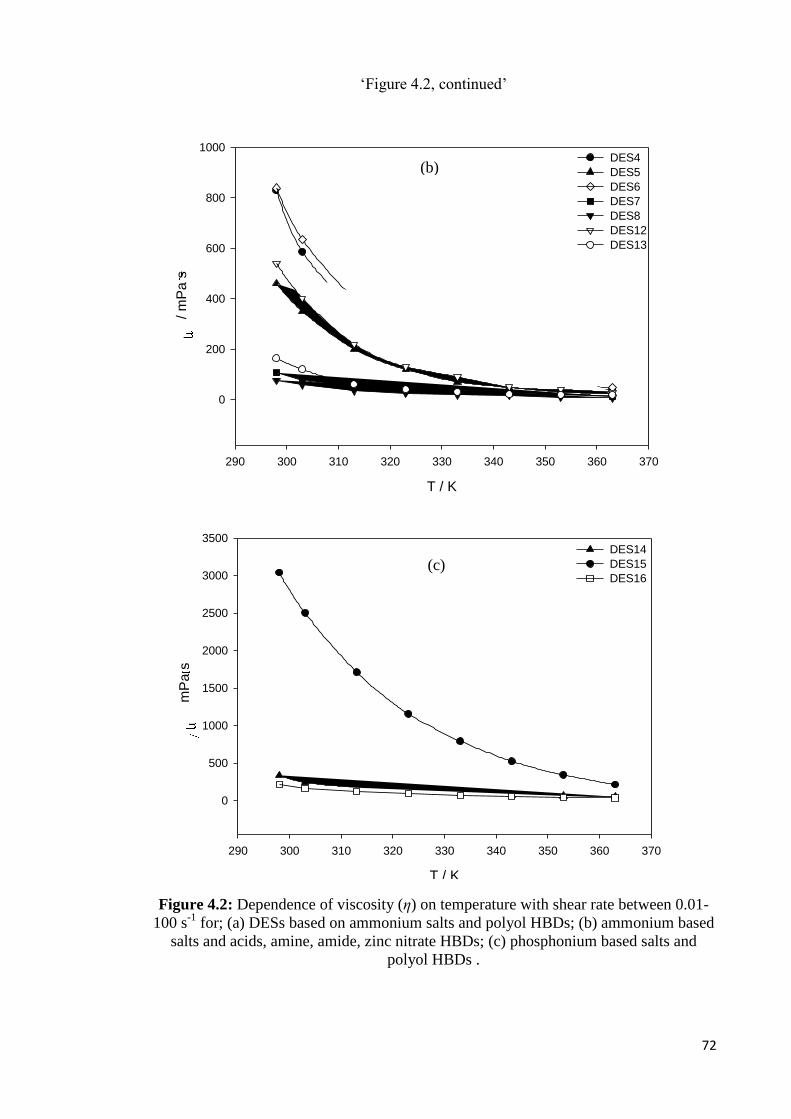
72
‗Figure 4.2, continued‘
Figure 4.2: Dependence of viscosity (η) on temperature with shear rate between 0.01-
100 s-1
for; (a) DESs based on ammonium salts and polyol HBDs; (b) ammonium based
salts and acids, amine, amide, zinc nitrate HBDs; (c) phosphonium based salts and
polyol HBDs .
T / K
290 300 310 320 330 340 350 360 370
/ m
Pa s
0
200
400
600
800
1000DES4
DES5
DES6
DES7
DES8
DES12
DES13
(b)
T / K
290 300 310 320 330 340 350 360 370
mP
a s
0
500
1000
1500
2000
2500
3000
3500DES14
DES15
DES16(c)

73
As can be seen in Figure 4.2(c), the viscosity of DES15 has a large value at low
temperatures in comparison to DES14 and DES16. However, it decreases sharply with
increasing temperature and reaches a value of around 2.14 Pa.s at 363K.
The temperature dependency of the viscosity (η) for the DESs and the profiles are fitted
to the Arrhenius equation (Eq. 4.2), which describes the temperature dependence for
non-associating electrolytes (Bonhote et al., 1996), as depicted in Figure 4.3.Where T is
the temperature in Kelvin, η is the viscosity in mPa.s, Eη is the activation energy, η0 is a
constant and R is the universal gas constant in kPa.L.mol-1
.K-1
.
The experimental method used to measure the viscosity could have an effect on the
obtained viscosity data, and within this effect it should be remarked that some DESs are
non-Newtonian fluids, which should be considered when analyzing their rheological
properties.
0ln ln
E
RT
(4.2)
1000 / T ( K )
2.6 2.7 2.8 2.9 3.0 3.1 3.2 3.3 3.4
ln (
m
Pa s
)
2
3
4
5
6
7DES1
DES2
DES3
DES9
DES10
DES11
(a)
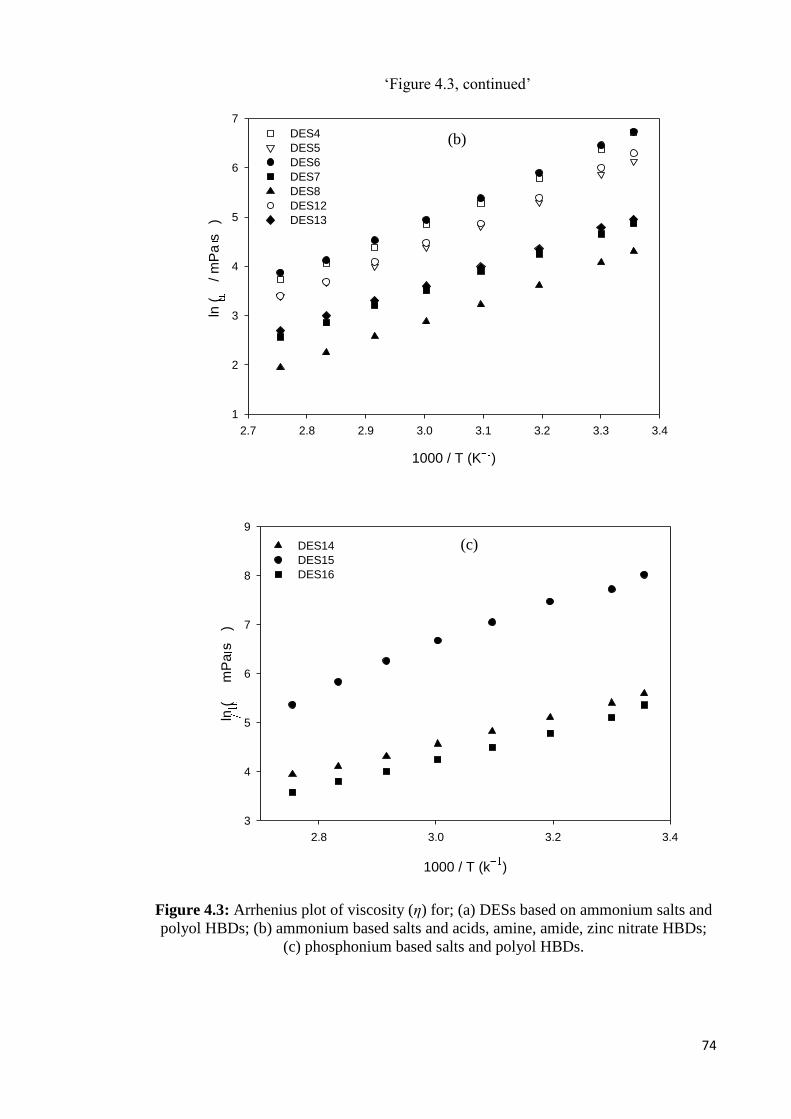
74
‗Figure 4.3, continued‘
Figure 4.3: Arrhenius plot of viscosity (η) for; (a) DESs based on ammonium salts and
polyol HBDs; (b) ammonium based salts and acids, amine, amide, zinc nitrate HBDs;
(c) phosphonium based salts and polyol HBDs.
1000 / T (K )
2.7 2.8 2.9 3.0 3.1 3.2 3.3 3.4
ln (
/
mP
a s
)
1
2
3
4
5
6
7
DES4
DES5
DES6
DES7
DES8
DES12
DES13
1000 / T (k )
2.8 3.0 3.2 3.4
ln (
mP
a s
)
3
4
5
6
7
8
9
DES14
DES15
DES16
(b)
(c)
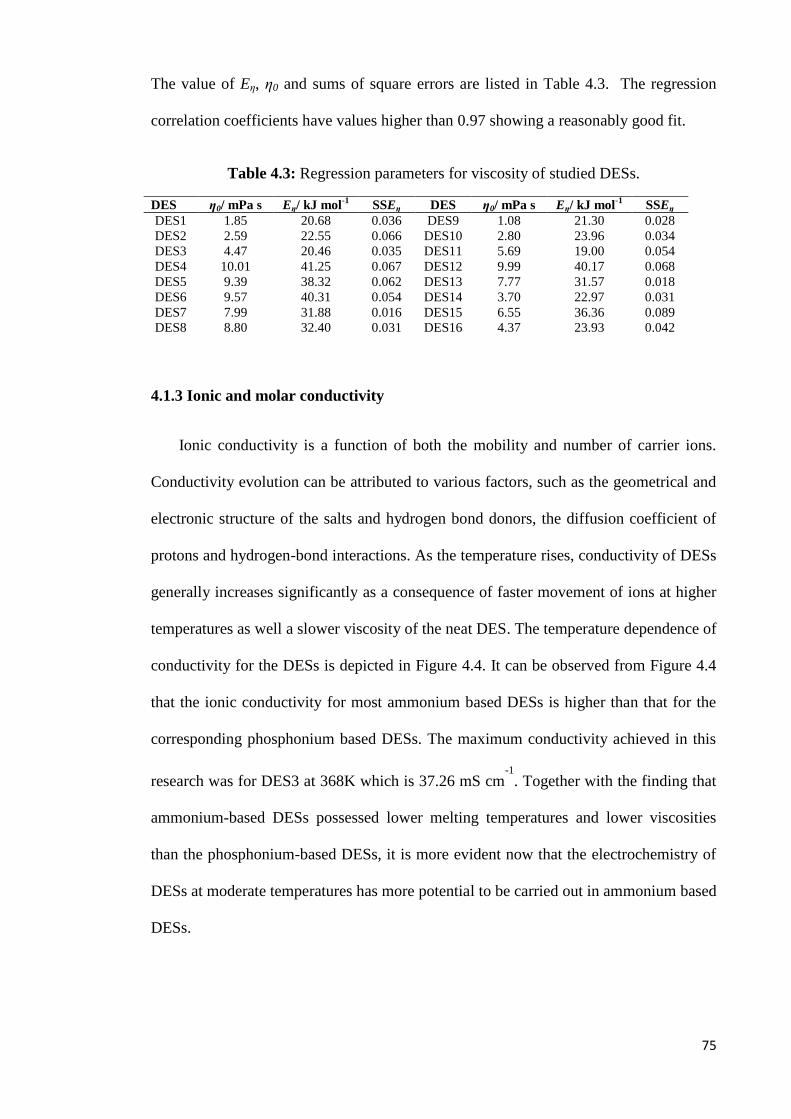
75
The value of Eη, η0 and sums of square errors are listed in Table 4.3. The regression
correlation coefficients have values higher than 0.97 showing a reasonably good fit.
Table 4.3: Regression parameters for viscosity of studied DESs.
4.1.3 Ionic and molar conductivity
Ionic conductivity is a function of both the mobility and number of carrier ions.
Conductivity evolution can be attributed to various factors, such as the geometrical and
electronic structure of the salts and hydrogen bond donors, the diffusion coefficient of
protons and hydrogen-bond interactions. As the temperature rises, conductivity of DESs
generally increases significantly as a consequence of faster movement of ions at higher
temperatures as well a slower viscosity of the neat DES. The temperature dependence of
conductivity for the DESs is depicted in Figure 4.4. It can be observed from Figure 4.4
that the ionic conductivity for most ammonium based DESs is higher than that for the
corresponding phosphonium based DESs. The maximum conductivity achieved in this
research was for DES3 at 368K which is 37.26 mS cm-1
. Together with the finding that
ammonium-based DESs possessed lower melting temperatures and lower viscosities
than the phosphonium-based DESs, it is more evident now that the electrochemistry of
DESs at moderate temperatures has more potential to be carried out in ammonium based
DESs.
DES η0/ mPa s Eη/ kJ mol-1
SSEη DES η0/ mPa s Eη/ kJ mol-1
SSEη
DES1 1.85 20.68 0.036 DES9 1.08 21.30 0.028
DES2 2.59 22.55 0.066 DES10 2.80 23.96 0.034
DES3 4.47 20.46 0.035 DES11 5.69 19.00 0.054
DES4 10.01 41.25 0.067 DES12 9.99 40.17 0.068
DES5 9.39 38.32 0.062 DES13 7.77 31.57 0.018
DES6 9.57 40.31 0.054 DES14 3.70 22.97 0.031
DES7 7.99 31.88 0.016 DES15 6.55 36.36 0.089
DES8 8.80 32.40 0.031 DES16 4.37 23.93 0.042
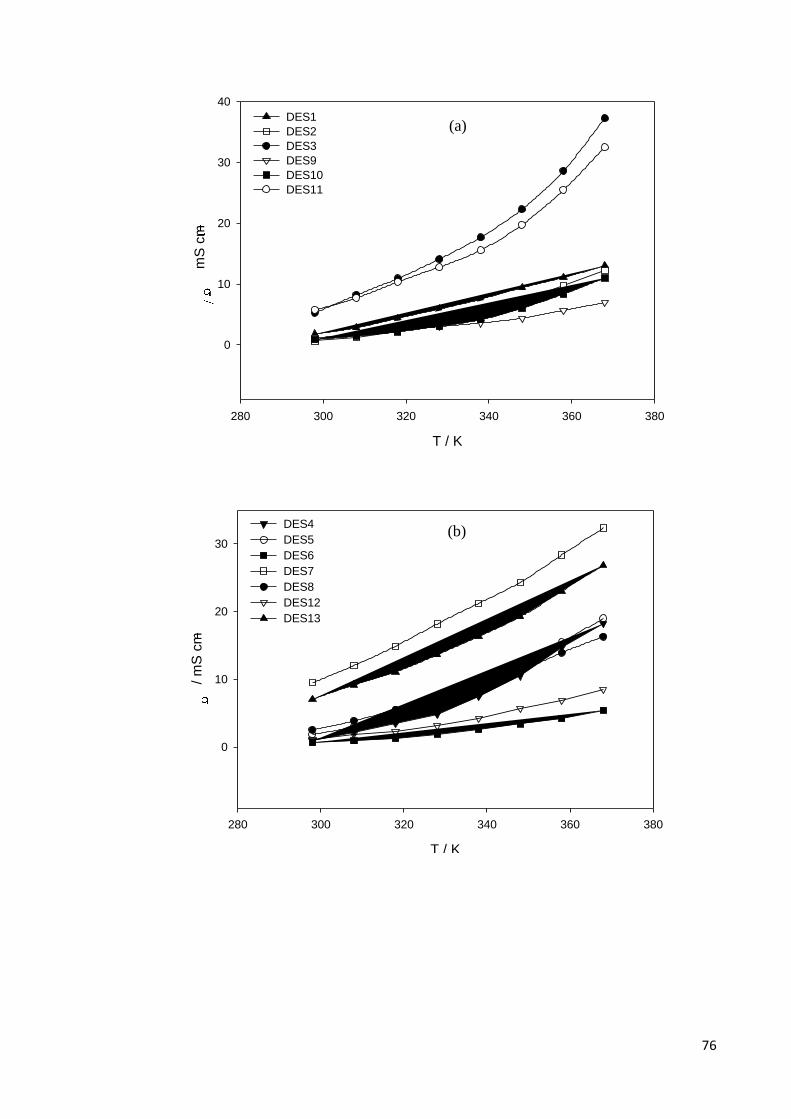
76
T / K
280 300 320 340 360 380
/ m
S c
m
0
10
20
30
DES4
DES5
DES6
DES7
DES8
DES12
DES13
T / K
280 300 320 340 360 380
mS
cm
0
10
20
30
40
DES1
DES2
DES3
DES9
DES10
DES11
(a)
(b)
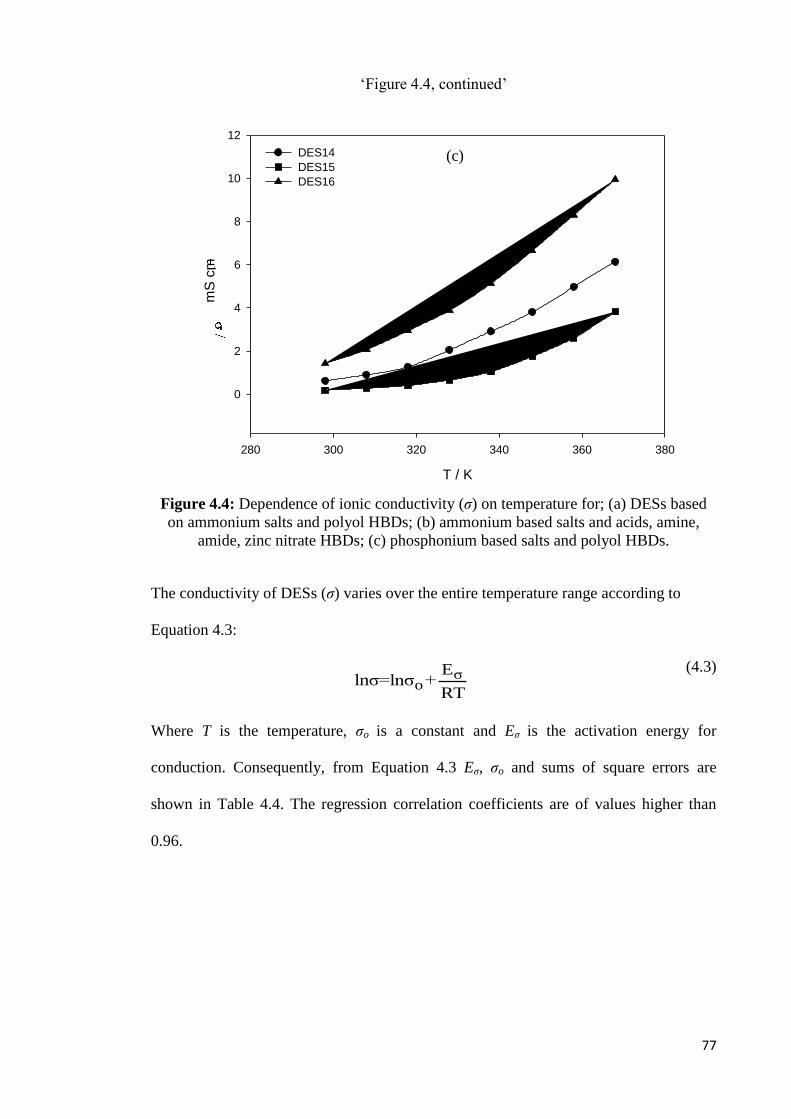
77
‗Figure 4.4, continued‘
Figure 4.4: Dependence of ionic conductivity (σ) on temperature for; (a) DESs based
on ammonium salts and polyol HBDs; (b) ammonium based salts and acids, amine,
amide, zinc nitrate HBDs; (c) phosphonium based salts and polyol HBDs.
The conductivity of DESs (σ) varies over the entire temperature range according to
Equation 4.3:
σo
Elnσ=lnσ +
RT
(4.3)
Where T is the temperature, σo is a constant and Eσ is the activation energy for
conduction. Consequently, from Equation 4.3 Eσ, σo and sums of square errors are
shown in Table 4.4. The regression correlation coefficients are of values higher than
0.96.
T / K
280 300 320 340 360 380
mS
cm
0
2
4
6
8
10
12
DES14
DES15
DES16
(c)
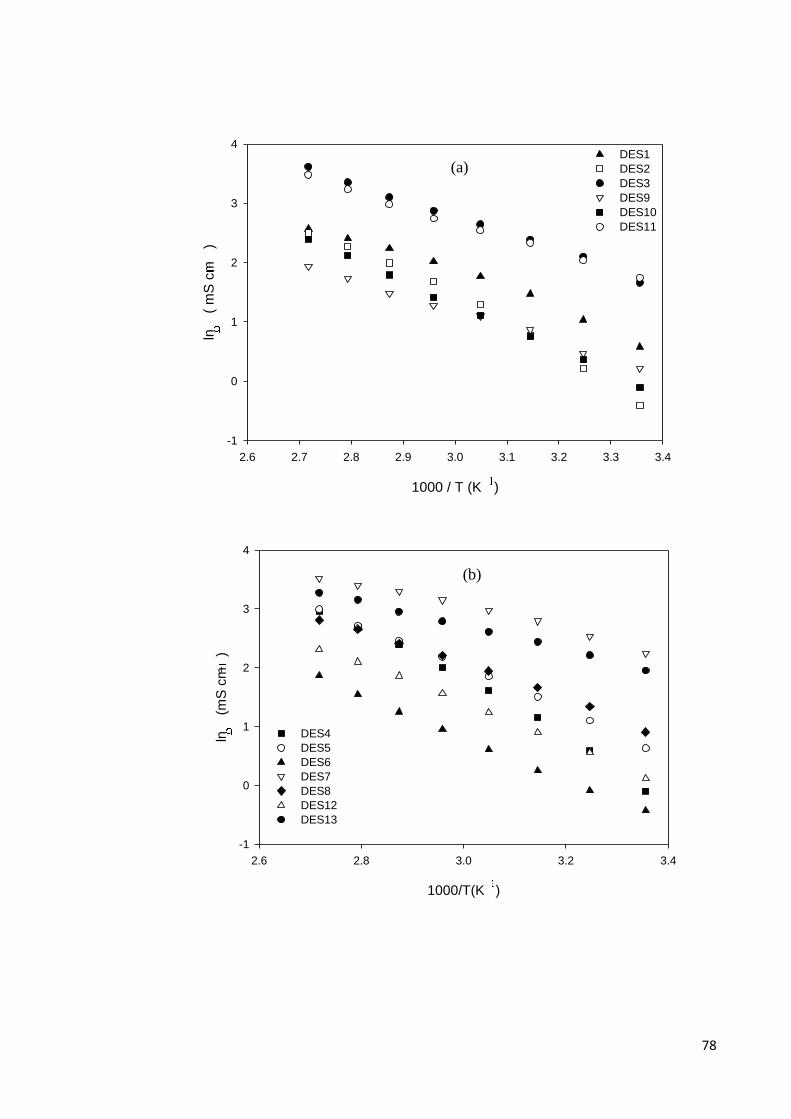
78
1000 / T (K )
2.6 2.7 2.8 2.9 3.0 3.1 3.2 3.3 3.4
ln
( m
S c
m)
-1
0
1
2
3
4DES1
DES2
DES3
DES9
DES10
DES11
1000/T(K )
2.6 2.8 3.0 3.2 3.4
ln
(m
S c
m)
-1
0
1
2
3
4
DES4
DES5
DES6
DES7
DES8
DES12
DES13
(a)
(b)

79
‗Figure 4.5, continued‘
Figure 4.5: Arrhenius plot of viscosity (η) for; (a) DESs based on ammonium salts and
polyol HBDs; (b) ammonium based salts and acids, amine, amide, zinc nitrate HBDs;
(c) phosphonium based salts and polyol HBDs.
Table 4.4: Regression parameters for ionic conductivity of studied DESs.
Molar conductivity Λ (m2Smol
−1) of the DESs as electrolytes was calculated using
the expression Λ= Veσ. The equivalent weight (Ve) of the DESs is measured from the
experimental density using the equation Ve= M/ρ, where ρ is the density and M is the
molar mass.
DES σo/mS cm-1
Eσ/kJ mol-1
SSEσ DES σo/mS cm-1
Eσ/kJ mol-1
SSEσ
DES1 10.02 23.97 0.068 DES9 11.13 25.70 0.102
DES2 15.44 38.48 0.197 DES10 16.03 40.72 0.160
DES3 10.56 21.61 0.097 DES11 8.88 17.52 0.046
DES4 16.35 39.9551 0.178 DES12 12.01 29.05 0.090
DES5 13.26 30.8320 0.102 DES13 9.07 17.40 0.051
DES6 11.99 30.6116 0.042 DES14 12.30 25.32 0.032
DES7 9.06 16.5350 0.087 DES15 14.30 39.85 0.103
DES8 11.14 24.9039 0.103 DES16 11.93 30.74 0.058
1000 / T (K )
2.6 2.8 3.0 3.2 3.4
ln
mS
cm
)
-2
-1
0
1
2
3
DES14
DES15
DES16
(c)

80
In order to discuss the ionic behavior, the plot of the equivalent conductivity against the
inverse of viscosity (Walden plot) for all the studied DESs over a temperature range of
298–368K is shown in Figure 4.6.When the conductivity is strongly correlated with the
viscosity, the Walden rule can be written as follows:
Where α is the slope of the line in the Walden plot, which reflects the decoupling of
the ions and C (Walden product) is a temperature-dependent constant. This scheme
provides a useful basis for classifying and arranging the ILs (Wu et al., 2011, Angell et
al., 2007, MacFarlane et al., 2009) due to the practical measure for examining the ion
pairing problem in electrolytes. It also helps in understanding the relationship between
conductivity and low vapor pressure that is, otherwise, not so apparent. The mobility of
ions in ILs is significantly different from that in non-aqueous solvents and there have
been very few assays to model the conductivity of ILs. Deviations from the Walden rule
seen in proton transfer ILs have previously been used to illustrate ionic association
(Martino et al., 2006, Wu et al., 2003). This rule is not fully feasible to ILs as it is only
applicable for ions at infinite dilution where ion-ion interactions can be disregarded,
which is obviously not the case in ILs. While there is clearly no validity behind the
application of the Walden rule to ILs it is interesting to perform this analysis for DESs
to observe how they compare with ILs with discrete anions.
The dotted ideal line in Figure 4.6 represents the data for aqueous KCl solutions at high
dilution, which corresponds to a system composed of equally mobile and fully
dissociated ions. In comparison to the ideal line it can be seen that most of DESs lie
below the ideal Walden line. DESs with zinc nitrate hexahydrate HBD examined from
Walden plots lie above the ideal line. DES2, DES4 and DES10 examined from Walden
plot lie closely to the ideal line which indicates that they are good ILs. The deviations of
Ληα = C (4.4)
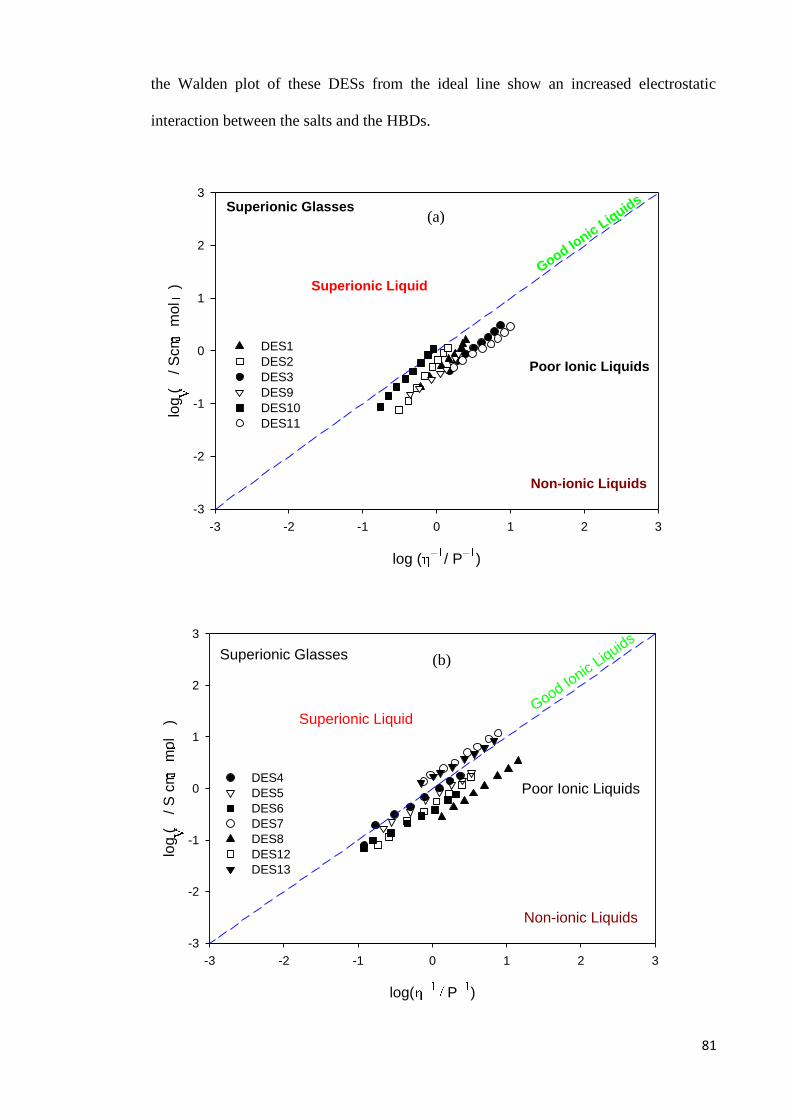
81
the Walden plot of these DESs from the ideal line show an increased electrostatic
interaction between the salts and the HBDs.
log( P )
-3 -2 -1 0 1 2 3
log (
/ S
cm
mo
l)
-3
-2
-1
0
1
2
3
Superionic Liquid
Superionic Glasses
Poor Ionic Liquids
Non-ionic Liquids
Good Ionic
Liquids
DES4
DES5
DES6
DES7
DES8
DES12
DES13
(b)
log ( / P )
-3 -2 -1 0 1 2 3
log (
/ S
cm
mo
l)
-3
-2
-1
0
1
2
3
Poor Ionic Liquids
Non-ionic Liquids
Good Ionic
Liq
uids
Superionic Liquid
Superionic Glasses
DES1
DES2
DES3
DES9
DES10
DES11
(a)

82
‗Figure 4.6, continued
Figure 4.6: Walden plot for for; (a) DESs based on ammonium salts and polyol HBDs;
(b) ammonium based salts and acids, amine, amide, zinc nitrate HBDs; (c)
phosphonium based salts and polyol HBDs.
4.1.4 pH
In this study, we also measured the pH of the synthesized DESs as a function of
temperature as indicated in Figure 4.7. The temperature dependence of pH was fitted
linearly and the parameters for fitting are depicted in Table 4.5. It seems that the type of
the HBD has a strong effect on determining the acidity and alkalinity of the DESs as
compare to the salts. The temperature dependence of pH has been fitted linearly and the
parameters needed for fitting are shown in Table 4.5.These results indicate that the pH
increases with rising temperature for DES2 and DES14. On the other hand, the pH of
DES1, DES3, DES6, DES9, DES11, DES13, DES15 and DES16 tends to decrease with
temperature. The pH of DES4, DES7, DES8, DES10 and DES12 do not change much
with temperature.
log ( / P )
-3 -2 -1 0 1 2 3
log (
Scm
mol
)
-3
-2
-1
0
1
2
3
Poor Ionic Liquids
Non-ionic Liquids
Good Ionic
Liquids
Superionic Liquids
Superionic Glasses
DES1
DES2
DES3
(c)

83
.
T / K
290 300 310 320 330 340 350 360 370
pH
0
2
4
6
8
10
12
DES4
DES6
DES7
DES8
DES12
DES13
T / K
290 300 310 320 330 340 350 360
pH
1
2
3
4
5
6
DES 1
DES 2
DES 3
DES 9
DES 10
DES 11
(a)
(b)

84
‗Figure 4.7, continued‘
Figure 4.7: Temperature-dependency of pH for; (a) DESs based on ammonium salts
and polyol HBDs; (b) ammonium based salts and acids, amine, amide, zinc nitrate
HBDs; (c) phosphonium based salts and polyol HBDs.
Table 4.5: The adjustable parameters for pH of all studied DESs.
4.2 Electrochemical behaviour of Fc and Cc+ in DESs
It is essential to employ either a reference electrode of a familiar potential against a
standard hydrogen electrode or refer all data to a procedure whose reversible potential is
to be independent of the DESs, in order to compare voltammetric data from different
eutectic solvents. The Ferrocene/ferrocenium (Fc/Fc+) or cobaltocenium/cobaltocene
(Cc+/Cc) redox couples is most prevalently used as an internal potential scale standard
DES pH DES pH
A B A B
DES1 -0.0456 19.2430 DES9 -0.0375 16.2579
DES2 0.0068 0.2436 DES10 0.0004 2.1183
DES3 -0.0206 10.1621 DES11 -0.0207 10.0490
DES4 -0.0077 3.8629 DES12 -0.0071 3.0329
DES5 - - DES13 -0.0247 8.8331
DES6 -0.0181 16.1631 DES14 0.0231 -1.3567
DES7 -0.0079 3.0900 DES15 -0.0075 7.8614
DES8 -0.0075 4.5317 DES16 -0.0055 7.7286
T / K
300 320 340 360
pH
5.0
5.2
5.4
5.6
5.8
6.0
6.2
6.4
6.6
6.8
DES14
DES15
DES16
(c)

85
in voltammetry in conventional organic solvent media (Gritzner and Kuta, 1984, Bond
et al., 2000). This process is also used in IL electrochemistry (Zhang and Bond, 2005,
Rogers et al., 2008). This work may be one of the few reports that provide a detailed
account on the determination of electrochemical potential windows, internal potential
references (based on the reduction of Cc+ and oxidation of Fc), diffusion and rate
coefficients of Fc and Cc+
as well as the Stokes–Einstein products of Fc and Cc+ in such
DESs (Bahadori et al., 2013a).
In addition, no fundamental study on the effect of temperature range variations for
the Fc/Fc+ oxidation and Cc
+/Cc reduction processes in DESs is available. DESs
perform the dual function of electrolyte and solvent and in this perception depict a
different kind of medium for electrochemical applications, so care in extrapolation of
concepts to the DES case is required. In the present work the electrochemical data and
kinetics of the Fc/Fc+
and Cc+/Cc redox couples obtained with cyclic voltammetry and
chronoamperometry methods in different DESs based on a quaternary phosphonium and
ammonium salts are reported over a range of temperatures (Bahadori et al., 2013b).
4.2.1 Electrochemical potential window
The electrochemical potential window (PW) is one of the most important
characteristics to be identified for electrolytes and solvents used in electrochemical
applications. PW is dependent on the type of electrodes, the measurement situation, and
the references employed. The arbitrary current cut-off used to define the onset of redox
processes (typically between 0.1 and 1.0 mA cm−2
) may not be strictly
electrochemically determined. This difficulty is further combined in the case of ILs due
to their sensitivity to air, water, and other impurities (Ong et al., 2011). The PW is a
significant indicator of electrochemical stability, when DESs are used as electrolytic
media for electrochemical devices. This is because the redox couple of an analyte must
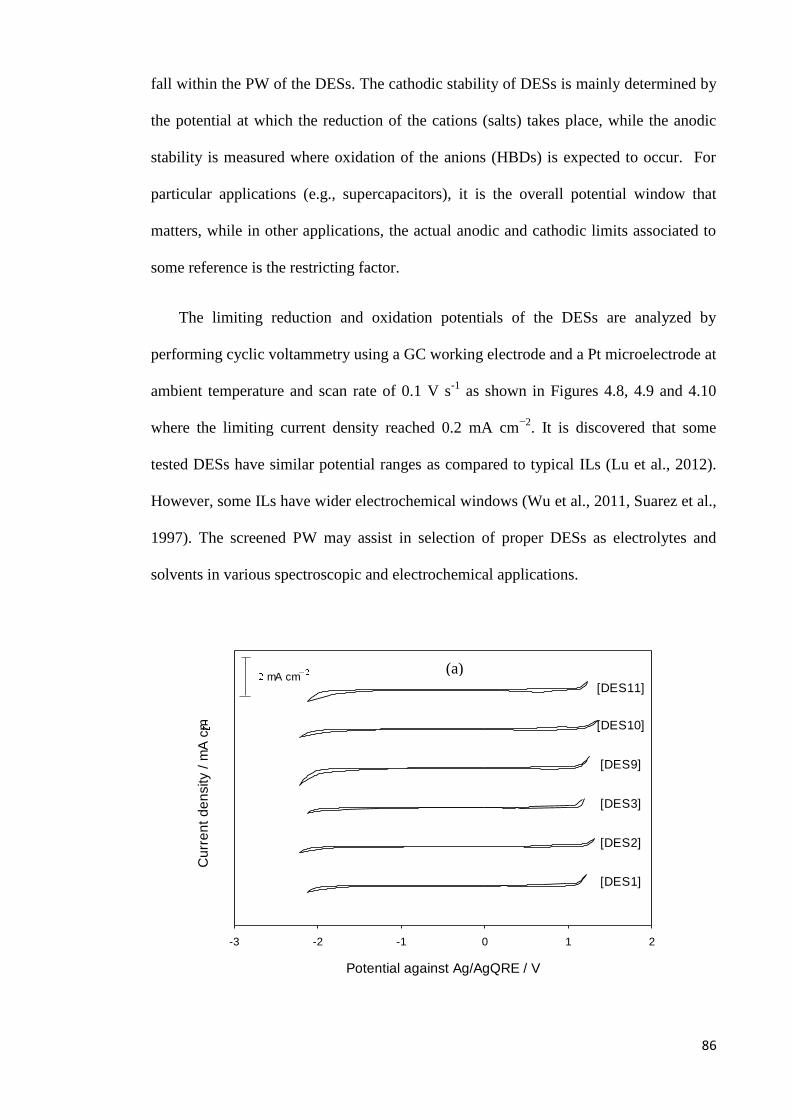
86
fall within the PW of the DESs. The cathodic stability of DESs is mainly determined by
the potential at which the reduction of the cations (salts) takes place, while the anodic
stability is measured where oxidation of the anions (HBDs) is expected to occur. For
particular applications (e.g., supercapacitors), it is the overall potential window that
matters, while in other applications, the actual anodic and cathodic limits associated to
some reference is the restricting factor.
The limiting reduction and oxidation potentials of the DESs are analyzed by
performing cyclic voltammetry using a GC working electrode and a Pt microelectrode at
ambient temperature and scan rate of 0.1 V s-1
as shown in Figures 4.8, 4.9 and 4.10
where the limiting current density reached 0.2 mA cm−2
. It is discovered that some
tested DESs have similar potential ranges as compared to typical ILs (Lu et al., 2012).
However, some ILs have wider electrochemical windows (Wu et al., 2011, Suarez et al.,
1997). The screened PW may assist in selection of proper DESs as electrolytes and
solvents in various spectroscopic and electrochemical applications.
Potential against Ag/AgQRE / V
-3 -2 -1 0 1 2
Cu
rre
nt
de
nsity /
mA
cm
[DES1]
[DES2]
[DES3]
[DES9]
[DES10]
[DES11]mA cm
(a)

87
‗Figure 4.8, continued‘
Potential against Ag/AgQRE / V
-1.5 -1.0 -0.5 0.0 0.5 1.0 1.5 2.0
Cu
rre
nt d
en
sity
/ m
A c
m
[DES1]
[DES2]
[DES3]
[DES9]
[DES10]
[DES11]5 mA cm
Figure 4.8: Electrochemical windows of DESs based on ammonium salts and polyol
HBDs using (a) GC working electrode; (b) Pt. microelectrode.
The limiting anodic and cathodic potentials of the DESs are listed in Table 4.6. The
potential window lies approximately between 2.02 and 6.65 V vs. Ag/AgQRE for the
GC electrode and between approximately 1.43 and 2.48V vs. Ag/AgQRE for the Pt.
microelectrode. The largest potential window is obtained using the GC working
electrode. The cathodic limit for the Pt. working electrode is smaller than that of its GC
counterpart. The anodic limit obtained at a Pt. microelectrode is smaller to those
obtained by means of the GC electrode except DES1, DES5, DES6 and DES7. The
cathodic and anodic potential limits are indicative of the PW of the DESs. However,
establishing a sequence of PW is difficult for all salts and HBDs combinations because
a suitable potential reference scale is not always available. However, when this is not a
problem, the cathodic and anodic limiting potentials are found to vary even when the
salts or HBDs present are common. For example, the oxidation potential limit occurs at
1.22 V (vs Ag/Ag+) in [choline chloride][ethylene glycol], 1.26 V (vs Ag/Ag
+) in [N,N-
Dimethylmethyleneiminium chloride][ ethylene glycol], and 0.69 V (vs Ag/Ag+) in
(b)
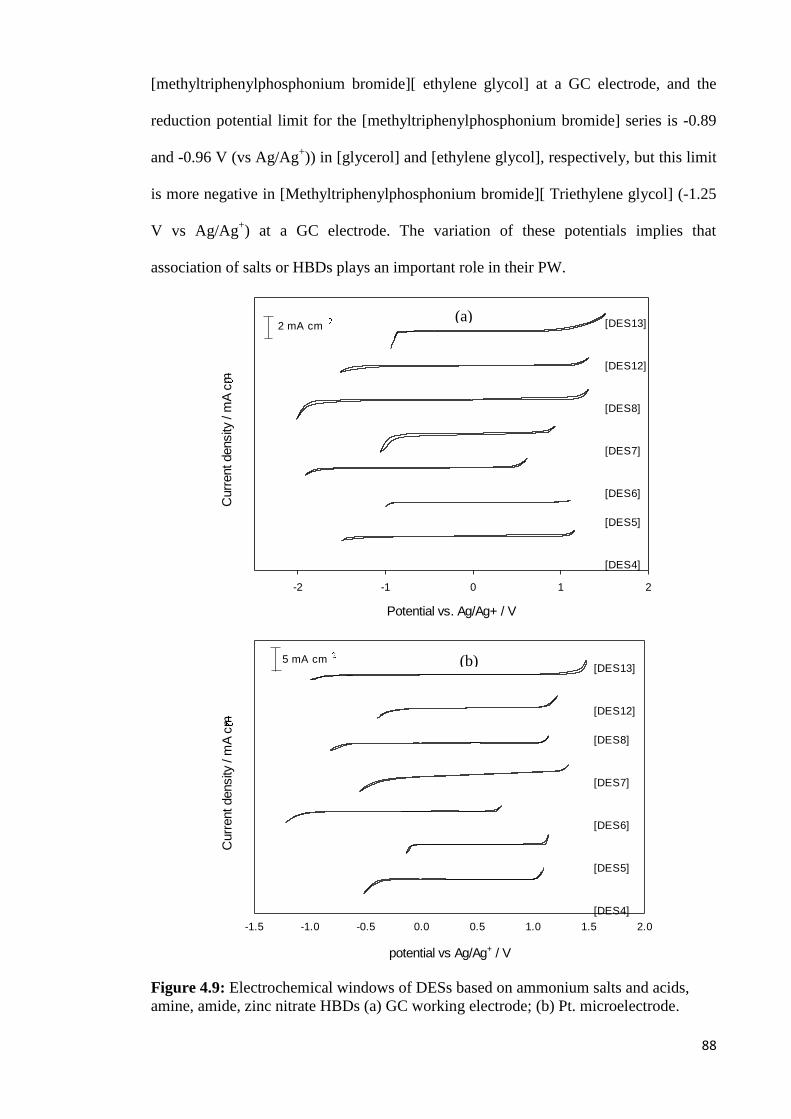
88
[methyltriphenylphosphonium bromide][ ethylene glycol] at a GC electrode, and the
reduction potential limit for the [methyltriphenylphosphonium bromide] series is -0.89
and -0.96 V (vs Ag/Ag+)) in [glycerol] and [ethylene glycol], respectively, but this limit
is more negative in [Methyltriphenylphosphonium bromide][ Triethylene glycol] (-1.25
V vs Ag/Ag+) at a GC electrode. The variation of these potentials implies that
association of salts or HBDs plays an important role in their PW.
Potential vs. Ag/Ag+ / V
-2 -1 0 1 2
Curr
ent density
/ m
A c
m
[DES13]
[DES12]
[DES8]
[DES7]
[DES6]
[DES5]
[DES4]
2 mA cm
potential vs Ag/Ag+ / V
-1.5 -1.0 -0.5 0.0 0.5 1.0 1.5 2.0
Curr
ent density
/ m
A c
m
[DES13]
[DES12]
[DES8]
[DES7]
[DES6]
[DES5]
[DES4]
5 mA cm
Figure 4.9: Electrochemical windows of DESs based on ammonium salts and acids,
amine, amide, zinc nitrate HBDs (a) GC working electrode; (b) Pt. microelectrode.
(a)
(b)

89
Table 4.6: Electrochemical potential windows for the DESs based on ammonium salts
and polyol HBDs obtained by means of GC and Pt. electrodes.
Figure 4.8 shows the cathodic potential on the Pt. electrode decreased for the DESs in
the order DES1 >DES2 >DES3 when using the choline chloride salt. However, for
DESs made with the diethylenethanol ammonium chloride salt the cathodic potential
values are similar. Such variations are not seen for the anodic potential.
It needs to be noted that some tested DESs, e.g., DES2, DES9, DES14 have a relatively
high reduction limit. This allows the use of these DESs in many important
electrochemical processes like the generation of a stable superoxide ion (Hayyan et al.,
2012).
DESs Electrode
Material
Anodic limit/ V Cathodic limit
/ V
Potential
windows
DES1 GC
Pt
1.23
1.27
-2.13
-1.21
3.36
2.48
DES2 GC
Pt
1.31
1.28
-2.19
-1.08
3.50
2.36
DES3 GC
Pt
1.22
1.11
-2.12
-1.22
3.34
2.33
DES4 GC
Pt
1.15
1.11
-1.49
-0.51
2.64
1.62
DES5 GC
Pt
1.11
1.14
-0.99
-0.29
2.10
1.43
DES6 GC
Pt
0.61
0.65
-1.91
-1.11
2.52
1.76
DES7 GC
Pt
0.93
1.31
-1.09
-0.55
2.02
1.86
DES8 GC
Pt
1.31
1.13
-2.01
-0.81
3.32
1.94
DES9 GC
Pt
1.30
1.18
-2.18
-0.72
3.48
1.90
DES10 GC
Pt
1.35
1.21
-2.17
-0.90
3.52
2.11
DES11 GC
Pt
1.26
1.19
-2.13
-0.75
3.39
1.94
DES12 GC
Pt
1.31
1.21
-1.51
-0.39
2.82
1.60
DES13 GC
Pt
1.51
1.47
-0.91
-0.97
2.42
2.44
DES14 GC
Pt
2.67
0.79
-3.89
-1.25
6.65
2.04
DES15 GC
Pt
1.21
0.75
-1.84
-0.89
3.05
1.64
DES16 GC
Pt
1.03
0.69
-1.63
-0.96
2.66
1.65
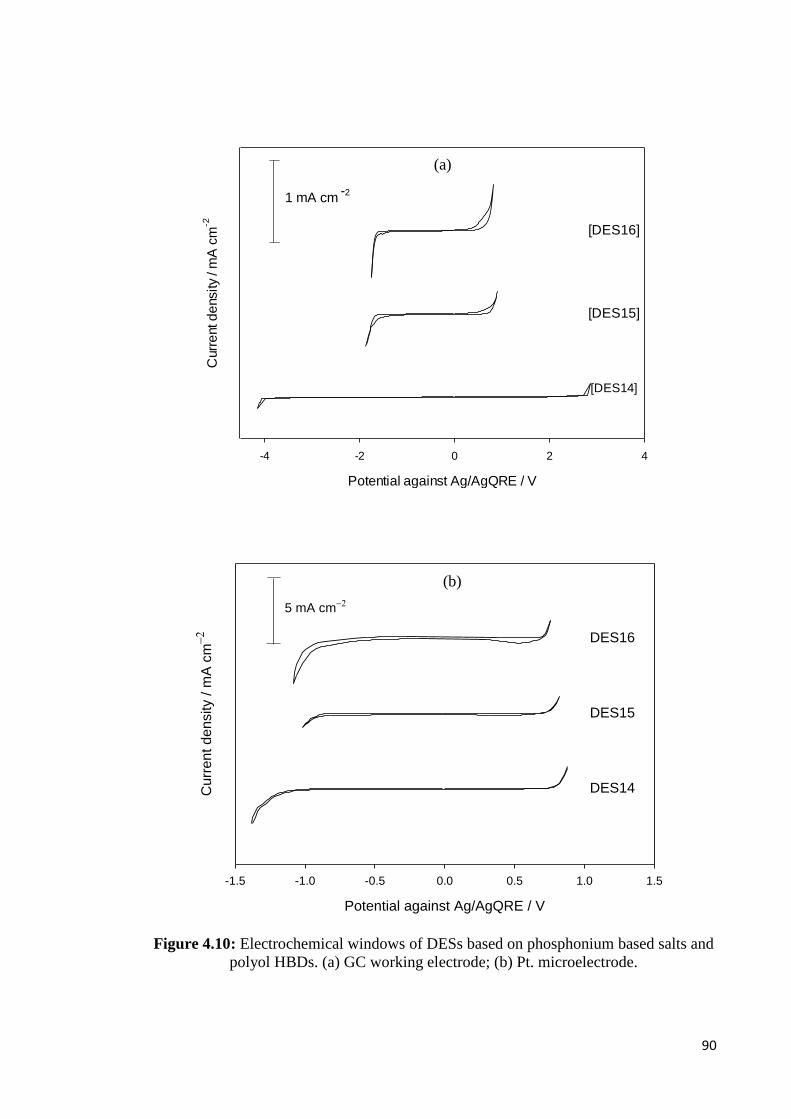
90
Potential against Ag/AgQRE / V
-4 -2 0 2 4
Curr
ent d
ensity
/ m
A c
m-2
[DES14]
[DES15]
[DES16]
1 mA cm -2
Potential against Ag/AgQRE / V
-1.5 -1.0 -0.5 0.0 0.5 1.0 1.5
Curr
en
t de
nsity /
mA
cm
DES14
DES15
DES16
5 mA cm
Figure 4.10: Electrochemical windows of DESs based on phosphonium based salts and
polyol HBDs. (a) GC working electrode; (b) Pt. microelectrode.
(a)
(b)

91
4.2.2 Cyclic voltammetry for oxidation of Fc and reduction of Cc+ in various DESs
Figure 4.11 shows typical cyclic voltammograms for the oxidation of 5.21 mM
solution of Fc and Cc+ in DES11 on a platinum microelectrode (20 µm diameter) at scan
rates ranging from 10 to 100 mV s-1
. The voltammetry is reported against a silver wire
quasi-reference electrode and Pt counter electrode. The scan rate dependence indicates
that the oxidation of Fc to Fc+ in DESs follows Equations 4.5 and 4.6.
(4.5)
(4.6)
+ -5 5 2 5 5 2Co(C H ) + e Co(C H )
+ -5 5 2 5 5 2 Fc(C H ) Fc(C H ) + e
E / V vs Ag
0.0 0.1 0.2 0.3 0.4 0.5 0.6 0.7
I /
nA
-0.2
-0.1
0.0
0.1
0.2
0.3
10 mVs
30 mVs
50 mVs
70 mVs
100 mVs
(a)
(a)
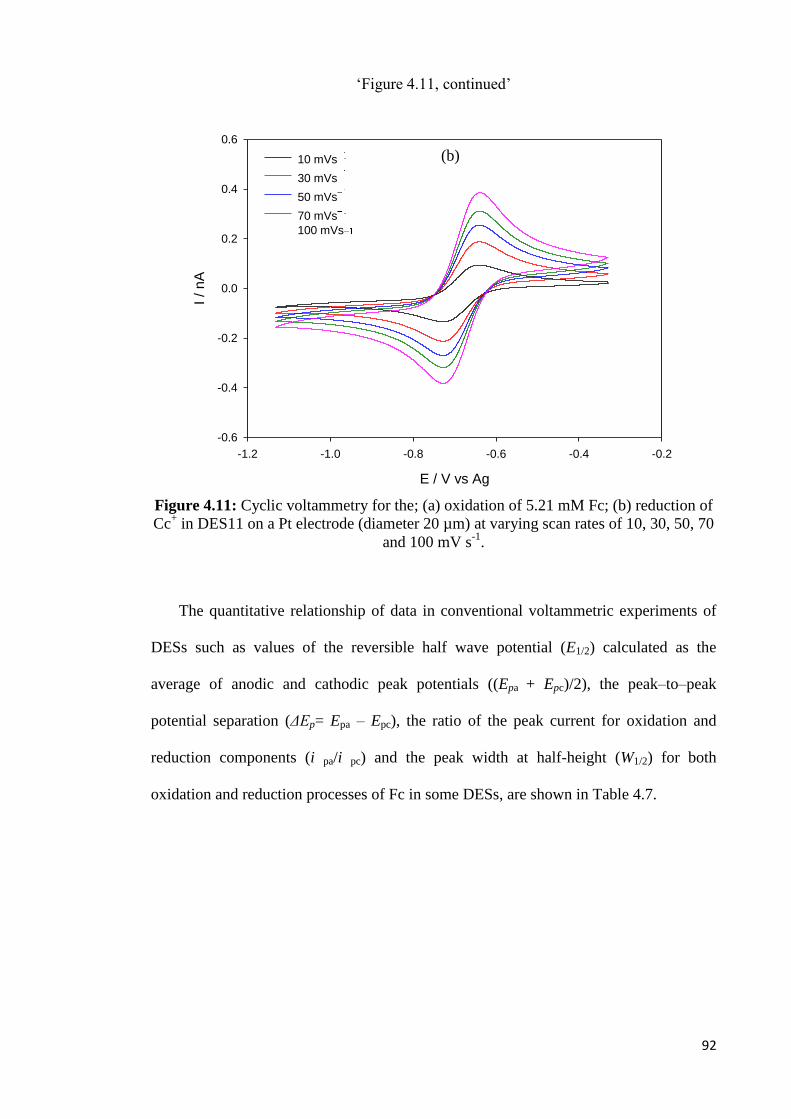
92
‗Figure 4.11, continued‘
Figure 4.11: Cyclic voltammetry for the; (a) oxidation of 5.21 mM Fc; (b) reduction of
Cc+ in DES11 on a Pt electrode (diameter 20 µm) at varying scan rates of 10, 30, 50, 70
and 100 mV s-1
.
The quantitative relationship of data in conventional voltammetric experiments of
DESs such as values of the reversible half wave potential (E1/2) calculated as the
average of anodic and cathodic peak potentials ((Epa + Epc)/2), the peak–to–peak
potential separation (ΔEp= Epa – Epc), the ratio of the peak current for oxidation and
reduction components (i pa/i pc) and the peak width at half-height (W1/2) for both
oxidation and reduction processes of Fc in some DESs, are shown in Table 4.7.
E / V vs Ag
-1.2 -1.0 -0.8 -0.6 -0.4 -0.2
I /
nA
-0.6
-0.4
-0.2
0.0
0.2
0.4
0.6
10 mVs
30 mVs
50 mVs
70 mVs
100 mVs
(b)
(b)
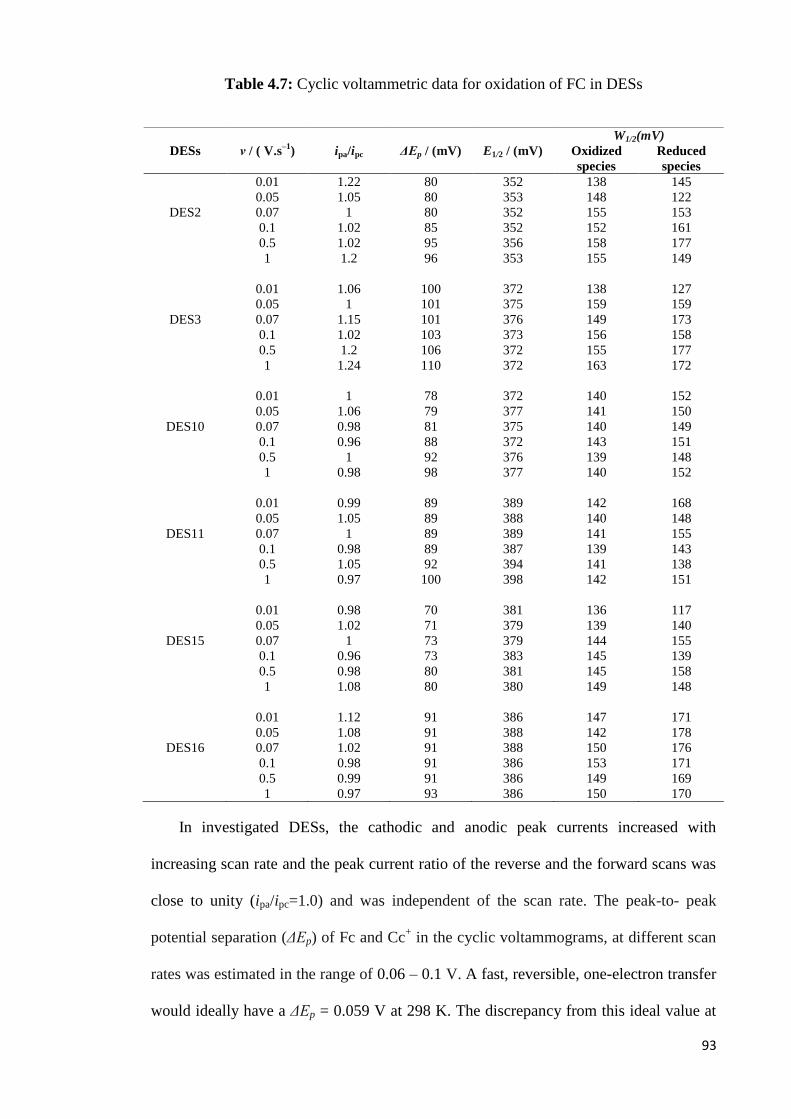
93
Table 4.7: Cyclic voltammetric data for oxidation of FC in DESs
In investigated DESs, the cathodic and anodic peak currents increased with
increasing scan rate and the peak current ratio of the reverse and the forward scans was
close to unity (ipa/ipc=1.0) and was independent of the scan rate. The peak-to- peak
potential separation (ΔEp) of Fc and Cc+ in the cyclic voltammograms, at different scan
rates was estimated in the range of 0.06 – 0.1 V. A fast, reversible, one-electron transfer
would ideally have a ΔEp = 0.059 V at 298 K. The discrepancy from this ideal value at
DESs ν / ( V.s–1
) ipa/ipc ΔEp / (mV) E1/2 / (mV)
W1/2(mV)
Oxidized
species
Reduced
species
0.01 1.22 80 352 138 145
0.05 1.05 80 353 148 122
DES2 0.07 1 80 352 155 153
0.1 1.02 85 352 152 161
0.5 1.02 95 356 158 177
1 1.2 96 353 155 149
0.01 1.06 100 372 138 127
0.05 1 101 375 159 159
DES3 0.07 1.15 101 376 149 173
0.1 1.02 103 373 156 158
0.5 1.2 106 372 155 177
1 1.24 110 372 163 172
0.01 1 78 372 140 152
0.05 1.06 79 377 141 150
DES10 0.07 0.98 81 375 140 149
0.1 0.96 88 372 143 151
0.5 1 92 376 139 148
1 0.98 98 377 140 152
0.01 0.99 89 389 142 168
0.05 1.05 89 388 140 148
DES11 0.07 1 89 389 141 155
0.1 0.98 89 387 139 143
0.5 1.05 92 394 141 138
1 0.97 100 398 142 151
0.01 0.98 70 381 136 117
0.05 1.02 71 379 139 140
DES15 0.07 1 73 379 144 155
0.1 0.96 73 383 145 139
0.5 0.98 80 381 145 158
1 1.08 80 380 149 148
0.01 1.12 91 386 147 171
0.05 1.08 91 388 142 178
DES16 0.07 1.02 91 388 150 176
0.1 0.98 91 386 153 171
0.5 0.99 91 386 149 169
1 0.97 93 386 150 170

94
higher concentrations and scan rates in DESs was attributed to the effect of either slow
heterogeneous electron transfer kinetics or the enhanced impact of Ohmic drop as was
previously described by other researchers (Zhao et al., 2008, Sukardi et al., 2008, Zhang
and Bond, 2003). Also it was observed that for different scan rates the E1/2 and W1/2
remained constant. The redox potential for a couple was better approximated by the
half-wave potential (E1/2) rather than by the cathodic peak (Epc) or anodic peak (Epa)
potentials, because both Epa and Epc change with the scan rates while E1/2 was
independent of the scan rate; as was expected for a reversible system.
In consideration of the above, we assumed that the electrochemical reaction of
Fc/Fc+ and Cc
+/Cc was reversible at the respective scan rates in order to calculate the
diffusion coefficients of Fc and Cc+. The peak current was linearly varying with the
square root of the scan rate on platinum microelectrode as exhibited in Figure 4.12. This
confirms that the process is mainly regulated by the diffusion of Fc/Fc+ and Cc
+/Cc in
the DESs.
The diffusion coefficients (D) have been calculated using the Randles-Sevcik
equation (Eq. 4.7) (Randles, 1948), which presumes that mass transport occurs only by a
diffusion process and they are shown in Table 4.8. According to the Randles-Sevcik
equation, ipa and ipc are proportional to ν1/2
and hence a plot of ipa or ipc versus ν1/2
gives a
straight line; the slope of which can be used to determine the D.
where ip is the peak current (A), n is the number of electron equivalent exchanged
during the redox process (electron stoichiometry), A is the electrode area (cm2) , D is
the diffusion coefficient of the electroactive species (cm2 s
–1), ν is the voltage scan rate
(V s-1
), CO is the bulk concentration of the electroactive species (mol cm–3
), R is the
universal gas constant, T is the absolute temperature (K) and F is Faraday‘s constant.
ip = 0.4463(nF)3/2
(RT)−1/2
AD1/2
C0ν1/2
(4.7)

95
Figure 4.12: Linear dependence of peak current vs. square root of scan rates (SR) for;
(a) Fc and; (b) Cc+ using a Pt electrode in DES11.
sqrt of SR (mV s-1
)
0.20 0.25 0.30 0.35
cu
rre
nt
(nA
)
0.35
0.40
0.45
0.50
0.55
0.60
0.65
y=0.3447x-0.1070
R2=0.9995
sqrt of SR (mV s )
0.05 0.10 0.15 0.20 0.25 0.30 0.35
Cu
rre
nt
(nA
)
-0.40
-0.35
-0.30
-0.25
-0.20
-0.15
-0.10
y= 0.3230x-0.0178
R2=0.9995
(a)
(b)
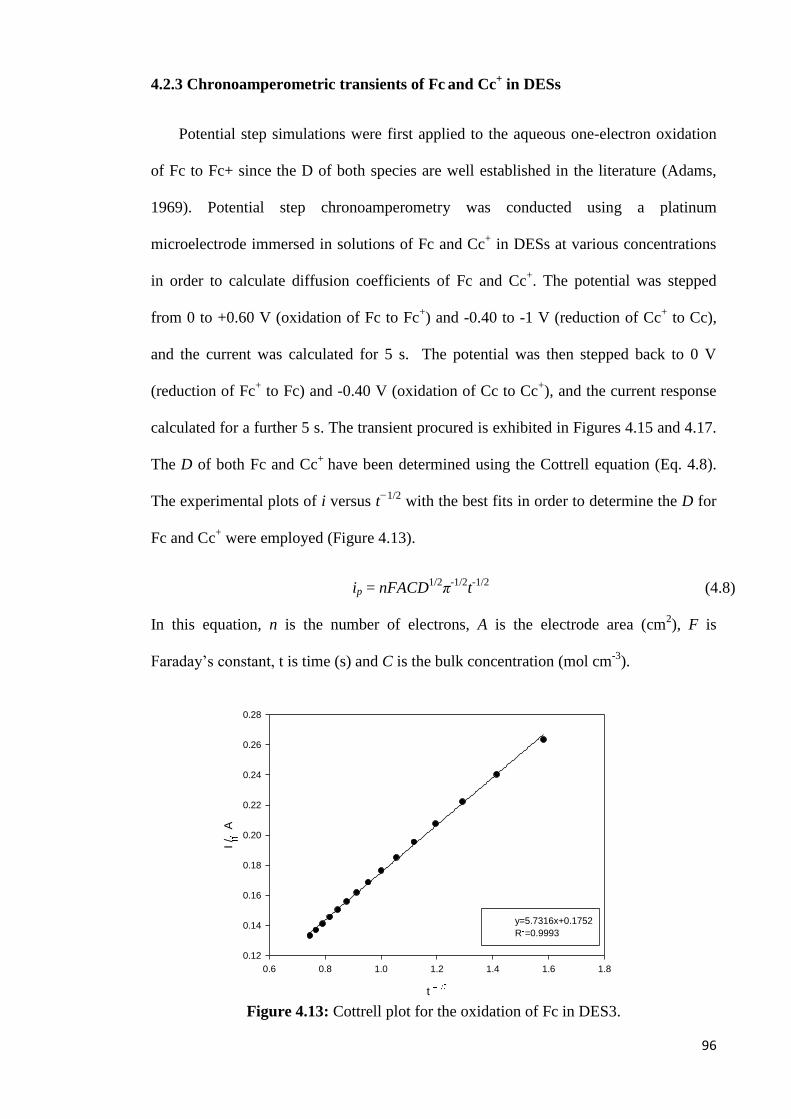
96
4.2.3 Chronoamperometric transients of Fc and Cc
+ in DESs
Potential step simulations were first applied to the aqueous one-electron oxidation
of Fc to Fc+ since the D of both species are well established in the literature (Adams,
1969). Potential step chronoamperometry was conducted using a platinum
microelectrode immersed in solutions of Fc and Cc+ in DESs at various concentrations
in order to calculate diffusion coefficients of Fc and Cc+. The potential was stepped
from 0 to +0.60 V (oxidation of Fc to Fc+) and -0.40 to -1 V (reduction of Cc
+ to Cc),
and the current was calculated for 5 s. The potential was then stepped back to 0 V
(reduction of Fc+ to Fc) and -0.40 V (oxidation of Cc to Cc
+), and the current response
calculated for a further 5 s. The transient procured is exhibited in Figures 4.15 and 4.17.
The D of both Fc and Cc+
have been determined using the Cottrell equation (Eq. 4.8).
The experimental plots of i versus t−1/2
with the best fits in order to determine the D for
Fc and Cc+ were employed (Figure 4.13).
ip = nFACD1/2
π-1/2
t-1/2
(4.8)
In this equation, n is the number of electrons, A is the electrode area (cm2), F is
Faraday‘s constant, t is time (s) and C is the bulk concentration (mol cm-3
).
Figure 4.13: Cottrell plot for the oxidation of Fc in DES3.
t
0.6 0.8 1.0 1.2 1.4 1.6 1.8
I /
A
0.12
0.14
0.16
0.18
0.20
0.22
0.24
0.26
0.28
y=5.7316x+0.1752
R =0.9993

97
To further support this conclusion and analyse these transients, the data from the
first potential step were initially fitted to the analytical Shoup and Szabo expression
(Shoup and Szabo, 1982) in order to determine D for Fc and Cc+ after inputting values
for the concentration and electrode radius. A close fit between the experimental and
simulated transients of Fc/Fc+ and Cc
+/Cc was achieved, as shown for a typical
experimental transient in Figure 4.15. The values for DFc and DCc using
chronoamperometry technique are displayed in Table 4.8. Herein, D was found to be
lower than those determined in organic solvents due to higher viscosities of DESs
(Tsierkezos, 2007). However, the D of Fc reported here are of the same order of
magnitude with those of ILs (Zhao et al., 2008, Rogers et al., 2008) and D of Cc+ was
found to be 10 times lower than those reported by Lewandowski et al. (2013).
4.2.4 The heterogeneous electron-transfer rates for the Fc and Cc+ in DESs
Nicholson‘s method (Nicholson, 1965) was the first approach used to evaluate the
heterogeneous rate constant (k0). Anodic and cathodic peak separations from a
background were subtracted from a voltammogram for a simple one electron transfer
reaction and further used to determine ψ from which (k0) was achieved using Eq. 4.9:
0
1/2
kψ =
(π D )a (4.9)
Where a = nFν/R, D0 is the diffusion coefficient, ν is the scan rate, ψ is a kinetic
parameter and all other symbols have their usual meaning. For this experiment the data
has been acquired at 298 K, C = 5.21 mM, ν = 0.1 V s-1
and thus linear diffusion was
expected to dominate. If D has been determined, either from cyclic voltammetry for a
reversible system or using a suitable chronoamperometric technique, k0 can be estimated
by measuring cyclic voltammograms at various scan rates and fitting the observed
variation in peak separation to tabulated values. k0 of Fc and Cc+ in DESs were

98
summarized in Table 4.8. The k0 calculated for Fc was between 5.87×10⁻⁵
and 5.36×10⁻⁴
cm s-1
. Other reports in the literature (Kim et al., 2013, Pan et al., 2012, Matsumiya et
al., 2006) showed that k0 for Fc/Fc+ was lower in DESs as compared to those in ILs and
common organic electrolyte solutions (.Matsumiya et al., 2006). It was reported that the
k0 could be correlated to the solution‘s viscosity. The k0
calculated for Cc+ was between
1.91×10⁻⁵
and 4.35×10⁻⁴
cm s-1
. As noted by Tsierkezos et al. (2008), studies of the k0
for the Cc/Cc+ reaction in organic solvents produced values about 100× higher than
those determined in DESs.
Table 4.8: Kinetic parameters and D for Fc/Fc+ and Cc
+/Cc in DESs.
Redox species DES
D / cm2 s
-1
k0/ cm s
-1 CV CA
Fc/Fc+
DES1 1.68×10⁻⁸
(±0.03) 1.71×10⁻⁸
(±0.06)
DES2 4.07×10⁻⁹
(±0.08) 3.96×10⁻⁹
(±0.09) 2.18×10⁻⁴
DES3 3.08×10⁻⁸
(±0.09) 3.12×10⁻⁸
(±0.04) 3.08×10⁻⁴
DES4 1.23×10⁻⁹
(±0.03) 1.36×10⁻⁹
(±0.04) 9.19×10⁻⁵
DES5 3.70×10⁻⁹
(±0.10) 4.05×10⁻⁹
(±0.08) 4.25×10⁻⁴
DES6 1.13×10⁻⁹
(±0.08) 1.16×10⁻⁹
(±0.02) 5.87×10⁻⁵
DES7 8.54×10⁻⁹
(±0.04) 8.63×10⁻⁹
(±0.05) 3.23×10⁻⁴
DES8 3.11×10⁻⁸
(±0.10) 3.32×10⁻⁸
(±0.05) 5.36×10⁻⁴
DES9 4.01×10⁻⁹
(±0.08) 4.41×10⁻⁹
(±0.04) 2.31×10⁻⁴
DES10 3.25×10⁻⁹
(±0.03) 3.40×10⁻⁹
(±0.04) 1.68×10⁻⁴
DES11 3.22×10⁻⁸
(±0.10) 3.95×10⁻⁸
(±0.02) 5.44×10⁻⁴
DES12 3.21×10⁻⁹
(±0.06) 3.39×10⁻⁹
(±0.08) 1.72×10⁻⁴
DES13 6.24×10⁻⁹
(±0.02) 6.67×10⁻⁹
(±0.05) 2.15×10⁻⁴
DES14 3.26×10⁻⁹
(±0.05) 3.76×10⁻⁹
(±0.07) 1.38×10⁻⁴
DES15 9.12×10⁻¹⁰
(±0.06) 8.88×10⁻¹⁰
(±0.05) 2.09×10⁻⁴
DES16 4.56×10⁻⁹
(±0.06) 3.86×10⁻⁹
(±0.08) 1.72×10⁻⁴
Cc+/Cc
DES1 0.60×10⁻⁸
(±0.09) 0.65×10⁻⁸
(±0.08) 1.96×10⁻⁴
DES2 3.21×10⁻⁹
(±0.07) 3.26×10⁻⁹
(±0.04) 1.92×10⁻⁴
DES3 2.13×10⁻⁸
(±0.07) 2.22×10⁻⁸
(±0.05) 2.68×10⁻⁴
DES4 1.03×10⁻⁹
(±0.03) 1.18×10⁻⁹
(±0.04) 7.95×10⁻⁵
DES5 2.21×10⁻⁹
(±0.10) 2.66×10⁻⁹
(±0.08) 2.77×10⁻⁴
DES6 0.82×10⁻⁹
(±0.08) 0.99×10⁻⁹
(±0.02) 4.99×10⁻⁵
DES7 6.36×10⁻⁹
(±0.04) 6.83×10⁻⁹
(±0.05) 2.53×10⁻⁴
DES8 2.13×10⁻⁸
(±0.10) 2.56×10⁻⁸
(±0.05) 4.11×10⁻⁴
DES9 3.55×10⁻⁹
(±0.08) 3.60×10⁻⁹
(±0.06) 2.15×10⁻⁴
DES10 2.98×10⁻⁹
(±0.08) 3.33×10⁻⁹
(±0.03) 1.63×10⁻⁴
DES11 2.73×10⁻⁸
(±0.03) 2.89×10⁻⁸
(±0.04) 4.35×10⁻⁴
DES12 2.44×10⁻⁹
(±0.06) 3.01×10⁻⁹
(±0.08) 1.02×10⁻⁴
DES13 4.80×10⁻⁹
(±0.02) 5.01×10⁻⁹
(±0.05) 1.59×10⁻⁴
DES14 2.82×10⁻⁹
(±0.06) 2.85×10⁻⁹
(±0.05) 1.14×10⁻⁴
DES15 8.16×10⁻¹⁰
(±0.03) 8.28×10⁻¹⁰
(±0.09) 1.91×10⁻⁵
DES16 3.68×10⁻⁹
(±0.08) 3.74×10⁻⁹
(±0.05) 1.02×10⁻⁴

99
4.2.5 Temperature dependence of the voltammetric data, D and k0 for Fc/Fc
+ and
Cc+/Cc in DESs
Figures 4.14 indicate typical cyclic voltammograms for oxidation of Fc and
reduction of Cc+ in DES1, respectively, which are obtained from individually prepared
10 mM solutions in the temperature range 298–348 K. The voltammetric data of Fc and
Cc+ is summarized in Table 4.9. Fc and Cc
+ exhibit reversible reactions in all of the
investigated DESs (according to the section 4.2.2). Figure 4.14 shows the anodic and
cathodic peak current had increased substantially with increasing temperature for
oxidation of Fc and reduction of Cc+, respectively. The peak potential separation (ΔEp)
was found to be in the range between 0.062 - 0.096 V for Fc and 0.063 - 0.1 V for Cc+
(Table 4.9). It is observed in all cases that ΔEp decreases with increasing temperature
and this at least partly reflects the faster electron kinetics. For DESs, the ΔEp was found
to be higher than the theoretical value (ΔEp = 0.059 V), attributing to the effect of either
slow heterogeneous electron transfer kinetics or the enhanced impact of ohmic drop as
was previously described by other researchers. Reversible kinetics was assumed for
both Fc and Cc+ following a similar presumption from work reported in the literature
(Zhao et al., 2006, Sukardi et al., 2006).
Influential drifts in potential were perceived for the AgQRE wire dipped directly in
DESs including electroactive compounds. Nevertheless, separation of Ag wire
immersed in DESs from the bulk solution by means of a glass frit impeded this drift in
potential. The E1/2 data inclined to decrease with the rise of temperature. Moreover, the
E1/2 values changed significantly for different DESs at a given temperatures. It was
demonstrated that E1/2 shifted toward more negative potentials for the oxidation of Fc
and more positive potentials for the reduction of Cc+ in DESs. The shift of E1/2 could be
illustrated by donor-acceptor Lewis-type interactions (Keita et al., 1988).
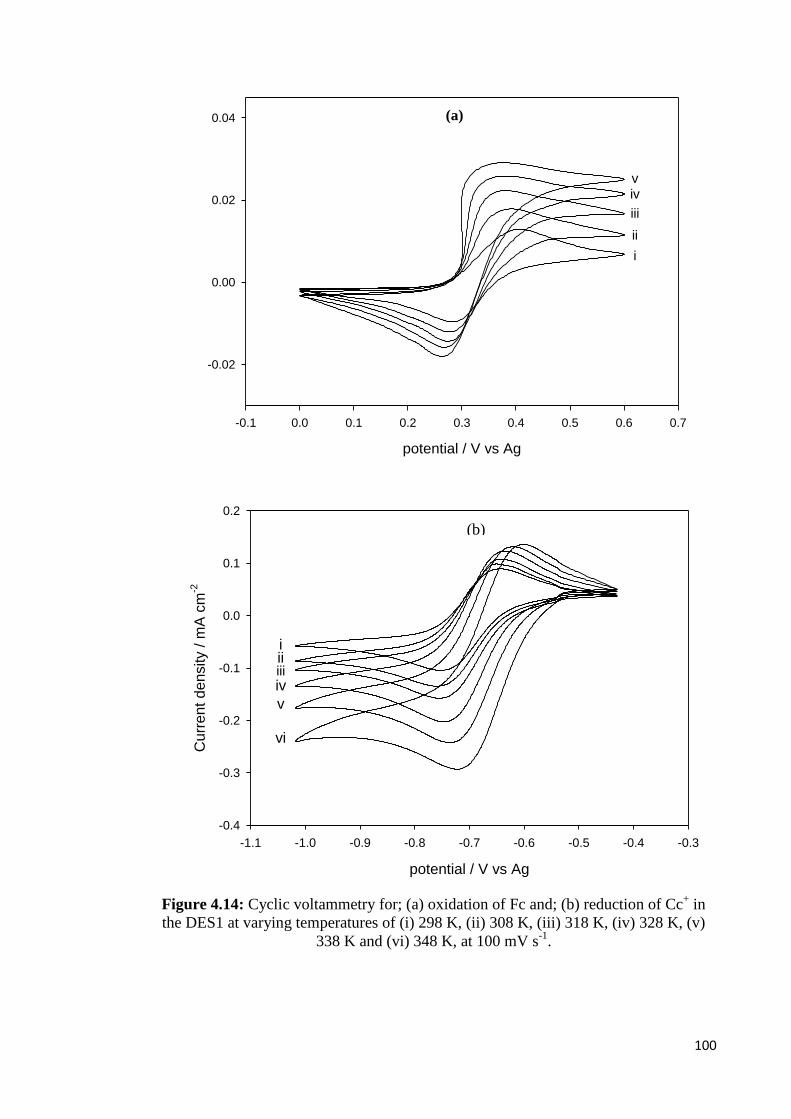
100
Figure 4.14: Cyclic voltammetry for; (a) oxidation of Fc and; (b) reduction of Cc+ in
the DES1 at varying temperatures of (i) 298 K, (ii) 308 K, (iii) 318 K, (iv) 328 K, (v)
338 K and (vi) 348 K, at 100 mV s-1
.
t / s
0 2 4 6 8 10
I /
nA
-0.06
-0.04
-0.02
0.00
0.02
0.04
0.06
0.08
0.10
338 K328318308298
298 K
338 K
potential / V vs Ag
-0.1 0.0 0.1 0.2 0.3 0.4 0.5 0.6 0.7
Curr
ent
density /
mA
cm
-2
-0.02
0.00
0.02
0.04
i
ii
iii
ivv
(a)
potential / V vs Ag
-1.1 -1.0 -0.9 -0.8 -0.7 -0.6 -0.5 -0.4 -0.3
Cu
rre
nt
de
nsity /
mA
cm
-2
-0.4
-0.3
-0.2
-0.1
0.0
0.1
0.2
iiiiiiiv
v
vi
(b)
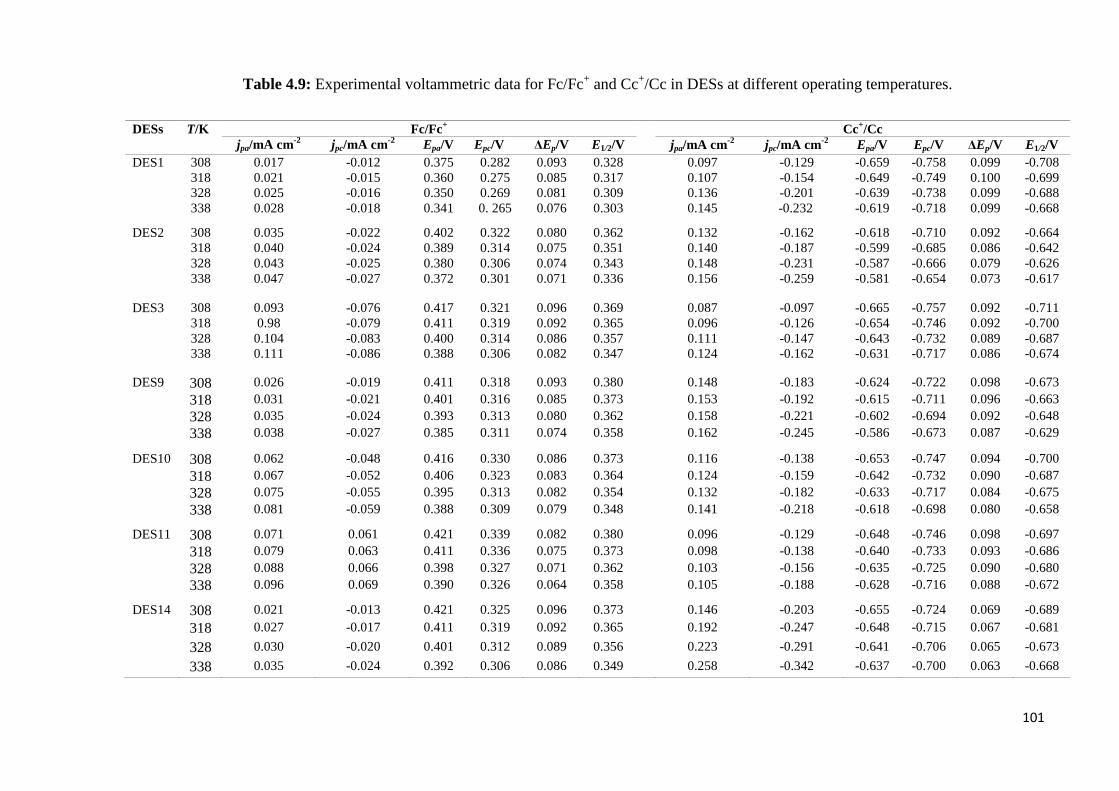
101
Table 4.9: Experimental voltammetric data for Fc/Fc+ and Cc
+/Cc in DESs at different operating temperatures.
DESs T/K Fc/Fc+ Cc
+/Cc
jpa/mA cm-2
jpc/mA cm-2
Epa/V Epc/V ΔEp/V E1/2/V jpa/mA cm-2
jpc/mA cm-2
Epa/V Epc/V ΔEp/V E1/2/V
DES1 308 0.017 -0.012 0.375 0.282 0.093 0.328 0.097 -0.129 -0.659 -0.758 0.099 -0.708
318 0.021 -0.015 0.360 0.275 0.085 0.317 0.107 -0.154 -0.649 -0.749 0.100 -0.699
328 0.025 -0.016 0.350 0.269 0.081 0.309 0.136 -0.201 -0.639 -0.738 0.099 -0.688
338 0.028 -0.018 0.341 0. 265 0.076 0.303 0.145 -0.232 -0.619 -0.718 0.099 -0.668
DES2 308 0.035 -0.022 0.402 0.322 0.080 0.362 0.132 -0.162 -0.618 -0.710 0.092 -0.664
318 0.040 -0.024 0.389 0.314 0.075 0.351 0.140 -0.187 -0.599 -0.685 0.086 -0.642
328 0.043 -0.025 0.380 0.306 0.074 0.343 0.148 -0.231 -0.587 -0.666 0.079 -0.626
338 0.047 -0.027 0.372 0.301 0.071 0.336 0.156 -0.259 -0.581 -0.654 0.073 -0.617
DES3 308 0.093 -0.076 0.417 0.321 0.096 0.369 0.087 -0.097 -0.665 -0.757 0.092 -0.711
318 0.98 -0.079 0.411 0.319 0.092 0.365 0.096 -0.126 -0.654 -0.746 0.092 -0.700
328 0.104 -0.083 0.400 0.314 0.086 0.357 0.111 -0.147 -0.643 -0.732 0.089 -0.687
338 0.111 -0.086 0.388 0.306 0.082 0.347 0.124 -0.162 -0.631 -0.717 0.086 -0.674
DES9 308 0.026 -0.019 0.411 0.318 0.093 0.380 0.148 -0.183 -0.624 -0.722 0.098 -0.673
318 0.031 -0.021 0.401 0.316 0.085 0.373 0.153 -0.192 -0.615 -0.711 0.096 -0.663
328 0.035 -0.024 0.393 0.313 0.080 0.362 0.158 -0.221 -0.602 -0.694 0.092 -0.648
338 0.038 -0.027 0.385 0.311 0.074 0.358 0.162 -0.245 -0.586 -0.673 0.087 -0.629
DES10 308 0.062 -0.048 0.416 0.330 0.086 0.373 0.116 -0.138 -0.653 -0.747 0.094 -0.700
318 0.067 -0.052 0.406 0.323 0.083 0.364 0.124 -0.159 -0.642 -0.732 0.090 -0.687
328 0.075 -0.055 0.395 0.313 0.082 0.354 0.132 -0.182 -0.633 -0.717 0.084 -0.675
338 0.081 -0.059 0.388 0.309 0.079 0.348 0.141 -0.218 -0.618 -0.698 0.080 -0.658
DES11 308 0.071 0.061 0.421 0.339 0.082 0.380 0.096 -0.129 -0.648 -0.746 0.098 -0.697
318 0.079 0.063 0.411 0.336 0.075 0.373 0.098 -0.138 -0.640 -0.733 0.093 -0.686
328 0.088 0.066 0.398 0.327 0.071 0.362 0.103 -0.156 -0.635 -0.725 0.090 -0.680
338 0.096 0.069 0.390 0.326 0.064 0.358 0.105 -0.188 -0.628 -0.716 0.088 -0.672
DES14 308 0.021 -0.013 0.421 0.325 0.096 0.373 0.146 -0.203 -0.655 -0.724 0.069 -0.689
318 0.027 -0.017 0.411 0.319 0.092 0.365 0.192 -0.247 -0.648 -0.715 0.067 -0.681
328 0.030 -0.020 0.401 0.312 0.089 0.356 0.223 -0.291 -0.641 -0.706 0.065 -0.673
338 0.035 -0.024 0.392 0.306 0.086 0.349 0.258 -0.342 -0.637 -0.700 0.063 -0.668
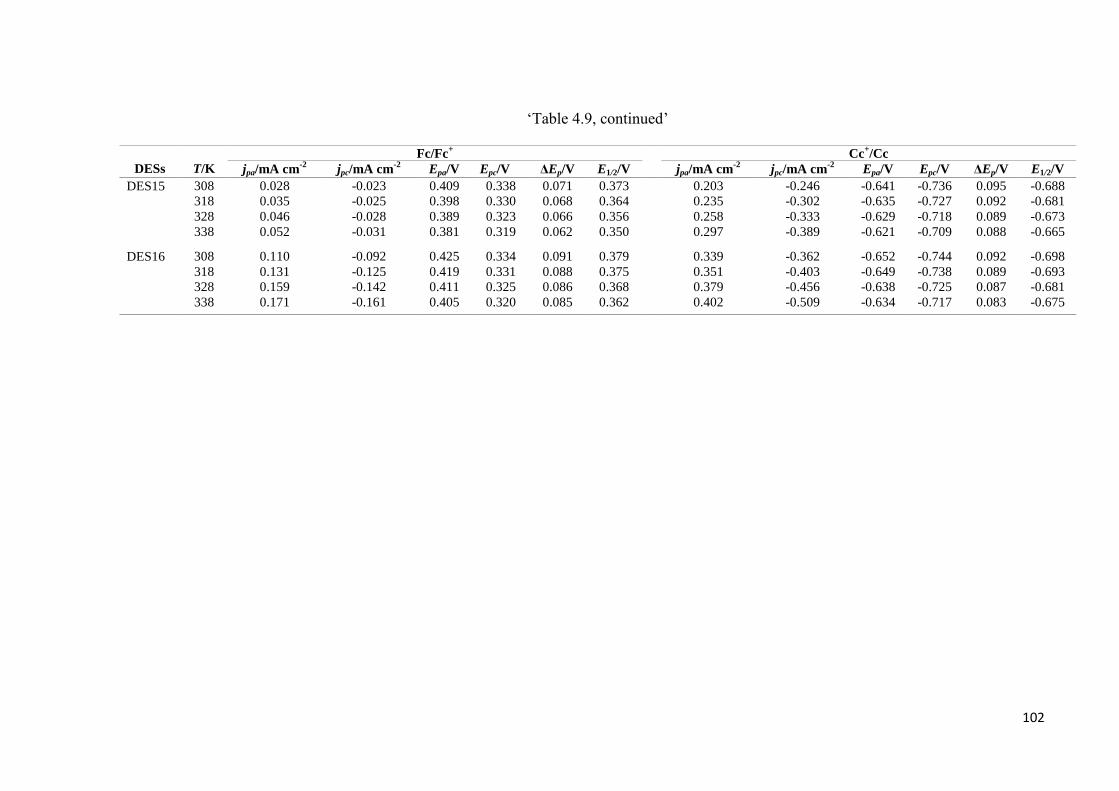
102
‗Table 4.9, continued‘
DESs
T/K
Fc/Fc+ Cc
+/Cc
jpa/mA cm-2
jpc/mA cm-2
Epa/V Epc/V ΔEp/V E1/2/V jpa/mA cm-2
jpc/mA cm-2
Epa/V Epc/V ΔEp/V E1/2/V
DES15 308 0.028 -0.023 0.409 0.338 0.071 0.373 0.203 -0.246 -0.641 -0.736 0.095 -0.688
318 0.035 -0.025 0.398 0.330 0.068 0.364 0.235 -0.302 -0.635 -0.727 0.092 -0.681
328 0.046 -0.028 0.389 0.323 0.066 0.356 0.258 -0.333 -0.629 -0.718 0.089 -0.673
338 0.052 -0.031 0.381 0.319 0.062 0.350 0.297 -0.389 -0.621 -0.709 0.088 -0.665
DES16 308 0.110 -0.092 0.425 0.334 0.091 0.379 0.339 -0.362 -0.652 -0.744 0.092 -0.698
318 0.131 -0.125 0.419 0.331 0.088 0.375 0.351 -0.403 -0.649 -0.738 0.089 -0.693
328 0.159 -0.142 0.411 0.325 0.086 0.368 0.379 -0.456 -0.638 -0.725 0.087 -0.681
338 0.171 -0.161 0.405 0.320 0.085 0.362 0.402 -0.509 -0.634 -0.717 0.083 -0.675

103
The diffusion coefficient of both the Fc/Fc+ and Cc
+/Cc redox couples in DESs at
different temperatures were determined through analysis of double chronoamperometric
measurements conducted at Pt. microelectrodes. Figure 4.15 shows the best theoretical
fit (O) to the experimental double potential step chronoamperograms ( for the Fc/Fc+
and Cc+/Cc redox couples at 293, 298, 303, 308, 313, and 318 K in DES1. The limiting
currents of the first step incline regularly and the trend of the second step becomes
slightly less steep as the temperature increases in both Fc and Cc+. It is reasonably
established that DFc and DCc+ improves with increasing temperature in DESs (Table
4.10). The D of the electroactive species have been analyzed in terms of the Arrhenius
exponential function of the temperature following the Eq:
Where D0 is a constant corresponding to the hypothetical diffusion coefficient at infinite
temperature, and ED is the diffusional activation energy of the electroactive species.
Plot of lnD against 1/T resulted in a straight line and from the slope the
activation energy for diffusion, ED, was determined as shown in Figure 4.16 (least-
squares correlation coefficient, R2> 0.98 for Fc and Cc
+). The calculated ED for each
sample is summarized in Table 4.11, which compares well with the value determined
for the Eη in DESs and corresponds well to that observed in the literature for ILs
(Rogers et al., 2008). The activation energies increased systematically with increasing
viscosity in DESs. A slight deviation for activation energies of DCc+ is observed, which
may be due to impeded diffusion of the reduced species as a result of stronger solvation
by the DES.
0 exp( )DED D
RT
(4.10)
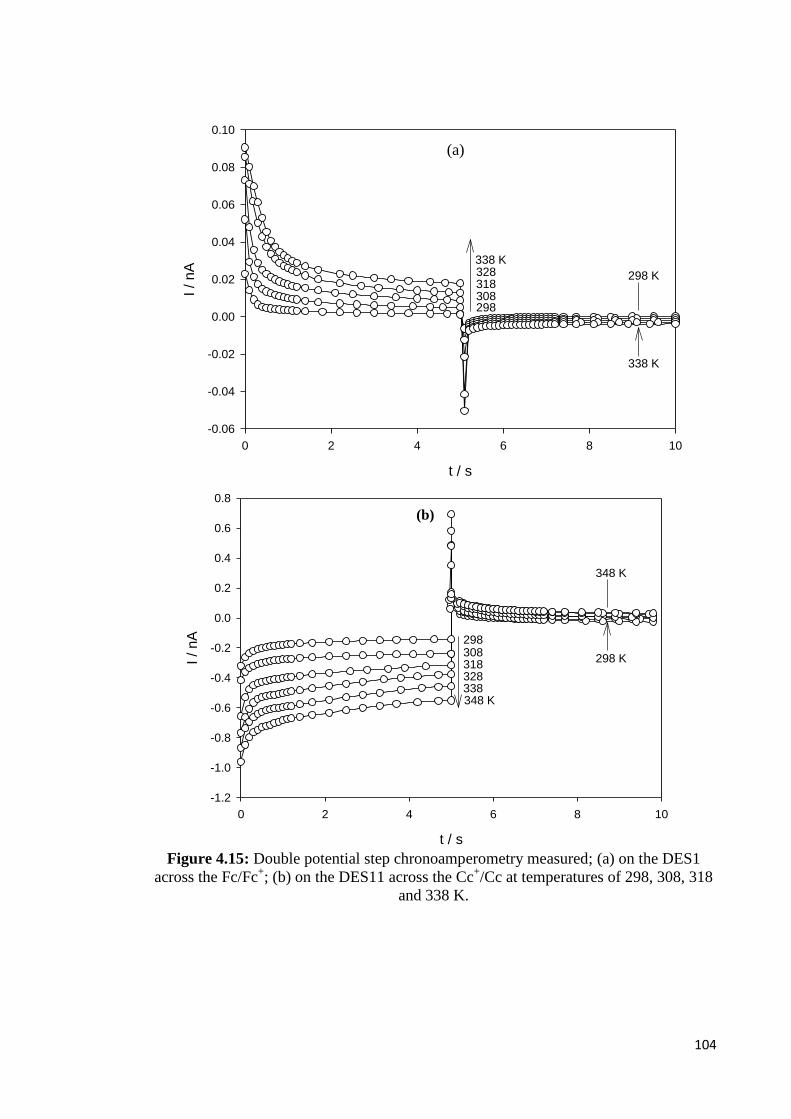
104
Figure 4.15: Double potential step chronoamperometry measured; (a) on the DES1
across the Fc/Fc+; (b) on the DES11 across the Cc
+/Cc at temperatures of 298, 308, 318
and 338 K.
(a)
t / s
0 2 4 6 8 10
I /
nA
-1.2
-1.0
-0.8
-0.6
-0.4
-0.2
0.0
0.2
0.4
0.6
0.8
298308318328338348 K
348 K
298 K
potential / V vs Ag
-1.1 -1.0 -0.9 -0.8 -0.7 -0.6 -0.5 -0.4 -0.3
Curr
ent
density /
mA
cm
-2
-0.4
-0.3
-0.2
-0.1
0.0
0.1
0.2
iiiiiiiv
v
vi
(a)
(b)
t / s
0 2 4 6 8 10
I /
nA
-0.06
-0.04
-0.02
0.00
0.02
0.04
0.06
0.08
0.10
338 K328318308298
298 K
338 K
potential / V vs Ag
-0.1 0.0 0.1 0.2 0.3 0.4 0.5 0.6 0.7
Cu
rre
nt
de
nsity /
mA
cm
-2
-0.02
0.00
0.02
0.04
i
ii
iii
ivv
(a)
(a)

105
Table 4.10: Temperature dependence of kinetic parameters and diffusion coefficients
for Fc/Fc+ and Cc
+/Cc in DESs.
Table 4.10 shows that the rate constants of Fc and Cc+ increased with
temperature, and Figure 4.16 displays an Arrhenius relationship for the obtained k0
values for Fc in DES1 and Cc+ for DES11, respectively. Nearly identical slopes were
established in the D and k0 Arrhenius plots for selected DESs. From these plots, the
DESs T/K DFc/ cm2 s
-1 DCc+ / cm
2 s
-1 k
0Fc / cm s
-1 k
0Cc+ / cm s
-1
DES1 308 2.30×10⁻⁸
(±0.03) 1.06×10⁻⁸
(±0.07) 3.53×10⁻⁴
(±0.07) 3.61×10⁻⁴
(±0.06)
318 2.93×10⁻⁸
(±0.05) 1.52×10⁻⁸
(±0.04) 4.65×10⁻⁴
(±0.08) 5.80×10⁻⁴
(±0.06)
328 3.54×10⁻⁸
(±0.08) 2.04×10⁻⁸
(±0.06) 5.79×10⁻⁴
(±0.09) 8.83×10⁻⁴
(±0.05)
338 4.23×10⁻⁸
(±0.04) 2.63×10⁻⁸
(±0.03) 7.12×10⁻⁴
(±0.05) 1.25×10⁻³
(±0.04)
DES2 308 4.77×10⁻⁹
(±0.05) 4.12×10⁻⁹
(±0.07) 3.44×10⁻⁴
(±0.07) 3.00×10⁻⁴
(±0.08)
318 5.46×10⁻⁹
(±0.09) 4.98×10⁻⁹
(±0.05) 4.73×10⁻⁴
(±0.04) 4.16×10⁻⁴
(±0.07)
328 6.08×10⁻⁹
(±0.06) 5.88×10⁻⁹
(±0.08) 5.94×10⁻⁴
(±0.04) 5.48×10⁻⁴
(±0.08)
338 6.86×10⁻⁹
(±0.08) 6.88×10⁻⁹
(±0.07) 7.89×10⁻⁴
±(0.06) 7.23×10⁻⁴
(±0.05)
DES3
308 3.48×10⁻⁸
(±0.02) 2.60×10⁻⁸
(±0.09) 5.99×10⁻⁴
(±0.05) 5.37×10⁻⁴
(±0.07)
318 3.94×10⁻⁸
(±0.04) 3.06×10⁻⁸
(±0.02) 1.16×10⁻³
(±0.08) 1.07×10⁻³
(±0.03)
328 4.38×10⁻⁸
(±0.05) 3.56×10⁻⁸
(±0.06) 2.21×10⁻³
(±0.06) 2.11×10⁻³
(±0.06)
338 4.92×10⁻⁸
(±0.04) 4.11×10⁻⁸
(±0.06) 4.73×10⁻³
(±0.07) 3.96×10⁻³
(±0.07)
DES9 308 5.66×10⁻⁹
(±0.09) 4.95×10⁻⁹
(±0.07) 2.96×10⁻⁴
(±0.07) 2.63×10⁻⁴
(±0.06)
318 6.85×10⁻⁹
(±0.07) 6.37×10⁻⁹
(±0.05) 3.59×10⁻⁴
(±0.06) 3.13×10⁻⁴
(±0.06)
328 7.83×10⁻⁹
(±0.04) 7.68×10⁻⁹
(±0.08) 4.07×10⁻⁴
(±0.05) 3.56×10⁻⁴
(±0.08)
338 9.00×10⁻⁹
(±0.09) 9.22×10⁻⁹
(±0.04) 4.61×10⁻⁴
(±0.07) 4.01×10⁻⁴
(±0.08)
DES10 308 4.14×10⁻⁹
(±0.06) 4.43×10⁻⁹
(±0.08) 2.51×10⁻⁴
(±0.04) 2.42×10⁻⁴
(±0.04)
318 5.37×10⁻⁹
(±0.07) 5.53×10⁻⁹
(±0.06) 3.54×10⁻⁴
(±0.05) 3.29×10⁻⁴
(±0.03)
328 6.65×10⁻⁹
(±0.02) 6.71×10⁻⁹
(±0.08) 4.70×10⁻⁴
(±0.08) 4.35×10⁻⁴
(±0.07)
338 8.26×10⁻⁹
(±0.04) 7.83×10⁻⁹
(±0.05) 6.32×10⁻⁴
(±0.06) 5.47×10⁻⁴
(±0.06)
DES11 308 3.65×10⁻⁸
(±0.04) 3.38×10⁻⁸
(±0.04) 6.58×10⁻⁴
(±0.07) 5.56×10⁻⁴
(±0.08)
318 3.99×10⁻⁸
(±0.09) 3.84×10⁻⁸
(±0.07) 7.69×10⁻⁴
(±0.04) 6.85×10⁻⁴
(±0.07)
328 4.38×10⁻⁸
(±0.06) 4.25×10⁻⁸
(±0.05) 9.23×10⁻⁴
(±0.05) 8.13×10⁻⁴
(±0.06)
338 4.82×10⁻⁸
(±0.07) 4.84×10⁻⁸
(±0.06) 1.14×10⁻³
(±0.06) 1.02×10⁻³
(±0.08)
DES14 308 4.23×10⁻⁹
(±0.04) 3.69×10⁻⁹
(±0.08) 2.58×10⁻⁴
(±0.06) 3.21×10⁻⁴
(±0.08)
318 4.54×10⁻⁹
(±0.08) 4.21×10⁻⁹
(±0.07) 3.14×10⁻⁴
(±0.05) 3.96×10⁻⁴
(±0.07)
328 5.20×10⁻⁹
(±0.06) 4.76×10⁻⁹
(±0.05) 5.27×10⁻⁴
(±0.08) 4.08×10⁻⁴
(±0.09)
338 5.63×10⁻⁹
(±0.09) 5.24×10⁻⁹
(±0.04) 6.56×10⁻⁴
(±0.09) 4.97×10⁻⁴
(±0.06)
DES15 308 9.92×10⁻¹⁰
(±0.06) 9.22×10⁻¹⁰
(±0.08) 4.38×10⁻⁵
(±0.05) 2.42×10⁻⁵
(±0.08)
318 1.38×10⁻⁹
(±0.09) 1.98×10⁻⁹
(±0.05) 5.16×10⁻⁵
(±0.04) 4.53×10⁻⁵
(±0.05)
328 2.12×10⁻⁹
(±0.07) 2.12×10⁻⁹
(±0.06) 5.56×10⁻⁵
(±0.09) 5.32×10⁻⁵
(±0.08)
338 2.86×10⁻⁹
(±0.05) 2.66×10⁻⁹
(±0.05) 5.96×10⁻⁵
(±0.07) 6.12×10⁻⁵
(±0.09)
DES16 308 4.92×10⁻⁹
(±0.07) 4.56×10⁻⁹
(±0.06) 3.88×10⁻⁴
(±0.06) 2.56×10⁻⁴
(±0.06)
318 5.53×10⁻⁹
(±0.05) 5.02×10⁻⁹
(±0.09) 5.68×10⁻⁴
(±0.08) 4.56×10⁻⁴
(±0.08)
328 6.12×10⁻⁹
(±0.04) 5.51×10⁻⁹
(±0.06) 7.43×10⁻⁴
(±0.05) 6.31×10⁻⁴
(±0.05)
338 6.65×10⁻⁹
(±0.08) 6.28×10⁻⁹
(±0.07) 8.96×10⁻⁴
(±0.05) 7.84×10⁻⁴
(±0.05)

106
activation energy of rate constants for Fc and Cc+ were determined, which are listed in
Table 4.11.
Table 4.11: Activation energies of the diffusion coefficients and rate constants for
Fc/Fc+ and Cc
+/Cc in studied DESs.
DESs ED(Fc) /
kJ mol-1
ED(Cc+)/
kJ mol-1
Ek0(Fc)/
kJ mol-1
Ek0(Cc
+)/
kJ mol-1
DES1
22.82
21.97
21.81
26.62
DES2 27.01 28.52 25.20 30.33
DES3 21.65 21.04 19.63 20.57
DES9 24.73 25.50 22.18 28.02
DES10 29.68 30.88 27.51 36.29
DES11 20.08 17.57 15.15 17.44
DES14 28.36 29.45 26.30 31.48
DES15 49.35 52.32 38.23 58.41
DES16 24.05 22.93 22.07 27.63
1000 / T(K-1
)
2.9 3.0 3.1 3.2 3.3 3.4
ln D
(x10
-8cm
2 s
-1)
-18.0
-17.8
-17.6
-17.4
-17.2
-17.0
-16.8
ln K
0(x
10
-4 c
m s
-1)
-8.4
-8.2
-8.0
-7.8
-7.6
-7.4
-7.2
-7.0
ln D
ln K0
(a)
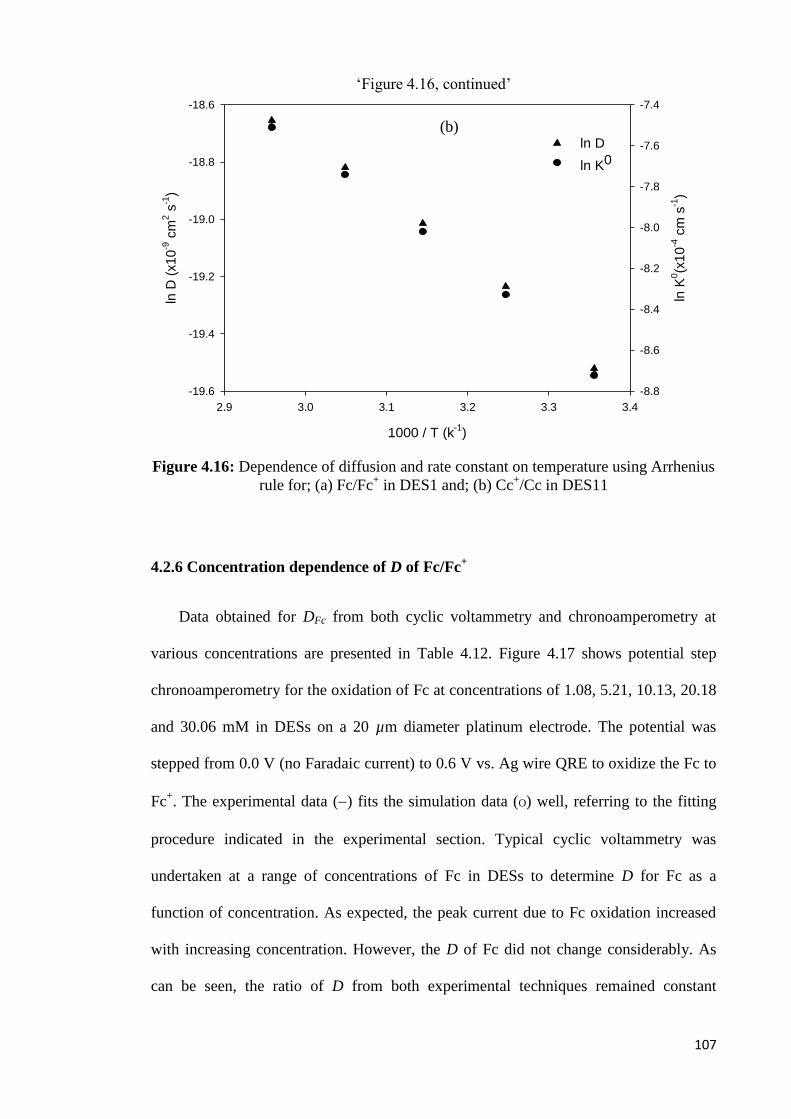
107
‗Figure 4.16, continued‘
Figure 4.16: Dependence of diffusion and rate constant on temperature using Arrhenius
rule for; (a) Fc/Fc+ in DES1 and; (b) Cc
+/Cc in DES11
4.2.6 Concentration dependence of D of Fc/Fc+
Data obtained for DFc from both cyclic voltammetry and chronoamperometry at
various concentrations are presented in Table 4.12. Figure 4.17 shows potential step
chronoamperometry for the oxidation of Fc at concentrations of 1.08, 5.21, 10.13, 20.18
and 30.06 mM in DESs on a 20 µm diameter platinum electrode. The potential was
stepped from 0.0 V (no Faradaic current) to 0.6 V vs. Ag wire QRE to oxidize the Fc to
Fc+. The experimental data () fits the simulation data (O) well, referring to the fitting
procedure indicated in the experimental section. Typical cyclic voltammetry was
undertaken at a range of concentrations of Fc in DESs to determine D for Fc as a
function of concentration. As expected, the peak current due to Fc oxidation increased
with increasing concentration. However, the D of Fc did not change considerably. As
can be seen, the ratio of D from both experimental techniques remained constant
1000 / T (k-1
)
2.9 3.0 3.1 3.2 3.3 3.4
ln D
(x1
0-9
cm
2 s
-1)
-19.6
-19.4
-19.2
-19.0
-18.8
-18.6
ln K
0(x
10
-4 c
m s
-1)
-8.8
-8.6
-8.4
-8.2
-8.0
-7.8
-7.6
-7.4
ln D
ln K0
(b)

108
throughout the whole concentration range showing that the diffusion coefficient
was independent of the concentration in DESs.
Table 4.12: Concentration dependent of the diffusion coefficients of Fc in DESs
solution
DESs
Concentration
(mM)
DCV
(cm2 s
-1)
DCA
(cm2 s
-1)
DES1 1.08 4.54×10⁻⁹
(±0.08) 4.30×10⁻⁹
(±0.05)
5.21 4.32×10⁻⁹
(±0.10) 4.21×10⁻⁹
(±0.03)
10.13 4.56×10⁻⁹
(±0.06) 3.86×10⁻⁹
(±0.08)
20.18 4.23×10⁻⁹
(±0.04) 4.33×10⁻⁹
(±0.06)
30.06 4.02×10⁻⁹
(±0.08) 4.36×10⁻⁹
(±0.08)
DES2
1.08 9.42×10⁻¹⁰
(±0.07) 8.65×10⁻¹⁰
(±0.04)
5.21 8.96×10⁻¹⁰
(±0.05) 8.96×10⁻¹⁰
(±0.05)
10.13 9.12×10⁻¹⁰
(±0.06) 8.88×10⁻¹⁰
(±0.05)
20.18 9.03×10⁻¹⁰
(±0.08) 8.62×10⁻¹⁰
(±0.03)
30.06 9.86×10⁻¹⁰
(±0.06) 8.49×10⁻¹⁰
(±0.10)
DES3 1.08 2.94×10⁻⁸
(±0.06) 3.46×10⁻⁸
(±0.06)
5.21 3.11×10⁻⁸
(±0.10) 3.32×10⁻⁸
(±0.05)
10.13 3.08×10⁻⁸
(±0.09) 3.12×10⁻⁸
(±0.04)
20.18 3.22×10⁻⁸
(±0.08) 3.39×10⁻⁸
(±0.08)
30.06 3.19×10⁻⁸
(±0.04) 2.98×10⁻⁸
(±0.08)
DES9 1.08 4.01×10⁻⁹
(±0.09) 3.82×10⁻⁹
(±0.10)
5.21 3.90×10⁻⁹
(±0.10) 4.13×10⁻⁹
(±0.10)
10.13 4.07×10⁻⁹
(±0.08) 3.96×10⁻⁹
(±0.09)
20.18 3.96×10⁻⁹
(±0.04) 4.12×10⁻⁹
(±0.05)
30.06 3.86×10⁻⁹
(±0.07) 4.08×10⁻⁹
(±0.05)
DES10 1.08 2.98×10⁻⁸
(±0.08) 4.01×10⁻⁸
(±0.03)
5.21 3.20×10⁻⁸
(±0.05) 4.22×10⁻⁸
(±0.04)
10.13 3.22×10⁻⁸
(±0.10) 3.95×10⁻⁸
(±0.02)
20.18 3.26×10⁻⁸
(±0.06) 4.16×10⁻⁸
(±0.02)
30.06 3.25×10⁻⁸
(±0.08) 3.89×10⁻⁸
(±0.08)
DES11 1.08 2.80×10⁻⁹
(±0.08) 3.65×10⁻⁹
(±0.06)
5.21 3.08×10⁻⁹
(±0.09) 3.55×10⁻⁹
(±0.08)
10.13 3.25×10⁻⁹
(±0.03) 3.40×10⁻⁹
(±0.04)
20.18 2.97×10⁻⁹
(±0.08) 3.86×10⁻⁹
(±0.04)
30.06 3.02×10⁻⁹
(±0.09) 3.93×10⁻⁹
(±0.03)

109
Figure 4.17: Experimental () and fitted theoretical (O) chronoamperometric transients
for the oxidation of 1.08, 5.21,10 .13, 20.18 and 30.06 mM Fc in DES11 at a 20 µm Pt
microelectrode.
4.2.7 Stokes–Einstein behaviour of metallocene derivatives
The mass transport properties of Fc and Cc+ in DESs can be predicted on the basis
of the Stokes-Einstein expression (Eq. 4.11), which relates D and the dynamic viscosity
of the medium, η. Here kB is the Boltzmann constant, α is the hydrodynamic radius of
the species, and T is the absolute temperature.
(4.11)
According to Eq. 4.11, a plot of D vs. η-1
should be linear with zero intercept. Figure
4.18 exhibited linear behaviour when DFc was plotted vs. η-1
for 10.13 mM Fc in DESs
based on glycerol and ethylene glycol HBDs. Thus, it might be sensible to presume that
the Stokes–Einstein relationship, as shown in Eq. 4.11, can be applied to the data
reported herein. Furthermore, many reports in the literature indicated that the Stokes–
Einstein equation applies for a range of redox species in various ILs (inclusive of Fc), as
t / S
0 1 2 3 4 5
I /
nA
0
1
2
3
4
6
Bk
Da
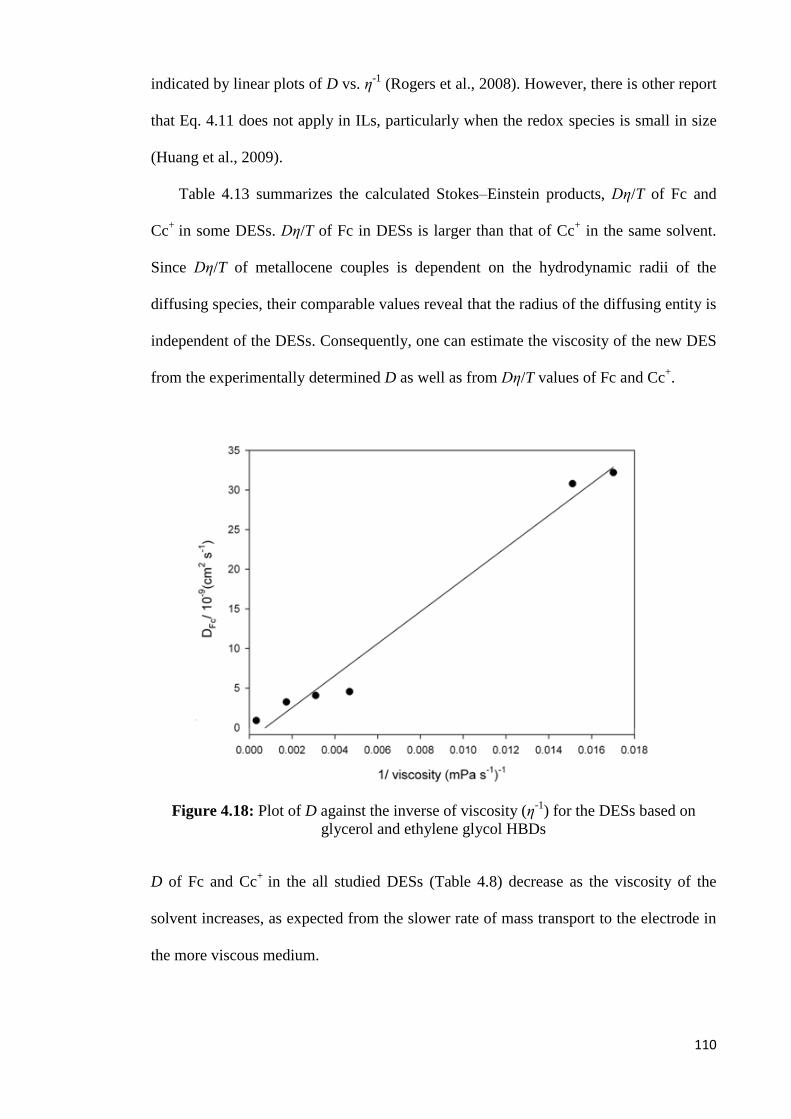
110
indicated by linear plots of D vs. η-1
(Rogers et al., 2008). However, there is other report
that Eq. 4.11 does not apply in ILs, particularly when the redox species is small in size
(Huang et al., 2009).
Table 4.13 summarizes the calculated Stokes–Einstein products, Dη/T of Fc and
Cc+
in some DESs. Dη/T of Fc in DESs is larger than that of Cc+ in the same solvent.
Since Dη/T of metallocene couples is dependent on the hydrodynamic radii of the
diffusing species, their comparable values reveal that the radius of the diffusing entity is
independent of the DESs. Consequently, one can estimate the viscosity of the new DES
from the experimentally determined D as well as from Dη/T values of Fc and Cc+.
Figure 4.18: Plot of D against the inverse of viscosity (η-1
) for the DESs based on
glycerol and ethylene glycol HBDs
D of Fc and Cc+
in the all studied DESs (Table 4.8) decrease as the viscosity of the
solvent increases, as expected from the slower rate of mass transport to the electrode in
the more viscous medium.

111
Table 4.13: Stokes–Einstein products of Fc and Cc+
in some DESs
4.3 Electrochemical behaviour of V(acac)3 in DESs
It was shown throughout this chapter that DES3, DES7, DES9, DES11, DES13 and
DES16 are potential candidates as electrolytes to replace acetonitrile as a solvent for
vanadium acetylacetonate (V(acac)3)-based redox batteries. This is mainly because of
the higher solubility and ionic conductivity of these DESs compared to the other studied
DESs. Additionally, PWs results of these DESs showed the stability of the V(acac)3
active species in the selected DESs.
4.3.1 Voltammetry of vanadium electrolytes in DESs
Preliminary experiments involved verifying the set-up proposed in this section
using results reported in the literature (Liu et al., 2009, Zhang et al., 2012). For this
purpose, 0.01 M V(acac)3 was dissolved in an acetonitrile (CH3CN) solution consisting
of 0.5 M TEABF4 as the supporting electrolyte. Solutions were prepared and
experiments carried out in an argon-filled glove box to ensure the chemicals and
solutions were not exposed to environmental oxygen and water. Cyclic voltammograms
at 0.1 V s-1
scan rate is shown for both supporting and active electrolytes in Figure 4.19.
Two redox couples were present within the solvent PW (−2.5 V to 1.5 V vs. Ag/Ag+).
DESs
ηD T−1
/ g cm s−2
K−1
Fc Cc+
DES1 3.79×10⁻¹¹
3.29×10⁻¹¹
DES2 6.23×10⁻¹¹
4.09×10⁻¹¹
DES3 3.26×10⁻¹¹
2.79×10⁻¹¹
DES4 3.09×10⁻¹¹
2.45×10⁻¹¹
DES5 8.62×10⁻¹¹
6.64×10⁻¹¹
DES12 6.16×10⁻¹¹
5.47×10⁻¹¹
DES13 3.66×10⁻¹¹
2.75×10⁻¹¹
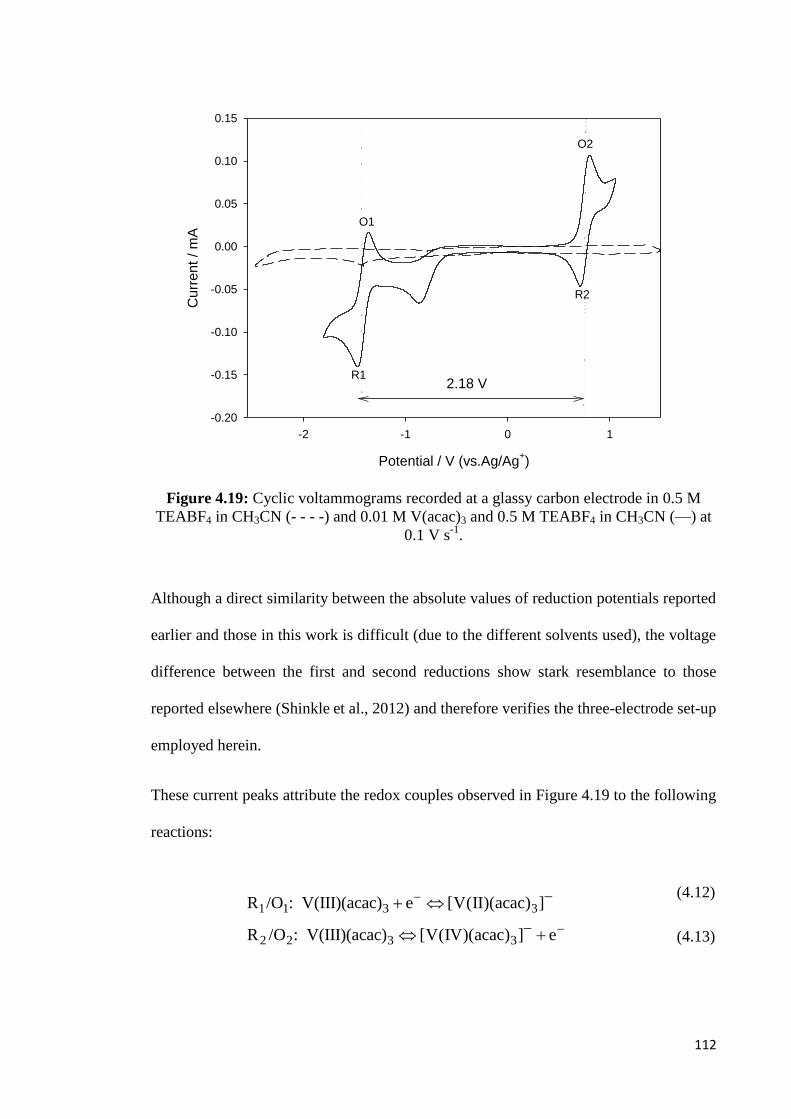
112
Potential / V (vs.Ag/Ag+)
-2 -1 0 1
Curr
ent
/ m
A
-0.20
-0.15
-0.10
-0.05
0.00
0.05
0.10
0.15
O1
R1
O2
R2
2.18 V
Figure 4.19: Cyclic voltammograms recorded at a glassy carbon electrode in 0.5 M
TEABF4 in CH3CN (- - - -) and 0.01 M V(acac)3 and 0.5 M TEABF4 in CH3CN (—) at
0.1 V s-1
.
Although a direct similarity between the absolute values of reduction potentials reported
earlier and those in this work is difficult (due to the different solvents used), the voltage
difference between the first and second reductions show stark resemblance to those
reported elsewhere (Shinkle et al., 2012) and therefore verifies the three-electrode set-up
employed herein.
These current peaks attribute the redox couples observed in Figure 4.19 to the following
reactions:
1 1 3 3
2 2 3 3
R /O : V(III)(acac) e [V(II)(acac) ]
R /O : V(III)(acac) [V(IV)(acac) ] e
(4.12)
(4.13)

113
These standard open circuit cell potential indicated by the reactions in Figure 4.19
suggests that a system based on one-electron disproportionation of V(acac)3 should
yield a 2.18 V equilibrium cell potential. This is approximately 58 % higher than the
potential reported for aqueous vanadium RFBs (1.26 V under standard conditions
(Ponce de Leon et al., 2006)).
Figure 4.20 shows the voltammograms of 0.01 M V(acac)3 in the six different DESs at a
scan rate of 0.1 V s-1
. The results clearly show that DESs 3, 9 and 11 have potential for
further evaluation and their standard open circuit cell potentials are listed in Table 4.14.
Potential / V(vs.Ag/Ag+)
-2.0 -1.5 -1.0 -0.5 0.0 0.5 1.0 1.5
Curr
ent
/ m
A
-0.03
-0.02
-0.01
0.00
0.01
0.02
DES3
DES3
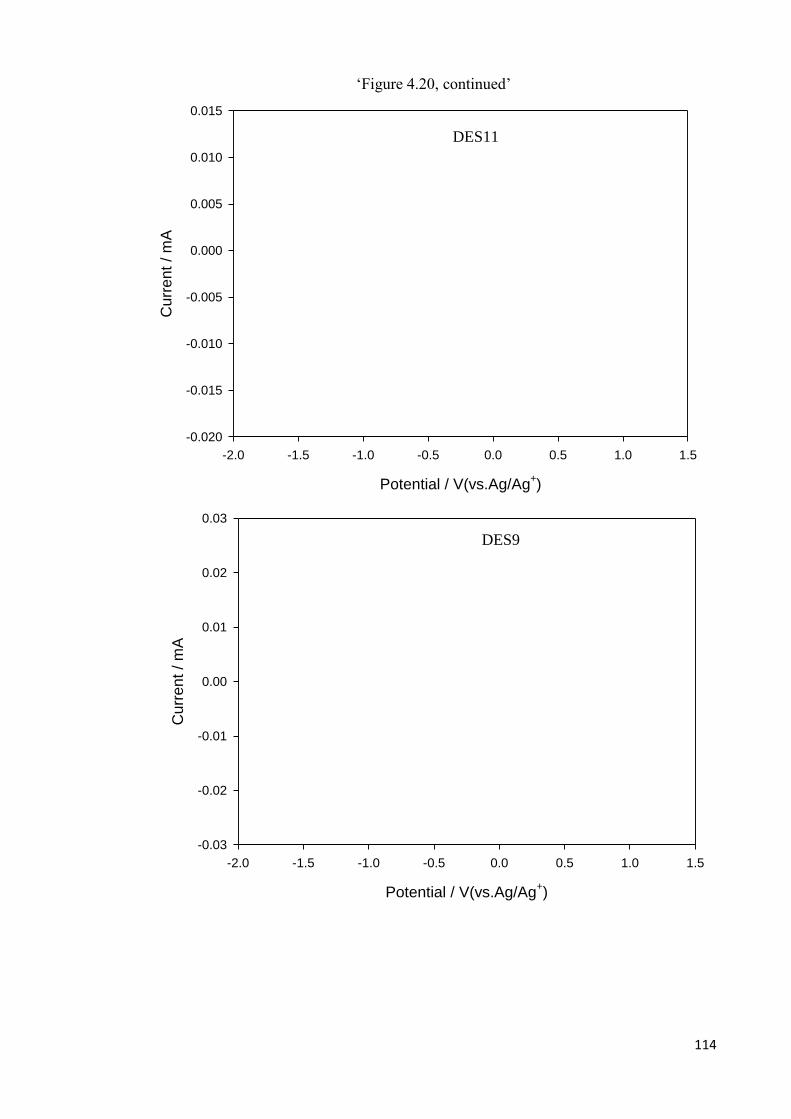
114
‗Figure 4.20, continued‘
Potential / V(vs.Ag/Ag+)
-2.0 -1.5 -1.0 -0.5 0.0 0.5 1.0 1.5
Curr
en
t /
mA
-0.020
-0.015
-0.010
-0.005
0.000
0.005
0.010
0.015
DES11
Potential / V(vs.Ag/Ag+)
-2.0 -1.5 -1.0 -0.5 0.0 0.5 1.0 1.5
Cu
rre
nt
/ m
A
-0.03
-0.02
-0.01
0.00
0.01
0.02
0.03
DES9

115
‗Figure 4.20, continued
Potential / V(vs.Ag/Ag+)
-2.0 -1.5 -1.0 -0.5 0.0 0.5 1.0 1.5
Curr
ent
/ m
A
-0.10
-0.05
0.00
0.05
0.10
0.15
0.20
Potential / V(vs.Ag/Ag+)
-2.0 -1.5 -1.0 -0.5 0.0 0.5 1.0 1.5
Curr
ent
/ m
A
-3.5
-3.0
-2.5
-2.0
-1.5
-1.0
-0.5
0.0
0.5
DES16
DES7
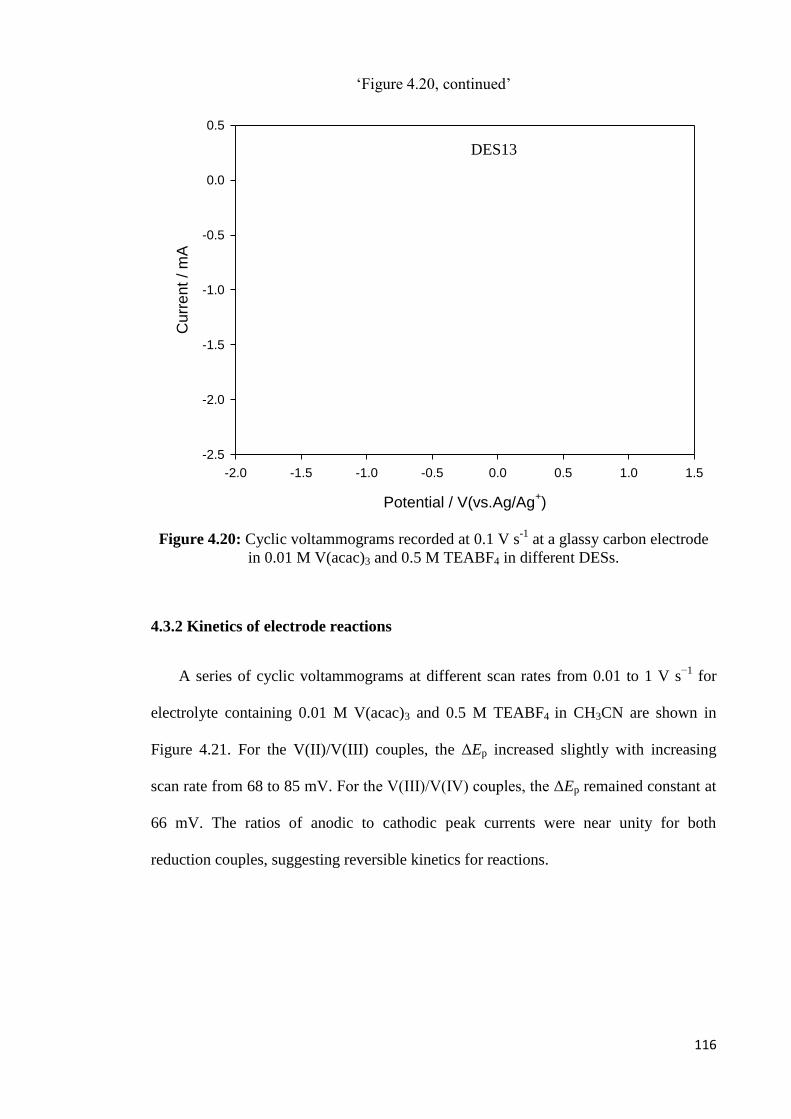
116
‗Figure 4.20, continued‘
Figure 4.20: Cyclic voltammograms recorded at 0.1 V s-1
at a glassy carbon electrode
in 0.01 M V(acac)3 and 0.5 M TEABF4 in different DESs.
4.3.2 Kinetics of electrode reactions
A series of cyclic voltammograms at different scan rates from 0.01 to 1 V s−1
for
electrolyte containing 0.01 M V(acac)3 and 0.5 M TEABF4 in CH3CN are shown in
Figure 4.21. For the V(II)/V(III) couples, the ΔEp increased slightly with increasing
scan rate from 68 to 85 mV. For the V(III)/V(IV) couples, the ΔEp remained constant at
66 mV. The ratios of anodic to cathodic peak currents were near unity for both
reduction couples, suggesting reversible kinetics for reactions.
DES16
Potential / V(vs.Ag/Ag+)
-2.0 -1.5 -1.0 -0.5 0.0 0.5 1.0 1.5
Curr
ent
/ m
A
-2.5
-2.0
-1.5
-1.0
-0.5
0.0
0.5DES7
DES13

117
Figure 4.21: Cyclic voltammetry recorded at a glassy carbon electrode in 0.01 M
V(acac)3 and 0.5 M TEABF4 in CH3CN at different scan rate.
To determine the D of V(acac)3 in the electrolytic solutions, changes in peak height
were measured as scan rates varied stepwise from 0.01-0.50 V s−1
, as was done for the
other active species discussed in sections 4.2.2. Based on equation 4.7, the D of the
neutral complex is calculated to be 3.5×10⁻⁶
cm2 s
-1.
Figure 4.22 shows the cyclic voltammograms for electrolyte containing 0.01 M
V(acac)3 and 0.5 M TEABF4 in DES3. For the V(II)/V(III) redox couple, the ΔEp
increased from 60 to 90 mV and the ratio of anodic to cathodic peak currents increased
from 0.97 to 1.20 as the scan rate is increased from 0.05 to 0.50 V s−1
. For the
V(III)/V(IV) redox couple, ΔEp increased from 65 to 80 mV but the ratio of anodic to
cathodic peak currents decreased from 1.1 to 0.98 as the scan rate increased. The ratio
of anodic to cathodic peak currents is approximately close to unity.
Potential / V (vs.Ag/Ag+)
-2.0 -1.5 -1.0 -0.5 0.0 0.5 1.0 1.5
Curr
ent
/ m
A
-0.4
-0.3
-0.2
-0.1
0.0
0.1
0.2
0.3
0.4
10 mVs-1
30 mVs-1
50 mVs-1
70 mVs-1
100 mVs-1
200 mVs-1
500 mVs-1
1000 mVs-1
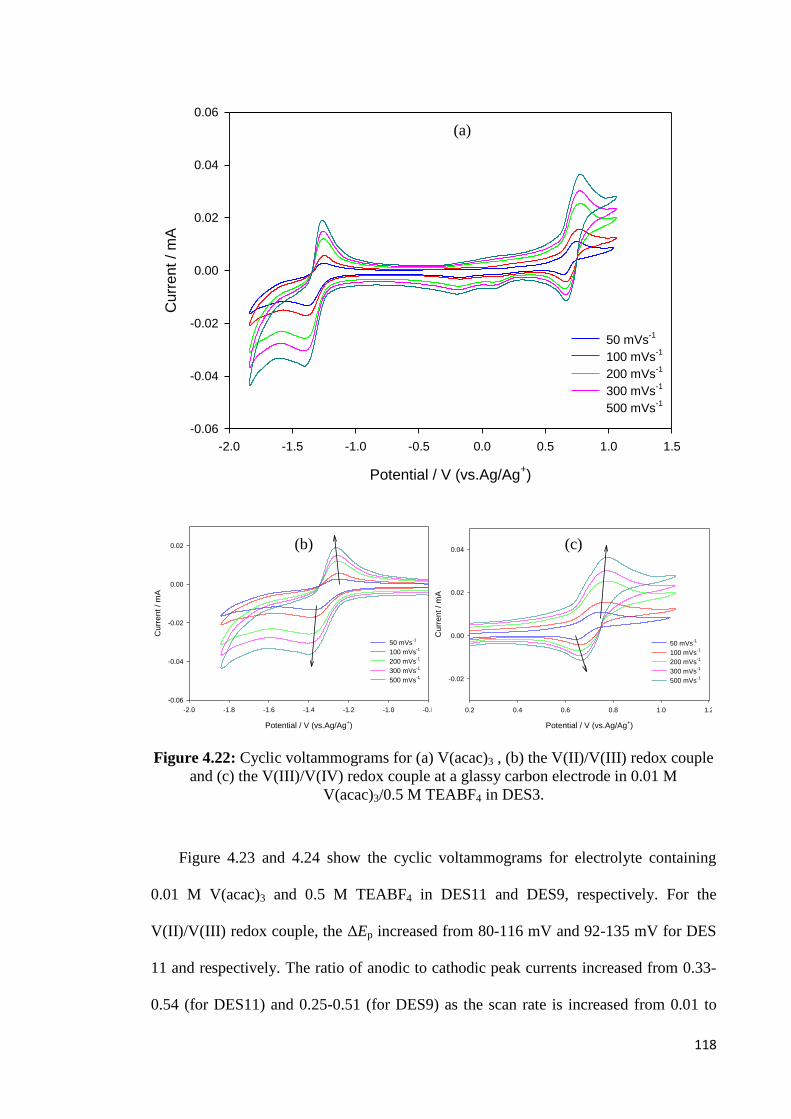
118
Potential / V (vs.Ag/Ag+)
-2.0 -1.8 -1.6 -1.4 -1.2 -1.0 -0.8
Curr
en
t /
mA
-0.06
-0.04
-0.02
0.00
0.02
50 mVs-1
100 mVs-1
200 mVs-1
300 mVs-1
500 mVs-1
Potential / V (vs.Ag/Ag+)
0.2 0.4 0.6 0.8 1.0 1.2
Curr
en
t /
mA
-0.02
0.00
0.02
0.04
50 mVs-1
100 mVs-1
200 mVs-1
300 mVs-1
500 mVs-1
Figure 4.22: Cyclic voltammograms for (a) V(acac)3 , (b) the V(II)/V(III) redox couple
and (c) the V(III)/V(IV) redox couple at a glassy carbon electrode in 0.01 M
V(acac)3/0.5 M TEABF4 in DES3.
Figure 4.23 and 4.24 show the cyclic voltammograms for electrolyte containing
0.01 M V(acac)3 and 0.5 M TEABF4 in DES11 and DES9, respectively. For the
V(II)/V(III) redox couple, the ΔEp increased from 80-116 mV and 92-135 mV for DES
11 and respectively. The ratio of anodic to cathodic peak currents increased from 0.33-
0.54 (for DES11) and 0.25-0.51 (for DES9) as the scan rate is increased from 0.01 to
Potential / V (vs.Ag/Ag+)
-2.0 -1.5 -1.0 -0.5 0.0 0.5 1.0 1.5
Curr
ent
/ m
A
-0.06
-0.04
-0.02
0.00
0.02
0.04
0.06
50 mVs-1
100 mVs-1
200 mVs-1
300 mVs-1
500 mVs-1
(a)
(b) (c)

119
0.50 V s−1
. For the V(III)/V(IV) redox couple, ΔEp increased from 85-122 mV ( for
DES11) and 90-145 mV( for DES9) but the ratio of anodic to cathodic peak currents
decreased from 0.92-0.55 ( for DES11) and 0.85-0.49 (for DES9) as the scan rate
increased. From Figures 4.23 and 4.24, it can be deduced that both reactions 4.12 and
4.13 are quasi-reversible in DES11 and 9. For a reversible redox couple, the peak
current ip is given by Eq 4.7. For a totally irreversible redox couple, the peak current is
given by:
Where n is the number of electrons transferred in the electrode reaction (n = 1), A is the
electrode area (cm2), C is the bulk concentration of primary reactant (mol l
−1), D is the
diffusion coefficient of primary reactant, ν is the scan rate (V s−1
) and α is a constant.
Since ip is a function of ν1/2
, a plot of ip vs. v1/2
gives a straight line with a slope
proportional to the D of the active species (Bard and Faulkner, 2001). Because the
electrode reactions appear to be quasi-reversible in DES11 and 9, the value for the
diffusion coefficient of V(acac)3 would be located in between the results calculated
from Eqs. 4.7 and 4.14. The D of V(acac)3 based on the cathodic peak currents for the
V(III)/V(IV) redox couple are listed in Table 4.14. The largest D, 0.69 × 10⁻⁶
cm2 s
−1, is
obtained at room temperature for DES3.
5 3/2 1/2 1/2 1/2p 0i 2.99 10 n ACD
(4.14)
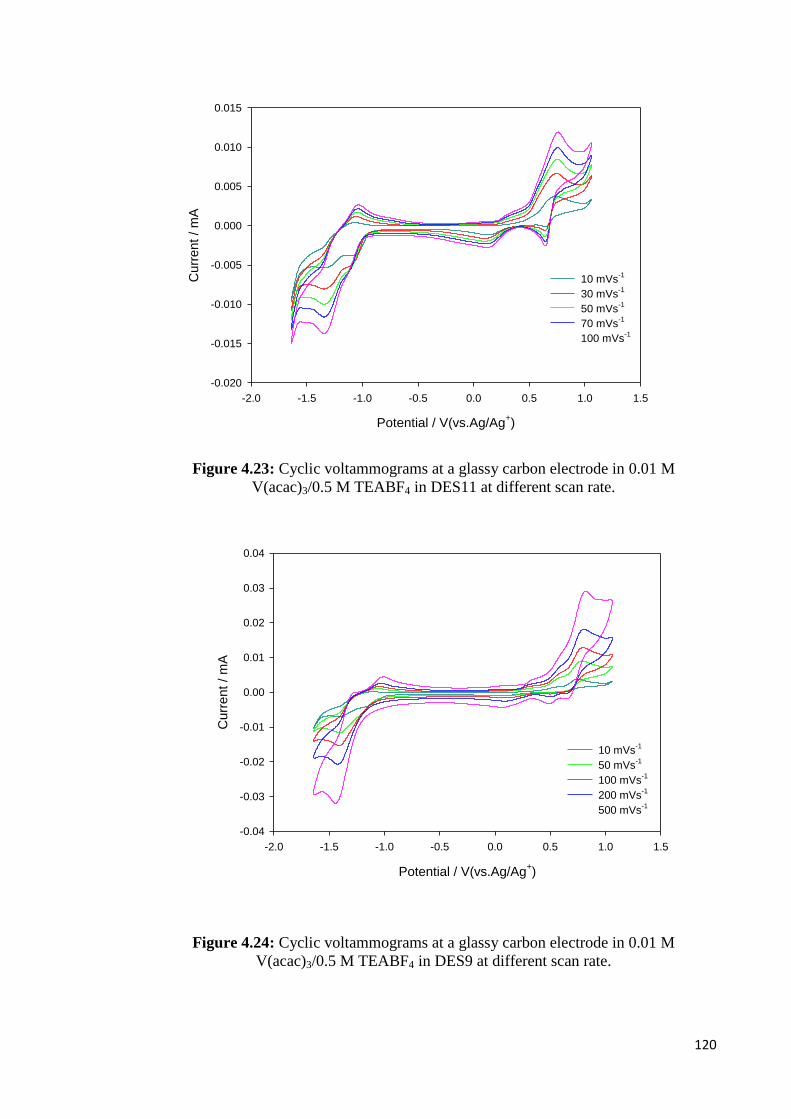
120
Figure 4.23: Cyclic voltammograms at a glassy carbon electrode in 0.01 M
V(acac)3/0.5 M TEABF4 in DES11 at different scan rate.
Figure 4.24: Cyclic voltammograms at a glassy carbon electrode in 0.01 M
V(acac)3/0.5 M TEABF4 in DES9 at different scan rate.
Potential / V(vs.Ag/Ag+)
-2.0 -1.5 -1.0 -0.5 0.0 0.5 1.0 1.5
Curr
ent
/ m
A
-0.020
-0.015
-0.010
-0.005
0.000
0.005
0.010
0.015
10 mVs-1
30 mVs-1
50 mVs-1
70 mVs-1
100 mVs-1
Potential / V(vs.Ag/Ag+)
-2.0 -1.5 -1.0 -0.5 0.0 0.5 1.0 1.5
Cu
rre
nt
/ m
A
-0.04
-0.03
-0.02
-0.01
0.00
0.01
0.02
0.03
0.04
10 mVs-1
50 mVs-1
100 mVs-1
200 mVs-1
500 mVs-1

121
The cell potential, number of electrons transferred, and concentration of active
species determine the energy density of a VRFB. The active-species solubility limits
can be used in place of its concentration to estimate the maximum energy densities for a
particular chemistry. Solubility of CH3CN in energy densities and different DESs were
calculated using a ICP-AES spectrometer, and are listed in Table 4.14. The method used
to measure the solubility of a V(acac)3 in DESs was given in Section 3.3. The solubility
of V(acac)3 in CH3CN were near 0.6 M, whereas the solubility of DESs were up to 0.25
M. Thus, the energy densities of V(acac)3 in DES3 is 3 times smaller than CH3CN.
In order to select the more promising DESs, the reversibility of the reactions and its
kinetics should be taken into account. The effective k0 was estimated using Eq. 4.9. The
k0 of the reactions for DES3 and CH3CN were comparable, while those for DES9 were
approximately 10 times smaller.
Table 4.14: Summary of V(acac)3 performance characteristics in selected DESs and
CH3CN.
Electrolyte
Cell
Potential
(V)
D×10-6
(cm2s
-1)
k0×10
-3
(cm s-1
)
Solubility
(M)
Energy Density
(Wh L-1
)
V(II)/V(III) V(III)/V(IV)
CH3CN 2.18 3.50 (±0.06) 1.25(±0.08) 1.18(±0.07) 0.63(±0.05) 18.40
DES3 2.01 0.69 (±0.03) 0.74(±0.05) 1.02(±0.08) 0.25(±0.06) 6.73
DES9 1.98 0.02-0.13 (±0.05) 0.12(±0.07) 0.32(±0.02) 0.12(±0.04) 3.18
DES11 2.01 0.59-0.63 (±0.08) 0.53(±0.04) 0.85(±0.03) 0.19(±0.07) 5.11
The standard open circuit cell potential can be used to determine the potential of the
system when no current is flowing through the system via the Nernst equation
(supposing the reactants and products of redox reactions behave relatively ideally, so
that activity coefficients are unity):
where E is the measured potential, E0 is the cell potential measured from cyclic
voltammetry, R is the universal gas constant, T is the absolute temperature, n is the
0 RT [products]E E - ln
nF [reactan ts]
(4.15)
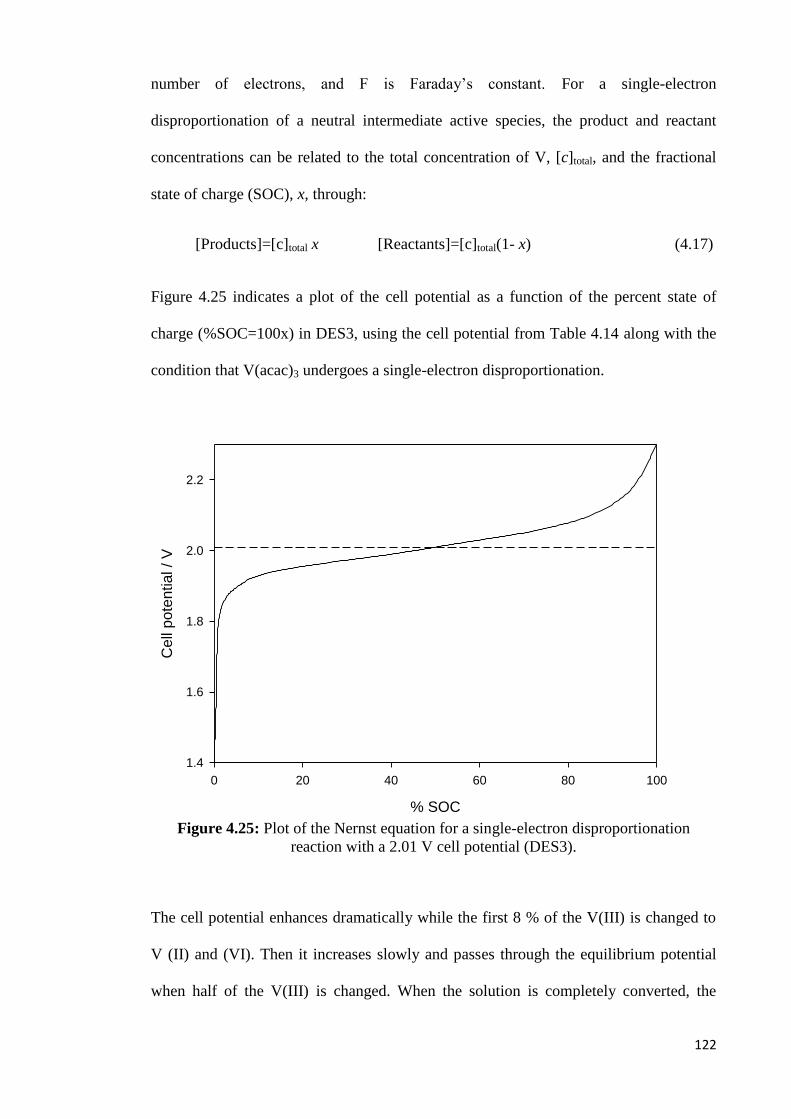
122
number of electrons, and F is Faraday‘s constant. For a single-electron
disproportionation of a neutral intermediate active species, the product and reactant
concentrations can be related to the total concentration of V, [c]total, and the fractional
state of charge (SOC), x, through:
[Products]=[c]total x [Reactants]=[c]total(1- x) (4.17)
Figure 4.25 indicates a plot of the cell potential as a function of the percent state of
charge (%SOC=100x) in DES3, using the cell potential from Table 4.14 along with the
condition that V(acac)3 undergoes a single-electron disproportionation.
Figure 4.25: Plot of the Nernst equation for a single-electron disproportionation
reaction with a 2.01 V cell potential (DES3).
The cell potential enhances dramatically while the first 8 % of the V(III) is changed to
V (II) and (VI). Then it increases slowly and passes through the equilibrium potential
when half of the V(III) is changed. When the solution is completely converted, the
% SOC
0 20 40 60 80 100
Ce
ll p
ote
ntia
l /
V
1.4
1.6
1.8
2.0
2.2

123
potential again increases dramatically towards infinity at 100 % conversion. This
dramatic increase is indicative of overcharging if it is observed in the charge/discharge
curves.
4.4 Charge/discharge performance
CH3CN has been used to validate the results obtained with DES3. Galvanostatic
charge and discharge has been performed with 0.01 M V(acac)3 in CH3CN consisting of
0.5 M TEABF4 as reported above. The result is shown in Figure 4.26 for 2 cycles. The
coulombic efficiency is also near 50% at 50% SOC herein (like similar experiments
reported in the literature (Liu et al., 2009)), which confirms that the reactor employed is
worthy for investigation using DES3.
Figure 4.26: Charge/discharge curves for 0.01 M V(acac)3/0.5 M TEABF4 in CH3CN.
The charge current was 1 mA and the discharge current was 0.1 mA.
The charge/discharge cycle for the same electrolytes in DES3 was evaluated.
Galvanostatic conditions were applied with potential cutoffs for both charge and
discharge (Figure 4.27). The cut-off potential for charge was 2.40 V, higher than the
2.01 V cell potential detected in the voltammetry for the one-electron disproportionation
Time / hours
0 5 10 15 20
Pote
ntial /
V
-0.5
0.0
0.5
1.0
1.5
2.0
2.5
3.0

124
of V(acac)3 in DES3. The cut-off potential for discharge was set at 0 V to enable the
system to completely discharge without establishing side reactions. Further
charge/discharge cycling was performed and the electrolyte was found to be stable after
10 cycles (Figure 4.28).
Figure 4.27: Charge/discharge curves for 0.01 M V(acac)3/0.5 M TEABF4 in DES3.
The charge current was 0.1 mA and the discharge current was 0.01 mA.
As shown in Figure 4.28, the charge voltage was as high as 2.40 V for the system,
suggesting a total overpotential of 400 mV with respect to the 2.01 V formal potential
associated with reaction. There is a small discharge voltage plateau in this system,
around 0.5 V and 0.3 V for cycle 1-5 and cycle 6-12, respectively. The low discharge
voltage may be because of the large ohmic drop and polarization in the H-type cell.
Despite adding a supporting electrolyte, the ohmic drop was higher in the case of DES.
Ohmic overpotential was probably important due to the low conductivity of the
electrolyte, the relatively large distance between the two electrodes in the H-type cell,
and the relatively low ionic conductivity of the membrane separator. The ohmic
Time / hours
0 5 10 15 20
Pote
ntial /
V
-0.5
0.0
0.5
1.0
1.5
2.0
2.5
3.0

125
overpotential decreased the energy efficiency. The coulombic and energy efficiencies
obtained relatively constant values; with similar charge/discharge curves recorded.
Coulombic efficiency (CE) is the ratio of a cell's discharge capacity divided by its
charge capacity, described as Eq. 4.18.
Where ID and IC are discharge and charge cell currents, tD and tC are discharge and
charge times.
The CE for TEABF4/ DES3 was 49.58 % in cycle 1. It can be seen that the CE was
similar to that for CH3CN thereby giving significant relevance for considering DESs as
suitable electrolytes for future evaluations. The low CE may be due to side reactions
and/or the crossover of the active species through the anion-exchange membrane.
D D
C C
I tCE 100%
I t
(4.18)
Time / hours
0 20 40 60 80 100 120 140
Po
ten
tia
l /
V
-0.5
0.0
0.5
1.0
1.5
2.0
2.5
3.0
Cu
rre
nt
/ m
A
-0.02
0.00
0.02
0.04
0.06
0.08
0.10
0.12

126
Energy efficiency (EE) is estimated from voltage efficiency (VE) and CE, as depicted in
Eq. 4.19. VE is defined as the ratio of a cell‘s mean discharge voltage (VD) divided by
its mean charge voltage (VC), displayed in Eq. 4.20.
CE for cycles 1-12 ranged from 49-52 % at 50 % SOC. These low values may owe
to crossover of the active species through the membrane. EE of approximately 25-31 %
were achieved.
EE CE VE (4.19)
D
C
VVE 100%
V
(4.20)
127
CHAPTER 5: CONCLUSIONS
5.1. Summary and conclusions
Throughout the present work, sixteen DESs were synthesized. The DESs were
characterized and selected DESs were used as electrolytes in charge/discharge tests
using all-vanadium redox couples. The following conclusions were drawn from the
results of the preliminary examinations that were carried out.
a) DESs were produced at high purity using a simple and effective synthesis method
DESs were easily prepared by mixing salts and HBDs with moderate heating. The
synthesis procedure did not require sophisticated equipment. The purity of the
resulting DES was completely dependent on the purity of the mixed components due
to the absence of any chemical reaction.
Some DESs in this study were considered as novel DESs as they were not
synthesized, characterized or employed previously.
b) Different conditions are required for the synthesis of different combinations of
DESs
It was found that the types of salt and HBD were the principal factors that determine
the optimum temperature needed for the preparation of DESs.
c) Physicochemical properties of DESs are temperature dependent
The prepared DESs were characterized by measuring selected important
physicochemical properties, such as viscosity, density, conductivity, molar
conductivity and pH over the temperature range from 298 to 368 K. As expected, the
values of the measured properties changed with temperature. While the density and
pH changed linearly with temperature, viscosity and ionic conductivity showed

128
exponential behavior. The activation energies for viscosity and conductivity for each
DES were then calculated from the slopes of the Arrhenius plots. Walden plot was
used to correlate viscosity and conductivity. The type of HBD was found to
importantly affect the physical behaviour of the DES. For instance, the DESs
synthesized from ethylene glycol and zinc nitrate hexahydrate HBDs had higher ionic
conductivities than those made from other HBDs. Additionally, the DESs synthesized
from ammonium salts showed higher conductivities than those made from
phosphonium salts with same HBDs.
Some of the prepared DESs have favourable physical properties, e.g. low freezing
point, moderate viscosity and high electrical conductivity. These make them potential
solvents for many green applications.
d) Electrochemical properties of Fc and Cc+ are temperature dependent
The electrochemical oxidation of Fc and Cc+ has been studied by cyclic
voltammetry and potential step chronoamperometry in different DESs. The potential
windows of DESs have been determined electrochemically at Pt microelectrode and a
GC electrode. The reductive and oxidative potential limits have been reported versus
Ag/Ag QRE. In most cases, the DESs made up of ammonium salts had a larger
potential window compared with the corresponding phosphonium based DESs.
Results show that D for Fc and Cc+ does not change significantly with
concentration. Fc/Fc+
and Cc+/Cc complies with classical Stokes-Einstein behaviour
in terms of the D vs η-1
dependence. The values of the calculated Stokes–Einstein
product of Fc and Cc+ in these DESs are less than those determined in other ILs.The
kinetics of electron transfer across the DES/electrode interface have been studied
using cyclic voltammetry and the highest k0 is determined to be 5.44×10
-4 cm s
-1 and
4.35×10⁻⁴
cm s-1
for Fc/Fc+
and Cc+/Cc, respectively, in the ammonium based DES
129
prepared from N,N-diethylenethanol ammonium chloride and ethylene glycol. D and
k0 of Fc and Cc
+ in the DESs are found to be an order of magnitude lower than those
reported in the literature in ILs under similar conditions.
The influence of temperature on the calculated electrochemical properties of
studied DESs was discussed in detail. The D and k0 values tended to increase with the
rise of temperature in DESs. The validity of the Arrhenius law was verified by
examining the temperature dependencies of D and k0. The trends of electrochemically
derived activation energy from chronoamperometric characterization have relationships
with Eη and Eσ evaluated from the experimental values. In addition, ΔEp was reduced
with an increase in temperature and E1/2 values shifted towards more negative potentials
for oxidation of Fc and more positive potentials for reduction of Cc+ in DESs with the
enhancement in temperature.
Based on the performed electrochemical experiments, it was found that some of
prepared DESs have the potential to be used in the evaluation of V(acac)3 flow battery.
e) Despite low solubility, good electrochemical performance is observed for DES3 by
means of cyclic voltammetric studies
V(acac)3/DESs system was evaluated for application in a non-aqueous VRFB.
Results from voltammetry show that the V(acac)3 complex can be simply reduced to
[V(acac)3]¯
and oxidized to [V(acac)3]+ at a GC electrode. In addition, the cyclic
voltammograms indicate that TEABF4 is stable in V(acac)3 and DES3, 9 and 11
electrolytes in −2.5–1.5 V.
Kinetics of electrode reactions shows that both of V(II)/V(III) and V(III)/V(IV)
reactions are reversible in DES3 and quasi-reversible in DES 9 and DES11 electrolytes.
The D for DESs is in the range of 0.02–0.69×10⁻⁶
cm2 s
−1 at room temperature.
130
V(acac)3 has reversible electrochemistry in DES3, but a much higher solubility is
required to compete with aqueous systems.
The energy density of a VRFB electrolyte is dictated by the solubility of active species,
the voltage at which the active species react and the number of electrons transferred in
the cell reaction. In this study, the energy density of a VRFB is lower due to the low
solubility and limitations in the cell.
f) Charge and discharge using DES3 shows similar coulombic efficiency as for CH3CN
The charge/discharge characteristics for the all-vanadium system were evaluated using
an H-cell with an anion-exchange membrane separator for the first time. Coulombic and
energy efficiencies of the electrolyte containing V(acac)3/0.5 M TEABF4 in DES3 were
obtained as 49-52 % and 25-31 %, respectively, when charging from 0% to 50% of
theoretical maximum SOC for the cycles 1-12. The low CE may be indebted to
crossover of the active species through the separator, or to the loss of active vanadium
to a parasitic reaction. However, the CE was similar to that for CH3CN thereby giving
significant relevance for considering DESs as suitable electrolytes for future
evaluations. Charge and discharge voltages are respectively higher and lower than the
formal cell potential obtained by voltammetry. Ohmic drop in the DES results from the
low conductivity of the electrolyte and the relatively large distance between the two
electrodes in the H-cell.
5.2. Recommendations for future work
Other types of DESs could be synthesized using various salts and HBDs and a
similar investigation could be conducted to optimize the performance and tune
up the process.

131
This study showed that DESs could be used effectively as electrolytes for RFBs.
However, the solubility was found to be low and tests with other DESs is recommended
to determine optimum performance in terms of high solubility and good efficiencies.
One means of improving solubility could be to operate the cell at 50 °C, akin to results
reported by Lloyd and co-workers for an all-copper redox flow cell (Lloyd et al., 2013).

132
REFERENCES
Abbott, A. P. (2004). Application of Hole Theory to the Viscosity of Ionic and
Molecular Liquids. ChemPhysChem, 5(8), 1242-1246.
Abbott, A. P., Barron, J. C., Ryder, K. S., Wilson, D. (2007b). Eutectic-based ionic
liquids with metal-containing anions and cations. Chemistry – A European
Journal, 13(22), 6495-6501.
Abbott, A. P., Bell, T. J., Handa, S., Stoddart, B. (2005). O-Acetylation of cellulose and
monosaccharides using a zinc based ionic liquid. Green Chemistry, 7(10), 705-
707.
Abbott, A. P., Boothby, D., Capper, G., Davies, D. L., Rasheed, R. K. (2004). Deep
Eutectic Solvents Formed between Choline Chloride and Carboxylic Acids:
Versatile Alternatives to Ionic Liquids. Journal of the American Chemical
Society, 126(29), 9142-9147.
Abbott, A. P., Capper, G., Davies, D. L., McKenzie, K. J., Obi, S. U. (2006). Solubility
of metal oxides in deep eutectic solvents based on choline chloride. Journal of
Chemical & Engineering Data, 51(4), 1280-1282.
Abbott, A. P., Capper, G., Davies, D. L., Rasheed, R. K. (2004). Ionic Liquid
Analogues Formed from Hydrated Metal Salts. Chemistry – A European
Journal, 10(15), 3769-3774.
Abbott, A. P., Capper, G., Davies, D. L., Rasheed, R. K., Tambyrajah, V. (2003). Novel
solvent properties of choline chloride/urea mixtures. Chemical
Communications(1), 70-71.
Abbott, A. P., Capper, G., McKenzie, K. J., Ryder, K. S. (2007). Electrodeposition of
zinc-tin alloys from deep eutectic solvents based on choline chloride. Journal
of Electroanalytical Chemistry, 599(2), 288-294.
Abbott, A. P., El Ttaib, K., Frisch, G., McKenzie, K. J., Ryder, K. S. (2009).
Electrodeposition of copper composites from deep eutectic solvents based on
choline chloride. Physical Chemistry Chemical Physics, 11(21), 4269-4277.
Abbott, A. P., Frisch, G., Gurman, S. J., Hillman, A. R., Hartley, J., Holyoak, F., et al.
(2011b). Ionometallurgy: designer redox properties for metal processing.
Chemical Communications, 47(36), 10031-10033.
Abbott, A. P., Frisch, G., Hartley, J., Ryder, K. S. (2011a). Processing of metals and
metal oxides using ionic liquids. Green Chemistry, 13(3), 471-481.
Abbott, A. P., Griffith, J., Nandhra, S., O'Connor, C., Postlethwaite, S., Ryder, K. S., et
al. (2008). Sustained electroless deposition of metallic silver from a choline
chloride-based ionic liquid. Surface and Coatings Technology, 202(10), 2033-
2039.
Abbott, A. P., Harris, R. C., Ryder, K. S. (2007c). Application of Hole Theory to Define
Ionic Liquids by their Transport Properties. The Journal of Physical Chemistry
B, 111(18), 4910-4913.
Adamova, G., Gardas, R. L., Nieuwenhuyzen, M., Puga, A. V., Rebelo, L. P. N.,
Robertson, A. J., et al. (2012). Alkyltributylphosphonium chloride ionic
liquids: synthesis, physicochemical properties and crystal structure. Dalton
Transactions, 41(27), 8316-8332.
133
Adams, R.N., Electrochemistry at solid electrodes M. Dekker, New York, 1969,
xiii+402.
Aki, S. N. V. K., Brennecke, J. F., Samanta, A. (2001). How polar are room temperature
ionic liquids? Chemical Communications. 413–414.
AlNashef, I. M., Leonard, M. L., Kittle, M. C., Matthews, M. A., Weidner, J. W.
(2001). Electrochemical generation of superoxide in room-temperature ionic
liquids. Electrochemical and Solid-State Letters, 4(11), D16-D18.
AlNashef, I. M., Leonard, M. L., Matthews, M. A., Weidner, J. W. (2002). Superoxide
electrochemistry in an ionic liquid. Industrial & Engineering Chemistry
Research, 41(18), 4475-4478.
Anderson, C. J., Deakin, M. R., Choppin, G. R., D'Olieslager, W., Heerman, L., Pruett,
D. J. (1991). Spectroscopy and electrochemistry of uranium(IV)/uranium(III)
in basic aluminum chloride-1-ethyl-3-methylimidazolium chloride. Inorganic
Chemistry, 30(21), 4013-4016.
Anderson, T. M., Ingersoll, D., Rose, A. J., Staiger, C. L., Leonard, J. C. (2010).
Synthesis of an ionic liquid with an iron coordination cation. Dalton
Transactions, 39(37), 8609-8612.
Angell, C. A., Byrne, N., Belieres, J.-P. (2007). Parallel Developments in Aprotic and
Protic Ionic Liquids: Physical Chemistry and Applications. Accounts of
Chemical Research, 40(11), 1228-1236.
Appetecchi, G. B., Montanino, M., Zane, D., Carewska, M., Alessandrini, F., Passerini,
S. (2009). Effect of the alkyl group on the synthesis and the electrochemical
properties of N-alkyl-N-methyl-pyrrolidinium
bis(trifluoromethanesulfonyl)imide ionic liquids. Electrochimica Acta, 54(4),
1325-1332.
Appetecchi, G. B., Scaccia, S., Tizzani, C., Alessandrini, F., Passerini, S. (2006).
Synthesis of hydrophobic ionic liquids for electrochemical applications.
Journal of The Electrochemical Society. 153(9), A1685–A1691.
Armand, M., Endres, F., MacFarlane, D. R., Ohno, H., Scrosati, B. (2009). Ionic-liquid
materials for the electrochemical challenges of the future. Nat Mater, 8(8),
621-629.
Arora, P., Zhang, Z. (2004). Battery Separators. Chemical Reviews, 104(10), 4419-
4462.
Asensio, J. A., Sanchez, E. M., Gomez-Romero, P. (2010). Proton-conducting
membranes based on benzimidazole polymers for high-temperature PEM fuel
cells. A chemical quest. Chemical Society Reviews, 39(8), 3210-3239.
Assink, R. A. (1984). Fouling mechanism of separator membranes for the
iron/chromium redox battery. Journal of Membrane Science, 17(2), 205-217.
Audrieth, L. F., Long, A., Edwards, R. E. (1936). Fused "Onium" Salts as Acids.
Reactions in Fused Pyridinium Hydrochloride. Journal of the American
Chemical Society, 58(3), 428-429.
Bae, C., Roberts, E. P. L., Chakrabarti, M. H., Saleem, M. (2011). All-Chromium
Redox Flow Battery for Renewable Energy Storage. International Journal of
Green Energy, 8(2), 248-264.
134
Bandres, I., Alcalde, R., Lafuente, C., Atilhan, M., Aparicio, S. (2011). On the Viscosity
of Pyridinium Based Ionic Liquids: An Experimental and Computational
Study. The Journal of Physical Chemistry B, 115(43), 12499-12513.
Banos, R., Manzano-Agugliaro, F., Montoya, F. G., Gil, C., Alcayde, A., Gomez, J.
(2011). Optimization methods applied to renewable and sustainable energy: A
review. Renewable and Sustainable Energy Reviews, 15(4), 1753-1766.
Bao, W. L., Wang, Z. M., Li, Y. X. (2003). Synthesis of chiral ionic liquids from
natural amino acids. Journal of Organic Chemistry. 68, 591–593
Bard, A. J., Faulkner, L. R., Electrochemical Methods: Fundamentals and Applications,
2nd ed., Wiley, New York, USA, 2001.
Barnartt, S., Forejt, D. A. (1964). Bromine-Zinc Secondary Cells. Journal of The
Electrochemical Society, 111(11), 1201-1204.
Barrosse-Antle, L. E., Bond, A. M., Compton, R. G., O'Mahony, A. M., Rogers, E. I.,
Silvester, D. S. (2010). Voltammetry in Room Temperature Ionic Liquids:
Comparisons and Contrasts with Conventional Electrochemical Solvents.
Chemistry – An Asian Journal, 5(2), 202-230.
Bartolozzi, M. (1989). Development of redox flow batteries. A historical bibliography.
Journal of Power Sources, 27(3), 219-234.
Batra, D., Seifert, S., Varela, L. M., Liu, A. C. Y., Firestone, M. A. (2007). Solvent-
Mediated Plasmon Tuning in a Gold-Nanoparticle–Poly(Ionic Liquid)
Composite. Advanced Functional Materials, 17(8), 1279-1287.
Besenhard, J. O., Schollhorn, R. (1976). The discharge reaction mechanism of the
MoO3 electrode in organic electrolytes. Journal of Power Sources, 1(3), 267-
276.
Bhatt, A. I., Bond, A. M. (2008). Electrodeposition of silver from the 'distillable' ionic
liquid, DIMCARB in the absence and presence of chemically induced
nanoparticle formation. Journal of Electroanalytical Chemistry, 619-620, 1-10.
Bhatt, A., Bond, A., Zhang, J. (2007). Electrodeposition of lead on glassy carbon and
mercury film electrodes from a distillable room temperature ionic liquid,
DIMCARB. Journal of Solid State Electrochemistry, 11(12), 1593-1603.
Boisset, A., Menne, S., Jacquemin, J., Balducci, A., Anouti, M. (2013). Deep eutectic
solvents based on N-methylacetamide and a lithium salt as suitable electrolytes
for lithium-ion batteries. Physical Chemistry Chemical Physics, 15(46), 20054-
20063.
Bond, A. M., Oldham, K. B., Snook, G. A. (2000). Use of the Ferrocene Oxidation
Process to Provide Both Reference Electrode Potential Calibration and a
Simple Measurement (via Semiintegration) of the Uncompensated Resistance
in Cyclic Voltammetric Studies in High-Resistance Organic Solvents.
Analytical Chemistry, 72(15), 3492-3496.
Bonhote, P., Dias, A.-P., Papageorgiou, N., Kalyanasundaram, K., Gratzel, M. (1996).
Hydrophobic, Highly Conductive Ambient-Temperature Molten Salts.
Inorganic Chemistry, 35(5), 1168-1178.
Boxall, D. L., O'Dea, J. J., Osteryoung, R. A. (2002). Apparent Anomaly during
Rotating Disk Voltammetry in Ionic Liquids. Journal of The Electrochemical
Society, 149(11), E468-E471.
135
Brooks, C. A., Doherty, A. P. (2004). Concentration-dependent diffusion in room
temperature ionic liquids: a microelectrode study. Electrochemistry
Communications, 6(8), 867-871.
Burt, R., Birkett, G., Zhao, X. S. (2014). A review of molecular modelling of electric
double layer capacitors. Physical Chemistry Chemical Physics, 16(14), 6519-
6538.
Buzzeo, M. C., Evans, R. G., Compton, R. G. (2004). Non-Haloaluminate Room-
Temperature Ionic Liquids in Electrochemistry—A Review. ChemPhysChem,
5(8), 1106-1120.
Buzzeo, M. C., Klymenko, O. V., Wadhawan, J. D., Hardacre, C., Seddon, K. R.,
Compton, R. G. (2003). Voltammetry of Oxygen in the Room-Temperature
Ionic Liquids 1-Ethyl-3-methylimidazolium
Bis((trifluoromethyl)sulfonyl)imide and Hexyltriethylammonium
Bis((trifluoromethyl)sulfonyl)imide: One-Electron Reduction To Form
Superoxide. Steady-State and Transient Behavior in the Same Cyclic
Voltammogram Resulting from Widely Different Diffusion Coefficients of
Oxygen and Superoxide. The Journal of Physical Chemistry A, 107(42), 8872-
8878.
Caban, K., Donten, M., Stojek, Z. (2003). Electroformation of Microlayers of Ionic
Liquids in Undiluted Nitromethane and Its Homologues. Unusual Oscillations
behind the Range of Limiting Steady-State Current. The Journal of Physical
Chemistry B, 108(3), 1153-1159.
Carmichael, A. J., Seddon, K. R. (2000). Polarity study of some 1-alkyl-3-
methylimidazolium ambient-temperature ionic liquids with thesolvatochromic
dye, Nile red. Journal of Physical and Organic Chemistry. 13, 591–595.
Carriazo, D., Serrano, M. C., Gutierrez, M. C., Ferrer, M. L., del Monte, F. (2012).
Deep-eutectic solvents playing multiple roles in the synthesis of polymers and
related materials. Chemical Society Reviews, 41(14), 4996-5014.
Carter, M. T., Hussey, C. L., Strubinger, S. K. D., Osteryoung, R. A. (1991).
Electrochemical reduction of dioxygen in room-temperature imidazolium
chloride-aluminum chloride molten salts. Inorganic Chemistry, 30(5), 1149-
1151.
Chakrabarti M. H, Dryfe, R. A. W, Roberts, E. P. L. ( 2007) Organic electrolytes for
redox flow batteries. Journal of the Chemical Society of Pakistan, 29, 294-300.
Chakrabarti, M. H., Dryfe, R. A. W., Roberts, E. P. L. (2007). Evaluation of electrolytes
for redox flow battery applications. Electrochimica Acta, 52(5), 2189-2195.
Chakrabarti, M. H., Dryfe, R. A.W., Roberts E. P. L. (2007). Organic electrolytes for
redoxflow batteries, Journal of the Chemical Society of Pakistan, 29(4), 294-
300.
Chakrabarti, M. H., Mjalli, F. S., AlNashef, I. M., Hashim, M. A., Hussain, M. A.,
Bahadori, L., et al. (2014). Prospects of applying ionic liquids and deep
eutectic solvents for renewable energy storage by means of redox flow
batteries. Renewable and Sustainable Energy Reviews, 30, 254-270.
Chakrabarti, M. H., Roberts, E. P. L., Bae, C., Saleem, M. (2011). Ruthenium based
redox flow battery for solar energy storage. Energy Conversion and
Management, 52(7), 2501-2508.
136
Chakrabarti, M., Brandon, N., Mjalli, F., Bahadori, L., Al Nashef, I., Hashim, M. A.,
Hussain, M. A., Low, J., Yufit,.V. (2013). Cyclic Voltammetry of Metallic
Acetylacetonate Salts in Quaternary Ammonium and Phosphonium Based
Deep Eutectic Solvents. Journal of Solution Chemistry, 42(12), 2329-2341.
Chen C. (2001). Synthesis and characterization of new cathode materials for lithium ion
batteries. Thesis, Binghamton University, New York.
Choi, Y. H., van Spronsen, J., Dai, Y., Verberne, M., Hollmann, F., Arends, I. W. C. E.,
et al. (2011). Are Natural Deep Eutectic Solvents the Missing Link in
Understanding Cellular Metabolism and Physiology? Plant Physiology, 156(4),
1701-1705.
Chum, H. L., Koch, V. R., Miller, L. L., Osteryoung, R. A. (1975). Electrochemical
scrutiny of organometallic iron complexes and hexamethylbenzene in a room
temperature molten salt. Journal of American Chemical Society. 97, 3264–
3267.
Dai, Y., van Spronsen, J., Witkamp, G.-J., Verpoorte, R., Choi, Y. H. (2013). Natural
deep eutectic solvents as new potential media for green technology. Analytica
Chimica Acta, 766, 61-68.
De Souza, R. F., Padilha, J. C., Goncalves, R. S., Dupont, J. (2003). Room temperature
dialkylimidazolium ionic liquid-based fuel cells. Electrochemistry
Communications, 5(8), 728-731.
Devanathan, R. (2008). Recent developments in proton exchange membranes for fuel
cells. Energy & Environmental Science, 1(1), 101-119.
Diaz-Gonzalez, F., Sumper, A., Gomis-Bellmunt, O. Villafafila-Robles, R. (2012). A
review of energy storage technologies for wind power applications. Renewable
and Sustainable Energy Reviews, 16(4), 2154-2171.
Doyle, M., Choi, S. K., Proulx, G. (2000). High-Temperature Proton Conducting
Membranes Based on Perfluorinated Ionomer Membrane-Ionic Liquid
Composites. Journal of The Electrochemical Society, 147(1), 34-37.
Du, Z., Li, Z., Guo, S., Zhang, J., Zhu, L., Deng, Y. (2005). Investigation of
Physicochemical Properties of Lactam-Based Brأ¸nsted Acidic Ionic Liquids.
The Journal of Physical Chemistry B, 109(41), 19542-19546.
Dullius, J. E. L., Suarez, P. A. Z., Einloft, S., de Souza, R. F., Dupont, J., Fischer, J., et
al. (1998). Selective Catalytic Hydrodimerization of 1,3-Butadiene by
Palladium Compounds Dissolved in Ionic Liquids. Organometallics, 17(5),
815-819.
Dupont, J., Fonseca, G. S., Umpierre, A. P., Fichtner, P. F. P., Teixeira, S. R. (2002).
Transition-Metal Nanoparticles in Imidazolium Ionic Liquids: Recycable
Catalysts for Biphasic Hydrogenation Reactions. Journal of the American
Chemical Society, 124(16), 4228-4229.
Dzyuba, S. V., Bartsch, R. A. (2002). Influence of Structural Variations in 1-
Alkyl(aralkyl)-3-Methylimidazolium Hexafluorophosphates and
Bis(trifluoromethylsulfonyl)imides on Physical Properties of the Ionic Liquids.
ChemPhysChem, 3(2), 161-166.
Earle, M. J., Esperanca, J. M. S. S., Gilea, M. A., Canongia Lopes, J. N., Rebelo, L. P.
N., Magee, J. W., et al. (2006). The distillation and volatility of ionic liquids.
Nature, 439(7078), 831-834.

137
Earle, M. J., Seddon, K. R. (2000). Ionic liquids. Green solvents for the future. Pure and
Applied Chemistry, 72 (7), 1391–1398.
Eisele, S., Schwarz, M., Speiser, B., Tittel, C. (2006). Diffusion coefficient of ferrocene
in 1-butyl-3-methylimidazolium tetrafluoroborate - concentration dependence
and solvent purity. Electrochimica Acta, 51(25), 5304-5306.
Endres, F. (2004). Ionic Liquids: Promising Solvents for Electrochemistry, Zeitschrift
fur Physikalische Chemie (Vol. 218, pp. 255).
Endres, F., MacFarlane, D. R., Abbott, A. P. (2008). Electrodeposition from Ionic
Liquids;
Endres, F., Zein El Abedin, S. (2006). Air and water stable ionic liquids in physical
chemistry. Physical Chemistry Chemical Physics, 8(18), 2101-2116.
Erdinc, O., Uzunoglu, M. (2012). Optimum design of hybrid renewable energy systems:
Overview of different approaches. Renewable and Sustainable Energy
Reviews, 16(3), 1412-1425.
Evans, A., Strezov, V., Evans, T. J. (2012). Assessment of utility energy storage options
for increased renewable energy penetration. Renewable and Sustainable
Energy Reviews, 16(6), 4141-4147.
Evans, R. G., Klymenko, O. V., Hardacre, C., Seddon, K. R., Compton, R. G. (2003).
Oxidation of N,N,N,N-tetraalkyl-para-phenylenediamines in a series of room
temperature ionic liquids incorporating the bis(trifluoromethylsulfonyl)imide
anion. Journal of Electroanalytical Chemistry, 556(0), 179-188.
Fabjan, C., Garche, J., Harrer, B., Jorissen, L., Kolbeck, C., Philippi, F. (2001). The
vanadium redox-battery: an efficient storage unit for photovoltaic systems.
Electrochimica Acta, 47(5), 825-831.
Fang, B., Iwasa, S., Wei, Y., Arai, T., Kumagai, M. (2002). A study of the
Ce(III)/Ce(IV) redox couple for redox flow battery application. Electrochimica
Acta, 47(24), 3971-3976.
Fernicola, A., Navarra, M., Panero, S. (2008). Aprotic ionic liquids as electrolyte
components in protonic membranes. Journal of Applied Electrochemistry,
38(7), 993-996.
Fernicola, A., Scrosati, B., Ohno, H. (2006). Potentialities of ionic liquids as new
electrolyte media in advanced electrochemical devices. Ionics, 12(2), 95-102.
Figure 2.6 from :< http://www.leicester-ils.co.uk/deepeutectics.html>
Fonseca, G. S., Umpierre, A. P., Fichtner, P. F. P., Teixeira, S. R., Dupont, J. (2003).
The Use of Imidazolium Ionic Liquids for the Formation and Stabilization of
Ir0 and Rh0 Nanoparticles: Efficient Catalysts for the Hydrogenation of
Arenes. Chemistry – A European Journal, 9(14), 3263-3269.
Fontaine, O., Lagrost, C., Ghilane, J., Martin, P., Trippe, G., Fave, C., et al. (2009).
Mass transport and heterogeneous electron transfer of a ferrocene derivative in
a room-temperature ionic liquid. Journal of Electroanalytical Chemistry, 632,
88-96.
Fraser, K. J., MacFarlane, D. R. (2009). Phosphonium-Based Ionic Liquids: An
Overview. Australian Journal of Chemistry, 62(4), 309-321.
138
Fredlake, C. P., Crosthwaite, J. M., Hert, D. G., Aki, S. N. V. K., Brennecke, J. F.
(2004). Thermophysical Properties of Imidazolium-Based Ionic Liquids.
Journal of Chemical & Engineering Data, 49(4), 954-964.
Fu, C., Aldous, L., Dickinson, E. J. F., Manan, N. S. A., Compton, R. G. (2011). The
Kinetics of Ferrocene Volatilisation from an Ionic Liquid. ChemPhysChem,
12(9), 1708-1713.
Fukumoto, K., Yoshizawa, M., Ohno, H. (2005). Room Temperature Ionic Liquids from
20 Natural Amino Acids. Journal of the American Chemical Society, 127(8),
2398-2399.
Fuller, J., Carlin, R. T., Osteryoung, R. A. (1997). The room temperature ionic liquid 1-
ethyl-3-methylimidazolium tetrafluoroborate: Electrochemical couples and
physical properties. Journal of The Electrochemical Society. 144 (11), 3881–
3886.
Gagne, R. R., Koval, C. A., Lisensky, G. C. (1980). Ferrocene as an internal standard
for electrochemical measurements. Inorganic Chemistry, 19(9), 2854-2855.
Galinski, M., Lewandowski, A., Stepniak, I. (2006). Ionic liquids as electrolytes.
Electrochimica Acta, 51(26), 5567-5580.
Garcia, B. a., Lavallee, S., Perron, G. r., Michot, C., Armand, M. (2004). Room
temperature molten salts as lithium battery electrolyte. Electrochimica Acta,
49(26), 4583-4588.
Gathergood, N., Scammells, P. J., Garcia, M. T. (2006). Biodegradable ionic liquids
Part III. The first readily biodegradable ionic liquids. Green Chemistry, 8(2),
156-160.
Gattrell, M., Park, J., MacDougall, B., Apte, J., McCarthy, S., Wu, C. W. (2004). Study
of the Mechanism of the Vanadium 4+/5+ Redox Reaction in Acidic Solutions.
Journal of The Electrochemical Society, 151(1), A123-A130.
Gau, W.-j., Sun, I.-W. (1996). Electrochemical and Spectroscopic Studies of Ytterbium
in the Aluminum Chloride-1-methyl-3-ethylimidazolium Chloride Room
Temperature Molten Salt. Journal of The Electrochemical Society, 143(1), 170-
174.
Ge, S. H., Yi, B. L., Zhang, H. M. (2004). Study of a high power density sodium
polysulfide/bromine energy storage cell. Journal of Applied Electrochemistry,
34(2), 181-185.
Ghatee, M. H., Zare, M., Moosavi, F., Zolghadr, A. R. (2010). Temperature-Dependent
Density and Viscosity of the Ionic Liquids 1-Alkyl-3-methylimidazolium
Iodides: Experiment and Molecular Dynamics Simulation. Journal of Chemical
& Engineering Data, 55(9), 3084-3088.
Gratzel, M. (2001). Photoelectrochemical cells. Nature, 414(6861), 338-344.
Gritzner. G, Kuta. J. (1984). recommendations on reporting electrode potentials in
nonaqueous solvents. Pure and Applied Chemistry, 56(4), 461-466.
Gu, Z., Brennecke, J. F. (2002). Volume Expansivities and Isothermal Compressibilities
of Imidazolium and Pyridinium-Based Ionic Liquids. Journal of Chemical &
Engineering Data, 47(2), 339-345.

139
Hagiwara, R., Hirashige, T., Tsuda, T., Ito, Y. (2002). A Highly Conductive Room
Temperature Molten Fluoride: EMIF 2.3HF. Journal of The Electrochemical
Society, 149(1), D1-D6.
Hajimolana, S. A., Hussain, M. A., Daud, W. M. A. W., Soroush, M., Shamiri, A.
(2011). Mathematical modeling of solid oxide fuel cells: A review. Renewable
and Sustainable Energy Reviews, 15(4), 1893-1917.
Hall, P. J., Bain, E. J. (2008). Energy-storage technologies and electricity generation.
Energy Policy, 36(12), 4352-4355.
Handa, N., Sugimoto, T., Yamagata, M., Kikuta, M., Kono, M., Ishikawa, M. (2008). A
neat ionic liquid electrolyte based on FSI anion for electric double layer
capacitor. Journal of Power Sources, 185(2), 1585-1588.
Hart, E. K., Stoutenburg, E. D., Jacobson, M. Z. (2012). The Potential of Intermittent
Renewables to Meet Electric Power Demand: Current Methods and Emerging
Analytical Techniques. Proceedings of the IEEE, 100(2), 322-334.
Hayashi, K., Nemoto, Y., Akuto, K., Sakurai, Y. (2005). Alkylated imidazolium salt
electrolyte for lithium cells. Journal of Power Sources, 146, 689-692.
Hayyan, A., Mjalli, F. S., AlNashef, I. M., Al-Wahaibi, Y. M., Al-Wahaibi, T., Hashim,
M. A. (2013). Glucose-based deep eutectic solvents: physical properties.
Journal of Molecular Liquids. 178, 137 – 141.
Hayyan, M., Mjalli, F. S., Hashim, M. A., AlNashef, I. M., Al-Zahrani, S. M., Chooi, K.
L. (2012). Long term stability of superoxide ion in piperidinium, pyrrolidinium
and phosphonium cations-based ionic liquids and its utilization in the
destruction of chlorobenzenes. Journal of Electroanalytical Chemistry, 664(0),
26-32.
Herr, T., Fischer, P., Tubke, J., Pinkwart, K., Elsner, P. (2014). Increasing the energy
density of the non-aqueous vanadium redox flow battery with the acetonitrile-
1,3-dioxolane-dimethyl sulfoxide solvent mixture. Journal of Power Sources,
265, 317-324.
Hirao, M., Sugimoto, H., Ohno, H. (2000). Preparation of Novel Room Temperature
Molten Salts by Neutralization of Amines. Journal of The Electrochemical
Society, 147(11), 4168-4172.
Holbrey, J. D., Reichert, W. M., Reddy, R. G., Rogers, R. D. (2003). Heat capacities of
ionic liquids and their applications as thermal fluids. ACS Symposium Series:
Ionic Liquids as Green Solvents. 856, 121–133.
Hoogerstraete, T. V, Brooks, N. R., Norberg, B., Wouters, J., Van Hecke, K., Van
Meervelt, L., et al. (2012). Crystal structures of low-melting ionic transition-
metal complexes with N-alkylimidazole ligands. CrystEngComm, 14(15),
4902-4911.
Hou, Y., Gu, Y., Zhang, S., Yang, F., Ding, H., Shan, Y. (2008). Novel binary eutectic
mixtures based on imidazole. Journal of Molecular Liquids. 143, 154–159.
Huang, K.-L., Li, X.-g., Liu, S.-q., Tan, N., Chen, L.-q. (2008). Research progress of
vanadium redox flow battery for energy storage in China. Renewable Energy,
33(2), 186-192.
Huang, X.-J., Rogers, E. I., Hardacre, C., Compton, R. G. (2009). The Reduction of
Oxygen in Various Room Temperature Ionic Liquids in the Temperature
Range 293-318 K: Exploring the Applicability of the Stokes∑Einstein
140
Relationship in Room Temperature Ionic Liquids. The Journal of Physical
Chemistry B, 113(26), 8953-8959.
Hultgren, V. M., Mariotti, A. W. A., Bond, A. M., Wedd, A. G. (2002). Reference
Potential Calibration and Voltammetry at Macrodisk Electrodes of Metallocene
Derivatives in the Ionic Liquid [bmim][PF6]. Analytical Chemistry, 74(13),
3151-3156.
Hurley, F. H., Wier, T. P. (1951). Electrodeposition of Metals from Fused Quaternary
Ammonium Salts. Journal of The Electrochemical Society, 98(5), 203-206.
Inzelt, G. r., Lewenstam, A., Scholz, F., Gritzner, G. (2013). Reference Redox Systems
in Nonaqueous Systems and the Relation of Electrode Potentials in
Nonaqueous and Mixed Solvents to Standard Potentials in Water. In Handbook
of Reference Electrodes (pp. 25-31): Springer Berlin Heidelberg.
Ishikawa, M., Sugimoto, T., Kikuta, M., Ishiko, E., Kono, M. (2006). Pure ionic liquid
electrolytes compatible with a graphitized carbon negative electrode in
rechargeable lithium-ion batteries. Journal of Power Sources, 162(1), 658-662.
Itoh, H., Naka, K., Chujo, Y. (2004). Synthesis of Gold Nanoparticles Modified with
Ionic Liquid Based on the Imidazolium Cation. Journal of the American
Chemical Society, 126(10), 3026-3027.
Jacquemin, J., Ge, R., Nancarrow, D. W., Costa Gomes, M. F., Padua, A. A. H.,
Hardacer, C. (2008). Prediction of ionic liquid properties. I. Volumetric
properties as a function of temperature at 0.1 MPa. Journal of Chemical
Engineering Data. 53 (3), 716–726.
Jacquemin, J., Husson, P., Padua, A. A. H., Majer, V. (2006). Density and viscosity of
several pure and water-saturated ionic liquids. Green Chemistry, 8(2), 172-180.
Jhong, H.-R., Wong, D. S.-H., Wan, C.-C., Wang, Y.-Y., Wei, T.-C. (2009). A novel
deep eutectic solvent-based ionic liquid used as electrolyte for dye-sensitized
solar cells. Electrochemistry Communications, 11(1), 209-211.
Joerissen, L., Garche, J., Fabjan, C., Tomazic, G. (2004). Possible use of vanadium
redox-flow batteries for energy storage in small grids and stand-alone
photovoltaic systems. Journal of Power Sources, 127(1-2), 98-104.
Ju, Y.-J., Lien, C.-H., Chang, K.-H., Hu, C.-C., Wong, D. S.-H. (2012). Deep Eutectic
Solvent-based Ionic Liquid Electrolytes for Electrical Double-layer Capacitors.
Journal of the Chinese Chemical Society, 59(10), 1280-1287.
Kareem, M. A., Mjalli, F. S., Hashim, M. A., AlNashef, I. M. (2010). Phosphonium-
based ionic liquids analogues and their physical properties. Journal of
Chemical and Engineering Data. 55, 4632–4637.
Katayama, Y., Konishiike, I., Miura, T., Kishi, T. (2002). Redox reaction in 1-ethyl-3-
methylimidazolium-iron chlorides molten salt system for battery application.
Journal of Power Sources, 109(2), 327-332.
Katayama, Y., Konishiike, I., Miura, T., Kishi, T. (2002). Redox reaction in 1-ethyl-3-
methylimidazolium-iron chlorides molten salt system for battery application.
Journal of Power Sources, 109(2), 327-332.
Kazacos, M., Skyllas-Kazacos, M. (1989). Performance Characteristics of Carbon
Plastic Electrodes in the All-Vanadium Redox Cell. Journal of The
Electrochemical Society, 136(9), 2759-2760.
141
Kear, G., Shah, A. A., Walsh, F. C. (2012). Development of the all-vanadium redox
flow battery for energy storage: a review of technological, financial and policy
aspects. International Journal of Energy Research, 36(11), 1105-1120.
Keita, B., Bouaziz, D., Nadjo, L. (1988). Solvent Effects on the Redox Potentials of
Potassium 12-Tungstosilicate and 18-Tungstodiphosphate. Journal of The
Electrochemical Society, 135(1), 87-91
Keskin, S., Kayrak-Talay, D., Akman, U., Hortaçsu, Ö. (2007). A review of ionic
liquids towards supercritical fluid applications. Journal of Supercritical Fluids.
43, 150–180.
Kirchner, B., Clare, B., Sirwardana, A., MacFarlane, D. (2010). Synthesis, Purification
and Characterization of Ionic Liquids. In Ionic Liquids (Vol. 290, pp. 1-40):
Springer Berlin Heidelberg.
Kölle, P., Dronskowski, R. (2004). Synthesis, crystal structures and electrical
conductivities of the ionic liquid compounds butyl dimethylimidazolium
tetrafluoroborate, hexafluoroborate and hexafluoroantimonate. European
Journal of Inorganic Chemistry. 2313–2320.
Kuang, D., Wang, P., Ito, S., Zakeeruddin, S. M., Gratzel, M. (2006). Stable
Mesoscopic Dye-Sensitized Solar Cells Based on Tetracyanoborate Ionic
Liquid Electrolyte. Journal of the American Chemical Society, 128(24), 7732-
7733.
Kuhnel, R. S., Bockenfeld, N., Passerini, S., Winter, M., Balducci, A. (2011). Mixtures
of ionic liquid and organic carbonate as electrolyte with improved safety and
performance for rechargeable lithium batteries. Electrochimica Acta, 56(11),
4092-4099.
Laher, T. M., Hussey, C. L. (1982). Electrochemical studies of chloro complex
formation in low-temperature chloroaluminate melts. 1. Iron(II), iron(III), and
nickel(II). Inorganic Chemistry, 21(11), 4079-4083.
Largeot, C., Taberna, P. L., Gogotsi, Y., Simon, P. (2011). Microporous Carbon-Based
Electrical Double Layer Capacitor Operating at High Temperature in Ionic
Liquid Electrolyte. Electrochemical and Solid-State Letters, 14(12), A174-
A176.
Leron, R. B., Li, M.-H. (2012). High-pressure density measurements for choline
chloride: Urea deep eutectic solvent and its aqueous mixtures at T= (298.15 to
323.15) K and up to 50 MPa. The Journal of Chemical Thermodynamics,
54(0), 293-301.
Lessner, P. M., McLarnon, F. R., Winnick, J., Cairns, E. J. (1992). Aqueous
polysulphide flow-through electrodes: Effects of electrocatalyst and electrolyte
composition on performance. Journal of Applied Electrochemistry, 22(10),
927-934.
Leung, P., Li, X., Ponce De Leon, C., Berlouis, L., Low, C. T. J., Walsh, F. C. (2012).
Progress in redox flow batteries, remaining challenges and their applications in
energy storage. RSC Advances, 2(27), 10125-10156.
Lewandowski, A., Swiderska-Mocek, A. (2009). Ionic liquids as electrolytes for Li-ion
batteries-An overview of electrochemical studies. Journal of Power Sources,
194(2), 601-609.
142
Lewandowski, A., Swiderska-Mocek, A. (2010). Lithium-metal potential in Li+
containing ionic liquids. Journal of Applied Electrochemistry, 40(3), 515-524.
Lewandowski, A., Waligora, L., Galinski, M. (2013). Electrochemical Behavior of
Cobaltocene in Ionic Liquids. Journal of Solution Chemistry, 42(2), 251-262.
Li, H., Wang, Y., Na, H., Liu, H., Zhou, H. (2009). Rechargeable Ni-Li Battery
Integrated Aqueous/Nonaqueous System. Journal of the American Chemical
Society, 131(42), 15098-15099.
Li, L., Kim, S., Wang, W., Vijayakumar, M., Nie, Z., Chen, B., et al. (2011). A Stable
Vanadium Redox-Flow Battery with High Energy Density for Large-Scale
Energy Storage. Advanced Energy Materials, 1(3), 394-400.
Li, X., Zhang, H., Mai, Z., Zhang, H., Vankelecom, I. (2011). Ion exchange membranes
for vanadium redox flow battery (VRB) applications. Energy & Environmental
Science, 4(4), 1147-1160.
Liang, H., Li, H., Wang, Z., Wu, F., Chen, L., Huang, X. (2001). New Binary Room-
Temperature Molten Salt Electrolyte Based on Urea and LiTFSI. The Journal
of Physical Chemistry B, 105(41), 9966-9969.
Lim, H. S., Lackner, A. M., Knechtli, R. C. (1977). Zinc-Bromine Secondary Battery.
Journal of The Electrochemical Society, 124(8), 1154-1157.
Liming, H. (2009). Financing rural renewable energy: A comparison between China and
India. Renewable and Sustainable Energy Reviews, 13(5), 1096-1103.
Lindberg, D., de la Fuente Revenga, M., Widersten, M. (2010). Deep eutectic solvents
(DESs) are viable cosolvents for enzyme-catalyzed epoxide hydrolysis.
Journal of Biotechnology, 147, 169-171.
Lipsztajn, M., Osteryoung, R. A. (1985). Electrochemistry in neutral ambient-
temperature ionic liquids. 1. Studies of iron(III), neodymium(III), and
lithium(I). Inorganic Chemistry, 24(5), 716-719.
Liu, Q., Shinkle, A. A., Li, Y., Monroe, C. W., Thompson, L. T., Sleightholme, A. E. S.
(2010). Non-aqueous chromium acetylacetonate electrolyte for redox flow
batteries. Electrochemistry Communications, 12(11), 1634-1637.
Liu, Q., Sleightholme, A. E. S., Shinkle, A. A., Li, Y., Thompson, L. T. (2009). Non-
aqueous vanadium acetylacetonate electrolyte for redox flow batteries.
Electrochemistry Communications, 11(12), 2312-2315.
Lloyd, D., Vainikka, T., Kontturi, K. s. (2013a). The development of an all copper
hybrid redox flow battery using deep eutectic solvents. Electrochimica Acta,
100(0), 18-23.
Lloyd, D., Vainikka, T., Murtomaki, L., Kontturi, K., Ahlberg, E. (2011). The kinetics
of the Cu2+/Cu+ redox couple in deep eutectic solvents. Electrochimica Acta,
56(14), 4942-4948.
Lloyd, D., Vainikka, T., Ronkainen, M., Kontturi, K. s. (2013b). Characterisation and
application of the Fe(II)/Fe(III) redox reaction in an ionic liquid analogue.
Electrochimica Acta, 109(0), 843-851.
Lockett, V., Sedev, R., Ralston, J., Horne, M., Rodopoulos, T. (2008). Differential
Capacitance of the Electrical Double Layer in Imidazolium-Based Ionic
Liquids:  Influence of Potential, Cation Size, and Temperature. The
Journal of Physical Chemistry C, 112(19), 7486-7495.
143
Low, C. T. J., Walsh, F. C., Chakrabarti, M. H., Hashim, M. A., Hussain, M. A. (2013).
Electrochemical approaches to the production of graphene flakes and their
potential applications. Carbon, 54(0), 1-21.
Lu, W., Qu, L., Henry, K., Dai, L. (2009). High performance electrochemical capacitors
from aligned carbon nanotube electrodes and ionic liquid electrolytes. Journal
of Power Sources, 189(2), 1270-1277.
Lu, X., Burrell, G., Separovic, F., Zhao, C. (2012). Electrochemistry of Room
Temperature Protic Ionic Liquids: A Critical Assessment for Use as
Electrolytes in Electrochemical Applications. The Journal of Physical
Chemistry B, 116(30), 9160-9170.
Lund, H., Mathiesen, B. V. (2009). Energy system analysis of 100% renewable energy
systems-The case of Denmark in years 2030 and 2050. Energy, 34(5), 524-531.
MacFarlane, D. R., Forsyth, M., Howlett, P. C., Pringle, J. M., Sun, J., Annat, G., et al.
(2007). Ionic Liquids in Electrochemical Devices and Processes: Managing
Interfacial Electrochemistry. Accounts of Chemical Research, 40(11), 1165-
1173.
MacFarlane, D. R., Forsyth, M., Izgorodina, E. I., Abbott, A. P., Annat, G., Fraser, K.
(2009). On the concept of ionicity in ionic liquids. Physical Chemistry
Chemical Physics, 11(25), 4962-4967.
MacFarlane, D. R., Meakin, P., Sun, J., Amini, N., Forsyth, M. (1999). Pyrrolidinium
Imides: A New Family of Molten Salts and Conductive Plastic Crystal Phases.
The Journal of Physical Chemistry B, 103(20), 4164-4170.
Mai, Z., Zhang, H., Li, X., Bi, C., Dai, H. (2011). Sulfonated poly(tetramethydiphenyl
ether ether ketone) membranes for vanadium redox flow battery application.
Journal of Power Sources, 196(1), 482-487.
Marques, A. n. C., Fuinhas, J. A. (2011). Drivers promoting renewable energy: A
dynamic panel approach. Renewable and Sustainable Energy Reviews, 15(3),
1601-1608.
Martino, W., de la Mora, J. F., Yoshida, Y., Saito, G., Wilkes, J. (2006). Surface tension
measurements of highly conducting ionic liquids. Green Chemistry, 8(4), 390-
397.
Matsuda, Y., Tanaka, K., Okada, M., Takasu, Y., Morita, M., Matsumura-Inoue, T.
(1988). A rechargeable redox battery utilizing ruthenium complexes with non-
aqueous organic electrolyte. Journal of Applied Electrochemistry, 18(6), 909-
914.
McCluskey, A., Geoffrey, A. L., Sarah, K. L., Michael, P. O., Ian, C. H. (2002). Ionic
Liquids and Metal Ions: From Green Chemistry to Ore Refining. In Ionic
Liquids (Vol. 818, pp. 199-212): American Chemical Society.
McEwen, A. B., McDevitt, S. F., Koch, V. R. (1997). Nonaqueous Electrolytes for
Electrochemical Capacitors: Imidazolium Cations and Inorganic Fluorides with
Organic Carbonates. Journal of The Electrochemical Society, 144(4), L84-L86.
McHale, G., Hardacre, C., Ge, R., Doy, N., Allen, R. W. K., MacInnes, J. M., et al.
(2008). Density-Viscosity Product of Small-Volume Ionic Liquid Samples
Using Quartz Crystal Impedance Analysis. Analytical Chemistry, 80(15), 5806-
5811.
144
Menne, S., Pires, J., Anouti, M., Balducci, A. (2013). Protic ionic liquids as electrolytes
for lithium-ion batteries. Electrochemistry Communications, 31(0), 39-41.
Mohammadi, T., Skyllas-Kazacos, M. (1995). Preparation of sulfonated composite
membrane for vanadium redox flow battery applications. Journal of Membrane
Science, 107(1-2), 35-45.
Montanino, M., Moreno, M., Alessandrini, F., Appetecchi, G. B., Passerini, S., Zhou,
Q., et al. (2012). Physical and electrochemical properties of binary ionic liquid
mixtures: (1-x) PYR14TFSI-(x) PYR14IM14. Electrochimica Acta, 60(0), 163-
169.
Morrison, H. G., Sun, C. C., Neervannan, S. (2009). Characterization of thermal
behavior of deep eutectic solvents and their potential as drug solubilization
vehicles. International Journal of Pharmaceutics, 378, 136-139.
Nagy, L., Gyetvai, G., Kollar, L., Nagy, G. (2006). Electrochemical behavior of
ferrocene in ionic liquid media. Journal of Biochemical and Biophysical
Methods, 69(1-2), 121-132.
Nakamoto, H., Watanabe, M. (2007). Bronsted acid-base ionic liquids for fuel cell
electrolytes. Chemical Communications(24), 2539-2541.
Nanjundiah, C., Osteryoung, R. A. (1983). Electrochemical Studies of Cu(I) and Cu(II)
in an Aluminum Chloride-N-(n-Butyl)Pyridinium Chloride Ionic Liquid.
Journal of The Electrochemical Society, 130(6), 1312-1318.
Nanjundiah, C., Shimizu, K., Osteryoung, R. A. (1982). Electrochemical Studies of
Fe(II) and Fe(III) in an Aluminum Chloride-Butylpyridinium Chloride Ionic
Liquid. Journal of The Electrochemical Society, 129(11), 2474-2480.
Negro, S. O., Alkemade, F., Hekkert, M. P. (2012). Why does renewable energy diffuse
so slowly? A review of innovation system problems. Renewable and
Sustainable Energy Reviews, 16(6), 3836-3846.
Nicholson, R. S. (1965). Theory and Application of Cyclic Voltammetry for
Measurement of Electrode Reaction Kinetics. Analytical Chemistry, 37(11),
1351-1355.
Nkuku, C. A., Lesuer, R. J. (2007). Electrochemistry in Deep Eutectic Solvents. The
Journal of Physical Chemistry B, 111(46), 13271-13277.
Nuli, Y., Yang, J., Wang, J., Xu, J., Wang, P. (2005). Electrochemical Magnesium
Deposition and Dissolution with High Efficiency in Ionic Liquid.
Electrochemical and Solid-State Letters, 8(11), C166-C169.
O'Donnell, P.M., R.F. Gahn, and J.L. Pfeiffer, The Redox Flow System for Solar
Photovoltaic Energy Storage, N.T. 73562, Editor. 1976: Lewis Research
Center.
O'Mahony, A. M., Silvester, D. S., Aldous, L., Hardacre, C., Compton, R. G. (2008).
Effect of Water on the Electrochemical Window and Potential Limits of Room-
Temperature Ionic Liquids. Journal of Chemical & Engineering Data, 53(12),
2884-2891.
Ong, S. P., Andreussi, O., Wu, Y., Marzari, N., Ceder, G. (2011). Electrochemical
Windows of Room-Temperature Ionic Liquids from Molecular Dynamics and
Density Functional Theory Calculations. Chemistry of Materials, 23(11), 2979-
2986.
145
Oriji, G., Katayama, Y., Miura, T. (2004). Investigation on V(IV)/V(V) species in a
vanadium redox flow battery. Electrochimica Acta, 49(19), 3091-3095.
Oriji, G., Katayama, Y., Miura, T. (2005). Investigations on V(IV)/V(V) and
V(II)/V(III) redox reactions by various electrochemical methods. Journal of
Power Sources, 139(1-2), 321-324.
Padilha, J. C., Basso, J., da Trindade, L. G., Martini, E. M. A., de Souza, M. O., de
Souza, R. F. (2010). Ionic liquids in proton exchange membrane fuel cells:
Efficient systems for energy generation. Journal of Power Sources, 195(19),
6483-6485.
Palacin, M. R. (2009). Recent advances in rechargeable battery materials: a chemist's
perspective. Chemical Society Reviews, 38(9), 2565-2575.
Pang, K., Hou, Y., Wu, W., Guo, W., Peng, W., Marsh, K. N. (2012). Efficient
separation of phenols from oils via forming deep eutectic solvents. Green
Chemistry, 14(9), 2398-2401.
Panwar, N. L., Kaushik, S. C., Kothari, S. (2011). Role of renewable energy sources in
environmental protection: A review. Renewable and Sustainable Energy
Reviews, 15(3), 1513-1524.
Paulenova, A., Creager, S. E., Navratil, J. D., Wei, Y. (2002). Redox potentials and
kinetics of the Ce3+/Ce4+ redox reaction and solubility of cerium sulfates in
sulfuric acid solutions. Journal of Power Sources, 109(2), 431-438.
Plechkova, N. V., Seddon, K. R. (2008). Applications of ionic liquids in the chemical
industry. Chemical Society Reviews, 37(1), 123-150.
Ponce de Leon, C., Frías-Ferrer, A., González-García, J., Szánto, D. A., Walsh, F. C.
(2006). Redox flow cells for energy conversion. Journal of Power Sources,
160(1), 716-732.
Posner, A. M. (1955) Redox fuel cell. Fuel, 34, 330–338.
Pratt , H. D., Leonard, J. C., Steele, L. A. M., Staiger, C. L., Anderson, T. M. (2013).
Copper ionic liquids: Examining the role of the anion in determining physical
and electrochemical properties. Inorganica Chimica Acta, 396(0), 78-83.
Pratt H. D., Rose, A. J., Staiger, C. L., Ingersoll, D., Anderson, T. M. (2011). Synthesis
and characterization of ionic liquids containing copper, manganese, or zinc
coordination cations. Dalton Transactions, 40(43), 11396-11401.
Price, A., Bartley, S., Male, S., Cooley, G. (1999). A novel approach to utility scale
energy storage [regenerative fuel cells]. Power Engineering Journal, 13(3),
122-129.
Quinn, B. M., Ding, Z., Moulton, R., Bard, A. J. (2002). Novel Electrochemical Studies
of Ionic Liquids. Langmuir, 18(5), 1734-1742.
Rahman, F., Skyllas-Kazacos, M. (2009). Vanadium redox battery: Positive half-cell
electrolyte studies. Journal of Power Sources, 189(2), 1212-1219.
Rahman, F., Skyllas-Kazacos, M. (1998). Solubility of vanadyl sulfate in concentrated
sulfuric acid solutions. Journal of Power Sources, 72(2), 105-110.
Randles, J. E. B. (1948). A cathode ray polarograph. Part II.-The current-voltage curves.
Transactions of the Faraday Society, 44, 327-338.
146
Rauter, A. l. P., Vogel, P., Queneau, Y., Chiappe, C., Marra, A., Mele, A. (2010).
Synthesis and Applications of Ionic Liquids Derived from Natural Sugars. In
Carbohydrates in Sustainable Development II (Vol. 295, pp. 177-195):
Springer Berlin Heidelberg.
Rezaei, B., Mallakpour, S., Taki, M. (2009). Application of ionic liquids as an
electrolyte additive on the electrochemical behavior of lead acid battery.
Journal of Power Sources, 187(2), 605-612.
Rogers, E. I., Silvester, D. S., Poole, D. L., Aldous, L., Hardacre, C., Compton, R. G.
(2008). Voltammetric Characterization of the Ferrocene|Ferrocenium and
Cobaltocenium|Cobaltocene Redox Couples in RTILs. The Journal of Physical
Chemistry C, 112(7), 2729-2735.
Rub, C., Konig, B. (2012). Low melting mixtures in organic synthesis - an alternative to
ionic liquids? Green Chemistry, 14(11), 2969-2982.
Rychcik, M., Skyllas-Kazacos, M. (1988). Characteristics of a new all-vanadium redox
flow battery. Journal of Power Sources, 22(1), 59-67.
S. Eckroad, Technical Report, EPRI-1014836, Electric Power Research Institute, Palo
Alto, CA, USA, 2007.
Sahir, M. H., Qureshi, A. H. (2008). Assessment of new and renewable energy
resources potential and identification of barriers to their significant utilization
in Pakistan. Renewable and Sustainable Energy Reviews, 12(1), 290-298.
Sanchez, L. G., Espel, J. R., Onink, F., Meindersma, G. W., Haan, A. B. d. (2009).
Density, Viscosity, and Surface Tension of Synthesis Grade Imidazolium,
Pyridinium, and Pyrrolidinium Based Room Temperature Ionic Liquids.
Journal of Chemical & Engineering Data, 54(10), 2803-2812.
Sato, T., Maruo, T., Marukane, S., Takagi, K. (2004). Ionic liquids containing carbonate
solvent as electrolytes for lithium ion cells. Journal of Power Sources, 138(1-
2), 253-261.
Sato, T., Masuda, G., Takagi, K. (2004). Electrochemical properties of novel ionic
liquids for electric double layer capacitor applications. Electrochimica Acta,
49(21), 3603-3611.
Savinell, R. F., Liu, C. C., Galasco, R. T., Chiang, S. H., Coetzee, J. F. (1979).
Discharge Characteristics of a Soluble Iron-Titanium Battery System. Journal
of The Electrochemical Society, 126(3), 357-360.
Scordilis-Kelley, C., Fuller, J., Carlin, R. T., Wilkes, J. S. (1992). Alkali Metal
Reduction Potentials Measured in Chloroaluminate Ambient-Temperature
Molten Salts. Journal of The Electrochemical Society, 139(3), 694-699.
Sekhon, S. S., Krishnan, P., Singh, B., Yamada, K., Kim, C. S. (2006). Proton
conducting membrane containing room temperature ionic liquid.
Electrochimica Acta, 52(4), 1639-1644.
Shahbaz, K., Baroutian, S., Mjalli, F. S., Hashim, M. A., AlNashef, I. M. (2012a).
Densities of ammonium and phosphonium based deep eutectic solvents:
Prediction using artificial intelligence and group contribution techniques.
Thermochimica Acta. 527, 59–66.
Shahbaz, K., Mjalli, F. S., Hashim, M. A., AlNashef, I. M. (2010). Using deep eutectic
solvents for the removal of glycerol from palm-oil based biodiesel. Journal of
applied sciences. 10 (24), 3349–3354.
147
Shahbaz, K., Mjalli, F. S., Hashim, M. A., AlNashef, I. M. (2011). Using Deep Eutectic
Solvents Based on Methyl Triphenyl Phosphunium Bromide for the Removal
of Glycerol from Palm-Oil-Based Biodiesel. Energy & Fuels, 25(6), 2671-
2678.
Shahbaz, K., Mjalli, F. S., Hashim, M. A., AlNashef, I. M. (2011c). Prediction of deep
eutectic solvents densities at different temperatures. Thermochimica Acta. 515,
67–72.
Shan, C., Li, F., Yuan, F., G.Yang, L.Niu, Zhang, Q. (2008). Size-controlled synthesis
of monodispersed gold nanoparticles stabilized by polyelectrolyte-
functionalized ionic liquid. Nanotechnology, 19(28), 285601.
Sheikh, M. A. (2010). Energy and renewable energy scenario of Pakistan. Renewable
and Sustainable Energy Reviews, 14(1), 354-363.
Sheldon, R. A., Lau, R. M., Sorgedrager, F., Rantwijk, K. V., Seddon, K. R. (2002).
Biocatalysis in ionic liquids. Green Chemistry. 4, 147–151.
Shiddiky, M. J. A., Torriero, A. A. J. (2011). Application of ionic liquids in
electrochemical sensing systems. Biosensors and Bioelectronics, 26(5), 1775-
1787.
Shinkle, A. A., Pomaville, T. J., Sleightholme, A. E. S., Thompson, L. T., Monroe, C.
W. (2014). Solvents and supporting electrolytes for vanadium acetylacetonate
flow batteries. Journal of Power Sources, 248, 1299-1305.
Shinkle, A. A., Sleightholme, A. E. S., Griffith, L. D., Thompson, L. T., Monroe, C. W.
(2012). Degradation mechanisms in the non-aqueous vanadium acetylacetonate
redox flow battery. Journal of Power Sources, 206(0), 490-496.
Shoup, D., Szabo, A. (1982). Chronoamperometric current at finite disk electrodes.
Journal of Electroanalytical Chemistry and Interfacial Electrochemistry,
140(2), 237-245.
Skyllas-Kazacos M.Vanadium/polyhalideredox flow battery.US Patent 7320844; 2008.
Skyllas-Kazacos, M. (2003). Novel vanadium chloride/polyhalide redox flow battery.
Journal of Power Sources, 124(1), 299-302.
Skyllas-Kazacos, M., Chakrabarti, M. H., Hajimolana, S. A., Mjalli, F. S., Saleem, M.
(2011). Progress in Flow Battery Research and Development. Journal of The
Electrochemical Society, 158(8), R55-R79.
Skyllas-Kazacos, M., Kasherman, D., Hong, D. R., Kazacos, M. (1991). Characteristics
and performance of 1 kW UNSW vanadium redox battery. Journal of Power
Sources, 35(4), 399-404.
Skyllas-Kazacos, M., Kazacos, G., Poon, G., Verseema, H. (2010). Recent advances
with UNSW vanadium-based redox flow batteries. International Journal of
Energy Research, 34(2), 182-189.
Skyllas-Kazacos, M., Menictas, C., Kazacos, M. (1996). Thermal Stability of
Concentrated V(V) Electrolytes in the Vanadium Redox Cell. Journal of The
Electrochemical Society, 143(4), L86-L88.
Skyllas-Kazacos, M., Rychcik, M., Robins, R., Fane, A., Green, M. (1986). New all-
vanadium redox flow cell. Journal of The Electrochemical Society, 133(5),
1057-1058.

148
Sleightholme, A. E. S., Shinkle, A. A., Liu, Q., Li, Y., Monroe, C. W., Thompson, L. T.
(2011). Non-aqueous manganese acetylacetonate electrolyte for redox flow
batteries. Journal of Power Sources, 196(13), 5742-5745.
Snook, G. A., Best, A. S., Pandolfo, A. G., Hollenkamp, A. F. (2006). Evaluation of a
Ag/Ag+ reference electrode for use in room temperature ionic liquids.
Electrochemistry Communications, 8(9), 1405-1411.
Soloveichik, G. L. (2011). Battery Technologies for Large-Scale Stationary Energy
Storage. Annual Review of Chemical and Biomolecular Engineering, 2(1), 503-
527.
Steichen, M., Thomassey, M., Siebentritt, S., Dale, P. J. (2011). Controlled
electrodeposition of Cu-Ga from a deep eutectic solvent for low cost
fabrication of CuGaSe2 thin film solar cells. Physical Chemistry Chemical
Physics, 13(10), 4292-4302.
Strubinger, S. K. D., Sun, I. W., Cleland, W. E., Hussey, C. L. (1990). Electrochemical
and spectroscopic studies of rhenium(IV) monomeric and dimeric chloride
complexes in the basic aluminum chloride-1-methyl-3-ethylimidazolium
chloride room-temperature molten salt. Inorganic Chemistry, 29(21), 4246-
4252.
Suarez, P. A. Z., Einloft, S., Dullius, J. E. L., de Souza, R. F., Dupont, J. (1998).
Synthesis and physical-chemical properties of ionic liquids based on 1-$n$-
butyl-3-methylimidazolium cation. J. Chim. Phys., 95(7), 1626-1639.
Suarez, P. A. Z., Selbach, V. n. M., Dullius, J. E. L., Einloft, S., Piatnicki, C. M. S.,
Azambuja, D. S., et al. (1997). Enlarged electrochemical window in dialkyl-
imidazolium cation based room-temperature air and water-stable molten salts.
Electrochimica Acta, 42(16), 2533-2535.
Sukkar, T., Skyllas-Kazacos, M. (2003). Water transfer behaviour across cation
exchange membranes in the vanadium redox battery. Journal of Membrane
Science, 222(1-2), 235-247.
Sum, E., Rychcik, M., Skyllas-kazacos, M. (1985). Investigation of the V(V)/V(IV)
system for use in the positive half-cell of a redox battery. Journal of Power
Sources, 16(2), 85-95.
Sum, E., Skyllas-Kazacos, M. (1985). A study of the V(II)/V(III) redox couple for
redox flow cell applications. Journal of Power Sources, 15(2-3), 179-190.
Sun, B., Skyllas-Kazakos, M. (1991). Chemical modification and electrochemical
behaviour of graphite fibre in acidic vanadium solution. Electrochimica Acta,
36(3-4), 513-517.
Sun, I. W., Hussey, C. L. (1989). Electrochemistry of niobium chloride and oxide
chloride complexes in the basic aluminum chloride-1-methyl-3-
ethylimidazolium chloride room-temperature ionic liquid. Inorganic
Chemistry, 28(14), 2731-2737.
Susan, M. A. B. H., Noda, A., Mitsushima, S., Watanabe, M. (2003). Bronsted acid-
base ionic liquids and their use as new materials for anhydrous proton
conductors. Chemical Communications(8), 938-939.
Tang, B., Row, K. (2013). Recent developments in deep eutectic solvents in chemical
sciences. Monatshefte fur Chemie - Chemical Monthly, 144(10), 1427-1454.

149
Tang, S., Baker, G. A., Zhao, H. (2012). Ether- and alcohol-functionalized task-specific
ionic liquids: attractive properties and applications. Chemical Society Reviews,
41(10), 4030-4066.
Tatumi, R., Fujihara, H. (2005). Remarkably stable gold nanoparticles functionalized
with a zwitterionic liquid based on imidazolium sulfonate in a high
concentration of aqueous electrolyte and ionic liquid. Chemical
Communications(1), 83-85.
Thaller L. H. ( 1974). Electrically rechargeable redox flow cells. Proc. Ninth Intersoc.
Energy Conv. Eng. Conf., San Francisco, CA, August 26 - 30 , pp. 924 – 928.
NASATMX-71540.
Torriero, A. A. J., Sunarso, J., Howlett, P. C. (2012). Critical evaluation of reference
systems for voltammetric measurements in ionic liquids. Electrochimica Acta,
82, 60-68.
Tsierkezos, N. (2007). Cyclic Voltammetric Studies of Ferrocene in Nonaqueous
Solvents in the Temperature Range from 248.15 to 298.15 K. Journal of
Solution Chemistry, 36(3), 289-302.
Tsuda, I., Nozaki, K., Sakuta, K., Kurokawa, K. (1997). Improvement of performance in
redox flow batteries for PV systems. Solar Energy Materials and Solar Cells,
47(1-4), 101-107.
Tsunashima, K., Sugiya, M. (2007). Physical and electrochemical properties of low-
viscosity phosphonium ionic liquids as potential electrolytes. Electrochemistry
75, 734–736.
Ue, M., Takeda, M., Toriumi, A., Kominato, A., Hagiwara, R., Ito, Y. (2003).
Application of Low-Viscosity Ionic Liquid to the Electrolyte of Double-Layer
Capacitors. Journal of The Electrochemical Society, 150(4), A499-A502.
Vafiadis, H., Skyllas-Kazacos, M. (2006). Evaluation of membranes for the novel
vanadium bromine redox flow cell. Journal of Membrane Science, 279(1-2),
394-402.
Wadia, C., Albertus, P., Srinivasan, V. (2011). Resource constraints on the battery
energy storage potential for grid and transportation applications. Journal of
Power Sources, 196(3), 1593-1598.
Waligora, L., Lewandowski, A., Gritzner, G. (2009). Electrochemical studies of four
organometallic redox couples as possible reference redox systems in 1-ethyl-3-
methylimidazolium tetrafluoroborate. Electrochimica Acta, 54(5), 1414-1419.
Wandschneider, F. T., Rohm, S., Fischer, P., Pinkwart, K., Tubke, J., & Nirschl, H.
(2014). A multi-stack simulation of shunt currents in vanadium redox flow
batteries. Journal of Power Sources, 261, 64-74.
Wang, P., Wenger, B., Humphry-Baker, R., Moser, J.-E., Teuscher, J. l., Kantlehner,
W., et al. (2005). Charge Separation and Efficient Light Energy Conversion in
Sensitized Mesoscopic Solar Cells Based on Binary Ionic Liquids. Journal of
the American Chemical Society, 127(18), 6850-6856.
Wang, P., Zakeeruddin, S. M., Humphry-Baker, R., Gratzel, M. (2004). A Binary Ionic
Liquid Electrolyte to Achieve ≥7% Power Conversion Efficiencies in Dye-
Sensitized Solar Cells. Chemistry of Materials, 16(14), 2694-2696.

150
Wang, P., Zakeeruddin, S. M., Moser, J.-E., Gratzel, M. (2003). A New Ionic Liquid
Electrolyte Enhances the Conversion Efficiency of Dye-Sensitized Solar Cells.
The Journal of Physical Chemistry B, 107(48), 13280-13285.
Wasserscheid, P., Hal, R. V., Bösmann, A. (2002). 1-n-butyl-3-methylimidazolium
([bmim]) octylsulfatean even ‗greener‘ ionic liquid. Green Chemistry. 4, 400–
404.
Wasserscheid, P., Keim, W. (2000). Ionic Liquids—New ―solutions‖ for transition
metal catalysis. Angewandte Chemie International Edition. 39, 3773–3789.
Watt-Smith, M. J., Ridley, P., Wills, R. G. A., Shah, A. A., Walsh, F. C. (2013). The
importance of key operational variables and electrolyte monitoring to the
performance of an all vanadium redox flow battery. Journal of Chemical
Technology & Biotechnology, 88(1), 126-138.
Weber, A., Mench, M., Meyers, J., Ross, P., Gostick, J., Liu, Q. (2011). Redox flow
batteries: a review. Journal of Applied Electrochemistry, 41(10), 1137-1164.
Wei, D., Ivaska, A. (2008). Applications of ionic liquids in electrochemical sensors.
Analytica Chimica Acta, 607(2), 126-135.
Wen, Y. H., Zhang, H. M., Qian, P., Zhou, H. T., Zhao, P., Yi, B. L., et al. (2006). A
study of the Fe(III)/Fe(II)-triethanolamine complex redox couple for redox
flow battery application. Electrochimica Acta, 51(18), 3769-3775.
Whitehead, J. A., Lawrance, G. A., McCluskey, A. (2004). Green leaching: recyclable
and selective leaching of gold-bearing ore in an ionic liquid. Green Chemistry,
6(7), 313-315.
Wiedemann, E., Heintz, A., Lichtenthaler, R. N. (1998). Transport properties of
vanadium ions in cation exchange membranes: Determination of diffusion
coefficients using a dialysis cell. Journal of Membrane Science, 141(2), 215-
221.
Wiley: Weinheim, Germany; p 387.
Wilkes, J. S. (2004). Properties of ionic liquid solvents for catalysis. Journal of
Molecular Catalysis A: Chemical, 214(1), 11-17.
Wilkes, J. S., Levisky, J. A., Wilson, R. A., Hussey, C. L. (1982). Dialkylimidazolium
chloroaluminate melts: a new class of room-temperature ionic liquids for
electrochemistry, spectroscopy and synthesis. Inorganic Chemistry. 21, 1263–
1264.
Wilkes, J. S., Zaworotko, M. J. (1992). Air and water stable 1-ethyl-3-
methylimidazolium based ionic liquids. Journal of the Chemical Society,
Chemical Communications. 965–967.
Wu, T. Y., Su, S. G., Gung, S. T., Lin, M. W., Lin, Y. C., Ou-Yang, W. C., et al.
(2011). Synthesis and characterization of protic ionic liquids containing cyclic
amine cations and tetrafluoroborate anion. Journal of the Iranian Chemical
Society, 8(1), 149-165.
Wu, T.-Y., Su, S.-G., Wang, H. P., Sun, I. W. (2011). Glycine-based ionic liquids as
potential electrolyte for electrochemical studies of organometallic and organic
redox couples. Electrochemistry Communications, 13(3), 237-241.
Wu, X., Angell, C. A. (2003). Solvent-Free Electrolytes with Aqueous Solution-Like
Conductivities. Science, 302, 422-425.

151
Wu, X., Xu, H., Xu, P., Shen, Y., Lu, L., Shi, J. (2014). Microwave-treated graphite felt
as the positive electrode for all-vanadium redox flow battery. Journal of Power
Sources, 263, 104-109.
Xia, X., Liu, H.-T., & Liu, Y. (2002). Studies of the Feasibility of a Ce4+
/Ce3+
V2+
/V3+
Redox Cell. Journal of The Electrochemical Society, 149(4), A426-
A430.
Xue, F.-Q., Wang, Y.-L., Wang, W.-H., Wang, X.-D. (2008). Investigation on the
electrode process of the Mn(II)/Mn(III) couple in redox flow battery.
Electrochimica Acta, 53(22), 6636-6642.
Yamagata, M., Katayama, Y., Miura, T. (2006). Electrochemical Behavior of
Samarium, Europium, and Ytterbium in Hydrophobic Room-Temperature
Molten Salt Systems. Journal of The Electrochemical Society, 153(1), E5-E9.
Yamagata, M., Tachikawa, N., Katayama, Y., Miura, T. (2007). Electrochemical
behavior of several iron complexes in hydrophobic room-temperature ionic
liquids. Electrochimica Acta, 52(9), 3317-3322.
Yamamura, T., Shiokawa, Y., Yamana, H., Moriyama, H. (2002). Electrochemical
investigation of uranium β-diketonates for all-uranium redox flow battery.
Electrochimica Acta, 48(1), 43-50.
Yang, Z., Zhang, J., Kintner-Meyer, M. C. W., Lu, X., Choi, D., Lemmon, J. P., et al.
(2011). Electrochemical Energy Storage for Green Grid. Chemical Reviews,
111(5), 3577-3613.
Ye, H., Huang, J., Xu, J. J., Kodiweera, N. K. A. C., Jayakody, J. R. P., Greenbaum, S.
G. (2008). New membranes based on ionic liquids for PEM fuel cells at
elevated temperatures. Journal of Power Sources, 178(2), 651-660.
Yoshida, Y., Baba, O., Saito, G. (2007). Ionic Liquids Based on Dicyanamide
Anion:  Influence of Structural Variations in Cationic Structures on Ionic
Conductivity†The Journal of Physical Chemistry B, 111(18), 4742-4749.
Yufit, V., Hale, B., Matian, M., Mazur, P., Brandon, N. P. (2013). Development of a
Regenerative Hydrogen-Vanadium Fuel Cell for Energy Storage Applications.
Journal of The Electrochemical Society, 160(6), A856-A861.
Yuyama, K., Masuda, G., Yoshida, H., Sato, T. (2006). Ionic liquids containing the
tetrafluoroborate anion have the best performance and stability for electric
double layer capacitor applications. Journal of Power Sources, 162(2), 1401-
1408.
Zhang, D., Liu, Q., Shi, X., Li, Y. (2012). Tetrabutylammonium hexafluorophosphate
and 1-ethyl-3-methyl imidazolium hexafluorophosphate ionic liquids as
supporting electrolytes for non-aqueous vanadium redox flow batteries.
Journal of Power Sources, 203(0), 201-205.
Zhang, H., Shen, P. K. (2012). Recent Development of Polymer Electrolyte Membranes
for Fuel Cells. Chemical Reviews, 112(5), 2780-2832.
Zhang, H., Zhang, H., Li, X., Mai, Z., Zhang, J. (2011). Nanofiltration (NF)
membranes: the next generation separators for all vanadium redox flow
batteries (VRBs)? Energy & Environmental Science, 4(5), 1676-1679.
Zhang, J., Bond, A. M., Belcher, W. J., Wallace, K. J., Steed, J. W. (2003).
Electrochemical Studies on the Modular Podand 1,3,5-Tris(3-
((ferrocenylmethyl)amino)pyridiniumyl)-2,4,6-triethylbenzene

152
Hexafluorophosphate in Conventional Solvents and Ionic Liquids. The Journal
of Physical Chemistry B, 107(24), 5777-5786.
Zhang, Q., De Oliveira Vigier, K., Royer, S., Jerome, F. (2012). Deep eutectic solvents:
syntheses, properties and applications. Chemical Society Reviews, 41(21),
7108-7146.
Zhang, S., Sun, N., He, X., Lu, X., Zhang, X. (2006). Physical Properties of Ionic
Liquids: Database and Evaluation. Journal of Physical and Chemical
Reference Data, 35(4), 1475-1517.
Zhao, C., Burrell, G., Torriero, A. A. J., Separovic, F., Dunlop, N. F., MacFarlane, D.
R., Bond, A. (2008). Electrochemistry of room temperature protic ionic liquids.
The Journal of Physical Chemistry B, 112(23), 6923-6936.
Zhao, C., Burrell, G., Torriero, A. A. J., Separovic, F., Dunlop, N. F., MacFarlane, D.
R. (2008). Electrochemistry of Room Temperature Protic Ionic Liquids. The
Journal of Physical Chemistry B, 112(23), 6923-6936.
Zhao, H., Baker, G. A. (2012). Ionic liquids and deep eutectic solvents for biodiesel
synthesis: a review. Journal of Chemical Technology & Biotechnology, 88(1),
3-12.
Zhao, H., Baker, G. A. (2013). Ionic liquids and deep eutectic solvents for biodiesel
synthesis: a review. Journal of Chemical Technology & Biotechnology, 88(1),
3-12.
Zhao, H., Baker, G. A., Holmes, S. (2011). New eutectic ionic liquids for lipase
activation and enzymatic preparation of biodiesel. Organic & Biomolecular
Chemistry, 9(6), 1908-1916.
Zhao, P., Zhang, H., Zhou, H., Chen, J., Gao, S., Yi, B. (2006). Characteristics and
performance of 10 kW class all-vanadium redox-flow battery stack. Journal of
Power Sources, 162(2), 1416-1420.
Zhao, P., Zhang, H., Zhou, H., Yi, B. (2005). Nickel foam and carbon felt applications
for sodium polysulfide/bromine redox flow battery electrodes. Electrochimica
Acta, 51(6), 1091-1098.
Zhou, Z.-B., Takeda, M., Ue, M. (2004). New hydrophobic ionic liquids based on
perfluoroalkyltrifluoroborate anions. Journal of Fluorine Chemistry, 125(3),
471-476.
153
List of Publications and Papers Presented
Journal papers
1- The electrochemical behaviour of ferrocene in deep eutectic solvents based on
quaternary ammonium and phosphonium salts. Laleh Bahadori, Ninie Suhana
Abdul Manan, Mohammed Harun Chakrabarti, Mohd. Ali Hashim, Farouq
Sabri Mjalli, Inas Muen AlNashef, Mohd. Azlan Hussain , Chee Tong John
Low. J. Physical Chemistry Chemical Physics. 2013, 15, 1707-1714.
2- Physicochemical properties of ammonium-based deep eutectic solvents and their
electrochemical evaluation using organometallic reference redox systems. Laleh
Bahadori, Mohammed Harun Chakrabarti, Farouq Sabri Mjalli, Inas Muen
AlNashef, Ninie Suhana Abdul Manan, Mohd Ali Hashim. Electrochimica Acta,
2013, 113, 205-211.
3- Temperature effects on the kinetics of ferrocene and cobaltocenium in
methyltriphenylphosphonium bromide based deep eutectic solvents. Laleh
Bahadori, Mohammed Harun Chakrabarti, Mohd Ali Hashim, Ninie Suhana
Abdul Manan, Inas Muen AlNashef, Farouq Sabri Mjalli. Journal of The
Electrochemical Society, 2015, 162 (9) H617-H624.
4- Prospects of applying ionic liquids and deep eutectic solvents for renewable
energy storage by means of redox flow batteries. Mohammed Harun
Chakrabarti, Farouq Sabri Mjalli, Inas Muen AlNashef, Mohd. Ali Hashim,
Mohd. Azlan Hussain, Laleh Bahadori, Chee Tong John Low. Renewable and
Sustainable Energy Reviews, 2014, 30, 254-270.
5- Cyclic voltammetry of iron (III) acetylacetonate in quaternary ammonium and
phosphonium based deep eutectic solvents. Mohammed Harun Chakrabarti,
Nigel P. Brandon, Mohd. Ali Hashim, Farouq Sabri Mjalli, Inas Muen
154
AlNashef, Laleh Bahadori, Ninie Suhana Abdul Manan, Mohd. Azlan Hussain,
Vladimir Yufit. International Journal of Electrochemical Science, 2013, 8, 9652-
9676.
6- Cyclic voltammetry of metallic acetylacetonate salts in quaternary ammonium
and phosphonium based deep eutectic solvents. Mohammed Harun Chakrabarti,
Nigel P. Brandon, Farouq Sabri Mjalli, Laleh Bahadori, Inas Muen AlNashef,
Mohd. Ali Hashim, Mohd. Azlan Hussain, Chee Tong John Low, Vladimir Yufi.
Journal of Solution Chemistry, 2013, 13, 2329-2341.
7- Evaluation of deep eutectic solvents as electrolytes for a non-aqueous vanadium
redox battery. Laleh Bahadori, Mohammed Harun Chakrabarti, Ninie Suhana
Abdul Manan, Farouq Sabri Mjalli, Inas Muen AlNashef, Mohd. Ali Hashim,
Nigel P. Brandon. Journal of power sources, 2015, Under Review.
8- The effect of temperature on kinetics and diffusion coefficients of metallocene
derivatives in polyol-based deep eutectic solvents. Laleh Bahadori, Mohammed
Harun Chakrabarti, Mohd Ali Hashim, Ninie Suhana Abdul Manan, Inas Muen
AlNashef, Farouq Sabri Mjalli. PLOS ONE, 2015, Under Review.
155
Conferences
1- Electrochemical studies of ferrocene and ferrocenium ion in ammonium and
phosphonium based deep eutectic solvents. Laleh Bahadori, Ninie Suhana
Abdul Manan, Mohammed Harun Chakrabarti, Mohd. Ali Hashim, Farouq Sabri
Mjalli, Inas Muen AlNashef, Mohd. Azlan Hussain, Chee Tong John Low. The
Asia-Oceania Top University League on Engineering (AOTULE 2012), Kuala
Lumpur, Malaysia.
2- Investigation of physicochemical and electrochemical properties of
organometallic derivatives in ammonium based deep eutectic solvents. Laleh
Bahadori, Mohammed Harun Chakrabarti, Mohd Ali Hashim, Ninie Suhana
Abdul Manan, Inas Muen AlNashef, Farouq Sabri Mjalli. International
Conference on Ionic Liquids (ICIL 2013), Langkawi, Malaysia.
3- Electrochemical behaviour of metallocene in deep eutectic solvents for possible
applications as solvents for redox flow batteries. Laleh Bahadori, Seyedahmad
Hajimolana, Mohammed Harun Chakrabarti, Mohd Ali Hashim, Ninie Suhana
Abdul Manan, Inas Muen AlNashef, Farouq Sabri Mjalli. International
Conference on Ionic Liquids (ICIL 2013), Langkawi, Malaysia.
4- Electrochemical and physicochemical properties of alcohol based deep eutectic
solvents. Laleh Bahadori, Mohammed Harun Chakrabarti, Mohd Ali Hashim,
Ninie Suhana Abdul Manan, Inas Muen AlNashef, Farouq Sabri Mjalli. 4th
International congress on Green Process Engineering (GPE 2014), Seville,
Spain.
5- Electrochemical studies of non-aqueous vanadium acetylacetonate redox flow
battery in deep eutectic solvents. Laleh Bahadori, Mohammed Harun
Chakrabarti, Mohd Ali Hashim, Inas Muen AlNashef, Farouq Sabri Mjalli,

156
Ninie Suhana Abdul Manan. 19th Annual Green Chemistry & Engineering
Conference (2015 GC&E), North Bethesda, USA.
6- Evaluation of deep eutectic solvents as electrolytes for a non-aqueous vanadium
redox battery. Laleh Bahadori, Mohammed Harun Chakrabarti, Mohd Ali
Hashim, Inas Muen AlNashef, Farouq Sabri Mjalli, Ninie Suhana Abdul Manan.
2nd
International Conference on Past and Present Research systems of Green
Chemistry (Green Chemistry-2015), Orlando, USA.


