International Journal of Pure and Applied Mathematical Sciences.
ISSN 0972-9828 Volume 9, Number 2 (2016), pp. 231-245
© Research India Publications
http://www.ripublication.com
An Empirical Approach to Measure Customer
Satisfaction of Two Wheeler Users Using Six Sigma
*D.Catherine Rexy, **Dr. S.Rita and ***J.Vignesh Kumar
*Research Scholar, School of Advanced Sciences, VIT University, Vellore, India.
**Associate Professor, School of Advanced Sciences, VIT University, Vellore, India.
*** Research Associate, School of Advanced Sciences, VIT University, Vellore, India.
Abstract
The Indian automobile industry is faced with tough competition because of the
entry of many automobile companies. Customer satisfaction being the key
element for success in business has emerged as a major concern for any
industry. Six sigma is a way to measure the probability of manufacturing a
product or generating a service with zero defects. The concept of Six Sigma
introduces a new standard of measuring Defects Per Million Opportunities
(DPMO) instead of defects in percentage or in thousands of opportunities. The
objective of study is to analyse the customer satisfaction of two wheeler users
and to study the extent of preference for bikes. The data collection was
through self-prepared questionnaire using convenience sampling method. The
data was analysed using SPSS and Six Sigma tool. The result with proper
interpretation is presented.
Keywords: Six Sigma, CTQ, Opportunities, DPMO, Customer Satisfaction
INTRODUCTION
In the present competitive global educational environment, priority to the stakeholder
is absolutely obligatory for academic excellence as well as the growth of an academic
institution. The inability to satisfy all the stated and implied needs of the stakeholders
with respect to quality and employability can threaten one’s survival in the academic
arena. Just as intricately linked as the idea of stakeholder satisfaction is the concept of
operational excellence, which denotes adapting changes and reaching out for newer
and higher standards of performance. This has become the basic requirement in any
field of business and service, and education not being an exception. Six Sigma
232 D.Catherine Rexy, Dr. S.Rita, and J.Vignesh Kumar
qualityprogram provides an overall structural frame for continuous improvement in
the academic processes of an organization. Six Sigma puts the stakeholders first and
uses the facts and data to derive better solutions. This study focuses on the satisfaction
of two wheeler users using six sigma tools.
NEW ABOUT SIX SIGMA
Six Sigma is an approach radically different from traditional quality program like
ISO, Total Quality Management (TQM), Activity Based Costing (ABC), Just in Time
(JIT), etc. Because Six Sigma emphasizes on developing a disciplined practical plan
for achieving sustained tangible product excellence and overall improvement in
customer satisfaction. So far, many companies such as Motorola, IBM, General
Electric, Microsoft, etc. have successfully implemented Six Sigma and saved billions
of dollars.
The concept of Six Sigma introduces a new standard of measuring Defects Per
Million Opportunities (DPMO) instead of defects in percentage or in thousands of
opportunities. An ‘opportunity’ is defined as a possibilityof non-conformance or not
meeting the required specifications. Six sigma really helped Motorola in achieving a
breakthrough in productivity, quality, profitability, and customer satisfaction. Six
Sigma level is definitely achievable and National Aeronautics and Space
Administration (NASA) has some processes which are most critical to their missions
conforming to 7 or 8 sigma levels.
STATEMENT OF THE PROBLEM
The automobile industry in indiais facing a tough competition with the advent of
many automobile companies constantly veing with each other the attention of
consumers by introducing cutting edge features or cosmetic changes in the existing
vehicles, changing the design and model. Customer satisfaction, a key element for
success in business is a major concern for any industry. In view of the above, the
researcher has made an attempt to study the customer satisfaction of Two-Wheeler
users.
REVIEW OF LITERATURE
DhananjoyDatta (2010), The many factors which determine the buying behavior of
the consumer are thevery same factors motivating them to purchase the two-wheeler
includingadvertisement, word of mouth, references from family, friends, own
experience, features, price, etc. The survey results showed that around 51% of the
customers with two-wheelers are in the age group of 20-30 years with an income
below Rs. 5000. Around 64% people were unmarried, using Bajaj two wheelers. In
majority of the cases, the motivating factor arefriends (44%) and family (31%).
An Empirical Approach to Measure Customer Satisfaction of Two Wheeler…. 233
People also look for installment plans and finance schemes prior to purchasing a two
wheeler.
Saaravanan and Panchanatham (2009), discussed the nessicitiesfor promotion of a
product.The result showed that a customer considers all factors at the time of
purchasing a two wheeler, although majority give prominence to the brand image.
This study also brought forth the socioeconomic factors which play a key role in
decision making for the two wheeler customers and that the employed and the
students crave for showroom services.
Lisa R. Klein and Gary T. Ford (2003), It has been stated by the authors that the
customers do a cost benefit analysis while choosing a search methodology, i.e. what,
when, how much, and where to search, but the customers do not search much, due to
the perception that high search costs or the low search value. As part of pre-purchase
search for perfect automobile as per their requirements is conducted in this digital age
through the help of internet websites as well as social networking sites with
comparative study of the different models of various brands available in the market.
Hence their opinion is also influenced by the reviews of the people already possessing
and using the motorcycles.
Snelders&Schoormans (2000), Different techniques are suggested in the literature to
find out which attributes consumers use to judge products. Simonson &Tversky
(1992) Making a product different by adding even a meaningless attribute from its
competitors can increase consumers’ quality perception or can decrease perceived
risk.Aaker& Jacobson (1994) Aconsumer’s judgment about a product’s overall
excellence or superiorityis defined as perceived quality. Wallendorf (1979),However
decision while purchasing are almost solely based upon the attitude existing at the
time of purchase.
Murphy John and Bellman Eric(2008), It has been discussed that Bajaj Auto Ltd in
1948 came up with import and sale of Vespa scooters. The scope of the scooters had
decreased since the boom in the motorcycle market segment. The customers’
preferences changed the automotive strategies adopted by the Hero Honda Motor Co.
in India.
Subhadip Roy (2006) &Mohnot (2002), In his study of two and three wheelers, the
two-wheeler has become an expression of the owners' personality. The customer
while making his choice evaluates the product in terms of utility, fuel economy,
reliability, maintenance, affordability, performance, good after-sales service at
reasonable cost, availability of spare parts at economical prices, looks, safety and
comfort, and ease of riding for driving. Total sales of two-wheeler in first eight
months of 2001-02 had increased to 2.70 million units from 1.33 million units in the
corresponding period of the preceding year.
Siddhartha and Mukherjee (2002), The Study reveals that, the two-wheelers in India
are used for a variety of work such as visiting people, transporting goods, outdoor
jobs like selling and buying. In rural areas it helps people to travel more frequently to
nearby towns for their day to day needs. The two-wheeler has become a valuable
234 D.Catherine Rexy, Dr. S.Rita, and J.Vignesh Kumar
support for increasing productivity and in turn the profit, besides helping as a personal
mode of transportation.
Rajmani Singh and Yasso (2001), He also pointed out that a major part of growth in
the two-wheeler industry has come from motorcycles, which are considered fuel
efficient, reliable, and its sturdiness on rough roads. As per his study, TVS-Suzuki,
Hero Honda, and Bajaj dominate the two wheeler scene. The study also says that due
to stiff competition from automobile major Bajaj, which is the largest producer of
scooters, the LML is facing considerably stiff competition. However, dominance of
this category has been declining because of shift in customer preference towards
motorbikes.
Chandrasekaran (2009), while investigated the expectationsof the customer by careful
studing by conducting surveys on consumer behavior. The study also helps to know
various marketing variables such as price and product features. This study helped gain
knowledge about the factors that encourage a consumer leanings towards a particular
brand and the problems faced by them in the usage of such brands.
Sinha, Ajay &Wagh (2008), examined that India being one of the fastest growing
telecommunication markets of the twenty first century the common man, artisans,
agricultural labours, vendors, and workers from every walk of life are comfortably
using the services provided by telecom industries. The potential of capturing market
segment depends upon understanding the dynamics governing customer’s preference.
Annandan, Prasanna Mohan Raj,&Madhu (2007), examined the new formula of all
FMCG giants to get rich, sell to the rural,initiating marketing programs exploring the
untapped rural marketsegment. As far as FMCG is concerned, the market penetration
and consumption in rural areas is low so there is an opportunity for marketers to
penetrate the market effectively.
Rachel Dardis, HoracioSoberon-Ferrer (1994), investigated the consumer decision
making with regard to multinational, that is consumer choices were not based on a
single product attribute. Instead consumers view products as a combination of
product attributes (automobile attributes) as well as household characteristics. In both
instances, the higher the value of the Cost Index or the Trouble Index, the more
unsatisfactory the car is relative to other cars. A better educated household might be
more informed about the performance properties of Japanese cars thereby getting
attracted to the higher value reliability of these cars.
OBJECTIVES
To study the extent of preference of the bike.
To analyse the customer satisfaction of two wheeler.
An Empirical Approach to Measure Customer Satisfaction of Two Wheeler…. 235
RESEARCH METHODOLOGY
Descriptive Research Design was used to describe customer satisfaction of two
wheeler users. The study was conducted in Thanjavur District, Tamil Nadu. All the
two wheeler users in the Thanjavur District were the chosen subjects of this study.
Since the size of the population is unknown, Non-Probability sampling using
Convenience Sampling technique was adopted to collect the data. The two wheeler
users who were willing to participate in the study were the sample. The data was
collected through self-prepared questionnaire about the satisfaction of two wheeler
users. The data was analysed using Statistical Package for Social Sciences (SPSS) and
Six Sigma.
DATA ANALYSIS & INTERPRETATION
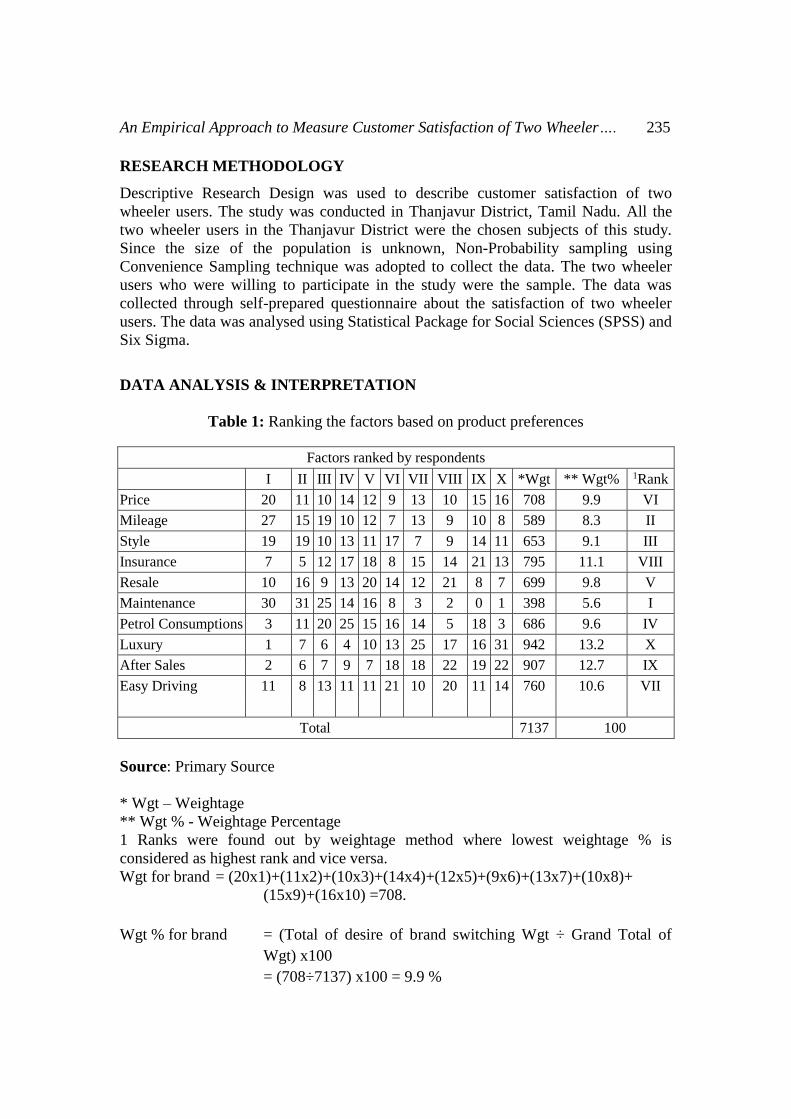
Table 1: Ranking the factors based on product preferences
Factors ranked by respondents
I II III IV V VI VII VIII IX X *Wgt ** Wgt% 1Rank
Price 20 11 10 14 12 9 13 10 15 16 708 9.9 VI
Mileage 27 15 19 10 12 7 13 9 10 8 589 8.3 II
Style 19 19 10 13 11 17 7 9 14 11 653 9.1 III
Insurance 7 5 12 17 18 8 15 14 21 13 795 11.1 VIII
Resale 10 16 9 13 20 14 12 21 8 7 699 9.8 V
Maintenance 30 31 25 14 16 8 3 2 0 1 398 5.6 I
Petrol Consumptions 3 11 20 25 15 16 14 5 18 3 686 9.6 IV
Luxury 1 7 6 4 10 13 25 17 16 31 942 13.2 X
After Sales 2 6 7 9 7 18 18 22 19 22 907 12.7 IX
Easy Driving 11 8 13 11 11 21 10 20 11 14 760 10.6 VII
Total 7137 100
Source: Primary Source
* Wgt – Weightage
** Wgt % - Weightage Percentage
1 Ranks were found out by weightage method where lowest weightage % is
considered as highest rank and vice versa.
Wgt for brand = (20x1)+(11x2)+(10x3)+(14x4)+(12x5)+(9x6)+(13x7)+(10x8)+
(15x9)+(16x10) =708.
Wgt % for brand = (Total of desire of brand switching Wgt ÷ Grand Total of
Wgt) x100
= (708÷7137) x100 = 9.9 %
236 D.Catherine Rexy, Dr. S.Rita, and J.Vignesh Kumar
To purchase two wheelers, an individual depends on many factors and is influenced
by many factors. Here, based on the satisfaction level of two wheelers, ten important
factors were identified such as price, mileage, style, insurance, resale value,
maintenance, petrol consumption, luxury, after sales, and easy driving were selected
and ranked by weighted average method. Through this method, it is possible to know
the respondents satisfaction preference for each factor and which factor is considered
as more significant as well.
The above table highlights the factors taken into consideration by the two wheeler
users while purchasing the preferred brand. Weightage average method was used to
find out the most preferred factor chosen to purchase the two wheeler. The result
shows that the maximum number of respondents satisfied with low maintenance cost
as their choice for purchasing a product followed by milege, style, petrol
consumption, resale value of the bike, price, easy driving, insurance, after sales and
luxury.
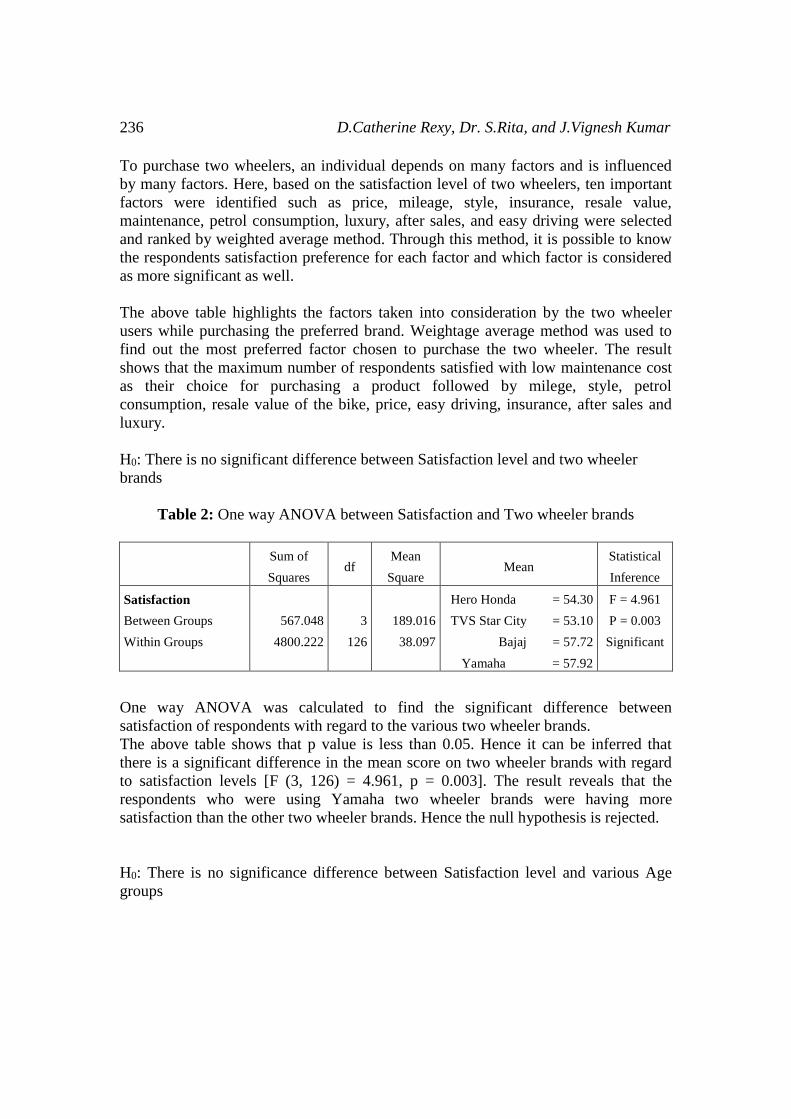
H0: There is no significant difference between Satisfaction level and two wheeler
brands
Table 2: One way ANOVA between Satisfaction and Two wheeler brands
Sum of
Squares df
Mean
Square Mean
Statistical
Inference
Satisfaction
Between Groups
Within Groups
567.048
4800.222
3
126
189.016
38.097
Hero Honda = 54.30
TVS Star City = 53.10
Bajaj = 57.72
Yamaha = 57.92
F = 4.961
P = 0.003
Significant
One way ANOVA was calculated to find the significant difference between
satisfaction of respondents with regard to the various two wheeler brands.
The above table shows that p value is less than 0.05. Hence it can be inferred that
there is a significant difference in the mean score on two wheeler brands with regard
to satisfaction levels [F (3, 126) = 4.961, p = 0.003]. The result reveals that the
respondents who were using Yamaha two wheeler brands were having more
satisfaction than the other two wheeler brands. Hence the null hypothesis is rejected.
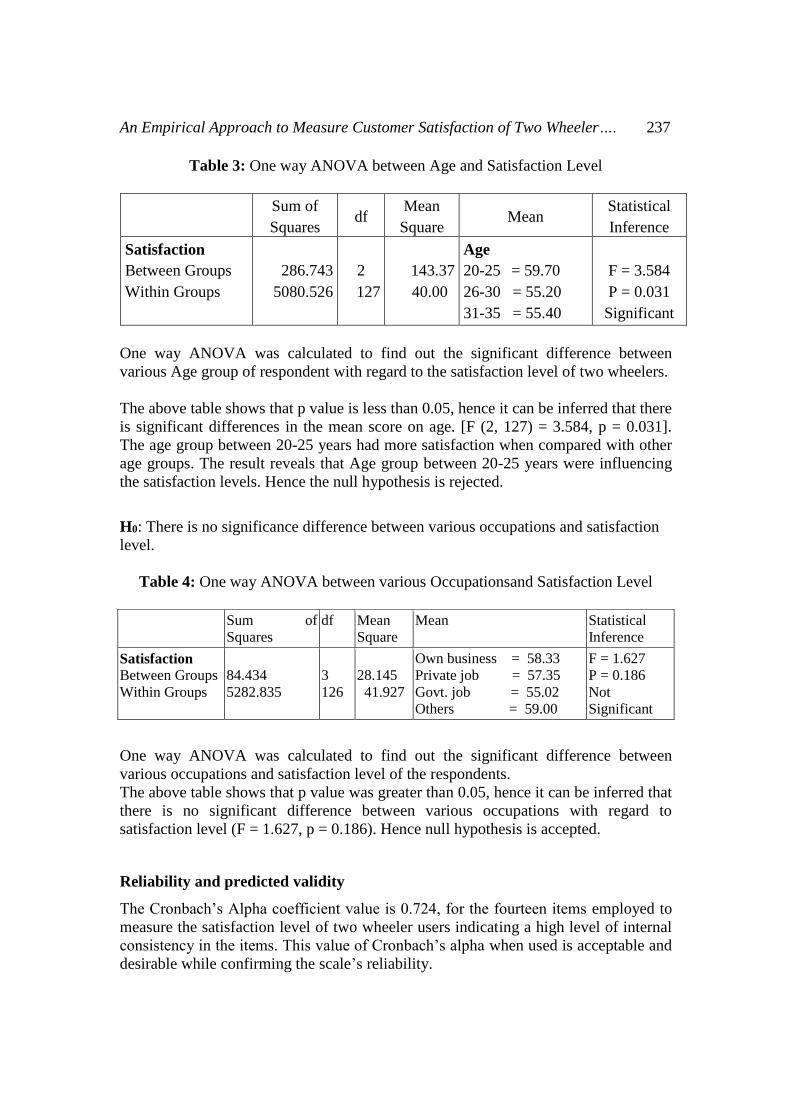
H0: There is no significance difference between Satisfaction level and various Age
groups
An Empirical Approach to Measure Customer Satisfaction of Two Wheeler…. 237
Table 3: One way ANOVA between Age and Satisfaction Level
Sum of
Squares df
Mean
Square Mean
Statistical
Inference
Satisfaction
Between Groups
Within Groups
286.743
5080.526
2
127
143.37
40.00
Age
20-25 = 59.70
26-30 = 55.20
31-35 = 55.40
F = 3.584
P = 0.031
Significant
One way ANOVA was calculated to find out the significant difference between
various Age group of respondent with regard to the satisfaction level of two wheelers.
The above table shows that p value is less than 0.05, hence it can be inferred that there
is significant differences in the mean score on age. [F (2, 127) = 3.584, p = 0.031].
The age group between 20-25 years had more satisfaction when compared with other
age groups. The result reveals that Age group between 20-25 years were influencing
the satisfaction levels. Hence the null hypothesis is rejected.
H0: There is no significance difference between various occupations and satisfaction
level.
Table 4: One way ANOVA between various Occupationsand Satisfaction Level
Sum of
Squares
df Mean
Square
Mean Statistical
Inference
Satisfaction
Between Groups
Within Groups
84.434
5282.835
3
126
28.145
41.927
Own business = 58.33
Private job = 57.35
Govt. job = 55.02
Others = 59.00
F = 1.627
P = 0.186
Not
Significant
One way ANOVA was calculated to find out the significant difference between
various occupations and satisfaction level of the respondents.
The above table shows that p value was greater than 0.05, hence it can be inferred that
there is no significant difference between various occupations with regard to
satisfaction level (F = 1.627, p = 0.186). Hence null hypothesis is accepted.
Reliability and predicted validity
The Cronbach’s Alpha coefficient value is 0.724, for the fourteen items employed to
measure the satisfaction level of two wheeler users indicating a high level of internal
consistency in the items. This value of Cronbach’s alpha when used is acceptable and
desirable while confirming the scale’s reliability.
238 D.Catherine Rexy, Dr. S.Rita, and J.Vignesh Kumar
Data Quality and Normality
Skewness for all the features is less than 1.22; smaller than the lower bound four or
five. The Kurtosis values similarly for nine features is below one. Only five features
showed Kurtosis value greater than one, a level beyond which non-normality of
distribution becomes a concern (Shridhar G., 2009). Thus, both Kurtosis and
Skewness of the features indicate that the data are normally distributed.
Factor Analysis
Multivariate statistical technique,factor analysis is used to summarize the information
contained in a large number of variables into a smaller number of subsets or factors
(Hair et al., 2003). For the present study, factor analysis is used for the reduction of
the number of variables used to measure the satisfaction level of respondents.
Respondents were asked to give their level of satisfaction (1-Highly Dissatisfied to 5-
Highly Satisfied) for fourteen variables pertatining to the two wheelers. For these
variables, factor analysis was performed in this study.
Kaiser-Meyer-Olkin Test for Sampling Adequacy
The Kaiser-Meyer-Olkin (KMO) anindex to samplecompentecy is used to examine
the appropriateness of factor analysis. The KMO value for this study is found to be
0.703, nearer to 1, making this value acceptable and justifying the appropriateness of
factor analysis.
Bartlett’s test of Sphericity
Bartlett’s test of Sphericity, a statistical test used to examine the hypothesis that the
variables are uncorrelated in the population. The significant value of Bartlett’s Test is
0.000, because of which the idea that the correlation matrix is identity matrix can be
rejected, again assuring that factor analysis is appropriate for this data.
Communalities
Principal Component Analysis (PCA) used for grouping the variables under a few
unrelated factors. The initial communalities for principal component analysis are
one.A low communality figure indicating the statistically independent variable and
cannot be combined with other variables. The result shows that in the extracted
communalities thirteen features are high (greater than 0.5), and hence, acceptable for
all the features.
An Empirical Approach to Measure Customer Satisfaction of Two Wheeler…. 239
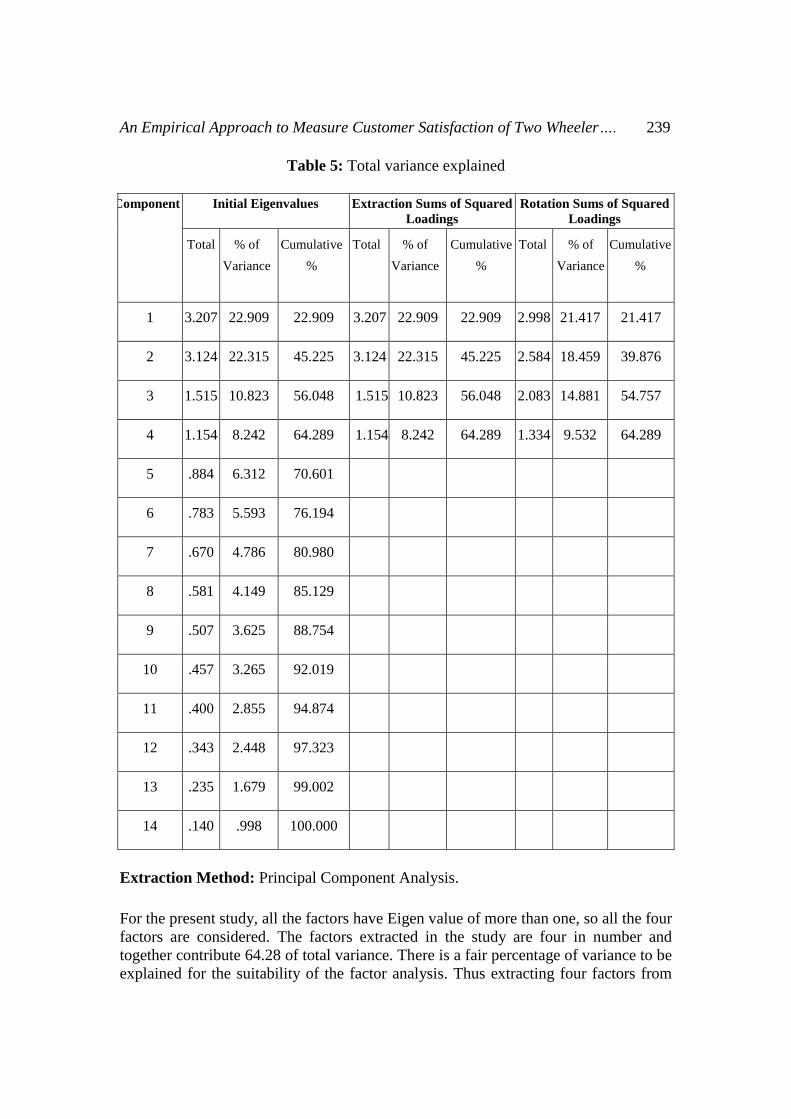
Table 5: Total variance explained
Component Initial Eigenvalues Extraction Sums of Squared
Loadings
Rotation Sums of Squared
Loadings
Total % of
Variance
Cumulative
%
Total
% of
Variance
Cumulative
%
Total % of
Variance
Cumulative
%
1 3.207 22.909 22.909 3.207 22.909 22.909 2.998 21.417 21.417
2 3.124 22.315 45.225 3.124 22.315 45.225 2.584 18.459 39.876
3 1.515 10.823 56.048 1.515 10.823 56.048 2.083 14.881 54.757
4 1.154 8.242 64.289 1.154 8.242 64.289 1.334 9.532 64.289
5 .884 6.312 70.601
6 .783 5.593 76.194
7 .670 4.786 80.980
8 .581 4.149 85.129
9 .507 3.625 88.754
10 .457 3.265 92.019
11 .400 2.855 94.874
12 .343 2.448 97.323
13 .235 1.679 99.002
14 .140 .998 100.000
Extraction Method: Principal Component Analysis.
For the present study, all the factors have Eigen value of more than one, so all the four
factors are considered. The factors extracted in the study are four in number and
together contribute 64.28 of total variance. There is a fair percentage of variance to be
explained for the suitability of the factor analysis. Thus extracting four factors from
240 D.Catherine Rexy, Dr. S.Rita, and J.Vignesh Kumar
total 14 variables for measuring the satisfaction level is good by all means.
Interpretation is done by identifying the variables that have very high loadings on the
same factor. These factors can then be interpreted in terms of the highly loaded
variables.
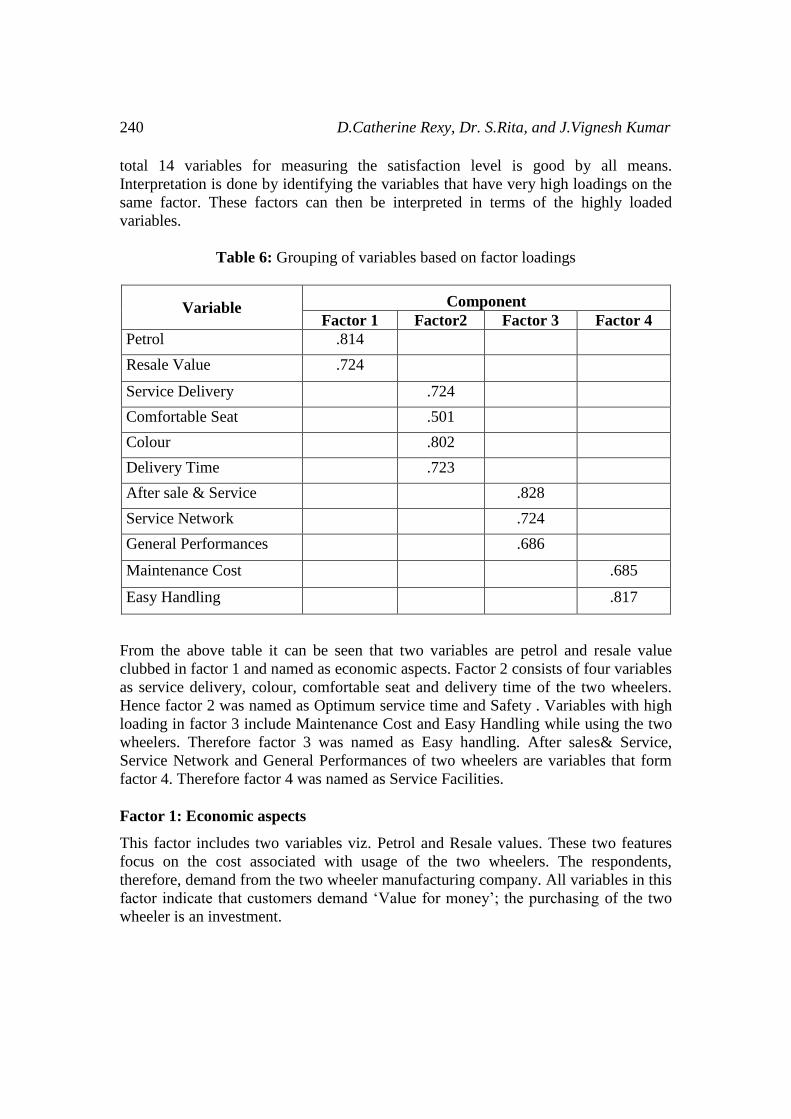
Table 6: Grouping of variables based on factor loadings
Variable Component
Factor 1 Factor2 Factor 3 Factor 4
Petrol .814
Resale Value .724
Service Delivery .724
Comfortable Seat .501
Colour .802
Delivery Time .723
After sale & Service .828
Service Network .724
General Performances .686
Maintenance Cost .685
Easy Handling .817
From the above table it can be seen that two variables are petrol and resale value
clubbed in factor 1 and named as economic aspects. Factor 2 consists of four variables
as service delivery, colour, comfortable seat and delivery time of the two wheelers.
Hence factor 2 was named as Optimum service time and Safety . Variables with high
loading in factor 3 include Maintenance Cost and Easy Handling while using the two
wheelers. Therefore factor 3 was named as Easy handling. After sales& Service,
Service Network and General Performances of two wheelers are variables that form
factor 4. Therefore factor 4 was named as Service Facilities.
Factor 1: Economic aspects
This factor includes two variables viz. Petrol and Resale values. These two features
focus on the cost associated with usage of the two wheelers. The respondents,
therefore, demand from the two wheeler manufacturing company. All variables in this
factor indicate that customers demand ‘Value for money’; the purchasing of the two
wheeler is an investment.
An Empirical Approach to Measure Customer Satisfaction of Two Wheeler…. 241
Factor 2: Optimum service time and Safety
Features like Service Delivery, colour, Comfortable seat and Delivery time of two
wheelers in this factor focus on optimum service time and safety of the user. Physical
‘comfort and safety’ are important while travelling by two wheelers with some brands
also focusing on providing comfort.
Factor 3: Service facilities
Servicing the two wheelers after a customer purchases is important to satisfy the two
wheeler users. The service network and the general performance also play an
important role in satisfying a customer. Therefore the items such as aftersales&
service, Service Network and General Performances of two wheelers are named as
Service Facilities.
Factor 4: Easy handling
Handling two wheelers should not make the customer feel difficult and confused. And
the maintenance cost of the two wheelers should be affordable. Therefore the
maintenance cost and easy handling of two wheelers plays a major role in satisfying
the customers.
The above four factors contribute 64.28 percent of total variance. The grand mean
score values of these factors indicate that companies have to give more focus on these
factors to expand customer base.
Analysis of satisfactions using Six Sigma
To study the satisfaction level of customers of two- wheeler a recent measure viz. Six
Sigma has been applied in this study. The strategy of Six Sigma includes following
six components.
1. Number of units processed.
2. Total number of defects made.
3. Defects per unit.
4. Number of Defect Opportunities Per unit(DPO).
5. Defects Per Million Opportunity (DPMO).
Abridged Sigma conversion table
Based on the value attained from the conversion table, the satisfaction level of the
customersfrom the two wheeler is predicted. The measure between 5 and 6 is
considered to be the best. The score between 3 and 4.9 predicts average level of
satisfaction. The value less than 3 denotes poor or low level of satisfaction. The
following table takes in to account 14 components to assess the level of satisfaction.
242 D.Catherine Rexy, Dr. S.Rita, and J.Vignesh Kumar
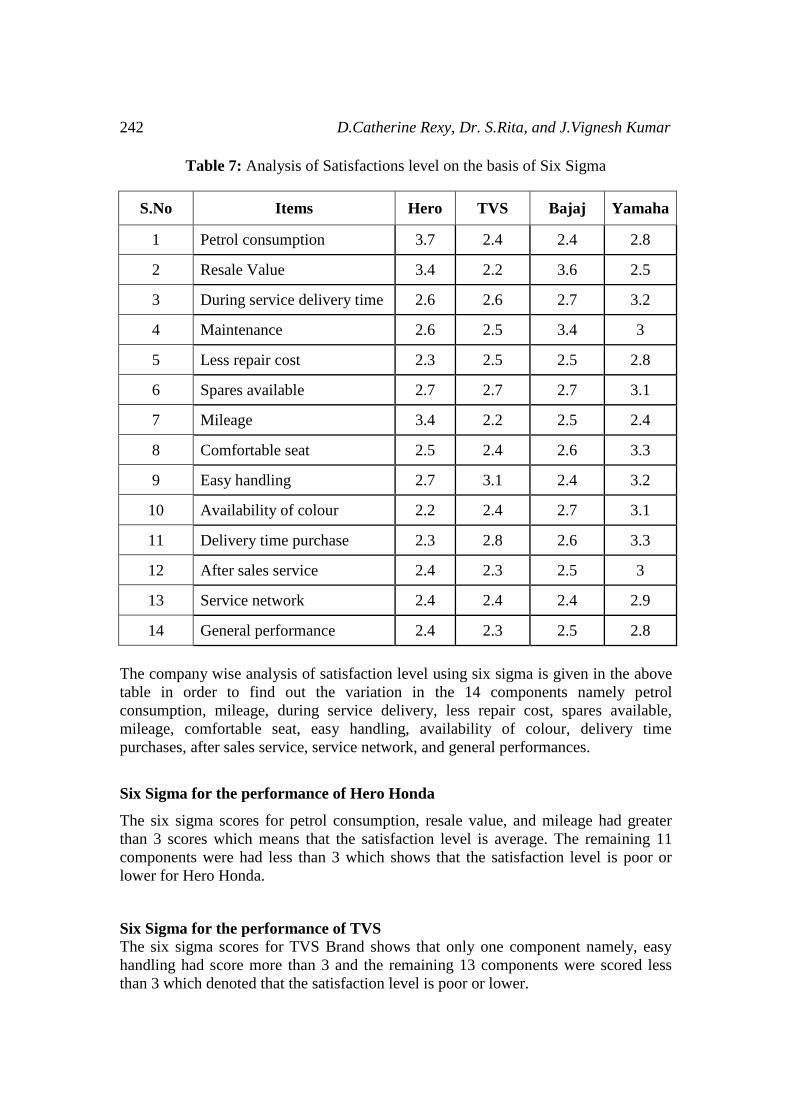
Table 7: Analysis of Satisfactions level on the basis of Six Sigma
S.No Items Hero TVS Bajaj Yamaha
1 Petrol consumption 3.7 2.4 2.4 2.8
2 Resale Value 3.4 2.2 3.6 2.5
3 During service delivery time 2.6 2.6 2.7 3.2
4 Maintenance 2.6 2.5 3.4 3
5 Less repair cost 2.3 2.5 2.5 2.8
6 Spares available 2.7 2.7 2.7 3.1
7 Mileage 3.4 2.2 2.5 2.4
8 Comfortable seat 2.5 2.4 2.6 3.3
9 Easy handling 2.7 3.1 2.4 3.2
10 Availability of colour 2.2 2.4 2.7 3.1
11 Delivery time purchase 2.3 2.8 2.6 3.3
12 After sales service 2.4 2.3 2.5 3
13 Service network 2.4 2.4 2.4 2.9
14 General performance 2.4 2.3 2.5 2.8
The company wise analysis of satisfaction level using six sigma is given in the above
table in order to find out the variation in the 14 components namely petrol
consumption, mileage, during service delivery, less repair cost, spares available,
mileage, comfortable seat, easy handling, availability of colour, delivery time
purchases, after sales service, service network, and general performances.
Six Sigma for the performance of Hero Honda
The six sigma scores for petrol consumption, resale value, and mileage had greater
than 3 scores which means that the satisfaction level is average. The remaining 11
components were had less than 3 which shows that the satisfaction level is poor or
lower for Hero Honda.
Six Sigma for the performance of TVS
The six sigma scores for TVS Brand shows that only one component namely, easy
handling had score more than 3 and the remaining 13 components were scored less
than 3 which denoted that the satisfaction level is poor or lower.
An Empirical Approach to Measure Customer Satisfaction of Two Wheeler…. 243
Six Sigma for the performance of Bajaj
The six sigma scores for Bajaj shows that two component namely, resale value and
maintenance, were greater than 3 which means that the satisfaction level is average.
The remaining 12 components scored less than 3, shows that the satisfaction level is
poor or lower.
Six Sigma for the performance of Yamaha
The six sigma scores for Yamaha reveal that service delivery time, maintenance,
spares available, comfortable seat, easy handling, availability of colour, delivery time
purchase, and after sales service are greater than 3. This shows that the satisfaction
level is average. The remaining components had less than 3 which denotes that the
satisfaction level is poor or lower.
RESEARCH FINDINGS AND CONCLUSIONS
Maximum numbers of respondents were satisfied with low maintenance cost
as their choice for purchasing a two wheeler.
The respondents using two wheeler brand Yamaha had more satisfaction than
the other two wheeler brands.
The age group between 20-25 years were more satisfied when compared with
other age groups.
There is no significant difference between users of various occupations with
regard to satisfaction level.
Four factors were identified for their satisfaction level namely, economic
aspects, Optimum Service Time and Safety, Easy Handling and Service
Facilities. About 64.28 percent of total variance are contributedby the above
four factors. The grand mean score values of these factors indicate that
companies have to give more focus on the factors to expand customer base.
Six Sigma for the performance of Hero Honda The six sigma result for the brand Hero Honda shows that two wheeler users
were satisfied with the petrol consumption, resale value, and mileage.
Six Sigma for the performance of TVS
The six sigma result for the brandTVS shows that two wheeler users were
satisfied with easy handling.
Six Sigma for the performance of Bajaj
The six sigma scores for Bajaj showed that two component namely resale
value and maintenance were greater than 3 which means that the satisfaction
level is average. The remaining 12 components were had scores less than 3,
showing that the satisfaction level is poor or lower.
Six Sigma for the performance of Yamaha
The six sigma scores for Yamaha reveals that the two wheeler users were
satisfied with during service delivery time, maintenance, spares available,
244 D.Catherine Rexy, Dr. S.Rita, and J.Vignesh Kumar
comfortable seat, easy handling, availability of colour, delivery time purchase,
and after sales service.
RECOMMENDATION
o Focus should be on youth as they represent the highest portion of the bike
using segment.
o Indian two wheeler users generally do not use bike as a style statement, but
out of necessity, so low maintenancec and mileage is of utmost concern,
causing a need to create a better image in the mind of its customers regarding
two wheelers.
CONCLUSION
The advantages of Six Sigma approach are reduction in defects/rejections, cycle time,
work in progress etc. and increase in product quality and reliability, customer
satisfaction, proactive etc. leading ultimately to excellent business results. By
successfully implementing Six Sigma an institution can substantially improve the
Customers Satisfaction Index and also increase bottom line by eliminating wastages.
Statisticians can play a very important role in designing and monitoring Six Sigma
practices in their respective organizations because they are experts in statistics and its
application in practical business scenario.
REFERENCE
[1] Dhananjoy Datta (2010) Factor influencing customers buying behavior of two-
wheeler at Agartala, Tripura, ICFAI University Journal.
[2] Dr.C.Annandan & M.Prasanna Mohan Raj &Mr.S.Madhu, A Study on Brand
preference of washing soaps in rural areas, Indian Journal of
marketing,March(2007), Page no-30.
[3] Dr.N. Chandrasekaran, Consumer Behaviour and Brand Preference towards
Onida Television –An Empirical Study with Reference to Karur, Tamilnadu,
Indian Journal of Marketing, July (2009),Page No-58.
[4] Dr.S.K.Sinha & Ajay Wagh, Analysing growth of cellular telecom sector and
understanding consumer’s preferences and choices on the use of cell phone-
Indian Journal of Marketing. Sep (2008) Page no -2.
[5] K. Siddhartha and S. Mukherjee, (2002), ‘Cities Urbanization and urban
systems’, Kisalaya Publications Pvt. Ltd., Delhi, P.P.197 198.
An Empirical Approach to Measure Customer Satisfaction of Two Wheeler…. 245
[6] Lewis, R.C. & Boom, B.H. (1983) “The Marketing Aspects of Service” in
Berry, L., Shostack, G. and Upah, G. (Eds), “Emerging Perspective on
Services Marketing” American Marketing Association, p. 99- 107
[7] Lisa R. Klein and Gary T. Ford (2003), “Customer search for information in
the digital age: An empirical study of pre purchase search for automobiles”
Journal of Interactive Marketing.
[8] Murphy John and Bellman Eric(2008) “Riding Two-Wheelers in India”, Wall
Street Journal.
[9] Prof.S. Saaravanan and Prof. N. Panchanatham, (2009), Customer behavior
towards show room services of two-wheeler, International Cross Industry
Journal Perspectives of Innovations, Economics & Business.
[10] Rachel Dardis, Horacio Soberon-Ferrer, consumer’s preferences for Japanese
auto mobiles,Journal of consumer affairs, summer (1994).
[11] Rajamani Singh and AS Yasso (2001): in Sathish M, A Study on Consumer
Behaviour of Automobile Products with Special Reference to Two-wheelers in
Tirunelveli City, Tamil Nadu, Indian Journal of Applied Research, Vol. 1, No.
3, December 2011, pp 161-162
[12] Snelders, D., & Schoormans, J. P.L.(2000). Are Abstract Product
Qualifications More Subjective? A test of the Relation between Abstraction
Level and Opposite Naming. Advances in Consumer Research.
246 D.Catherine Rexy, Dr. S.Rita, and J.Vignesh Kumar


