1
U.S. Patent and Trademark Office
OFFICE OF THE CHIEF ECONOMIST
Economic Working Paper Series
An Anatomy of U.S. Firms Seeking
Trademark Registration
Emin M. Dinlersoz, U.S. Census Bureau
Nathan Goldschlag, U.S. Census Bureau
Amanda Myers, U.S. Patent and Trademark Office
Nikolas Zolas, U.S. Census Bureau
May 2018
USPTO Economic Working Paper No. 2018-02
CES Working Paper 18-22
The views expressed are those of the individual authors and do not necessarily reflect official positions of the Office of
the Chief Economist, the U. S. Patent and Trademark Office, or the U.S. Census Bureau. USPTO Economic Working Papers
are preliminary research being shared in a timely manner with the public in order to stimulate discussion, scholarly
debate, and critical comment.
For more information about the USPTO’s Office of the Chief Economist, visit www.uspto.gov/economics.
An Anatomy of U.S. Firms Seeking Trademark Registration
by
Emin M. Dinlersoz U.S. Census Bureau
Nathan Goldschlag U.S. Census Bureau
Amanda Myers U.S. Patent and Trademark Office
Nikolas Zolas U.S. Census Bureau
CES 18-22 April, 2018
The research program of the Center for Economic Studies (CES) produces a wide range of economic analyses to improve the statistical programs of the U.S. Census Bureau. Many of these analyses take the form of CES research papers. The papers have not undergone the review accorded Census Bureau publications and no endorsement should be inferred. Any opinions and conclusions expressed herein are those of the author(s) and do not necessarily represent the views of the U.S. Census Bureau. All results have been reviewed to ensure that no confidential information is disclosed. Republication in whole or part must be cleared with the authors.
To obtain information about the series, see www.census.gov/ces or contact Christopher Goetz, Editor, Discussion Papers, U.S. Census Bureau, Center for Economic Studies 5K028B, 4600 Silver Hill Road, Washington, DC 20233, [email protected]. To subscribe to the series, please click here.
Abstract
This paper reports on the construction of a new dataset that combines data on trademark applications and registrations from the U.S. Patent and Trademark Office with data on firms from the U.S. Census Bureau. The resulting dataset allows tracking of various activity related to trademark use and protection over the life-cycle of firms, such as the first application for a trademark registration, the first use of a trademark, and the renewal, assignment, and cancellation of trademark registrations. Facts about firm-level trademark activity are documented, including the incidence and timing of trademark registration filings over the firm life-cycle and the connection between firm characteristics and trademark applications. We also explore the relation of trademark application filing to firm employment and revenue growth, and to firm innovative activity as measured by R&D and patents.
Keyword: Trademark, intellectual property, innovation
JEL Classification: O3
*
* Any opinions and conclusions expressed herein are those of the authors and do not necessarily represent the views of the U.S. Census Bureau and the U.S. Patent and Trademark Office. All results have been reviewed to ensure that no confidential data are disclosed. The authors would like to thank Carol Corrado, Jonathan Haskel, Daniel Sichel, and Javier Miranda — the organizers of the 2017 CRIW Conference on Measuring and Accounting for Innovation in the 21st Century, conference participants, and especially the discussant, Mark Roberts, for helpful comments and suggestions. Veronika Penciakova provided expert research assistance.
Dinlersoz: [email protected]. Goldschlag: [email protected] Myers: [email protected] Zolas (corresponding author): [email protected]

1 Introduction
Attracting consumers and retaining them as loyal customers is critical for a firm’s survival and
growth. Among the many ways of building and protecting a loyal customer base, trademarks
are unique. By protecting a firm’s intangible assets, trademarks can reduce consumer search
and switching costs, lower the expense of introducing and marketing new products, and generate
brand awareness and loyalty. While trademarks generally facilitate establishing and enhancing
goodwill, they may not always be directly linked to a particular attribute of the firm. Good-
will can be generated through investment in consistent quality, exceptional customer service, a
distinctive portfolio of products, or a unique service or innovation that makes a firm stand out.
The fact that not all firms file to register trademarks, despite the relatively low cost of doing so,
suggests that certain firms stand to benefit more from trademark registration than others.1
Theory contends that firms use trademarks to appropriate the returns from investments in
goodwill. Firms are therefore more likely to select into trademark registration when the returns to
reputation, product quality, and scale and scope expansion are high.2 Likewise, when innovative
activity complements goodwill, by enhancing product or service quality and inducing customer
loyalty, firms have more motivation to protect accumulated and anticipated goodwill with a
trademark registration. The benefits derived from using a trademark can, in turn, affect firm
performance and productivity. When firms successfully leverage trademarks to differentiate goods
or services and insulate themselves from copying and competition by registering trademarks,
they can achieve faster growth. At the same time, the price elasticity of demand for firms with
trademarks can be lower, leading to higher markups. Maintaining higher markups, in turn,
may intensify firms’ advertising and marketing activities or foster further investment in quality
enhancement and process or product innovation. Consequently, protection of trademarks through
registration can have long-term consequences for a firm’s competitive position in the market as
well as the industry concentration.
While theory suggests trademarks can play a critical role in firm dynamics and innovation,
empirical research regarding which firms in the United States use trademarks and the benefits
they thereby derive is relatively sparse, especially when compared to other intellectual property
such as patenting. The small but growing body of empirical literature on trademarks relies
1One rationale for why not all firms file to register trademarks is provided by Landes and Posner (1988)
pp.271-272: If trademarks signal consistent quality, quality may be costly to maintain, and can be verified by
consumers after purchase. Hence, only the firms that can afford to provide such consistent quality will tend to
seek trademark registration.2See, e.g., Landes and Posner (1987,1988) and Economides (1988) for theoretical arguments on the connection
between trademarks and consumer behavior. For recent models of firm dynamics under costly and gradual
customer acquisition, see Dinlersoz and Yorukoglu (2012) and Gourio and Rudanko (2014).
1
primarily on application and registration data from other countries, particularly the United
Kingdom, Australia, and France. Such firm-level studies generally find trademark filing and/or
registration to be correlated with product differentiation, marketing, and innovation, though
results vary by industry. The prior literature also finds a positive relationship between trademark
registration and firm market value, productivity, and survival, indicating that the private value
of trademarks to firm is positive, though there is yet no clear conclusion regarding their social
value. Still, most firm-level research to date relies on datasets of large, publicly-traded firms,
which casts doubt on the applicability of results to the population of firms that seek trademark
registration.
One major obstacle to empirical analysis of trademark use by firms in the United States is the
lack of comprehensive data on firm-level trademark activity. Recently, however, there has been
substantial progress on this front. The United States Patent and Trademark Office (USPTO)
has made available trademark data that covers nearly 7 million trademark applications for the
period 1870-2015. The USPTO Trademark Case Files Dataset (TCFD) is a remarkable synthesis
of various trademark activity by firms.3 It contains detailed information on applications for
trademark registration, as well as the commercial use, renewal, assignment, and cancellation of
registered trademarks. It identifies the dates an application is filed with the USPTO and proceeds
to registration, and in what product categories or classes of goods and services are covered by a
registration. However, the TCFD has little to contribute regarding the characteristics of the firms
that seek trademark registration and when exactly in their life-cycle they do so. It is, therefore,
not possible to uncover how trademark filing is related to firm characteristics and dynamics with
the TCFD alone.
This paper reports on the construction of a new dataset that combines the TCFD with firm-
level micro data at the U.S. Census Bureau. The dataset fills a void in the literature by linking
trademark activity with firm characteristics, performance, and dynamics in the United States.
It provides information on the incidence and timing of trademark filing and registration over
the life-cycle of a firm and, thus, opens several research possibilities. The trademark-firm linked
data can be used to explore not only what kind of firms seek to register trademarks, but also
when they do so, and how trademark filing is related to firm dynamics, such as entry, survival,
employment and revenue growth, and R&D and patenting intensity. This paper provides a first
look at the connection between trademark filing and broader measures of firm outcomes based on
the constructed data. An objective of this initial analysis is to explore some of the selection and
treatment effects associated with seeking federal trademark registration in terms of firm growth
and innovation.
3See Graham, Hancock, Marco and Myers (2016) for details on the construction and features of the USPTO
Trademark Case Files Dataset.
2

Key events early in the life-cycle of firms may signal the emergence of high growth firms
and generate skewness in firm outcomes. There is a growing interest in identifying precursors of
successful businesses. Recent research indicates that having a patent or a trademark application
is highly correlated with the ultimate success of an early entrepreneurship activity, as measured
by rare events such as an IPO or a high-value acquisition.4 Analysis of the constructed data,
likewise, indicates that trademark filing is correlated with employment and revenue growth.
There appears to be strong selection into trademark filing for trademark registration based on
firm size and age, though size is a more critical correlate. Firms that do not apply for trademark
registration in their initial years are unlikely to do so unless they experience employment growth.
Difference-in-difference analysis suggests sizable treatment effects, with firms seeking trademark
registration having substantially higher employment and greater revenue in the period following
first filing relative to control firms.
Among the least studied aspects of trademarks is their ability to capture firm innovation.
Trademarks can be used to capture the value of firm innovative outputs that are not covered
by patents, such as innovations in retail, services, customer relations, and knowledge-intensive
products. Little is known, however, about this function of trademarks. More evidence is needed
on firms use of trademarks to appropriate returns from innovation and the relationship between
trademark activity andmore traditional measures of innovative activity. Firm-level analysis of the
constructed data indicates that firms with R&D and patent activity are also very likely to apply
to register trademarks. Further, the relatively frequent co-presence of trademark applications
and R&D activity in firms without patents suggests that, for at least some firms, trademarks
may capture innovative outputs of R&D investment not accounted for by patents. Difference-
in-difference analysis also supports a complementarity between applying to register trademarks
and innovative activity, showing higher average R&D expenditure and patenting by first-time
trademark filers both before and after initial filing compared to control firms. These initial results
warrant further investigation. Still, they provide some preliminary evidence that trademark
filings are correlated with firm innovation and that trademark-based metrics may serve to improve
measurement of innovation in the economy.
The paper is organized as follows. The next section gives a brief overview of the prior literature
leveraging firm and trademark application data predominantly from countries other than the
United States. Section 3 provides the theoretical motivation for analyzing the connection between
trademarks, applications for trademark registration, and firm characteristics, dynamics, and
innovation. Section 4 discusses the data inputs and the algorithm used to match the trademark
data with data on firm characteristics. The analysis in Section 5 documents the characteristics
of firms that seek trademark registration, and provides a first look at how trademark filing is
4See, for instance, Fazio, Guzman, Murray and Stern (2016).
3

correlated with firm growth and innovation. Section 6 concludes with a discussion of the streams
of future research made possible by the trademark-firm linked data.
2 Prior literature
There is a small but growing body of empirical work concerning trademarks. Much of the recent
work examining trademark data at the firm level is limited to the European and Australian
context. For the United States, most research leverages datasets of publicly-traded firms, such
as Compustat, which cover a fraction of those firms seeking trademark registration. The lack of
comprehensive data on trademark filing by private firms and small to medium-sized enterprises
has been a major impediment to empirical research regarding the use of trademarks and the
relationship between trademark filing and firm characteristics, dynamics and innovative activity
in the United States.
Schautshick and Greenhalgh (2013) provide a comprehensive survey of the empirical research
on trademarks. Several conclusions emerge from the survey. First, there has been considerable
growth in trademark application demand since the mid-1970s in Australia, the United Kingdom,
and the United States, with qualitatively similar trends in trademark filing growth across these
countries between 1975 and 2002.5 The services sector, as well as deregulated and restructured
industries, exhibit the highest rates of growth in trademark filing growth during this period.
Interestingly, the surge in trademark applications appears to lead a similar surge in patent filings
in developed countries by about ten years. Still, there is no formal econometric analysis that
establishes the connection between the timing of patents and trademarks at the firm-level, and
whether firm trademark filing leads or lags patent applications is an open question. Second,
at the country level, increased demand for product variety and quality appears to drive growth
in trademark applications compared to the mere expansion of output. In general, the studies
surveyed indicate that trademark filing is correlated with product differentiation, marketing,
and innovation. However, the degree of this correlation depends on the industries investigated.
Finally, firm-level studies indicate that firms use trademarks to protect identity and reputation
and the private value of trademarks to firms is generally positive, but there is no clear conclusion
on the social value of trademarks. The latter depends on the trade-off between market efficiency-
improving and pro-competitive effects of trademarks and the potential for firms to make inefficient
investments to protect reputation and to leverage reputational assets to promote barriers to entry.
Further research is needed to assess the relative magnitudes of these different effects.
At the macro-level, Baroncelli, Fink and Javorcik (2005) also document a number of regulari-
ties in trademark registrations across countries. Using World Intellectual Property Organization
5See Figure 2 in Schautschick and Greenhalgh (2013).
4

data for a panel of countries over the period 1994-1998, they find evidence that higher devel-
opment is correlated with a dominance of domestic brands at home and a stronger presence
of these brands in foreign markets, as indicated by foreign residents’ share of trademark reg-
istrations. However, they also note growth in foreign trademark registrations held by entities
in by developing countries, potentially reflecting increased exports to markets in more devel-
oped countries and the resulting need to protect growing brands. At the sector and industry
level, Baroncelli, Fink and Javorcik (2005) observe that most trademark registrations occur in
industries characterized as R&D intensive, particularly scientific equipment and pharmaceutical
sectors, and advertising-intensive, such as clothing, footwear, and food products. Business ser-
vices also exhibit higher trademark registration intensity — a finding echoed by Millot (2011) for
Germany and France.
Multiple studies document the relatively rapid growth in service marks between 1980s and
2000s in developed countries — Greenhalgh, Longland, and Bosworth (2003) for the U.K., Jensen
andWebster (2004) for Australia, and Graham, Hancock, Marco, andMyers (2016) for the United
States. In particular, the latter study finds that service marks filings grew by nearly 50% between
1998 and 2000 in the United States, potentially as a result of the dot.com boom of the late 1990s.6
These patterns reflect the growing importance of the service sector in developed economies and
potentially denote a rise in service-related innovations the value of which is captured through
trademarks.
A handful of studies leverage firm-trademark matched datasets to examine the connection
between firm characteristics and trademark filing or registration activity. Greenhalgh, Longland,
and Bosworth (2003) use panel data on medium and large manufacturing U.K. firms and find an
inverse relationship between trademark filing intensity and firm size. Smaller firms, as measured
either by employment or sales, exhibit higher trademark filing intensity. However, the panel
consists mainly of large, publicly-listed firms with many subsidiaries, which calls into question
the applicability of results to the broader population of firms relying on trademarks.
Greenhalgh and Rogers (2008) use data on both manufacturing and service firms in the
U.K. to investigate the role of firm characteristics on activities related to intellectual property,
including trademark filing. They find that, while intellectual property assets are not always
monotonically related to firm growth, size is nevertheless a strong predictor of whether a firm
applies for a patent and/or seeks trademark registration. Their study also indicates diminishing
returns to firm size in terms of such activity. In both services and manufacturing, patent and
trademark filing intensity declines as firms get larger. The results of both Greenhalgh, Longland,
and Bosworth (2003) and Greenhalgh and Rogers (2008) denote the significant relationship be-
tween trademark filing intensity and firm size in the U.K., a finding replicated by Jensen and
6See Figure 16 in Graham, Hancock, Marco and Myers (2016).
5

Webster (2006) for Australian firms.
Sandner (2009) provides a detailed investigation of companies’ trademark portfolios using the
world’s largest publicly-traded companies — those included in the financial databases Reuters and
Compustat. The study identifies 4,085 companies that satisfy the selection criterion in their latest
income statement.7 Results indicate that companies build trademark portfolios to deliberately
protect the company brand. Using trademark applications to infer brand management decisions,
the study finds that product introductions prompt varied decisions regarding whether to extend
existing or devise novel trademarks to cover new products. Thus, trademark filings can reflect
both the creation of new brands and the expansion of existing brands to encompass new products.
Sandner and Block (2011) use data from various countries, including the United States, to
assess the market value of trademarks. They find a positive effect of trademark registrations
on firm value, controlling for patenting and R&D activity. However, their study is limited to
Community Trademarks registered by the Office for Harmonization in the Internal Market (now
the European Intellectual Property Office or EUIPO) and publicly-traded firms from Compustat.
The final dataset consists of a relatively small set of 1,216 large, publicly-traded firms, and the
results, like those of most prior studies at the firm-level, provide little information on trademark
registrations held by private firms.
A few studies have focused specifically on trademark filings by small to medium-sized firms.
Rogers et al. (2007) build a database that spans the entire set of U.K. firms for the period 2001-
2005. The database contains millions of small to medium-sized firms matched with trademark
applications and substantially expands on the scope of the studies discussed earlier, even though
the time period covered is relatively short. One main conclusion that emerges from this study
is that smaller firms are more intellectual property intensive, tending to have higher volumes of
patent and trademark applications relative to their assets, compared to larger firms.
To examine such firms’ motivation to seek federal U.S. trademark registration, Block, Fisch,
Hahn, and Sandner (2015) use an online survey of 600 small and medium trademark applicants
in internet and technology sectors selected from CrunchBase (formerly TechCrunch), a crowd-
sourced database of U.S. firms. They use factor analysis to establish three distinct motivations
for seeking trademark registration — protection, marketing, and exchange. They then use cluster
analysis to build a typology of firms based on trademark motivations, resulting in four clusters
— trademark skeptics, marketing-focused trademark users, marketing plus protection-focused
trademark users, and trademark advocates.8 This study demonstrates that there may be signif-
7Companies with revenues of 400 million Euros or more (as of the time of the analysis).8Trademark advocates value all trademark motives highly, while the marketing-focus group values trademarks
for marketing purposes but do not report protection or exchange as motivation for filing. The marketing plus
protection-focused group is the largest, comprising one-third of the firms, and ranks both marketing and protection
motives highly.
6
icant heterogeneity in firm motivations for seeking trademark registration. In a related paper
using a comparably sized sample of small and medium firms in Belgium, Flikkema, De Man, and
Castaldi (2014) investigate how companies use and interpret trademarks. Their analysis reveals
that 60% of recently registered trademarks indicate innovative activity, mainly in the form of
product or service innovation. These results encourage further scrutiny into trademark filings by
small and medium firm, especially in the U.S. where research has been largely limited to large,
publicly-traded firms.
Recent work has also utilized the USPTO Case Files Dataset in conjunction with other
datasets in the U.S. to study incentives to use and protect trademark and assess the value of
trademarks for firms. Aurora, Bei, and Cohen (2016) explore the incentives to use and protect
trademarks for firms in the U.S. by bringing together survey data from The Division of Innova-
tive Labor on firms’ new product development activities and industry-level data from the NETS
database to understand the connection between trademarks, competition and first-mover advan-
tages. Heath and Mace (2017) offer evidence, using the Federal Trademark Dilution Act and its
subsequent revision, that trademark protection through registration has economically significant
effects in the case of publicly-traded firms in Compustat. These studies, nevertheless, do not
provide a comprehensive analysis of trademark filing propensity for all firms in the United States.
The existing literature, summarized so far, highlights the need for comprehensive longitudi-
nally linked firm-level trademark data in the United States, especially for privately-held firms.
The rest of the paper describes how this type of dataset is constructed by combining trademark-
related information from the USPTO Case Files Dataset with data on firms, public and private,
available at the U.S. Census Bureau. It then demonstrates how the new dataset can be used to
better understand the connection between trademark filing and firm attributes, dynamics, and
innovation.
3 Theoretical motivation
The theoretical literature sets forth a variety of ways trademarks can be related to firm outcomes
and performance.9 A fundamental function of trademarks highlighted in theory is that of an
information signal to promote market efficiency and reduce consumer search costs, especially for
experience goods. As source-identifying devices, trademarks convey information regarding the
unobserved attributes of a firm and its products (e.g. quality) and therefore reduce information
asymmetry and consumer search costs, particularly in markets where the attributes of goods or
services are not readily discernible. Firms are incentivized to invest in goodwill to reap rewards
9See, e.g., Landes and Posner (1987, 1988, 2003), and Economides (1988), for reviews and assessment of the
theory of trademarks.
7

from the reputational value exemplified by the trademark. Thus, trademarks with positive
reputational value can facilitate customer acquisition, generate customer loyalty, and facilitate
scale and scope expansion. As a result, trademarks can reduce the price elasticity of demand,
allow firms to maintain higher prices and facilitate investment into not only further reputation-
building activities but also R&D and innovation. Additionally, by protecting a firm’s intangible
assets and stock of goodwill, trademarks insulate firms from competition and infringement of
their products or services.
In view of the various theoretical roles of trademarks summarized above, one expects both
strong selection and treatment effects associated with application for trademark registration.
Firms for which reputational assets would yield higher returns are more likely to select into
trademark registration. A more productive firm with better growth prospects, a firm that can
commit to high quality, or a firm with a large customer base stands to gain more from trademark
registration because the benefits accrue from a larger current and future stock of goodwill. Thus,
firms that seek to register a trademark for the first time may be those that are larger, more
productive, have better product quality, and experience faster growth. In particular, young firms
with a innovative product or service expected to yield a large future profit stream may seek
trademark registration with a higher propensity.
Trademarks can also induce potentially large treatment effects. Trademarks can contribute to
the firm’s ability to expand into other product types and new markets, based on the established
brand name, goodwill, and loyalty. Trademarks can also prevent the infringement of a firm’s
brand and the erosion of its stock of goodwill. In markets with relatively homogeneous goods,
trademarks can serve a role akin to product differentiation based on quality and reduce the
intensity of price competition. This reduction can lead to higher markups and growth for firms
that can successfully differentiate themselves using trademarks. All of these effects suggest
that the post-trademark filing dynamics of a firm can differ from both the pre-trademark filing
dynamics and the dynamics of firms that do not seek to register trademarks at all.
The innovative activity of firms is likely to have a significant impact on both selection and
treatment effects associated with trademarks. Firms that engage in R&D and patenting may
be more likely to seek trademark registration ex post to appropriate greater returns from their
innovations. For instance, a firm that invests in product and process R&D is more likely to
generate higher quality products, sustain lower costs, or induce more demand and customer
loyalty, and hence, build a larger stock of goodwill. Such firms have greater incentive to protect
accumulated and anticipated goodwill with a trademark registration. Therefore, when innovating
firms select into trademark use, an application for trademark registration would follow R&D and
patenting as a lagging indicator of innovative activity.
Trademark filing may also directly reflect innovative activity not captured by R&D or patents.
8
Many service innovations, or innovations in information and knowledge-intensive industries, may
be better protected by trademarks, rather than patents. More generally, where innovations are
not patent eligible subject matter or were developed with informal protection mechanisms, firms
may be more likely to seek trademark registration to protect against imitation and secure the
firm’s current and future stock of goodwill. To the extent that trademark applications reflect such
innovations and their associated goodwill, the knowledge of which firms apply for trademarks
can enable more accurate identification of the broader population of firms engaging in innovative
activity.
Trademarks may also enhance firms’ innovation activity. A large stock of goodwill, accumu-
lated and protected by trademarks, can increase a firm’s incentives for innovation. A firm with
many loyal customers can benefit more from cost-reducing R&D, since reductions would spread
over a larger customer base. Similarly, product introductions can be more valuable and involve
less risk of imitation for firms with a trademark, as new products can readily enjoy the existing
protection and established goodwill of the firm’s trademark. Furthermore, where strong good-
will enhances market power, firms with trademarks may be more likely to invest in exploratory
R&D. These considerations suggest that firms may engage in R&D and patenting more intensely
after they secure a trademark registration. In this sense, trademark filings may also be leading
indicators of innovative activity.
In summary, theory suggests that there may be strong selection and treatment effects asso-
ciated with a trademark application. Both the pre- and post-trademark evolution of firms with
a trademark application may differ significantly from that of firms that do not seek trademark
registration. Furthermore, innovative activity captured by R&D and patenting can be strongly
correlated with trademark filing. These two types of activities can complement each other, lead-
ing to high firm-level correlation between trademark application, R&D, and patenting. The
relative timing of innovation and trademark filing over the firm life-cycle may be informative in
understanding whether trademark applications can serve as precursors of innovation. Empirical
analysis in the following sections will explore some of the selection and treatment effects asso-
ciated with trademark filings suggested by the theory of trademarks. It will also examine the
connection between trademark filings and innovative activity, as measured by R&D and patents,
at the firm level.
4 Data
This section describes the datasets used to link trademark application filing information with
longitudinal firm data. It provides an outline of the methodology for matching trademark data to
firms. Because the trademark data consists of many separate files and a large number of variables,
9
it is important to develop a strategy for using all the relevant information from trademark
applications by firms to facilitate the matching process.
4.1 Data on trademarks
The data on trademarks comes from the USPTO Trademark Case Files Dataset (TCFD). This
dataset was constructed by economists at the USPTO from trademark case files made available
by the USPTO on the data.gov website. The case files were organized and streamlined to form
several electronic files that can be readily used by researchers to conduct large-scale analysis.
The accompanying paper, Graham, Hancock, Marco, and Myers (2016), provides an excellent
account of how the TCFD was constructed and a first look at some of the patterns of trademark
filing activity that emerge from the data. The TCFD contains detailed information on USPTO
trademarks applications and registrations for the period 1870-2015. The information on trade-
marks includes, but is not limited to, ownership, assignment, prosecution events, classification,
and renewal history.
In the United States, trademark registrations are subject to a use requirement, which ob-
ligates the owner to use the mark on goods or in connection with services in order to establish
and maintain trademark rights. The use requirement derives from American common law and
subsequent codification in federal statute.10 An entity establishes and can enforce common law
trademark rights solely by using a mark in commerce. A federal U.S. trademark Principal Reg-
ister registration confers benefits beyond common law, specifically national-scope rights, prima
facie evidence of ownership, and recordation with the U.S. Customs and Border Protection for
preventing the importation of infringing goods.
The TCFD captures only information on entities that seek a federal U.S. trademark regis-
tration. It does not capture the population of firms that rely solely on common law trademark
rights. This is an important distinction because the selection and treatment effects considered
here are limited to those associated with filing for federal trademark registration at the USPTO.
Results may not be applicable to the broader set of firms with only common law trademark
rights.
10Under American common law, a trademark owner has the exclusive right to prevent unauthorized third
parties from using the same or similar mark on goods and services where such use would likely cause confusion
among consumers as to the source of the goods and services offered under the mark. An entity may establish
trademark rights solely by using a distinctive mark on the goods or in connection with the services. Registration
at the state or federal level provides additional benefits but is not necessary for an entity to create and enforce
common law trademark rights. The Lanham Act of 1946 (“Trademark Act”) established the modern U.S. federal
trademark registration system, providing for protection of trademarks used in commerce and registered with the
USPTO. 15 U.S.C. §1051 et seq.
10
To file a U.S. trademark application, an applicant must specify the goods and services on
and for which she uses or intends to use the trademark. The identified goods and services define
the scope of trademark protection covered by the registration and generally cannot be overly
broad.11 Still, even within the same class, there can be considerable variation in the specificity
of the goods and services listed and, thereby, the breadth of trademark protection.
An applicant can apply to register a trademark already in commercial use or for which she has
a bona fide intent to use the trademark on the identified goods or in connection with the identified
services.12 However, such so-called “intent-to-use applications” can only be registered after the
owner uses the trademark in the ordinary course of trade in commerce and provides a declaration
and evidence supporting such use to USPTO.13 Filing for a U.S. trademark registration costs
a relatively small fee per class.14 During substantive examination, the USPTO determines if
the applied-for trademark is legally protectable and that there is no “likelihood of confusion”
with a previously registered trademark owned by another party.15 If the examining attorney
determines the applied-for mark is registrable, the USPTO publishes the trademark for a limited
opposition period, during which time third parties may file a formal opposition to the registration.
Oppositions are fairly rare, instituted in less than 3% of published applications (Graham et
al., 2013). Unopposed applications for trademarks already in use are issued a U.S. trademark
registration. Allowed intent-to-use applications must first establish commercial use before the
11The U.S. adopted the International Classification of Goods and Services under the Nice Agreement (the
so-called “Nice Classification”) in September 1, 1973. Prior to that date, the USPTO used a U.S. trademark
classification system. Our match is restricted to trademarks registered under the Nice Classification system.12To file based on use in commerce under Trademark Act §1(a), the owner must submit a declaration stating
that the mark is used in the ordinary course of trade in commerce that Congress can regulate, i.e., interstate
commerce or commerce between the U.S. and foreign nations, as of the filing date. See TMEP §901.03. To file
based on intent-to-use under §1(b), the applicant must have a bona fide intention to use the mark in commerce
on the goods and services listed in the application in the near future. See TMEP §1101.13Intent-to-use applications became available to applicants in November 1989 as a result of the Trademark Law
Revision Act of 1988. A small, but growing, minority of applications are filed with the USPTO based on a foreign
application or registration for the same trademark or an extension of an international registration to the U.S.
Authorized by international treaties, such applications can be registered prior to the trademark being used in U.S.
commerce, however, generally only applicants with a foreign “country of origin” can obtain such U.S. trademark
registration. Owners with foreign addresses are excluded from the match with U.S. firm data.14For most of the time period for which the matched data cover, the per class filing fee ranged from $175 to
$375 for a paper filing and $325 to $335 for an electronic filing.15An applied-for trademark can be refused as not registrable if, among other possible grounds, it is generic or
merely descriptive, geographic, a surname, deceptive, a municipal, state, national, or foreign flag or insignia, or
the name, likeness, or signature of a living person used without their consent. 15 U.S.C. §1052. See TMEP §1200.
Examining attorneys search existing registrations and pending applications for similar trademarks and assesses
whether use of the applicant’s trademark on the identified goods or in connection with the identified services is
likely to cause confusion among consumers. 15 U.S. C. §1052(d). See TMEP §1207.
11
applied for mark can be registered.
A trademark owner can renew a U.S. trademark registration indefinitely so long as the trade-
mark is used on the listed goods or in connection with the listed services. The owner must
provide proof of continued use and pay prescribed fees to the USPTO six years after registration
and at each ten-year renewal event.16 Failure to do so results in the registration being canceled.
Data coverage in the TCFD varies over time. Graham, Hancock, Marco, and Myers (2016)
indicate that there is little coverage of classification, prosecution events, and owner records for
trademark registrations issued before 1962.17 The coverage improves for registrations issued
during the period 1962-1977, and there is substantial improvement in coverage for filings and
registrations after 1977. Coverage becomes nearly 100% after 1982. Key data items are populated
at a rate of 89% or more for the period 1977-2015. Fortunately, as discussed below, firm-level
longitudinal micro data is available in the U.S. Census Bureau starting in 1976. Thus, much of
the well-covered 1977-2015 period in the TCFD coincides with the coverage of the data on firm
characteristics. However, left censoring of the firm data at 1976 and relatively lower coverage
of the trademark data before 1977 implies that firms born before 1976 may not match with any
trademark data, even if they applied for or registered a trademark before 1977. Likewise, for
firms born before 1977, there is no way to assess whether a matched trademark filing reflects
the firm’s first trademark application - a key trademark-related event in the life-cycle of firms.
Therefore, the primary focus of the empirical analysis will be on firms that were born in or after
1977.
4.2 Data on firms
The trademark data is matched with the U.S. Census Bureau’s Business Register (BR), which
contains administrative data for the universe of non-farm businesses in the United States. The
BR is also the sampling frame for the Census Bureau’s economic surveys. It contains information
on a firm’s employment, payroll, and revenues, as well as geography and industry classification.
Analysis of firm trademark activity requires longitudinal data to track firms over time and identify
16In the sixth year after the registration date, the trademark owner must maintain the registration by filing
an affidavit or declaration of continued use, provide specimen(s) depicting use in U.S. commerce for the listed
goods and services and pay prescribed fees. 15 U.S.C. §§1058(a)(1). See TMEP §1604. Ten-year renewal terms
were instituted for registrations issued on or after November 16, 1989. Registrations issued prior to that date
had twenty-year terms until the first renewal event following that date. Thus, all live registrations are subject to
ten-year terms as of November 16, 2009. Registrants must pay separate maintenance and renewal fees for each
class in the registration. For most of the time period for which the matched data cover, the fee for (paper or
electronic) filing an affidavit or declaration of use is $100 per class and the fee for (paper or electronic) filing a
renewal application ranged from $300 to $400 per class.17See Table 1 in Graham, Hancock, Marco, and Myers (2016).
12

when in their life-cycle such activity occurs. The Longitudinal Business Database (LBD) provides
a longitudinally linked version of the BR at the establishment level for the period 1976-2014.
The LBD also enables identification of entry and exit of firms and establishments. Since the
LBD coverage starts in 1976, there is no age information for firms established in that year. The
empirical analysis is restricted to firms born in or after 1977 to avoid this censoring in age and
ensure accurate identification of the first occurrence of a trademark filing in a firm’s life-cycle.
The primary measures of firm size used in this paper are employment and revenue. Prior
work, detailed in Haltiwanger, Jarmin, Kulick, and Miranda (2016), has linked observations in
the BR to construct a longitudinal firm revenue database. The analysis here uses this database
to examine the connection between firm revenue growth and trademark filing.
In addition to the BR, the matching process utilizes the Integrated Longitudinal Business
Database (ILBD). Even after matching to the BR, there are many trademark applications in the
TCFD left unmatched with a firm. Many of these trademarks may be owned by non-employer
businesses that do not appear in the BR. The ILBD contains individuals’ income tax records
including Schedule C earnings from an individually-operated business or sole proprietorship.18
The ILBD non-employer universe is used to identify matches for those trademark applications
that were not matched to the employer universe in the BR. These non-employer trademark links
are used primarily to better understand the accuracy of the matching process. Future work will
leverage these links to examine the dynamics of non-employer firms seeking federal trademark
registration.
4.3 Matching process
Because there are no disambiguated identifiers, such as an Employer Identification Number (EIN),
shared between the TCFD and the BR, name and address matching techniques must be applied
to combine the two datasets.19 The TCFD contains over 7.2 million trademark applications and
17.4 million ownership records.20 The universe of TCFD records are filtered to include only the
applications filed in or after 1976 (the beginning of the BR data) and exclude foreign businesses,
federal and state government entities, and all individuals. After imposing these restrictions, there
are over 5 million unique trademark records at risk for a match to the BR and LBD.
The first step of the matching strategy to link the TCFD and BR is to extract all unique
combinations of name and address information from the TCFD. Matching algorithms then clean
18See Davis et al. (2007) and Haltiwanger and Jarmin (2007) for details on the construction of the ILBD.19For a detailed description of the matching methodology see Appendix A.20Ownership records are captured in the TFCD at key points in the trademark’s life-cycle (e.g., filing, publica-
tion, registration, etc.) even if there is no change in ownership. This inflates the number of ownership records in
the TFCD beyond the number of unique trademark application-owner pairs.
13
and standardize the name and address fields in both the TCFD and the BR.21 Once standard-
ized, an initial subset of potentially matching records is identified based on weak match criteria
applied to names only. From this subset, matches of different quality are extracted using various
combinations of fuzzy and exact name and address matching. A string comparator that captures
the similarity of text across fields is used to further refine and subset matches. More than 80% of
matches rely on the business name and three address (street, city, and state) fields — a relatively
strict criteria that tends to yield higher quality matches. Results from the BR match are then
integrated with the LBD. Information from the LBD is leveraged to further refine matches.
A trademark application filing can predate a firm’s entry to the BR, as some firms may
apply for a trademark registration even before they become employers (pay their first wage
or hire their first employee). Thus, trademark applications that do not match to the BR are
matched to the ILBD, the universe of non-employer businesses. For this study, matches to
non-employer businesses are used primarily to better understand the quality of matches to the
employer universe. Future work will investigate the growth and transition dynamics of non-
employer businesses seeking trademark registration.
Ultimately, 83% of trademark records match to the LBD and 2.4% to the ILBD. The LBD
match rate declines over time, falling from 89% in the 1980-1989 registration year period to
73% for the 2010-2014 period. However, the matches become less ambiguous over time. The
share of unique matches rises from 59% in the 1980-1989 registration year period to 88% for
2010-2014. The declining match rate is primarily driven by businesses identified as Limited
Liability Companies (LLCs) in the TCFD. LLCs are one of the fastest growing business types
in the trademark applicant universe and in the general population of firms. To explore the
declining match rate, several hypotheses are investigated, including deteriorating string quality,
a compositional shift in trademark filings towards non-employers, and the growth of informal
business. As detailed in the Data Construction appendix, there is no obvious culprit that can
explain why a declining share of trademark owner records in the TCFD match to the LBD. A
random sample of matches are classified by clerical review as either true or false positives. These
classifications are then used to calculate the precision of the TCFD-LBD matches. The precision
of matches is over 90% and remains stable over time aside from a slight decline to 87% in the
2010-2014 period.
5 Analysis
This section provides a first look at the characteristics of firms seeking federal trademark regis-
tration in the United States based on the constructed data. For the purposes of this paper, a
21Common strings, such as “LLC” and “LTD”, and punctuation, such as “.” and “@”, are removed.
14
“trademark filing firm” is defined as one that has filed an application for a trademark at some
point in its life-cycle. In view of the theoretical motivation, the main goal of the empirical analy-
sis is to understand both selection and treatment effects — how trademark filing firms differ from
those that do not file trademark applications, both before and after their first trademark filing.
At the firm-level, first trademark application is identified by the first ever filing of an application
to register a trademark with the USPTO. The analysis therefore focuses on selection and treat-
ment effects of trademark filing activity via the federal trademark system, and non-trademark
filing firms comprise firms without any trademark applications, regardless of whether they do or
do no own trademarks under common law. While it would be ideal to separate non-trademark
applicants into two subsets, those that own common law trademarks and those that do not, the
lack of comprehensive data on common law trademark rights-holders prevents such differentia-
tion. However, since the dynamics of firms with common law trademark rights would tend to be
more like those of formal trademark filing firms, the inclusion of the former in the non-trademark
filing group would tend to reduce, rather than inflate, selection and treatment effect estimates.
It should also be noted that not all trademark applications mature to registration. Appli-
cations can be abandoned during substantive examination or following allowance for failure to
establish commercial use of the applied for mark or as a result of third-party opposition pro-
ceeding. The analysis presented here focuses on trademark application filing because it is the
first indication of a firm’s intent to register a trademark. It endeavors to fill a gap in the prior
literature regarding which firms seek trademark registration and when in their life-cycle they
enter into this activity. However, because legal benefits accrue from trademark registration, not
application filing, treatment effects would tend to be larger for firms whose applications mature
to registration. Thus, including all trademark filing firms, regardless of whether an application
proceeds to registration, would yield more conservative estimated treatment effects. Subsequent
research will also consider the treatment effects of registration alone.
For the empirical analysis, only firms born in or after 1976 are considered. As discussed
before, this restriction ensures that left-censoring of firm age does not affect results, but it also
renders the age distribution of firms to be heavily skewed towards young firms in the earlier part
of the sample period. The age distribution gradually evolves to be more representative over time.
In particular, in 1977 the only firms in the sample will be new firms born in that year. However,
for any given year 1977, firm age will range from zero (firms born in year ) to − 1977years (firms that were born in 1977 and survived till at least year ). Some of the empirical
analysis considers only the later years of the sample period when the firm age distribution is
more representative. Specifically, the results for = 1997 are presented whenever the analysis
demands a representative firm age distribution.
The analysis focuses on the first ever filing to register a trademark by a firm, regardless of
15

whether the trademark is eventually registered or not. This critical event denotes when in their
life-cycle firms select into the population of firms that apply to register a trademark. In principle,
one can use the filing date variable in the TCFD associated with each trademark application to
identify the timing of the firm’s first trademark activity. However, the process is a bit more
complicated, because there can be several applications for the same trademark corresponding to
use in different classes or on different products within the same class. For instance, a firm may
initially apply to register a trademark for computer hardware services, but may later extend the
same trademark to another product offering, such as customized computer software. For cases
where there is more than one application for a trademark or multiple trademarks, the minimum
filing date across the firm’s portfolio of trademark applications is used to identify the first ever
trademark filing.
5.1 Trends in trademark filing by broad sectors of the economy
To paint a broad picture of trademark filing activity in the United States, consider first some
general patterns of trademark applications across sectors of the economy. Figure 1 shows the
distribution of firms that file to register a trademark for the first time by sector based on their
Standard Industrial Classification. Note that the number of first-time trademark filing firms
grows initially for all sectors starting with the beginning of the sample through the 1990s. This
trend is, in part, driven by the fact that only new and relatively young firms are present in
the sample for the earlier years, as discussed earlier. Since younger firms may have more incen-
tive to apply for trademark registration relative to older counterparts, the number of first-time
trademark filers increase as the stock of young firms initially expands and dominates the sample
age composition. Later in the sample period, the distribution of firm age approaches a more
representative one, and the number of first-time trademark filing firms becomes relatively more
stable in many sectors.
There is a notable expansion of first-time trademark filing by professional services firms,
starting with the 1990s, when the firm age distribution becomes relatively more representative,
and extending through the mid-2000s. Similar growth in first-time filing is evident for whole-
sale firms and, to a limited extent, for retail firms. In contrast, first-time trademark filing by
manufacturing firms has somewhat declined during the same period, likely reflecting the decline
of manufacturing in the U.S. that has accelerated especially in the 2000s. Surprisingly, there
is more entry into trademark filing by wholesale firms compared to retail firms over the sample
period, possibly indicating greater importance of goodwill in business-to-business transactions.
Throughout the sample period, first-time trademark filers in the “Other Firms” category are
both the largest and fastest growing, which is expected given that this category lumps together
16

industries that are likely to be trademark intensive, such as information, education and health
care, entertainment, accommodation and food and other services.22
The dot.com era spike in trademark applications is also clearly visible before 2000, mainly
for professional services firms and “Other Firms”.23 This spike is potentially related to the
proliferation of internet-based commerce and a need to identify and protect brands in cyberspace.
As the 2001 recession hits, first-time trademark filing declines sharply. Thereafter, entry by new
trademark filers increases across sectors, except manufacturing, until the Great Recession in
2007. Overall, first-time trademark filing appears to be pro-cyclical, at least in recent decades.
By the end of the sample in 2013, the largest number of first-time filers are in the “Other Firms”
category, followed by professional services, wholesale, and manufacturing. Among all sectors,
retail has the fewest number of first-time trademark filers as of 2013.
5.2 Who trademarks, when, and how much?
This section examines the patterns of trademark filing by firm size and age, the two key condi-
tioning variables frequently used in the firm dynamics literature. The number of employees and
the age of firms when they first file a trademark application are important in understanding the
potential selection effects of trademarks. This section also explores the intensity of trademark
filing, as measured by the number of trademark applications per firm, and firm size and age.
5.2.1 Firm size, age, and trademark activity
Table 1 presents, by year, the average size (employment) and age of firms that filed for a trade-
mark registration for the first time during the period 1997-2013 (labeled as “Firms with first
TM filing”). It also contains, for comparison, the same statistics for firms that have not filed
to register a trademark as of the specified year (labeled as “Firms with no TM filing”), have at
least one trademark filing up to that year (labeled as “Firms with a TM filing”), and filed for a
new trademark registration in that year (labeled as “Firms with current year TM filing”).
The main message from Table 1 is that first-time trademark filing firms are young but also
large relative to firms that do not seek trademark registration. The average firm age at the time
of the first trademark filing ranges from 4 to 6 for most years included in Table 1, indicating
that many firms that seek trademark registration for the first time do so relatively early in their
life-cycles. The average age of first-time trademark filing firms increases over time. However,
this pattern is evident in each category in Table 1, reflecting, in part, the overall aging of the
22“Other Firms” category include the firms classified in the industries outside of manufacturing, retail, wholesale
and professional services. See Table 2 for a list of all industries.23These trends are also seen in High Tech industries, where young firm activity surged in the 1990s and then
collapsed after 2001. See Goldschlag and Miranda (2015) for details.
17
U.S. firm population as a result of the persistent decline in new firm entry — a trend extensively
documented in recent research.24 The rise in mean age over time is also driven by the fact that
firms in the analysis get older as one moves further away from the initial year of the sample
(1997).
The first-time trademark filers are also relatively large. For instance, in 1997, firms that first
filed to register a trademark had an average of roughly 76 employees, nearly 8 times the average
employment of firms that had no trademark applications. This gap narrows in subsequent years,
mainly because the average size of first-time trademark filing firms declines while that of non-
trademark filing firms is largely constant. Still, in 2013, the average employment of first-time
trademark filers was roughly 58, about 6 times that of firms with no trademark filings.
Table 1 also shows that firms that have filed for at least one trademark (“Firms with a TM
filing”) are larger and older than the firms that do not apply for trademark registration. Likewise,
firms that apply to register additional trademarks in any given year (“Firms with current year
TM filing”) are much larger than non-trademark filing firms, but also tend to outsize firms that
have at least one trademark application. Interestingly, these firms that continue to build their
trademark portfolios tend to be younger than firms with some trademark filing activity. One
interpretation of this result is that firms that continue to seek trademark registration are mostly
large and successful companies that expand their scale and scope by introducing new products
and services under the brand name and goodwill already established.
The patterns in Table 1 are also apparent by sector. Table 2 presents the average firm size
and age for the panel of trademark and non-trademark filing firms across all years in the 1997-
2013 period. In each sector, firms that apply to register a trademark for the first time are,
on average, much larger than firms that do not seek trademark registration. The difference in
average size is the largest in agriculture, mining, and utilities, where first-time trademark filing
firms maintain 16 times more employees, on average. The smallest difference is in retail, where
the average employment of first-time filers is more than double that of non-trademark filing
firms. Sector-level differences in average firm age also mirror the pattern found for the general
population of firms in Table 1. Across sectors, first-time trademark filing firms are, on average,
2.5 years younger than the firms without trademark applications. The largest age disparity is in
manufacturing, where first-time filers are nearly 5 years younger, on average, than firms that do
not apply for trademark registration. In construction, transportation, and warehousing, however,
the difference in average age between first-time filers and non-trademark filing firms is only 0.5
years.
Across sectors, firms that have at least one trademark application and those that apply to
register additional trademarks are, on average, 10 and 25 times larger, respectively, than firms
24See, e.g., Decker, Haltiwanger, Jarmin and Miranda (2016).
18
that do not seek trademark registration. Again, the largest differences in average employment
are in agriculture, mining, and utilities as well as finance and real estate.
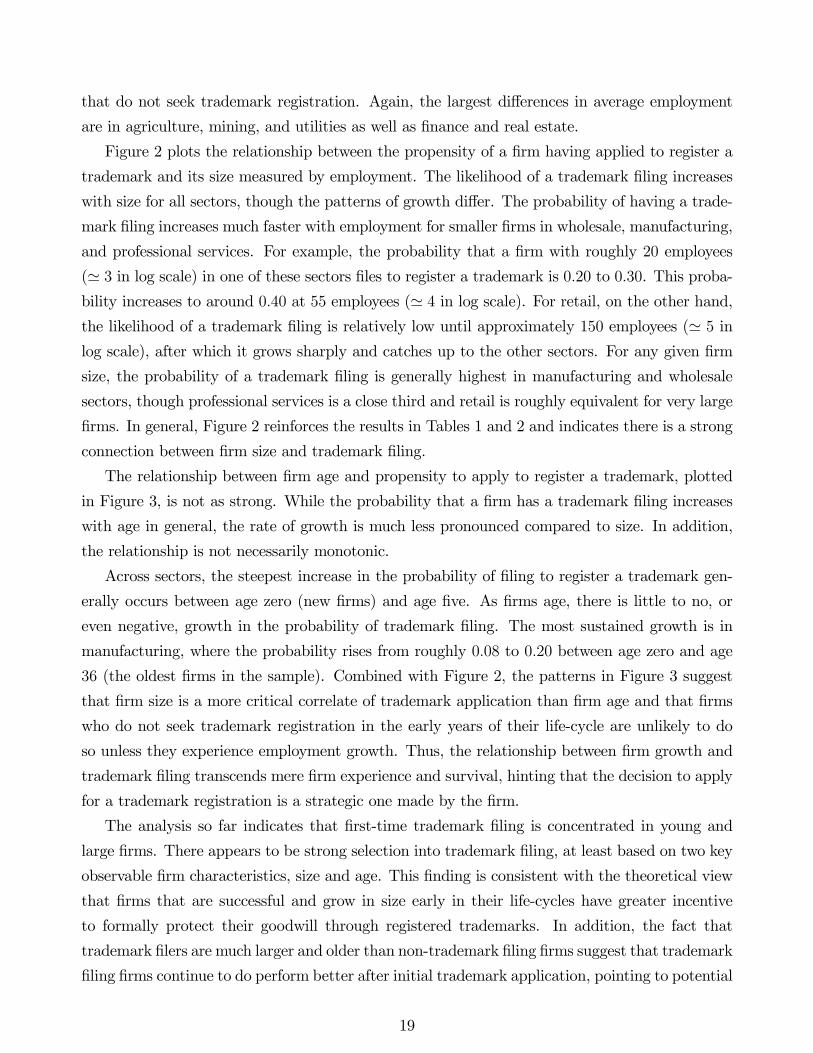
Figure 2 plots the relationship between the propensity of a firm having applied to register a
trademark and its size measured by employment. The likelihood of a trademark filing increases
with size for all sectors, though the patterns of growth differ. The probability of having a trade-
mark filing increases much faster with employment for smaller firms in wholesale, manufacturing,
and professional services. For example, the probability that a firm with roughly 20 employees
(' 3 in log scale) in one of these sectors files to register a trademark is 020 to 030. This proba-bility increases to around 040 at 55 employees (' 4 in log scale). For retail, on the other hand,the likelihood of a trademark filing is relatively low until approximately 150 employees (' 5 inlog scale), after which it grows sharply and catches up to the other sectors. For any given firm
size, the probability of a trademark filing is generally highest in manufacturing and wholesale
sectors, though professional services is a close third and retail is roughly equivalent for very large
firms. In general, Figure 2 reinforces the results in Tables 1 and 2 and indicates there is a strong
connection between firm size and trademark filing.
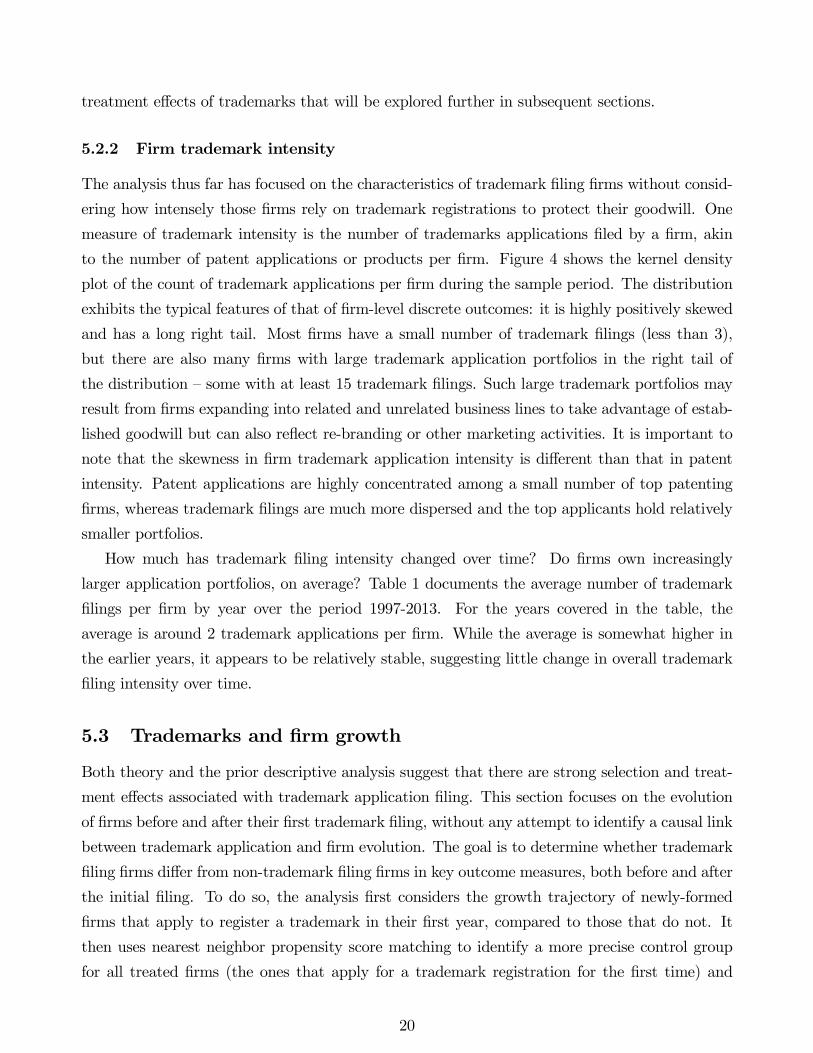
The relationship between firm age and propensity to apply to register a trademark, plotted
in Figure 3, is not as strong. While the probability that a firm has a trademark filing increases
with age in general, the rate of growth is much less pronounced compared to size. In addition,
the relationship is not necessarily monotonic.
Across sectors, the steepest increase in the probability of filing to register a trademark gen-
erally occurs between age zero (new firms) and age five. As firms age, there is little to no, or
even negative, growth in the probability of trademark filing. The most sustained growth is in
manufacturing, where the probability rises from roughly 008 to 020 between age zero and age
36 (the oldest firms in the sample). Combined with Figure 2, the patterns in Figure 3 suggest
that firm size is a more critical correlate of trademark application than firm age and that firms
who do not seek trademark registration in the early years of their life-cycle are unlikely to do
so unless they experience employment growth. Thus, the relationship between firm growth and
trademark filing transcends mere firm experience and survival, hinting that the decision to apply
for a trademark registration is a strategic one made by the firm.
The analysis so far indicates that first-time trademark filing is concentrated in young and
large firms. There appears to be strong selection into trademark filing, at least based on two key
observable firm characteristics, size and age. This finding is consistent with the theoretical view
that firms that are successful and grow in size early in their life-cycles have greater incentive
to formally protect their goodwill through registered trademarks. In addition, the fact that
trademark filers are much larger and older than non-trademark filing firms suggest that trademark
filing firms continue to do perform better after initial trademark application, pointing to potential
19
treatment effects of trademarks that will be explored further in subsequent sections.
5.2.2 Firm trademark intensity
The analysis thus far has focused on the characteristics of trademark filing firms without consid-
ering how intensely those firms rely on trademark registrations to protect their goodwill. One
measure of trademark intensity is the number of trademarks applications filed by a firm, akin
to the number of patent applications or products per firm. Figure 4 shows the kernel density
plot of the count of trademark applications per firm during the sample period. The distribution
exhibits the typical features of that of firm-level discrete outcomes: it is highly positively skewed
and has a long right tail. Most firms have a small number of trademark filings (less than 3),
but there are also many firms with large trademark application portfolios in the right tail of
the distribution — some with at least 15 trademark filings. Such large trademark portfolios may
result from firms expanding into related and unrelated business lines to take advantage of estab-
lished goodwill but can also reflect re-branding or other marketing activities. It is important to
note that the skewness in firm trademark application intensity is different than that in patent
intensity. Patent applications are highly concentrated among a small number of top patenting
firms, whereas trademark filings are much more dispersed and the top applicants hold relatively
smaller portfolios.
How much has trademark filing intensity changed over time? Do firms own increasingly
larger application portfolios, on average? Table 1 documents the average number of trademark
filings per firm by year over the period 1997-2013. For the years covered in the table, the
average is around 2 trademark applications per firm. While the average is somewhat higher in
the earlier years, it appears to be relatively stable, suggesting little change in overall trademark
filing intensity over time.
5.3 Trademarks and firm growth
Both theory and the prior descriptive analysis suggest that there are strong selection and treat-
ment effects associated with trademark application filing. This section focuses on the evolution
of firms before and after their first trademark filing, without any attempt to identify a causal link
between trademark application and firm evolution. The goal is to determine whether trademark
filing firms differ from non-trademark filing firms in key outcome measures, both before and after
the initial filing. To do so, the analysis first considers the growth trajectory of newly-formed
firms that apply to register a trademark in their first year, compared to those that do not. It
then uses nearest neighbor propensity score matching to identify a more precise control group
for all treated firms (the ones that apply for a trademark registration for the first time) and
20
more closely examines the treatment effects associated with first-time trademark filing. It should
be noted, however, that the matching estimator does not eliminate concerns due to unobserved
characteristics of treated firms.
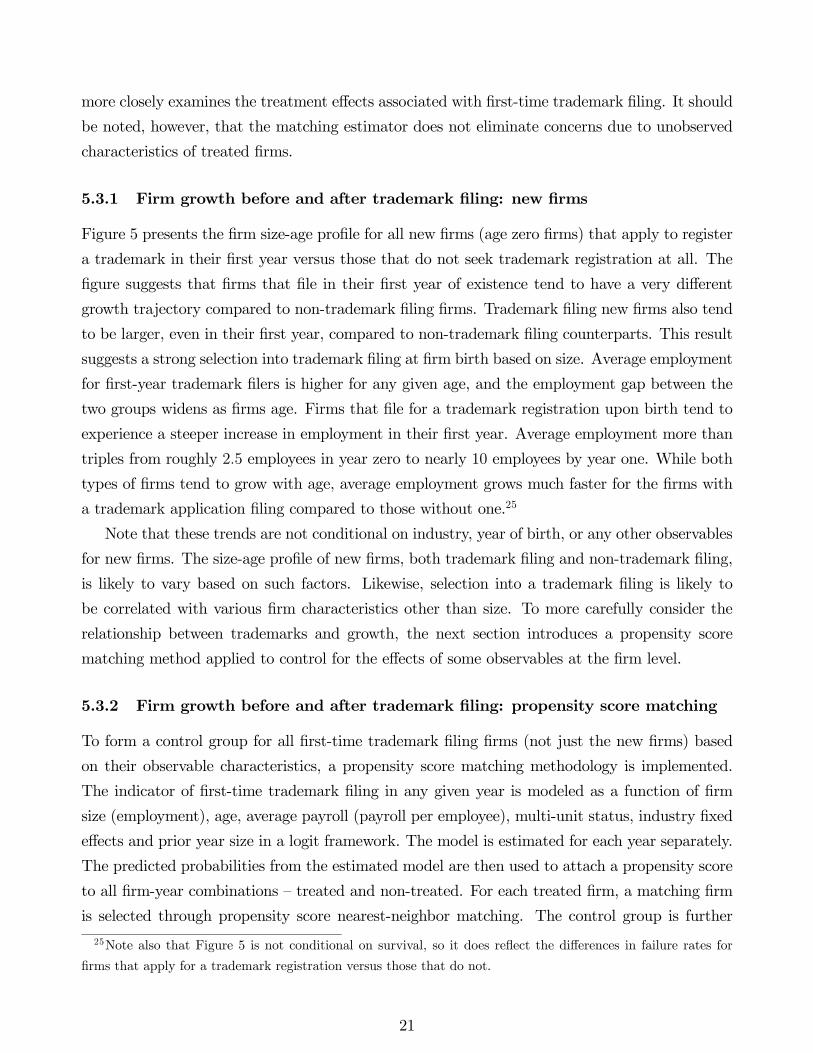
5.3.1 Firm growth before and after trademark filing: new firms
Figure 5 presents the firm size-age profile for all new firms (age zero firms) that apply to register
a trademark in their first year versus those that do not seek trademark registration at all. The
figure suggests that firms that file in their first year of existence tend to have a very different
growth trajectory compared to non-trademark filing firms. Trademark filing new firms also tend
to be larger, even in their first year, compared to non-trademark filing counterparts. This result
suggests a strong selection into trademark filing at firm birth based on size. Average employment
for first-year trademark filers is higher for any given age, and the employment gap between the
two groups widens as firms age. Firms that file for a trademark registration upon birth tend to
experience a steeper increase in employment in their first year. Average employment more than
triples from roughly 25 employees in year zero to nearly 10 employees by year one. While both
types of firms tend to grow with age, average employment grows much faster for the firms with
a trademark application filing compared to those without one.25
Note that these trends are not conditional on industry, year of birth, or any other observables
for new firms. The size-age profile of new firms, both trademark filing and non-trademark filing,
is likely to vary based on such factors. Likewise, selection into a trademark filing is likely to
be correlated with various firm characteristics other than size. To more carefully consider the
relationship between trademarks and growth, the next section introduces a propensity score
matching method applied to control for the effects of some observables at the firm level.
5.3.2 Firm growth before and after trademark filing: propensity score matching
To form a control group for all first-time trademark filing firms (not just the new firms) based
on their observable characteristics, a propensity score matching methodology is implemented.
The indicator of first-time trademark filing in any given year is modeled as a function of firm
size (employment), age, average payroll (payroll per employee), multi-unit status, industry fixed
effects and prior year size in a logit framework. The model is estimated for each year separately.
The predicted probabilities from the estimated model are then used to attach a propensity score
to all firm-year combinations — treated and non-treated. For each treated firm, a matching firm
is selected through propensity score nearest-neighbor matching. The control group is further
25Note also that Figure 5 is not conditional on survival, so it does reflect the differences in failure rates for
firms that apply for a trademark registration versus those that do not.
21
restricted to matching firms of the same age as the treated firm in the year of first trademark
filing. In some cases, this process yields more than one match for each treated firm. The analysis
proceeds with weights, when needed, to account for multiple matches.
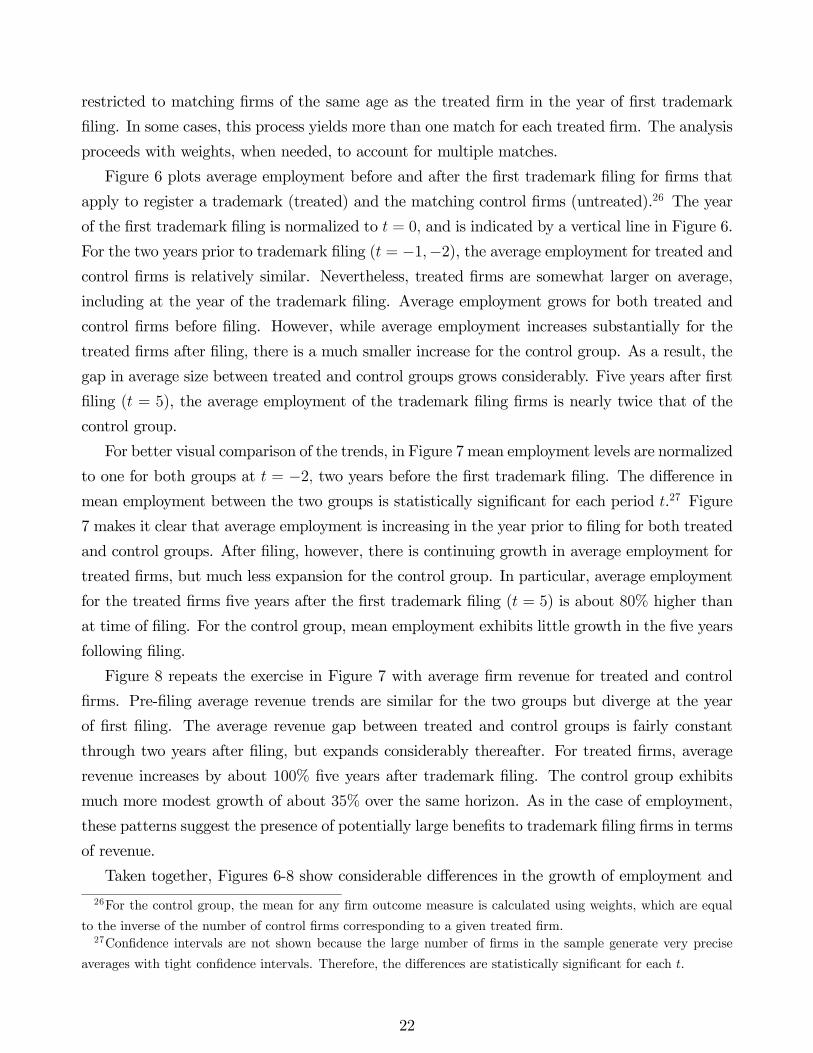
Figure 6 plots average employment before and after the first trademark filing for firms that
apply to register a trademark (treated) and the matching control firms (untreated).26 The year
of the first trademark filing is normalized to = 0 and is indicated by a vertical line in Figure 6.
For the two years prior to trademark filing ( = −1−2), the average employment for treated andcontrol firms is relatively similar. Nevertheless, treated firms are somewhat larger on average,
including at the year of the trademark filing. Average employment grows for both treated and
control firms before filing. However, while average employment increases substantially for the
treated firms after filing, there is a much smaller increase for the control group. As a result, the
gap in average size between treated and control groups grows considerably. Five years after first
filing ( = 5), the average employment of the trademark filing firms is nearly twice that of the
control group.
For better visual comparison of the trends, in Figure 7 mean employment levels are normalized
to one for both groups at = −2 two years before the first trademark filing. The difference inmean employment between the two groups is statistically significant for each period .27 Figure
7 makes it clear that average employment is increasing in the year prior to filing for both treated
and control groups. After filing, however, there is continuing growth in average employment for
treated firms, but much less expansion for the control group. In particular, average employment
for the treated firms five years after the first trademark filing ( = 5) is about 80% higher than
at time of filing. For the control group, mean employment exhibits little growth in the five years
following filing.
Figure 8 repeats the exercise in Figure 7 with average firm revenue for treated and control
firms. Pre-filing average revenue trends are similar for the two groups but diverge at the year
of first filing. The average revenue gap between treated and control groups is fairly constant
through two years after filing, but expands considerably thereafter. For treated firms, average
revenue increases by about 100% five years after trademark filing. The control group exhibits
much more modest growth of about 35% over the same horizon. As in the case of employment,
these patterns suggest the presence of potentially large benefits to trademark filing firms in terms
of revenue.
Taken together, Figures 6-8 show considerable differences in the growth of employment and
26For the control group, the mean for any firm outcome measure is calculated using weights, which are equal
to the inverse of the number of control firms corresponding to a given treated firm.27Confidence intervals are not shown because the large number of firms in the sample generate very precise
averages with tight confidence intervals. Therefore, the differences are statistically significant for each
22
revenue for trademark filing firms compared to their matched controls for both pre- and post-filing
periods. Pre-filing patterns suggest the potential presence of selection based on unobservables
not accounted for in propensity score matching, as treated firms tend to be somewhat larger on
average than the controls — though the difference is not substantial. Post-filing patterns also
indicate the likely presence of trademark treatment effects. Treated and control firms diverge
substantially in terms of average employment and revenue after first trademark filing. The gap
in mean employment and revenue between the two groups expands noticeably after two years
post-filing. This pattern may simply reflect application pendency at USPTO or suggest that
some effects of trademark filing are more gradual and take time to emerge.28
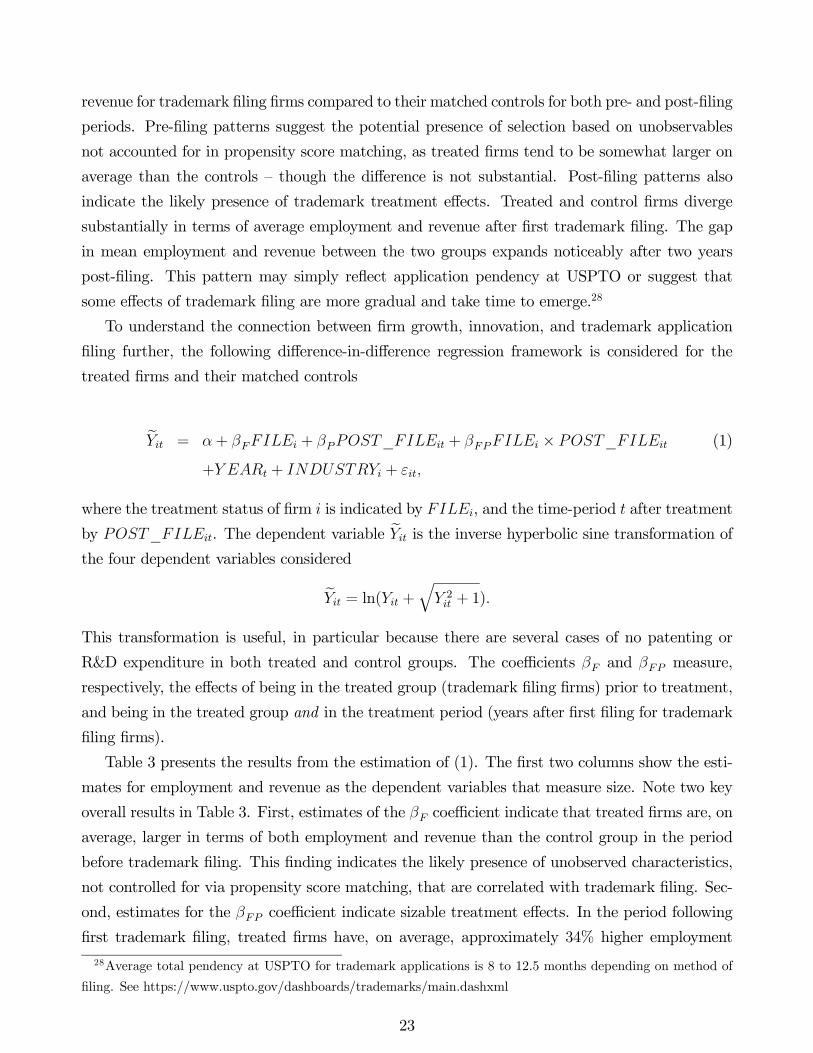
To understand the connection between firm growth, innovation, and trademark application
filing further, the following difference-in-difference regression framework is considered for the
treated firms and their matched controls
e = + + _ + × _ (1)
+ + +
where the treatment status of firm is indicated by , and the time-period after treatment
by _. The dependent variable e is the inverse hyperbolic sine transformation ofthe four dependent variables considered
e = ln( +q 2 + 1)
This transformation is useful, in particular because there are several cases of no patenting or
R&D expenditure in both treated and control groups. The coefficients and measure,
respectively, the effects of being in the treated group (trademark filing firms) prior to treatment,
and being in the treated group and in the treatment period (years after first filing for trademark
filing firms).
Table 3 presents the results from the estimation of (1). The first two columns show the esti-
mates for employment and revenue as the dependent variables that measure size. Note two key
overall results in Table 3. First, estimates of the coefficient indicate that treated firms are, on
average, larger in terms of both employment and revenue than the control group in the period
before trademark filing. This finding indicates the likely presence of unobserved characteristics,
not controlled for via propensity score matching, that are correlated with trademark filing. Sec-
ond, estimates for the coefficient indicate sizable treatment effects. In the period following
first trademark filing, treated firms have, on average, approximately 34% higher employment
28Average total pendency at USPTO for trademark applications is 8 to 12.5 months depending on method of
filing. See https://www.uspto.gov/dashboards/trademarks/main.dashxml
23
and 24% greater revenue compared to the control group.29 Overall, the results of the regression
analysis for employment and revenue suggest that there are significant selection and treatment
effects associated with first trademark filing. These effects will be investigated in further detail
in future work.30
5.4 Trademarks and innovative activity
Next, consider the firm-level connection between different types of innovative activity and trade-
mark applications. The theoretical motivation in Section 3 suggests that investments in goodwill
accumulation and innovation can be complements. An implication is that measures of these two
types of investments should be correlated to some degree at the firm level. The next section
explores the co-presence of trademark applications and innovative investment, as measured by
R&D, and innovative output, as measured by patents. It also examines the timing of the first
trademark filing relative to that of R&D expenditures and patenting.
The patent data is derived from patent-firm linked data from the U.S. Census Bureau, which
combines the Longitudinal Business Database with the USPTO’s patent database.31 The firm-
level R&D data is sourced from the Standard Industrial Research & Development Survey (SIRD)
and Business R&D and Innovation Survey (BRDIS), conducted by the U.S. Census Bureau for
the National Science Foundation.32 While the patent and trademark data pertains to the entire
set of firms observed in the LBD, R&D expenditure data is only available for firms sampled
in the SIRD and BRDIS. To analyze the trademark filing and patent application activity by
R&D performing firms, the sample is therefore restricted to those firms that reported some or no
R&D activity in the SIRD and BRDIS. While the survey, combined with the survey weights, is
intended to be nationally representative, the raw (unweighted) firm counts, which tend to skew
heavily towards R&D performing firms, are used.
29Note that (1) implies that the percent change in ( +p 2 + 1) for the treated group in the treatment
period can be estimated as 100³exp(b )− 1´ For not too small, the last estimate also approximates the
percent change in due to a change in × _ from 0 to 1 because +p 2 + 1 ' 2 —
for not too small.30In particular, more stringent matching processes will be explored to understand whether the control group
can match the treatment group better during the pre-treatment period. This exercise will further clarify whether
the differences in the pre-treatment period between the treated and control groups are due to unobserved char-
acteristics of the treated firms or can be eliminated with further refinement of the matching process.31See Graham, Grim, Islam, Marco, and Miranda (2015). Their work has been extended to include patenting
activity by firms from 2011 onwards.32See Foster, Grim, and Zolas (2016) for more details on this survey and the characteristics of R&D performing
firms.
24

5.4.1 Firm-level correlation and relative timing of R&D, patents, and trademark
filings
Table 4 presents information on the co-presence of innovative activity among trademark filing
firms. It shows the fraction of firms with patent applications and R&D activity for firms who
have filed for a trademark registration and all firms in the U.S.. The share of trademark filers
with patenting and/or R&D activity remains relatively small (between 8-9% of trademark filing
firms own at least 1 patent application and 3-7% perform R&D). However, Table 4 indicates that
trademark filing firms are 15 to 20 times more likely to file for a patent or performR&D, compared
to a typical U.S. firm. From the perspective of better measuring firm innovation, this result is
encouraging. To the extent that trademark data captures forms of innovation not typically
accounted for by patents, this finding suggests that broadening the definition of innovating firms
to include trademark filing firms can enhance the identification of the innovative segment of the
firm population. On the other hand, if most trademarks are used merely to differentiate largely
homogeneous products rather than introduce true product or process innovations, trademark
filing firms may contribute little to the understanding of innovative activity by firms.
The picture is very different when considering the co-presence of trademarks filings among
patent applicants and R&D active firms. Among the firms which have filed for a patent or
performed R&D, Table 5 suggests that the majority have applied for at least one trademark
registration, with the rate steadily rising over time. Among patent filing firms, 55% had applied
for at least one trademark registration in 1997, with this figure rising to nearly 72% in 2011.
Among R&D performing firms, 52% had filed for at least one trademark registration in 1997, and
as high as 68% had done so in 2011. More interesting, however is the change in the proportion
of R&D performing firms seeking patents versus trademark registrations. In 1997, more than
61% of R&D performing firms filed for at least one patent (versus the 52% that applied for at
least one trademark registration). By 2011, the balance of innovative output changed, where
only 50% of R&D performing firms filed for at least one patent (versus the 68% that applied for
at least one trademark registration). From an innovation measurement perspective, this reversal
in output among R&D performing firms supports the notion that, for at least a subset of firms,
trademarks may capture innovative outputs of R&D investment not accounted for by patents.
Combined, Tables 4 and 5 hint that trademark filing may be a precursor to innovative activity
in the form of patenting or R&D, with trademark registration growing in importance amongst
innovative firms. This lends some support to the theoretical argument that firms that engage in
patent and R&D also invest in protecting the gains from innovation — potentially in the form of
a higher quality product, better reputation, or larger customer base.
Figure 9 shows the distribution of firms based on the timing of patent and R&D activity
25

relative to the first trademark application filing. Each bar indicates the proportion of patent and
trademark filers as a function of the date of their first patent filing relative to the date of the
first trademark filing. The timing of patent activity relative to the timing of trademark activity
is grouped into 5-year bins before and after time 0 — the reference point that indicates the firm
filed for its first patent in the same year it filed for its first trademark registration. Nearly 10% of
patent and trademark filers filed for their first patent and trademark registration in the same year.
Approximately 25% of patent and trademark filers filed for their first patent 1-5 years after their
first trademark filing, and around 17% filed for their first patent in the 1-5 years prior to their first
trademark application. In fact, almost 50% of firms with both patent and trademark applications
filed for their first patents and trademark registrations within a 5-year window, which strongly
supports the notion that the two activities are intertwined. With respect to the overall timing of
the two activities, in the majority of cases (59%) the first trademark application filing leads or
coincides with the first patent filing. This result lends some support to the theoretical argument
that firms that trademark also invest the returns from accumulated goodwill into product and
process innovation.
5.4.2 Patenting and R&D spending before and after trademark filing
This section analyzes further the link between trademarks and innovation by examining issued
patents and R&D expenditures by trademark filing firms before and after their first trademark
filing compared a control group. It utilizes the same control group of non-trademark filing firms
identified via propensity score matching as in the analysis of employment and revenue above.
Figure 10 plots the average number of patents before and after first trademark filing for firms
that apply to register trademarks (treated) and the matching control firms (untreated). Mean
patenting counts are again normalized to one for both groups at = −2 two years before thefirst trademark filing. Trends in average patenting leading up to trademark filing are somewhat
different. Average patenting increases for both groups in the year prior to filing. However,
while the treated group exhibits a large increase in the year of filing, the control group’s average
patenting declines. After filing, average patenting grows at a similar rate for both treated and
control firms, though the gap does expand after two years post-filing. Between = 2 and = 5
growth in the average number of patents is about 30% for the treated firms, compared to only
about 15% for the control group.
The difference-in-difference model specified in (1) is used to analyze innovative activity for
treated and control groups before and after the first trademark application. The last two columns
of Table 3 report the estimation results for R&D expenditures and the number of issued patents
as the dependent variables. For both the R&D expenditures and the number of patents, the
treatment group has higher values for the pre-filing period, as indicated by the estimated value
26
of . As in the case of employment and revenue, this finding suggests the likely presence
of unobserved factors that result in higher patent and R&D activity for treated firms prior to
trademark filing. In the post-filing period, average R&D expenditure and patenting by treated
firms is higher than those by control firms, as the estimated values of suggest.
Overall, the results suggest that both selection and treatment effects associated with trade-
mark filing are relevant for understanding firm-level innovative activity, as the theory suggests.
Further investigation of both of these effects with a more stringent matching process to obtain a
control group is left for future work.
6 Conclusion
The progress of empirical research on trademark activity by U.S. firms has been largely hampered
by the lack of comprehensive firm-trademark linked data. This paper reports on the construction
of a new firm-level longitudinal dataset that allows for the tracking of trademark filing activity
over the life-cycle of a firm. The dataset brings together the USPTO’s Trademark Case Files
Dataset and the U.S. Census Bureau’s Business Register and the Longitudinal Business Database
for the period 1976-2014. Using the linked dataset, it is possible to identify if, and when, a firm
first applies for a trademark. This key event is then tied to firm characteristics and dynamics
to understand the nature of selection associated with trademark filing, as well as the treatment
effects related to a trademark application.
The data is used to examine how firm employment, revenue, R&D expenditures, and patent-
ing change after a firm’s first trademark filing compared to their pre-filing levels. The analysis
suggests the potential presence of strong selection and treatment effects associated with trade-
marks. Compared to the general population of firms, first-time trademark filers tend to be
younger and larger firms. In addition, an initial analysis using a propensity score matching ex-
ercise indicates that average firm employment and revenue tend to be higher for firms after they
file for their first trademark, compared to a control group. For first-time trademark filing firms,
both patenting and R&D activity are also higher after the filing, again, compared to a control
group.
The results also indicate that, while most of the firms that have applied for a trademark
registration do not engage in innovative activity as measured by patent filings or grants, the
proportion of trademark filing firms with a patent application is significantly higher than that of
all firms. To the extent trademarks capture firm-level innovative activity not accounted for by
patents, the relatively small presence of patents in trademark filing firms and the co-presence of
trademark applications and R&D expenditure without any patenting is encouraging in terms of
broadening the definition of the innovative segment of firms in the economy beyond simply those
27

that have patents. Nevertheless, a sizable fraction of firms with patents and R&D activity also
tend to have trademark applications. This may indicate that trademark registrations are used
by innovative firms to protect the potential gains from innovation. However, the reverse may
also be true. Where trademark filing proceeds patent and R&D activity, firms may be investing
the gains from accumulated goodwill into product and process innovation.
The trademark-firm linked dataset opens up several possibilities for future research. For
instance, there is a large body of work in the marketing literature for which the dataset is highly
relevant. The theoretical literature emphasize a connection between trademarks and customer
acquisition and loyalty-building by firms. Various models focus on the role of trademarks in
reducing consumer search and switching costs, establishing brand loyalty and goodwill, and
signalling quality.33 In general, by protecting a firm’s investments in marketing and reputation-
building, trademarks can lead to higher intensity of advertising and marketing expenditures,
as trademark registrants can better appropriate the benefits from such expenditures. The new
dataset can be instrumental in testing some of these theoretical implications.
There is also more to explore regarding the connection between trademarks and firm scale
and scope. In particular, the role of trademark registration in new product introductions and
changes in a firm’s product portfolio can be examined. For instance, using changes in the
narrowly-defined industry classifications for a firms’ products before and after trademark filing,
one can investigate whether trademark registrations facilitate scope expansion into products that
are not closely related to a firm’s core product portfolio.
Another avenue of research that can benefit from the new dataset is the valuation of trade-
marks. The dataset allows for the observation of first trademark registration by a firm, as well as
its subsequent trademark registrations, and trademark reassignments. Reputation indicated by a
trademark is a valuable asset that needs to be protected.34 A reputable name or mark can also be
traded.35 The information contained in the trademark applications and assignments can be used,
in conjunction with measures of firm value, to attach valuations to trademarks. In addition, the
oppositions placed against a trademark filing and the resulting procedural outcomes observed
in the dataset can be used to measure the inherent value of certain trademarks, as oppositions
would be unlikely if the trademark was of little value.
33See, e.g., Landes and Posner (1987,1988) and Economides (1988) for theoretical arguments on the connection
between trademarks and consumer behavior. For recent models of firm dynamics under costly and gradual
customer acquisition, see Dinlersoz and Yorukoglu (2012) and Gourio and Rudanko (2014).34See Cabral (2005) for a review of the theoretical literature on the economics of reputation. See also Cabral
and Hortacsu (2010) and Cabral (2012) for studies of reputation on the Internet.35See Tadelis (1999) for a theoretical analysis of reputation as a tradeable asset.
28

References
[1] Arora, Ashish, Bei, Xiaoshu, and Wesley M. Cohen. 2016. “Why Firms Trademark (or not):
Evidence from the U.S. Trademark Data”, Working paper, Duke University.
[2] Baroncelli, Eugenia, Carsten Fink, and Beata S. Javorcik. 2005. “The Global Distribution
of Trademarks: Some Stylized Facts.” The World Economy, 28: 765-782.
[3] Block, Jorn, Christian Fisch, Alexander Hahn, Philipp Sandner. 2015. “Why do SMEs File
Trademarks? Insights from Firms in Innovative Industries”, Research Policy, 44: 1915-1930.
http://dx.doi.org/10.1016/j.respol.2015.06.007.
[4] Cabral, Luis. 2012. “Reputation on the Internet”, in M. Peitz and J. Waldfogel (Eds), The
Oxford Handbook of the Digital Economy, Oxford, UK: OUP, 343-354.
[5] Cabral, Luis, and Ali Hortacsu. 2010. “The Dynamics of Seller Reputation: Evidence from
eBay”, Journal of Industrial Economics, 58: 54-78.
[6] Cabral, Luis. 2005. “The Economics of Trust and Reputation: A
Primer”, Monograph in progress, New York University (available at
http://pages.stern.nyu.edu/~lcabral/reputation/Reputation_June05.pdf)
[7] Decker, Ryan, John Haltiwanger, Ron S. Jarmin, and Javier Miranda. 2016. “Where Has
All the Skewness Gone? The Decline in High-Growth (Young) Firms in the U.S.”, European
Economic Review, 86: 4-23.
[8] Davis, Steven, John Haltiwanger, Ron Jarmin, C.J. Krizan, Javier Miranda, Al Nucci and
Kristen Sandusky. 2007. “Measuring the Dynamics of Young and Small Businesses: Inte-
grating the Employer and Nonemployer Universes firms” NBER Working Paper No. 13226.
[9] Davis, Steven, Haltiwanger, John, and Scott Schuh. 1996. Job Creation and Destruction.
Cambridge, MA: The MIT Press.
[10] Dinlersoz, Emin, and Mehmet Yorukoglu. 2012. “Information and Industry Dynamics”,
American Economic Review, 102: 884-913.
[11] Economides, Nicolas. 1988. “The Economics of Trademarks”, The Trademark Reporter, 78:
523-539.
[12] Fazio, Catherine, Jorge Guzman, Fiona E. Murray, and Scott Stern. 2016. “A New View
of the Skew: A Quantitative Assessment of the Quality of American Entrepreneurship”, In
Kauffman Foundation New Entrepreneurial Growth, Kansas City, MO: February 2016.
29
[13] Flikkema, Meindart, Ard-Pieter De Man, Carolina Castaldi. 2014. “Are Trademark Counts
a Valid Indicator of Innovation? Results of an In-Depth Study of New Benelux Trademarks
Filed by SMEs”, Industry and Innovation, 21: 310-331.
[14] Foster, Lucia, Grim, Cheryl, and Nikolas Zolas. 2016. “A Portrait of Firms that Invest in
R&D.” U.S. Census Bureau Center for Economic Studies Paper No. CES-WP-16-41.
[15] Goldschlag, Nathan and Javier Miranda. 2016. “Business Dynamics Statistics of High Tech
Industries”, U.S. Census Bureau Center for Economic Studies Paper No. CES-WP- 16-55.
[16] Gourio, Francois and Leena Rudanko. 2014. “Customer Capital”, Review of Economic Stud-
ies, 81, Vol. 3.
[17] Graham, Stuart, Galem Hancock, Alan Marco, and Amanda F. Myers. 2016. The USPTO
Trademark Case Files Dataset: Descriptions, Lessons, and Insights.
[18] Graham, Stuart, Grim, Cheryl, Islam, Tariq, Marco, Alan, and Javier Miranda. 2015. “Busi-
ness dynamics of innovating firms: linking U.S. patent data with administrative data on
workers and firms” Working paper CES-WP-15-19, Center for Economic Studies, U.S. Cen-
sus Bureau.
[19] Greenhalgh, C., M. Longland, and D. Bosworth. 2003. “Trends and Distribution of Intellec-
tual Property: U.K. and European Patents and U.K. Trade and Service Marks, 1986-2000.”
Report for the U.K. Intellectual Property Office.
[20] Greenhalgh, C., and M. Rogers. 2008. “Intellectual Property Activity by Service Sector
and Manufacturing Firms in the U.K., 1996-2000.” The Evolution of Business Knowledge,
Oxford University Press.
[21] Haltiwanger, John, and Ron Jarmin. 2007. “Integrated Longitudinal Business Database:
Data Overview.” 2007 Kauffman Symposium on Entrepreneurship and Innovation Data
[22] Haltiwanger, John, Jarmin, Ron, Kulick, Robert, and Javi Miranda. 2016. “High Growth
Young Firms: Contributions to Job, Output, and Productivity Growth”, forthcoming in
Measuring Entreprenurial Businesses: Current Knowledge and Challenges, NBER Book
Series Studies in Income and Wealth.
[23] Heath, Davidson and Christopher Mace. 2017. “What’s a Brand Worth? Trademark Pro-
tection, Profits and Product Quality”, Working Paper, University of Utah.
[24] Jensen, P. H. and E. Webster. 2004. “Patterns of Trademarking Activity in Australia.”
Australian Intellectual Property Journal, 15: 112-126.
30

[25] Jensen, P. H. and E. Webster. 2006. “Firm Size and the Use of Intellectual Property Rights.”
Economic Record, 82: 44-55.
[26] Landes, William, and Richard Posner. 2003. The Economic Structure of Intellectual Property
Law. Cambridge, Mass.: Harvard University Press.
[27] Landes, William and Richard Posner. 1988. “The Economics of Trademark Law,” The Trade-
mark Reporter, 78: 267-306.
[28] Landes, William and Richard Posner. 1987. “Trademark Law: An Economic Perspective,”
Journal of Law and Economics, 30: 265-309.
[29] Sandner, Philipp. 2009. “The Identification of Trademark Filing Strategies: Creating, Hedg-
ing, Modernizing, and Extending Brands.” The Trademark Reporter, 99: 1257-1298.
[30] Sandner, Phillipp and Joern Block. 2011. “The Market Value of R&D, Patents, and Trade-
marks.” Research Policy, 40: 969-985.
[31] Tadelis, Steve. (1999), “What’s in a Name? Reputation as a Tradeable Asset”, American
Economic Review, 89: 548—563.
[32] Zolas, Nikolas, Lybbert, Travis, and Prantik Battacharyya. 2016. “An ‘Algorithmic Links
with Probabilities’ Concordance for Trademarks with an Application Towards Bilateral IP
Flows”, forthcoming in The World Economy, doi: 10.1111/twec.12382.
31
A Data construction
Because there are no disambiguated identifiers, such as an Employer Identification Number (EIN),
that are shared between the TCFD and the BR, the two datasets have to be brought together
using name and address matching techniques. The current matching effort is focused on match-
ing domestic businesses observed in the trademark ownership database to the employer firm
universe. Future work will incorporate businesses found in the trademark assignments database,
which captures the transfer of trademarks between businesses, foreign trademark filing firms with
domestic establishments, and non-employer trademark filing firms. The final output of matching
methodology will be firm-level links between Census Bureau data and records in the TCFD.
The input frame for the matching process is the ownership databases in the TCFD. Several
conditions are used to subset the raw owner file records that will be considered for matching to
the BR. First, the filing, registration, and publication dates are used to exclude all trademarks
for which the maximum year is less than 1976, the earliest year of the BR. Second, the country
field is used to identify domestic trademark owners. Finally, the owner data file also contains
certain types of businesses that are unlikely to be covered in the BR. These include entities
representing federal and state governments as well as individuals. The owner entity type code
is used to exclude these cases from the match to the BR. Table A1 shows the count of unique
trademarks and owner records after applying each restriction to the sample.36 The owner file
initially contains more than 7 million trademarks and 17 million owner records. This reduces to
almost 5 million trademarks and 12 million owner records after excluding foreign, federal, state,
and individuals and those before 1976.
Table A1: Input Frame
Input Frame Trademarks (1,000s) Ownership Records (1,000s)
Owner File 7,214 17,381
Excluding Pre 1976 6,907 16,937
Excluding Foreign 5,939 14,407
Excluding Federal, State, Individual 5,048 12,289
Source: USPTO Trademarks Casefile Database, author’s calculations.
Notes: Counts in thousands.
The first step in the matching process is the extraction of all unique name and address
combinations from the owner data file. The owner data file contains an observation for each owner
36Each trademark has one or more “owner records", or records in the ownership database. Each record captures
a different stage of the application, review, and registration process.

recorded for each trademark application, registration, and publication from 1870 to 2014.37 Name
and address information are collected at different times during a trademark’s lifecycle often for the
same business entity. Not only are there multiple instances of the name and address information
for one or more businesses associated with a trademark, there are also different types of business
names. For example, each record in the TCFD may include “former”, “doing business as”, and
“composed of” business names. Each owner record also includes two street address variables,
which correspond to the first and second lines of the owner’s street address. In many cases the
owner’s full street address is split across these fields. It is not always the case, however, that line
1 should precede line 2. For example, line 1 might include the suite number while line 2 contains
the street address or vice versa. In order to maximize the chances of identifying a match for each
business in the TCFD, each unique name (across all name types) is combined with combinations
of line 1 and line 2 of the street address (i.e. line 1, line 2, line 1 concatenated with line 2, and line
2 concatenated with line 1). This process produces one or more name and address combinations
that are at-risk for a match to the BR for each owner record.
The next step in matching the TCFD data to the BR is the cleaning and preparation of
both datasets. First, common strings that provide little identifying information for matching
are removed from both datasets. These include symbols and punctuation (e.g. “& ”, “.”, “@”),
common words (e.g. “and”, “the”), and abbreviations or designations (e.g. “Co.”, “LLC”,
“LTD”). Additional standardization procedures are used to standardize the name, street, and
city fields.38 Values in the state field are cleaned and standardized and the zip code field is subset
to five digits. These cleaning algorithms are applied to the name and addresses from both the
TCFD and the BR. Once cleaned, the name and addresses from both datasets are matched using
fuzzy string techniques combined with a blocking methodology.
The matching of the TCFD to the BR proceeds in several steps. First, an initial subset of
potential matches is identified based on a relatively loose name-only match criteria between all
unique name and addresses extracted from the TCFD and all establishments in the BR.39 All
matches not meeting this very loose criteria are excluded. Matches of different quality from this
initial match set are extracted based on combinations of name and address fields. These match
categories are based on whether the match is on name in conjunction with different address fields
(street, city, state, and zip code). Next, a string comparator is used to further clean and subset
the matches. The Jaro-Winkler (JW) string comparator, which takes values ranging from zero
and one as a function of how similar two strings are, is calculated for the TCFD and BR name
and city pairs. Additionally, a composite JW score is calculated across all three fields. Name-
37As noted above, we exclude records filed, registered, and published prior to 1976.38These standardization procedures include algorithms found in the the SAS Data Quality suite.39This and other fuzzy name matches are done using SAS Data Quality algorithms. Where noted we use the
Jaro-Winkler string comparator to clean matches.

only matches, which tend to be of the lowest quality, and matches made using only the name
and a single address variable are kept only if the JW score between the name fields is greater
than 0.85.40 Across all match passes, only the highest quality pass is kept for each TCFD name
and address. Among the remaining matches, the composite JW score is used to select only the
highest quality matches.
The next step of the matching aggregates the establishment-level results from the BR match
described above to the target firm-level match and integrates those matches with the LBD.
From the LBD, the first and last year of observation for each firm ID are extracted. All unique
combinations of TCFD name and address and firm ID are kept. The first and last firm years,
in combination with the minimum and maximum trademark filing years associated with each
TCFD name and address, are used to clean firm-level matches. Since trademark filing can
plausibly occur well before a firm enters the employer universe, all matches that occur within a
three year window before and after the firm’s first and last year observed in the LBD are kept.
The final stage of the cleaning algorithm involves additional disambiguation of business names
in the TCFD in order to increase the number of unique firm-TCFD matches. First, additional
name standardization is performed to group matched and unmatched cases. Information from
the LBD is then leveraged to further reduce multiple matches. In eliminating certain duplicate
matches, matched firms are required to have positive employment, and cases where a firm has
more than 10 trademarks and at the same time, the number of trademarks exceed the number
of employees, are also dropped. Table A2 shows the match quality distribution for the resulting
linked data. The majority (81%) of matches use a combination name, street, city, and state.
Note also that less than 10% of the matches rely on name only, which is a relatively weak criteria
that will tend to generate more false positives compared to matches with address blocking.
In order to better understand why TCFD name and addresses do not receive a firm match,
unmatched cases are matched to the non-employer business register (ILBD). The ILBD is based
on administrative data on income tax returns (Form 1040 with attached Schedule C(s)). In
the ILBD some of the observations include individual’s names, while others pertain to firm
names. To carry out the match, an algorithm is applied to determine whether an observation
likely represents an individual’s name. Steps generally similar to the match to the BR are then
followed to match the unmatched trademarks to the name and addresses appearing in the ILBD.
For this study, these matches are used primarily to better understand the quality of matches
to the employer universe. Future work will investigate matches to non-employer businesses and
their growth and transition dynamics.
Table A3 shows the match rates between trademarks in the TCFD owner file and the LBD
40This and other cutoff values were reached by visual inspection of the matches and JW scores. The score of
0.90 balanced Type I and Type II errors.

Table A2: Match Quality Distribution
Match Pass Share of Matches
Name, Street, City, State 81.3
Name, State, Zip Code 4.8
Name, Zip Code 0.0
Name, State 5.1
Name Only 8.7
Source: USPTO Trademarks Casefile Database, Business
Register, author’s calculations.
Notes: Match passes listed in order of decreasing quality.
and ILBD by decade. This table also reports the percent of employer matches that are unique.
The overall match rate to the LBD is over 83% and 2.4% to the ILBD. The first point to note
is that the number of trademarks filed each year has grown substantially over time. The match
rate to the employer universe has fallen about 16 points between the 1980s and the 2010s. The
percent of matches that are unique is increasing over time, rising from 59% in the 1980s to 88%
in the 2010s. The match rate to the nonemployer universe, in contrast to the employer match,
has been growing since 1990.
Table A3: Match Rates by Decade
LBD ILBD
Years Trademarks Match Rate Percent Unique Match Rate
1980-1989 363,000 88.8 59.0
1990-1999 582,000 88.8 64.6 1.4
2000-2009 1,058,000 83.9 75.2 2.7
2010-2014 649,000 73.3 87.7 3.8
Source: Observation counts rounded. USPTO Trademarks Casefile Database, LBD,
author’s calculations.
Notes: Decades are defined by trademark registration year. Percent unique is the
share of matches that are to a single firmid. The range of the BR and LBD is 1976
to 2014 and the range of the ILBD is 1993-2014.
Analysis of the underlying matched and unmatched records reveals several patterns.41 First,
the decline in match rates begins in the late 1990s and speeds up around 2010. As shown in Figure
41For this analysis, only the registered trademarks are considered, rather than applications for trademarks,
since registered trademarks require demonstration of commercial use and thus may be better associated with

A1, the decline is most pronounced among records identified as “Limited Liability Company”
(LLCs) in the TCFD. The match rate for LLCs falls from about 91% in the early 1990s to less
than 45% in 2014. In addition, LLCs are the fastest growing entity type in the TCFD over this
period rising from about 2k filings in 1990 to almost 100k filings in 2014. The fraction of LLCs
has also been growing over this period in the general population of firms.
Figure A1: LBD Match Rate by Legal Form of Organization
Source: USPTO Trademarks Casefile Database, LBD, author’s calculations.
Notes: Only registered trademarks included. Corporations and LLCs are identified using the legal entity type
code found in the TCFD.
To investigate the declining match rate between the TCFD and the LBD, several hypotheses
for the decline are explored, including deteriorating string quality, a compositional shift towards
nonemployers, and the growth of informal businesses. First, if the quality of the string variables in
the TCFD (e.g. name and address fields) declines over time this could adversely affect the match
rate to the LBD. To explore this hypothesis, measures of mean string length are constructed
over time for both names and addresses. The average name length and match rate exhibit very
similar time series patterns with a simple correlation of 0.96. Moreover, the average string length
employer businesses in BR and LBD.

of the name variable falls from almost 24.5 characters to less than 22.5, which could represent
an 8% loss of information over the period. Figure A2 shows the relationship between string
length and match rate over time. Both relatively short and long string names have lower match
rates. Importantly, the match rate declines over time for all string lengths. This implies that the
decreasing information in the TCFD name field is unlikely to account for the declining match
rate to the LBD.
Figure A2: Match Rate and String Length
Source: USPTO Trademarks Casefile Database, LBD, author’s calculations.
Notes: Match rates on the y-axis suppressed to avoid the disclosure of sensitive information.
Another potential explanation for the decline in match rates would be a compositional shift
towards nonemployers among businesses filing for trademarks. As shown in Table A3 the match
rate to the ILBD does increase over time. However, the increased matches to the nonemployer
universe is not enough to make up for the decline in the LBD match rate. Assuming all TCFD
businesses not found in the LBD were true non-employers, the ILBD match rate would need to
be at least five times larger to fill the gap in the falling employer match rate.42 It is also the case
42As an additional validation we compare the share of nonemployers specifically among LLCs in the BR from
2007 to 2014, years for which we are able to distinguish LLCs. The share of nonemployers among LLCs is actually
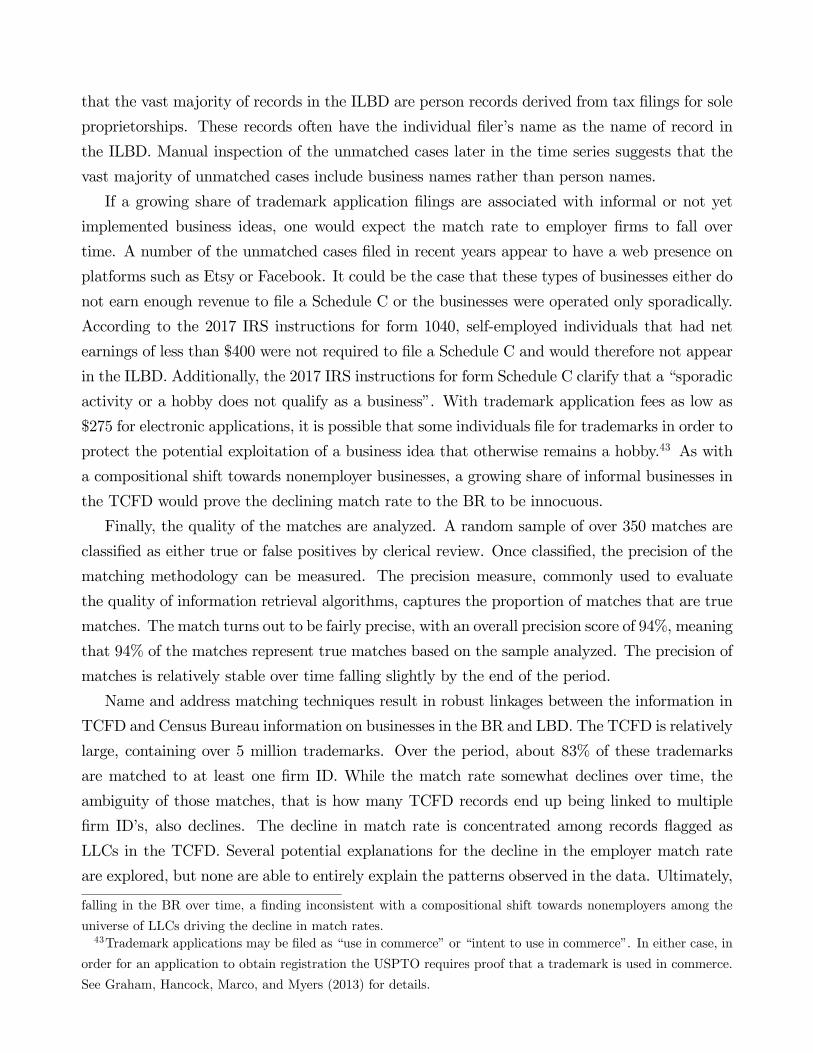
that the vast majority of records in the ILBD are person records derived from tax filings for sole
proprietorships. These records often have the individual filer’s name as the name of record in
the ILBD. Manual inspection of the unmatched cases later in the time series suggests that the
vast majority of unmatched cases include business names rather than person names.
If a growing share of trademark application filings are associated with informal or not yet
implemented business ideas, one would expect the match rate to employer firms to fall over
time. A number of the unmatched cases filed in recent years appear to have a web presence on
platforms such as Etsy or Facebook. It could be the case that these types of businesses either do
not earn enough revenue to file a Schedule C or the businesses were operated only sporadically.
According to the 2017 IRS instructions for form 1040, self-employed individuals that had net
earnings of less than $400 were not required to file a Schedule C and would therefore not appear
in the ILBD. Additionally, the 2017 IRS instructions for form Schedule C clarify that a “sporadic
activity or a hobby does not qualify as a business”. With trademark application fees as low as
$275 for electronic applications, it is possible that some individuals file for trademarks in order to
protect the potential exploitation of a business idea that otherwise remains a hobby.43 As with
a compositional shift towards nonemployer businesses, a growing share of informal businesses in
the TCFD would prove the declining match rate to the BR to be innocuous.
Finally, the quality of the matches are analyzed. A random sample of over 350 matches are
classified as either true or false positives by clerical review. Once classified, the precision of the
matching methodology can be measured. The precision measure, commonly used to evaluate
the quality of information retrieval algorithms, captures the proportion of matches that are true
matches. The match turns out to be fairly precise, with an overall precision score of 94%, meaning
that 94% of the matches represent true matches based on the sample analyzed. The precision of
matches is relatively stable over time falling slightly by the end of the period.
Name and address matching techniques result in robust linkages between the information in
TCFD and Census Bureau information on businesses in the BR and LBD. The TCFD is relatively
large, containing over 5 million trademarks. Over the period, about 83% of these trademarks
are matched to at least one firm ID. While the match rate somewhat declines over time, the
ambiguity of those matches, that is how many TCFD records end up being linked to multiple
firm ID’s, also declines. The decline in match rate is concentrated among records flagged as
LLCs in the TCFD. Several potential explanations for the decline in the employer match rate
are explored, but none are able to entirely explain the patterns observed in the data. Ultimately,
falling in the BR over time, a finding inconsistent with a compositional shift towards nonemployers among the
universe of LLCs driving the decline in match rates.43Trademark applications may be filed as “use in commerce” or “intent to use in commerce”. In either case, in
order for an application to obtain registration the USPTO requires proof that a trademark is used in commerce.
See Graham, Hancock, Marco, and Myers (2013) for details.

matches prove to be of high quality, with a precision score over 90%.
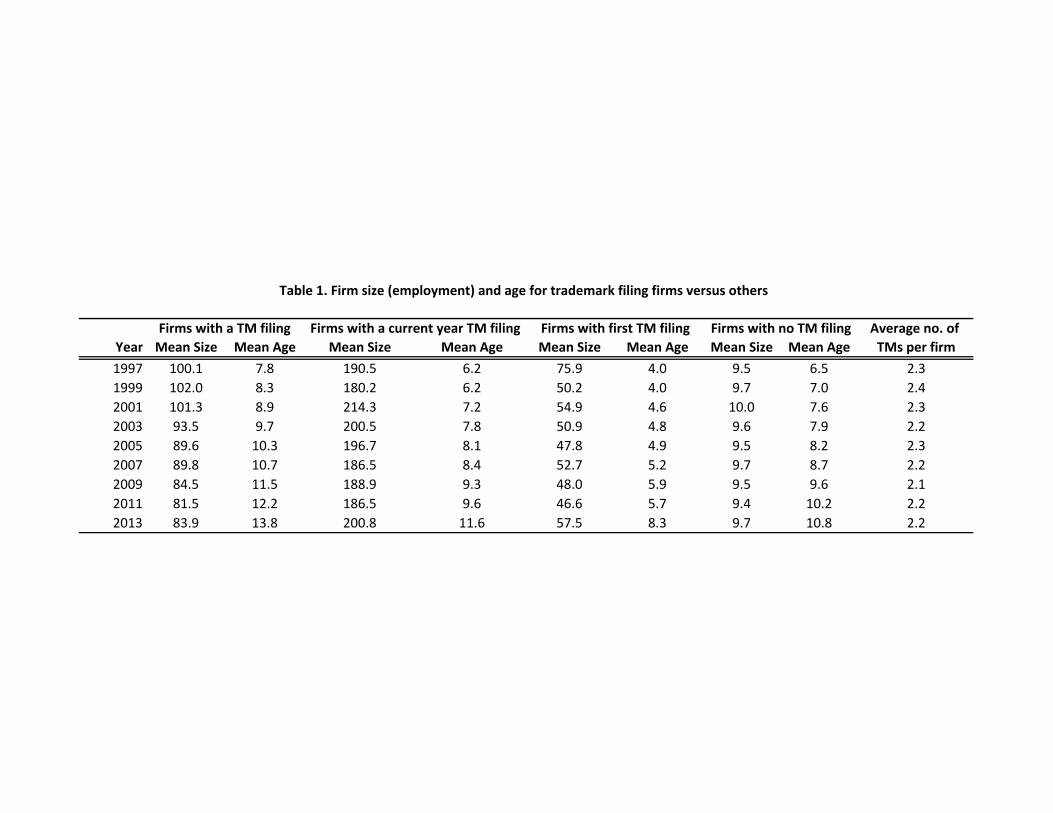
Firms with a TM filing Firms with no TM filing Average no. of Year Mean Size Mean Age Mean Size Mean Age Mean Size Mean Age Mean Size Mean Age TMs per firm1997 100.1 7.8 190.5 6.2 75.9 4.0 9.5 6.5 2.31999 102.0 8.3 180.2 6.2 50.2 4.0 9.7 7.0 2.42001 101.3 8.9 214.3 7.2 54.9 4.6 10.0 7.6 2.32003 93.5 9.7 200.5 7.8 50.9 4.8 9.6 7.9 2.22005 89.6 10.3 196.7 8.1 47.8 4.9 9.5 8.2 2.32007 89.8 10.7 186.5 8.4 52.7 5.2 9.7 8.7 2.22009 84.5 11.5 188.9 9.3 48.0 5.9 9.5 9.6 2.12011 81.5 12.2 186.5 9.6 46.6 5.7 9.4 10.2 2.22013 83.9 13.8 200.8 11.6 57.5 8.3 9.7 10.8 2.2
Firms with a current year TM filing Firms with first TM filing
Table 1. Firm size (employment) and age for trademark filing firms versus others

Firms with a TM filing Firms with no TM filingIndustry Mean Size Mean Age Mean Size Mean Age Mean Size Mean Age Mean Size Mean Age
Agriculture, Mining and Utilities 203.5 14.4 536.7 11.0 181.3 8.0 11.3 11.3Construction, Transportation and Warehousing 92.8 14.4 238.7 12.2 81.6 10.2 7.4 10.7Manufacturing 113.9 16.7 282.2 14.4 53.3 8.8 17.5 13.4Wholesale 43.6 15.0 99.4 12.8 38.1 8.5 8.5 12.1Retail 68.3 12.5 201.1 9.9 19.4 7.4 7.9 10.5Information 76.6 13.0 256.6 10.9 61.5 6.5 8.6 9.4Finance and Real Estate 88.5 14.0 233.8 12.3 64.4 9.5 5.2 10.7Professional Services 39.3 12.1 84.5 9.3 43.5 7.0 5.5 10.3Management and Admin. Support 153.8 14.1 345.9 12.0 116.9 9.0 15.8 9.9Education and Healthcare 210.4 14.3 487.9 12.2 126.8 9.4 15.7 11.6Entertainment, Accommodation and Food 94.0 12.2 212.3 9.9 44.8 7.6 15.5 8.5Other Services 32.6 14.7 68.1 12.8 25.3 9.5 5.7 13.0
Table 2. Firm size (employment) and age for trademark filing firms versus others ‐ sectoral differences
Firms with a current year TM filing Firms with first TM filing

Table 3. Regression analysis of the relation between various firm outcomes
and the first trademark filing
Dependent Variable
Independent Variables Employment Revenue R&D Exp. Patents
0143∗∗∗ 0323∗∗∗ 0406∗∗∗ 0011∗∗∗
[0015] [0023] [0121] [0002]
_ 0997∗∗∗ 0197∗∗∗ 0191∗ 0001
[0018] [0011] [0075] [0001]
× _ 0297∗∗∗ 0195∗∗∗ 0783∗∗∗ 0013∗∗∗
[0008] [0013] [0133] [0001]
6459∗∗∗ 7376∗∗∗ 5108∗∗∗ −0011∗∗[0032] [0018] [0069] [0003]
2 024 018 041 005
95 5 80 10
Notes: All regressions include industry (4-digit NAICS) and year fixed effects.
All dependent variables are transformed using hyperbolic sine transformation.
Standard errors clustered by industry are in parentheses. *,**,*** indicate
significance at 10, 5, and 1% respectively. is rounded to avoid disclosure.
Each control firm is weighted by the total number of control firms for the
corresponding treated firm.

Table 4. Patent application and R&D activity
for all firms versus firms with trademark filing
All U.S. Firms
% of Firms with % of Firms with % of Firms with
Year Firms Patents R&D Patents & R&D
1997 4,700,000 0.40 0.17 0.10
1999 4,900,000 0.46 0.18 0.11
2001 4,900,000 0.51 0.19 0.12
2003 5,200,000 0.53 0.23 0.14
2005 5,500,000 0.53 0.29 0.16
2007 5,600,000 0.54 0.32 0.17
2009 5,300,000 0.58 0.42 0.22
2011 5,300,000 0.60 0.47 0.24
Firms with Trademark Filing
% of Firms with % of Firms with % of Firms with
Year Firms Patents R&D Patents & R&D
1997 126,000 8.33 3.33 1.98
1999 154,000 8.44 3.31 1.95
2001 169,000 9.17 3.43 2.07
2003 182,000 9.34 4.07 2.42
2005 202,000 9.41 4.85 2.87
2007 227,000 9.03 5.07 2.91
2009 241,000 9.13 5.81 3.32
2011 254,000 9.06 6.69 3.66
Notes: The figures provide fractions of firms that have ever applied for a patent
or performed R&D. Patent data comes from USPTO and R&D data from the BRDIS.
Figures are rounded for disclosure purposes.
Table 5. Co-presence of trademark filing, patent applications,
and R&D activity
Firms with Patent Applications
% of Firms with % of Firms with % of Firms with
Year Firms Trademarks R&D Trademarks & R&D
1997 19,000 55.26 25.79 13.16
1999 22,500 57.78 24.44 13.33
2001 25,000 62.00 23.20 14.00
2003 27,500 61.82 25.82 16.00
2005 29,000 65.52 30.34 20.00
2007 30,500 67.21 31.80 21.64
2009 31,000 70.97 37.10 25.81
2011 32,000 71.88 39.06 29.06
R&D Performing Firms
% of Firms with % of Firms with % of Firms with
Year Firms Trademarks Patents Trademarks & Patents
1997 8,000 52.50 61.25 31.25
1999 8,800 57.95 62.50 34.09
2001 9,200 63.04 63.04 38.04
2003 12,000 61.67 59.17 36.67
2005 16,000 61.25 55.00 36.25
2007 18,000 63.89 53.89 36.67
2009 22,000 63.64 52.27 36.36
2011 25,000 68.00 50.00 37.20
Notes: The figures provide fractions of firms that have ever applied for a patent
or trademark, or performed R&D. Patent data comes from USPTO and R&D data
from the BRDIS. Figures are rounded for disclosure purposes.

Figure 1: The number of firms that file for a trademark for the first time, by sector over time
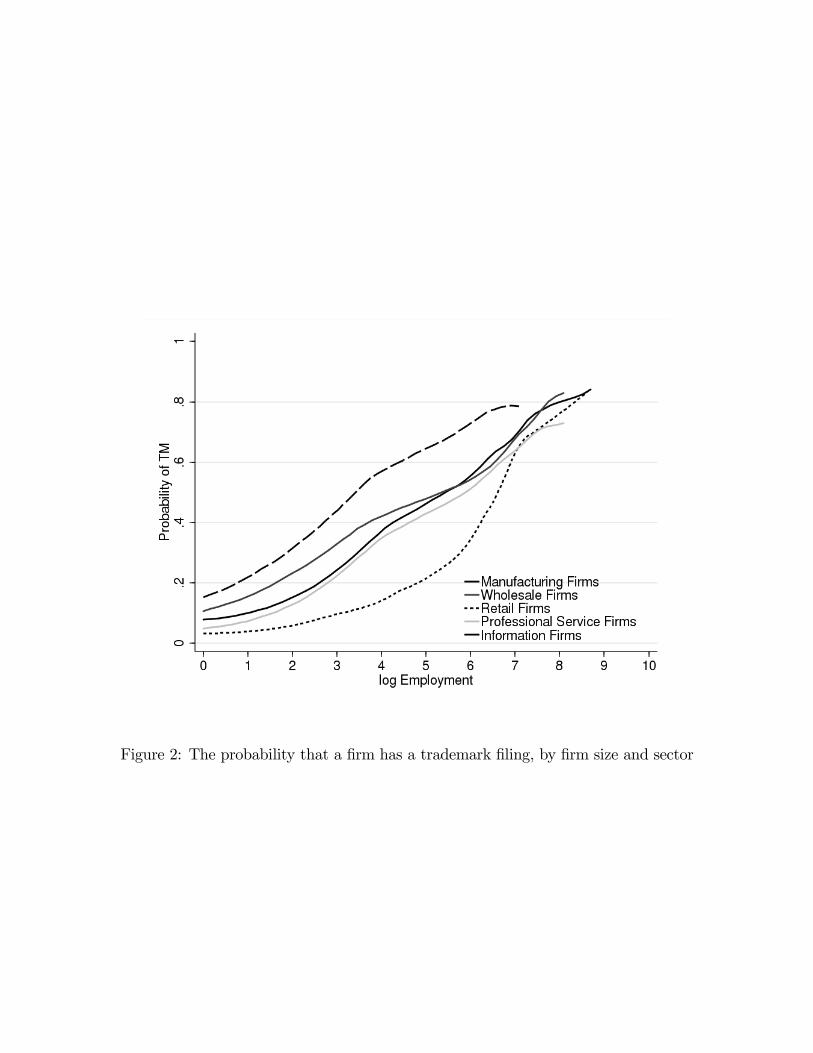
Figure 2: The probability that a firm has a trademark filing, by firm size and sector

Figure 3: The probability that a firm has a trademark filing, by firm age and sector
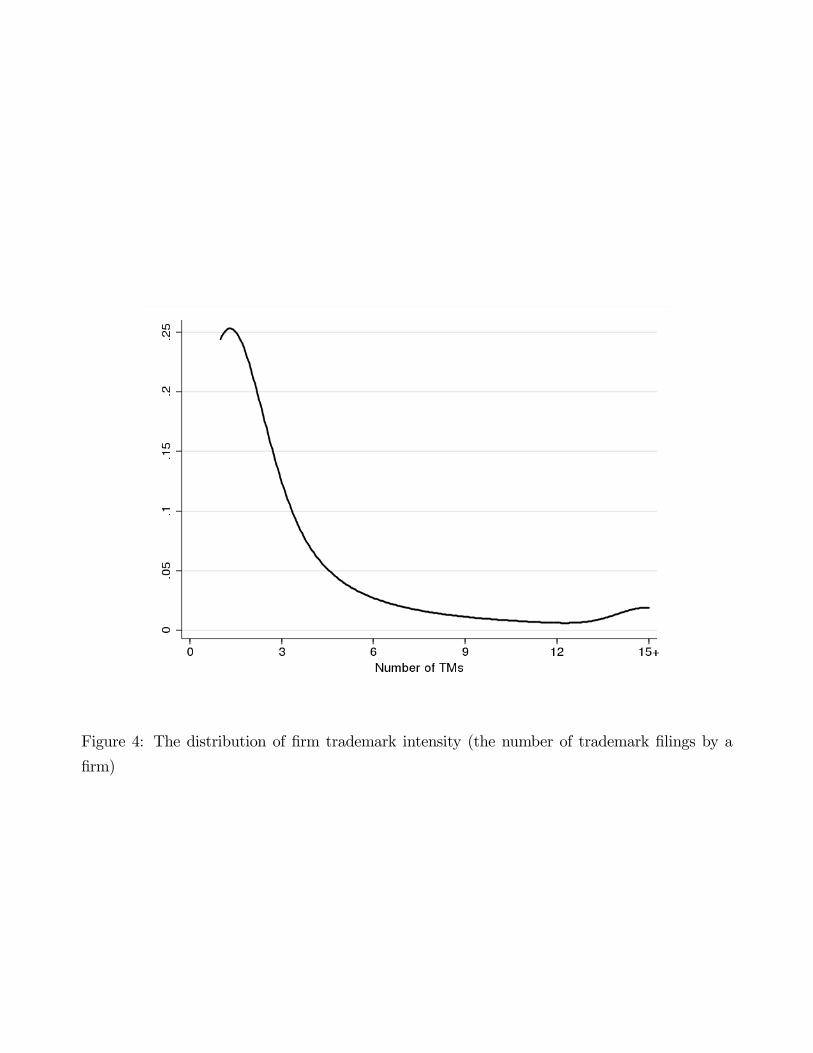
Figure 4: The distribution of firm trademark intensity (the number of trademark filings by a
firm)
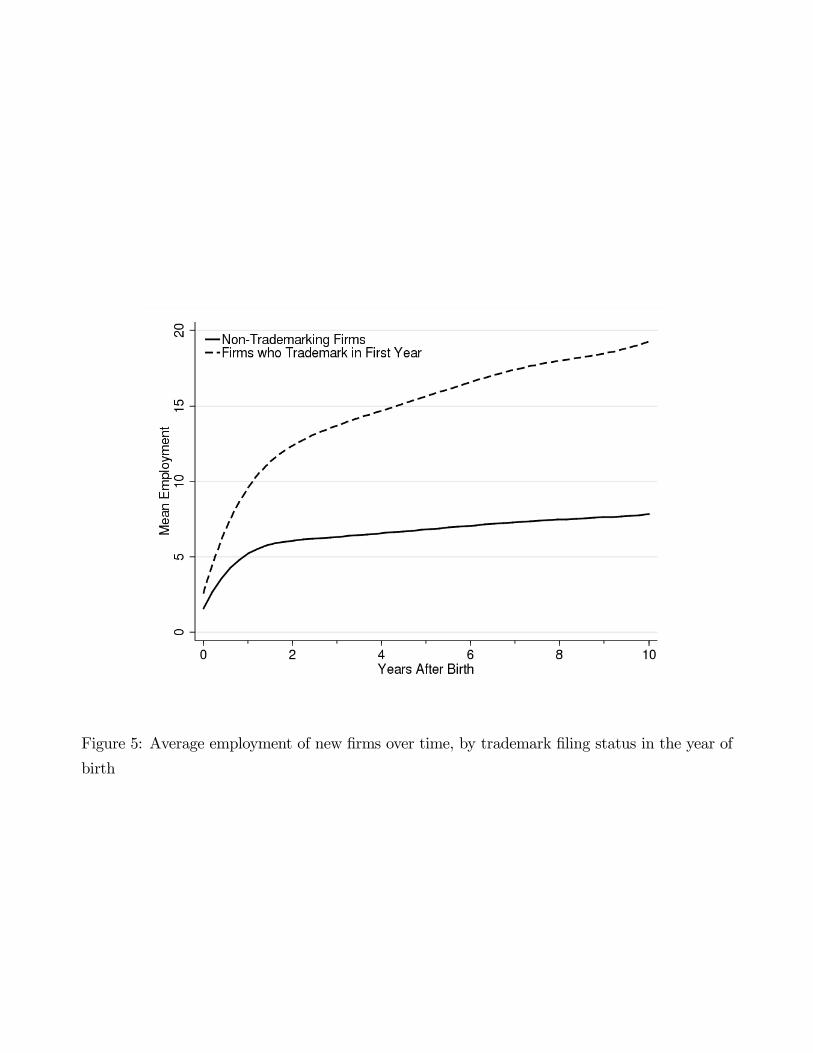
Figure 5: Average employment of new firms over time, by trademark filing status in the year of
birth
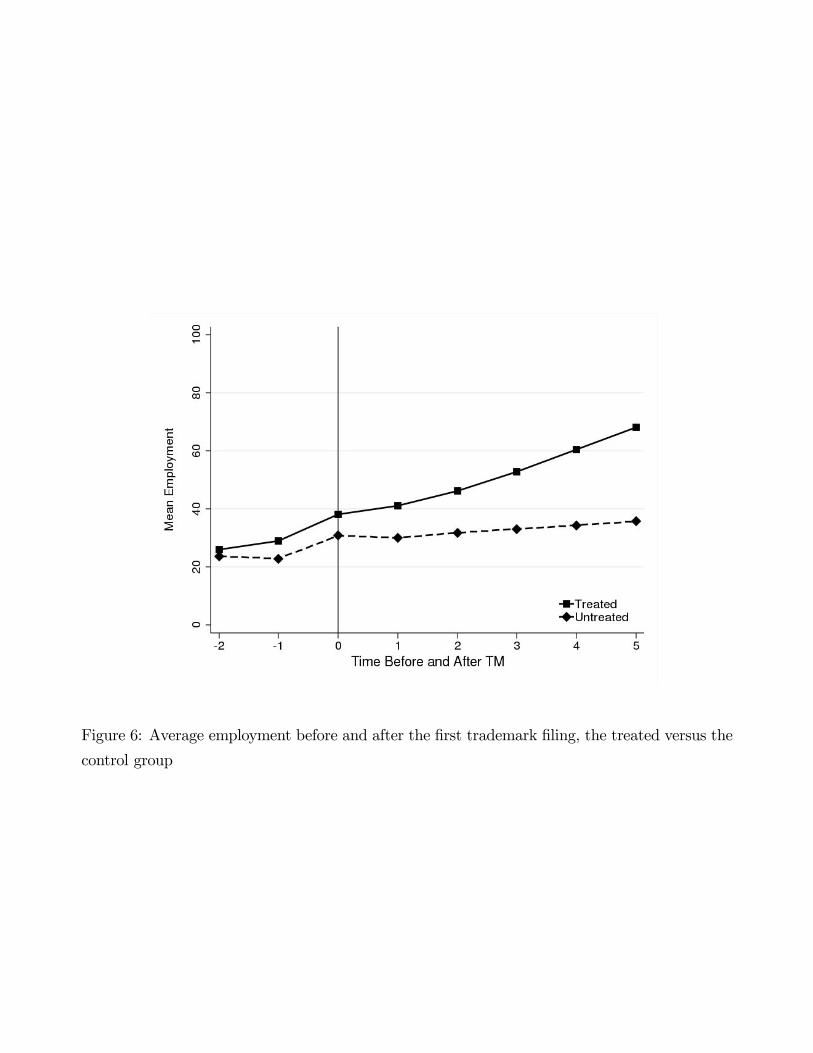
Figure 6: Average employment before and after the first trademark filing, the treated versus the
control group

Figure 7: Normalized average employment before and after the first trademark filing, the treated
versus the control group

Figure 8: Normalized average revenue before and after the first trademark filing, the treated
versus the control group
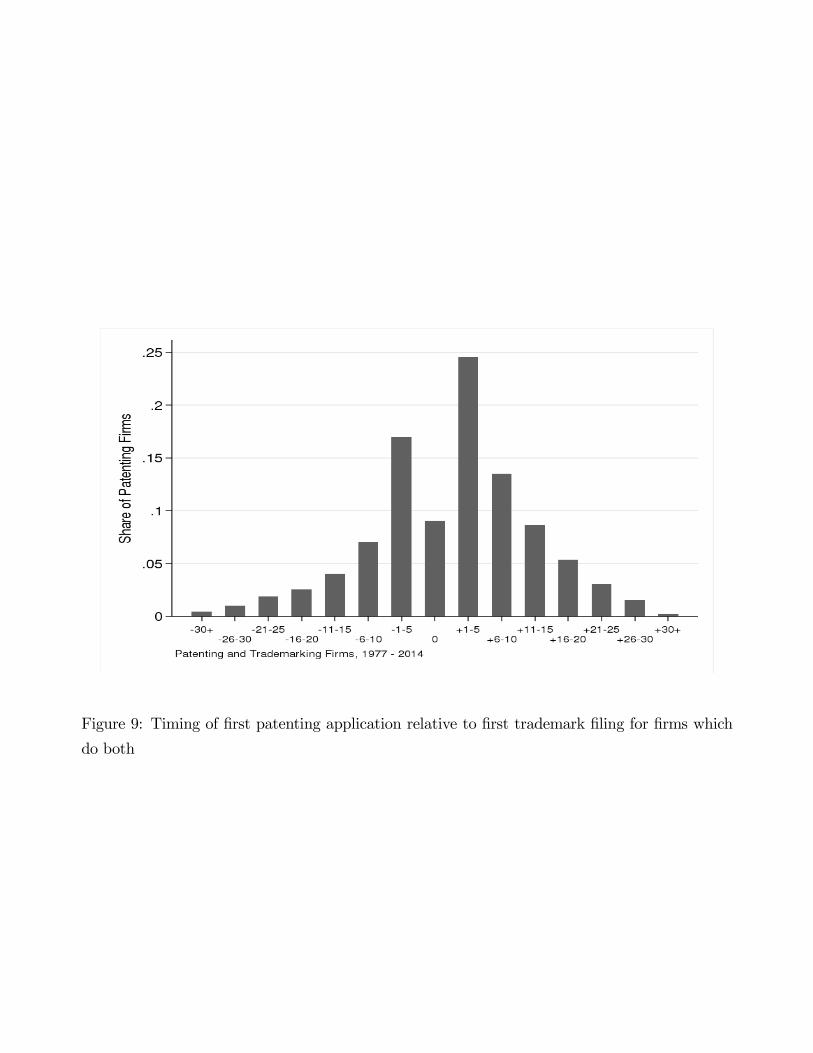
Figure 9: Timing of first patenting application relative to first trademark filing for firms which
do both
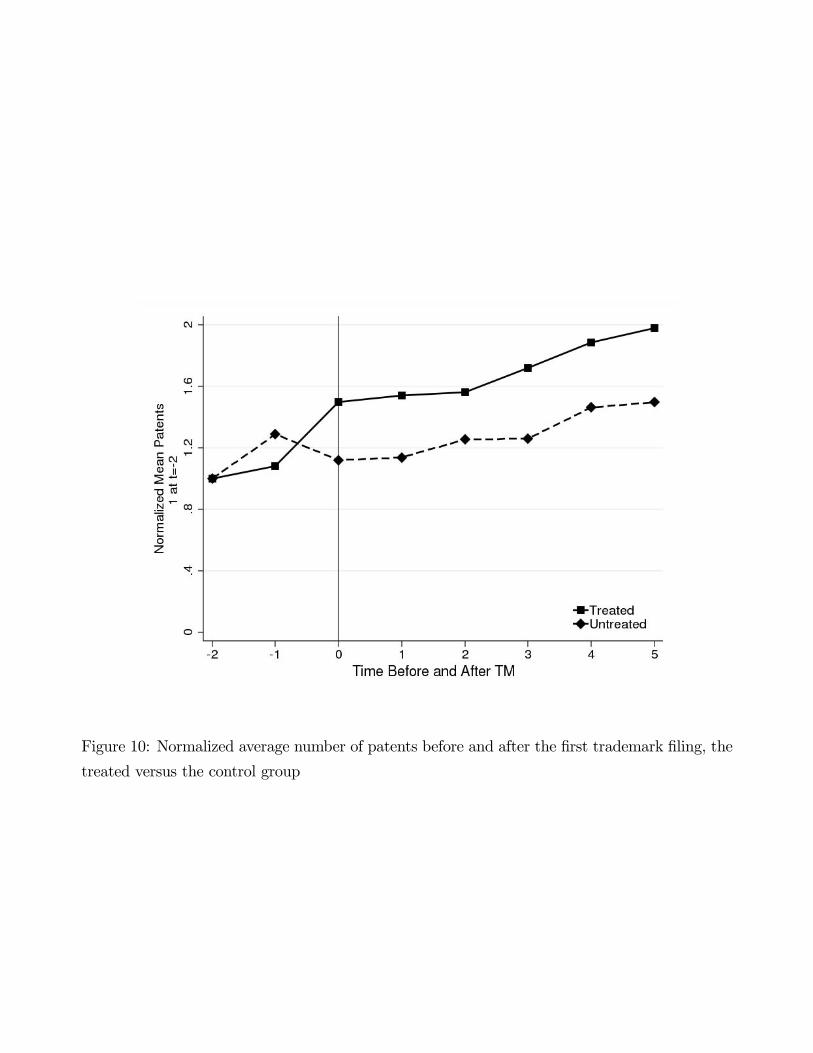
Figure 10: Normalized average number of patents before and after the first trademark filing, the
treated versus the control group


