
International Journal of Business and Management Review
Vol.6, No.2, pp.29-44, March 2018
___Published by European Centre for Research Training and Development UK (www.eajournals.org)
29 ISSN: 2052-6393(Print), ISSN: 2052-6407(Online)
AN ANALYSIS OF ASSET GROWTH PROFITABILITY AND CAPITAL
STRUCTURE EFFECT THROUGH RISK ON PRICE TO BOOK VALUE (PBV) IN
BANKING COMPANIES, INDONESIA
Susi Hotmaida Hutabarat1, Fitrawaty2, Eko Wahyu Nugrahadi2
1Master Student, State University of Medan (Unimed), Medan, Indonesia 2Lecturer at State University of Medan (Unimed), Medan, Indonesia
ABSTRACT: A company is an organization that combines and organizes resources in order
to produce goods and or services for sale. The asset growth has a negative and significant
impact on the risk level of banking institutions in Indonesia. This means that if an average
increase in asset growth will lower the risk level of banking institutions in Indonesia, on the
contrary Asset Growth has a positive and insignificant effect on Corporate Value (PBV). This
means that if an increase in asset growth will lead to an increase in the value of the banking
institution in Indonesia but not significant.
KEYWORDS: Economy; Banking Company; Risk; Capital
INTRODUCTION
In order to meet the company's funding needs, the managers of the company must make funding
decisions both internally and externally. The source of external funds of the company from the
debt will incur capital costs in the form of interest charged by the creditor. Meanwhile the use
of internal fund resources will create an opportunity cost of the capital that is used. Thus, the
company must be able to determine the optimal capital composition. Another important
indicator that affects the firm value is market risk. This risk occurs in the balance sheet position
and administrative account resulting from the changes or movements of market variables such
as interest rates, foreign exchange rates, stocks and commodities (Masdar, 2008).
The market risk proxyed against beta is a fluctuation of return of a stock to the market return.
The higher the beta, the higher the market risk will be. This gives the option to engage in debt
in its capital structure because the risk of using debt is safer compared to issueing the new
shares.
Table 1: Average Price to Book Value (PBV), Return on Assets (ROA), Assets Growth
and Debt to Equity Ratio (DER) of Banking Companies in 2011-2015
Year PBV (x) ROA (%) Assest Growth (%) DER (x)
2011 2.10 3.02 21,4 8.50
2012 1.92 3.18 16,7 8.30
2013 1.67 3.04 16,2 8.06
2014 1.52 3.01 17,8 8.20
2015 1.50 3.00 17,6 8.10
Source: Data processed, 2015
Table 1 explains that the value of PBV which is a proxy of company value, indicates the
decrease progressively. The decline in PBV values during 2011 to 2005 was due to several

International Journal of Business and Management Review
Vol.6, No.2, pp.29-44, March 2018
___Published by European Centre for Research Training and Development UK (www.eajournals.org)
30 ISSN: 2052-6393(Print), ISSN: 2052-6407(Online)
indicators that also declined, such as ROA, asset growth and DER. It is recorded that the PBV
value of banking companies listed on the BEI in 2011 amounted to 2.10 until the end of 2015
PBV value of 1.50. ROA is a proxy of profitability which shows a relatively stable value and
tend to decrease, whereas the ROA of banking companies listed on the BEI in 2011 was 3.02
percent and at the end of 2015 the value of ROA was 3.00 percent, but in 2012 ROA has
increased compared to the value of ROA in 2011, from 3.02 percent in 2011 to 3.18 percent in
2012. This condition is different from the value of PBV in the same year, where the value of
PBV decreased in 2012, from 2.10 in 2011 to 1.92 in 2012. This is contrary to the theory that
profitability (ROA) positively influences the firm value (PBV) (Sudarma in Nofrita, 2009).
Hermuningsih (2013) conducted a research by using profitability, growth opportunity and
capital structure that have positive and significant influence to the firm value. The data
presented in Table 1.1 indicates the conformity with the results of the study. During the last
five years the average value of companies proxied by the average PBV has decreased from year
to year. With a fairly stable ROA percentage, the asset growth and DER declined as well.
The above description shows that profitability can reflect the advantages of financial
investment, which means the profitability affect the value of the company Profitability ratios
indicate the success of the company in generating profit. While Sriwardany (2006) found that
the growth of the company has a direct and positive influence on stock price changes that will
increase the stock price.
LITERATURE REVIEW
Firm Value
Salvatore (2005) in his book "Managerial Economy in the Global Economy" explains that a
company is an organization that combines and organizes resources in order to produce goods
and or services for sale. The company exists because it would be extremely inefficient and
costly for employers to enter and contract with workers and owners of capital, land and other
resources for each separate stage of production and distribution. On the other hand,
entrepreneurs typically enter into large, long-term contracts with labor to perform various tasks
with certain wages and other benefits. The company exists to save the cost of such transactions.
By internalizing the various transactions, the company can also save on sales taxes and avoid
price controls and government regulations that apply only to inter-company transactions.
The firm value is the perception of investors to the success rate of the company that is closely
related to the share price (Sujoko and Soebiantoro, 2007). High stock prices make the value of
the company also high, and increase market confidence not only to the company's current
performance but also on the prospects of the company in the future. The price of shares used
generally refers to the closing price, and is the price that occurs when the stock is traded in the
market (Fakhruddin and Hadianto, 2001), In assessing the stock value of the company, there
are three important types of valuation. The assessment is an assessment of book value, market
value and intrinsic value (Jogiyanto in Alicia, 2013). The company value can be measured by
price to book value (PBV), which is the ratio between stock price and book value per share
(Brigham and Gapenski, 2006). Meanwhile, according to Suad (2001) in Doni (2012), the
greater the value of PBV the higher the company is assessed by the investors relative compared
with the funds that have been invested in the company. Ang (1997) formulated PBV as follows:

International Journal of Business and Management Review
Vol.6, No.2, pp.29-44, March 2018
___Published by European Centre for Research Training and Development UK (www.eajournals.org)
31 ISSN: 2052-6393(Print), ISSN: 2052-6407(Online)
𝐵𝑉 = Share price per share
Price to Book Value 𝑋 100
Another related indicator is the book value per share, which is the ratio of capital (common
equity) to the number of shares outstanding (Fakhruddin and Hadianto, 2001). In this case,
PBV can be interpreted as a result of comparison between the stock market price with the book
value of shares. High PBV will increase market confidence in the company's prospects and
indicate high shareholder wealth (Soliha and Taswan, 2002). PBV can also mean a ratio that
indicates whether the traded stock price is overvalued (above) or undervalued (below) the value
of the share book (Fakhruddin and Hadianto, 2001).
Bank as a Business Entity
Bank is an intermediary institution that collects funds from the community and then channeled
back to the community in the form of credit. The Bank has an important role as a driver of the
economy and facilitates economic growth. At the macroeconomic level of banks is a tool in
determining monetary policy while at the micro level of the bank's economy is the main source
of financing for business actors. The right capital structure policy in the banking company is
needed to support the bank's operational activities. The capital structure policy is a policy that
involves an optimal combination of the use of various sources of funds to be used to finance
an investment and also to support the company's operations in an effort to increase the
company's profit in order to achieve high corporate value (Gitman in Siringiringo, 2012). The
capital structure of financial firms, including banks, is fundamentally different from non-
financial corporations, due to different business characteristics or operational activities. In
addition, the bank must have a buffer in accordance with the minimum core capital provision
or regulation determined by the monetary authority in this case the central bank, in order to
protect its depositors' funds (Saunders, 2008).In the perspective of banking management, debt
in relation to capital structure becomes the main source of funds for banks derived from third
party funds (DPK), thereby the role of debt for banks is very large. The use of debt from public
funds becomes an incentive tool for managers to work more carefully in order to avoid the
threat of bankruptcy risks and to maintain public confidence in the bank. DPK is also
categorized as this debt that makes DER banking companies higher than with companies
engaged in other fields.
Profitability
Return on Assets (ROA) is one of the profitability ratios that measure the effectiveness of the
company in generating the profit from the assets used. The higher the ROA, the more the
company's operational is efficient and vice versa, the low ROA can be caused by the many
assets of the unemployed company, the investment in excess inventory, the excess of paper
money, the fixed assets operate below normal and so decreasing the profitability of the
company. Profitability is the end result of a number of company management policies and
decisions (Brigham and Gapenski in Ria, 2013). Mathematically, ROA can be formulated as
follows:
𝑅𝑂𝐴 = 𝑝𝑟𝑜𝑓𝑖𝑡 𝑏𝑒𝑓𝑜𝑟𝑒 𝑡𝑎𝑥
𝑡𝑜𝑡𝑎𝑙 𝑎𝑠𝑠𝑒𝑡𝑠 𝑜𝑓 𝑐𝑜𝑚𝑝𝑎𝑛𝑦
Both the investor and the creditor use the earnings information to measure the success of
management performance and measure the future earnings predictions. Profitability can give

International Journal of Business and Management Review
Vol.6, No.2, pp.29-44, March 2018
___Published by European Centre for Research Training and Development UK (www.eajournals.org)
32 ISSN: 2052-6393(Print), ISSN: 2052-6407(Online)
an idea how the performance of management in managing a company. Profitability can reflect
the advantages of financial investment, meaning that profitability affects the firm's value due
to an ever-increasing internal source (Sudarma in Nofrita, 2009). Profitability ratio shows the
company's success in generating profit.
Asset Growth
Asset growth is a growth opportunity for a company in the future (Mai, 2006). Growth is
expressed as total asset growth where the past asset growth will reflect profitability and growth
that comes (Taswan, 2003). Growth can be an increase or decrease in total assets experienced
by the company within a certain period. Asset growth is calculated as a percentage change of
assets at a certain time against the previous year (Saidi, 2004). Sriwardany (2006) found that
the company growth has a direct and positive influence on stock price changes. This means
that information about the growth of the company responded positively by investors, so that it
will increase the stock price. This stock price will affect the value of the company.
The value of a firm formed through an indicator of the market value of the stock is heavily
influenced by investment opportunities. The existence of investment opportunities can provide
a positive signal about the company's growth in the future, so as to increase the value of the
company. The higher asset growth will provide an opportunity to earn the higher profits in the
future. This will certainly give a positive effect on the value of the company. Thus Asset growth
will have a positive effect on the firm value.
2Capital Structure
The capital structure is the balance between the amount of long-term debt and the equity or
capital owned by the company (Riyanto, 2001 in Kartika (2009)). The capital structure is
included that is the decision to choose the source of financing to meet the needs of corporate
spending. According to Brigham and Weston (1994), the optimal capital structure of an
enterprise is a combination of debt and equity that maximizes the firm's stock price. The ratio
that compares the total debt to equity is often called Debt to Equity Ratio (DER). This ratio
measures how far the company is financed by debt, where the higher this ratio illustrates
symptoms that are less good for the company. Increased debt will in turn affect the size of the
net profit available to shareholders including dividends received because its obligation to repay
the debt takes precedence over the dividend distribution (Sartono, 2001). Total debt includes
the current liabilities and the long-term liabilities.
DER reflects the company's ability to pay or fulfill its obligations with its own capital. The
greater the DER value indicates that the greater the capital structure derived from the debt used
to finance existing equity. As Warren et al (2005) state that the smaller the DER ratio, the better
the firm's ability to survive in poor conditions. The small DER ratio indicates that the company
is still able to fulfill its obligations to creditors. This shows that the smaller the DER ratio the
better the company's financial performance. The greater the value of DER indicates that the
capital structure of the business is more use of debt relative to equity. The higher DER
represents a relatively high corporate risk, consequently investors tend to avoid stocks that have
high DERs (Ang, 1997).
The DER formula according to Brealey (2001) in Suharli (2005) is as follows:
𝐷𝐸𝑅 = 𝑇𝑜𝑡𝑎𝑙 𝐷𝑒𝑏𝑡
𝑇𝑜𝑡𝑎𝑙 𝐸𝑞𝑢𝑖𝑡𝑦
International Journal of Business and Management Review
Vol.6, No.2, pp.29-44, March 2018
___Published by European Centre for Research Training and Development UK (www.eajournals.org)
33 ISSN: 2052-6393(Print), ISSN: 2052-6407(Online)
The structure of capital is closely related to stock prices, this is because one of the elements
that make up the stock price is the perception of investors on the performance of the company,
and capital structure is one of the elements that determine both the poor performance of the
company, because the capital structure will determine the sources of financing and
expenditures made by the company for its operational activities. Related to the market, the
three determinants of capital structure, Brigham and Houston (2001) identified the market
conditions, internal conditions of the company and financial flexibility. The conditions in stock
markets and bond markets that undergo both short and long term changes will greatly affect
the optimal capital structure of the company. Meanwhile, the internal conditions also affect the
targeted capital structure. Finally, maintaining financial flexibility, when it is viewed from an
operational point of view means maintaining adequate reserve capacity, and this will affect the
choice of capital structure that is considered optimal for the company.
RESEARCH METHODOLOGY
The scope of research
The focus of this study is on the analysis of the effect of profitability, asset growth, capital
structure and risk to corporate value in banking companies in Indonesia.
Types and Data Sources
The type of data according to the form used in this study is quantitative data. The data sources
in this study used secondary data published by the Financial Services Authority (OJK), Bank
Indonesia (BI) and Central Bureau of Statistics (BPS). This study uses pooled data (data panel)
that is by combining data from 2006 - 2015 (N = 10) over 5 (five) banking companies in
Indonesia (T = 5). So the number of data in this research is N X T = 10 X 5 equal to 50. The 5
(five) banking institutions are:
1. Bank Negara Indonesia 46 (BNI 46)
2. Bank Rakyat Indonesia (BRI)
3. State Savings Bank (BTN)
4. Bank Mandiri
5. Indonesian Cooperative Bank (Bukopin).
Definition of Operational Variable
Some operational definitions of variables in this study have the following limits:
a. Company value is measured by the price to book value (PBV), which is the ratio of stock
price to book value per share calculated in index unit,
b. Profitability is the ability of a company to generate profit or profit during a period as
measured from Return on Asset, in units of percent,
c. Asset growth is a future growth opportunity of a company as measured by asset growth, in
percentage units,
International Journal of Business and Management Review
Vol.6, No.2, pp.29-44, March 2018
___Published by European Centre for Research Training and Development UK (www.eajournals.org)
34 ISSN: 2052-6393(Print), ISSN: 2052-6407(Online)
d. Capital Structure is the balance between the amount of long-term debt with equity or own
capital owned by the company, calculated in the index unit,
e. Risk is the risk on the balance sheet position and the administrative account of a derivative
transaction due to changes in market conditions, in percentage units.
Analysis Method
By viewing the data used in this study is panel data, then to test the hypothesis the model of
Fixed Securities and Random Effects (Greene, 2000) are used. The explanation of the model
of Fixed Securities and Random Effects is as follows:
Fixed Effect Model
The basic rationale that each individual observation has its own characteristics, this model
allows for an unstable intercept for each individual. But this model has a drawback where
general estimates are not produced because there is no general intercept or constants to
represent all individuals. In Fixed Effects the differences between the individuals are reflected
by the intercept or constants, but on the Random Effects method the differences are
accommodated by the error terms of each individual. This method has the advantage of
eliminating heteroscedasticity if it exists. The determination of this model is whether the Fixed
Effect or Random Effect is based on Hausman's test of specification model following the X2
distribution. The hypothesis used is:
H0 : The random estimator is consistent
H1 : The random estimator is not consistent
If H0 is received, it means that the Random Effects model is better used than the Fixed
Effects model, and vice versa. H0 is accepted/ rejected if:
X2 hit < X2 tab means H0 accepted,
X2 hit > X2 tab means H0 is rejected.
The value of X2 hit or Hausman value (H) is obtained from the difference of coefficient and
covariance values between the two methods. The statistical formulation of the Hausman test is
as follows (Greene, 2000):
H = ( bFE – bRE ) 1 [ cov (bFE) – cov (bRE) ] -1 ( bFE – bRE )
Where
bFE = The estimation coefficient matrix of the Fixed Effect model
bRE = The estimation coefficient matrix of the Random Effects model
cov (bFE) = The covariance matrix of the estimator coefficient of the Fixed Effect model
cov (bRE) = The covariance matrix of the estimator coefficient of the Random Effects model
This Hausman test statistic follows a chi-square distribution with degree of freedom where k is
the number of independent variables. If the Hausman statistic value is greater than its critical
value, then the appropriate model is the Fixed Effect. Similarly, if the Hausman statistic value

International Journal of Business and Management Review
Vol.6, No.2, pp.29-44, March 2018
___Published by European Centre for Research Training and Development UK (www.eajournals.org)
35 ISSN: 2052-6393(Print), ISSN: 2052-6407(Online)
is smaller than the critical value, then the right model is the Random Effect model. Furthermore,
the secondary data processing and the application of the three methods above will use the
staticytic (software) program Eviews version 7.0
Data Analysis Technique
The analysis instrument used in the path analysis model refers to four models, namely:
1. Multiple regression model. It is a model that uses several independent variables (exogenous)
with one or more dependent variables (endogenous).
2. Mediation model through an intermediate variable. It is a model that uses several
independent variables, intermediate variables and endogenous variables,
3. Combined model between the first and the second model,
4. Complex model which used more than one independent variable (exogenous), intermediate
variable and dependent variable (endogenous)
The model is built with a simple linear regression equation system that is constructed into two
simple linear regression models. (1) The first model illustrates the influence of Profitability
(ROA), Asset Growth (GO) and Capital Structure (DER) against Risk (RISK) of banking
companies listed on the Indonesia Stock Exchange (IDX); (2) The second model illustrates the
influence of Profitability (ROA), Growth of Assets (GO), Capital Structure (DER) and risk
(RISK) on Bank Value (PBV) of banks listed on the Indonesia Stock Exchange (IDX); The
simple linear regression equation that is built is as follows:
1) The effect of Profitability (ROA), Asset Growth (GO) and Capital Structure (DER) on Risk
(RISK) of banking companies listed on Indonesia Stock Exchange (IDX).
RISKit = α0 + α1ROAit + α2GOit + α3DERit + ɛit
2) The Influence of Profitability (ROA), Asset Growth (GO), Capital Structure (DER) and risk
(RISK) on Bank Value (PBV) of banks listed on the Indonesia Stock Exchange (IDX).
PBVit = α0 + α1ROAit + α2GOit + α3DERit +α4RISKit + ɛit
Note:
0,0,0 = coefficient of constants
432111 ,,,,, = parameter coefficients
t = error term
PBV = Firm Value
RISK = Firm Risk
ROA = Profitability
GO = Asset Growth
DER = Capital Structure

International Journal of Business and Management Review
Vol.6, No.2, pp.29-44, March 2018
___Published by European Centre for Research Training and Development UK (www.eajournals.org)
36 ISSN: 2052-6393(Print), ISSN: 2052-6407(Online)
DISCUSSION
The estimation results of the Company Value (PBV) model of banking institutions in Indonesia
are presented in table 2 using OLS method as follows:
Table 2 : Estimation Result of the Company Value Model
Dependent Variable: LOG(PBV?)
Method: Pooled Least Squares
Date: 09/03/17 Time: 18:12
Sample: 2006 2016
Included observations: 11
Cross-sections included: 5
Total pool (balanced) observations: 55
Variable Coefficient Std. Error t-Statistic Prob.
C 3.201071 0.419912 7.623186 0.0000
ROA? 0.483925 0.052755 9.173055 0.0000
GO? 0.000149 0.006496 0.022979 0.9818
DER? -0.036859 0.016265 -2.266207 0.0278
RISK? 0.092058 0.015082 6.103900 0.0000
R-squared 0.830051 Mean dependent var 5.471240
Adjusted R-squared 0.816456 S.D. dependent var 0.928019
S.E. of regression 0.397583 Akaike info criterion 1.079680
Sum squared resid 7.903596 Schwarz criterion 1.262165
Log likelihood -24.69120 Hannan-Quinn criter. 1.150248
F-statistic 61.05169 Durbin-Watson stat 0.906795
Prob(F-statistic) 0.000000
Source: Processed With EViews 6.0
The estimation result of the model of Corporate Value of banking institution presented in table
4.5 above can be made the following linear equation:
PBV = 3.201071 + 0.483925 (ROA) + 0.000149 (GO) - 0.036859 (DER) + 0.092058
(RISK)
From the model of estimation result, the DW statistic value equals to 0.906795. With the
independent variable = 4, the number of samples n = 55, and at α = 0.05, then the dl value =
0.779 and the du value = 1,900.
Multicollinearity Test
The multicolinerarity test uses VIF and Tolerence. To calculate the VIF and Tolerence the
independent variable correlation matrix first is determined as shown in Table 4.6. An
increasingly large VIF value indicates an increasingly serious multicolinearity problem. The
rule used is if the VIF is greater than 10 and greater than 0.90 then the variable has high
cholinearity.

International Journal of Business and Management Review
Vol.6, No.2, pp.29-44, March 2018
___Published by European Centre for Research Training and Development UK (www.eajournals.org)
37 ISSN: 2052-6393(Print), ISSN: 2052-6407(Online)
Table 3: Variable Correlation Matrics
Variable ROA GO DER RISK
ROA 1 -0.02432 0.416882 -0.32598
GO -0.02432 1 -0.02721 -0.25376
DER 0.416882 -0.02721 1 -0.75114
RISK -0.32598 -0.25376 -0.75114 1
Tabel 4: VIF Value of Free Variable
Variabel ROA GO DER RISK
ROA 0 1.000592 1.210347 1.118897
GO 1.000592 0 1.000741 1.068826
DER 1.210347 1.000741 0 2.294674
RISK 1.118897 1.068826 2.294674 0
From the VIF value of the correlation of the independent variables in Table 4.6 and Table 4.7
there is no variable in which VIF value is greater than 10, that is, that all the independent
variables examined there is no multicollinearity problem.
Normality test
Normality test can be seen on the value of Jarque-Bera Test on the estimation result of each
model. In Company Value Model, normality test results is obtained Jarque-Bera value and
probability value of each variable are presented in Table 5.
Table 5: Jarque-Bera Value and Probability of PBV Model
RESID_PBV RESID_ROA RESID_GO RESID_DER RESID_RISK
Jarque-Bera 0.499830 0.499830 0.499830 0.499830 0.499830
Probability 0.778867 0.778867 0.778867 0.778867 0.778867
The table 5 above shows the Jarque-Bera value of each variable of the Company Value model
and the probability value of each variable in each model used which is greater than α = 0.05
which means the residual of each model is normally distributed or fulfill the assumption
normality.
Model Conformity Test Results
From result of regression of equation of company value (PBV) obtained F-Statistic value
61.05169 with probability F-statistic equal to 0,000000 less than α = 1%, 5% and 10%. This
means that together Profitability (ROA), Asset Growth (GO), Capital Structure (DER) and Risk
(RISK) have a significant effect on the value of banking companies in Indonesia with 95%
confidence level.
The R2 lies between 0 and 1. R2 equals 1, meaning the independent variables explain 100
percent of the dependent variable variations. Conversely, if R2 equals 0, it means that the
independent variables in the model do not explain the slightest variation of the dependent
variable. The model is said to be better if R2 is closer to 1 (Gujarati: 99). From result of
International Journal of Business and Management Review
Vol.6, No.2, pp.29-44, March 2018
___Published by European Centre for Research Training and Development UK (www.eajournals.org)
38 ISSN: 2052-6393(Print), ISSN: 2052-6407(Online)
regression of company value model obtained by value of R2 = 0,830051 which means that the
magnitude of direct influence (direct effect) variable Profitability (ROA), Asset Growth (GO),
Capital Structure (DER) and Level of Risk (RISK) to Company Value (PBV) banking
institutions in Indonesia amounted to 83.01% while the rest of 16.99% explained by other
variables outside the model used in this study.
Partial test is also called the test of significance (test of significance). Partial test results of each
model are as follows:
1. The Productivity (ROA) in Corporate Value (PBV) with t-statistics of 9.173055 and with a
t-statistical probability of 0.0000 smaller than α = 0.05 which means the influence of ROA
on PBV significantly positive with a confidence level of 95 percent.
2. The Growth of Assets (GO) in Corporate Value (PBV) with t-statistics of 0.022979 and with
a t-statistical probability of 0.9818 greater than a = 0.05 which means the effect of GO on
PBV is not significantly positive with the level of confidence by 95 percent.
3. The Capital Structure (DER) in Company Value (PBV) with t-statistics of -2.266207 and
with a t-statistic probability of 0.0278 is smaller than α = 0.05 which means the effect of
DER on PBV is negatively significant with the level of confidence by 95 percent.
4. Risk Level (RISK) in Corporate Value (PBV) with t-statistics of 6.103900 and with a t-
statistical probability of 0.0000 smaller than α = 0.05 which means the RISK effect on PBV
is significantly positive with a level of confidence of 95 percent.
From the estimation of the model used, the risk level model that explains the effect of
profitability variable, asset growth and model structure to risk level variable, while in the
company value model explain the effect of profitability variable, asset growth and model
structure and variable of risk level directly to variable the value of the company. In addition,
the estimates of both models will explain the total effect of profitability variables, asset growth
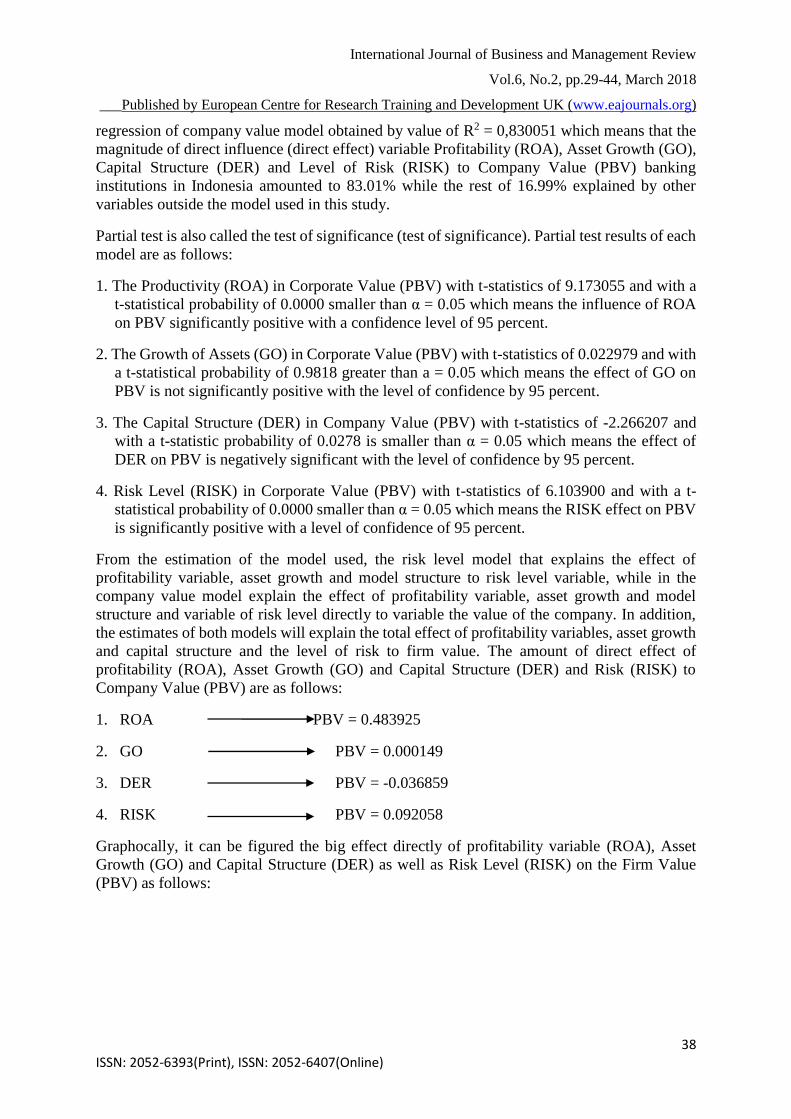
and capital structure and the level of risk to firm value. The amount of direct effect of
profitability (ROA), Asset Growth (GO) and Capital Structure (DER) and Risk (RISK) to
Company Value (PBV) are as follows:
1. ROA PBV = 0.483925
2. GO PBV = 0.000149
3. DER PBV = -0.036859
4. RISK PBV = 0.092058
Graphocally, it can be figured the big effect directly of profitability variable (ROA), Asset
Growth (GO) and Capital Structure (DER) as well as Risk Level (RISK) on the Firm Value
(PBV) as follows:

International Journal of Business and Management Review
Vol.6, No.2, pp.29-44, March 2018
___Published by European Centre for Research Training and Development UK (www.eajournals.org)
39 ISSN: 2052-6393(Print), ISSN: 2052-6407(Online)
Figure 4.6 Direct Influence of ROA, GO, DER and RISK
against the Company Value (PBV)
PY1X1 = 0.483925
PY1X2 = 0.000149
PY1Y2 = 0.09205
PY1X3 = -0.036859
While the indirect effect of profitability variable (ROA), Asset Growth (GO) and Capital
Structure (DER) through Risk Level (RISK) to Company Value of PBV are as follows:
Figure 1. Indirect Influence ROA, GO, DER Through RISK
Against the Company Value (PBV)
PY2X1 = -0.532683
PY2X2 = -1.417016 PY1Y2 = 0.092058
PY2X3 = -0.001703
From figure 1 is described with the following model:
ROA (X1) through RISK (Y2) on PBV (Y1) = PY2X1 * PY1Y2
= (-0.532683) * (0.092058)
Profitability
(ROA) – X1
Assets Growth
(GO)–X2
Firm Value
(PBV) – Y1
Risk Level
(RISK) – Y2
Capital
Structure (DER)
– X3
Assist Growth
(GO)–X2 Firm Value
(PBV) – Y1 Risk Level
(RISK) – Y2
Capital
Structure (DER)
– X3
Profitability
(ROA) – X1

International Journal of Business and Management Review
Vol.6, No.2, pp.29-44, March 2018
___Published by European Centre for Research Training and Development UK (www.eajournals.org)
40 ISSN: 2052-6393(Print), ISSN: 2052-6407(Online)
= -0.04904
GO (X2) through RISK (Y2) on PBV (Y1) = PY2X2 * PY1Y2
= (-1.417016) * (0.092058)
= -0.13045
DER (X3) through RISK (Y2) on PBV (Y1) = PY2X3 * PY1Y2
= (-0.001703) * (0.092058)
= - 0.00016
ROA (X1) RISK (Y2) PBV(Y1) = -0.04904
GO (X2) RISK (Y2) PBV (Y1) = -0.13045
DER (X3) RISK (Y2) PBV (Y1) = -0.00016
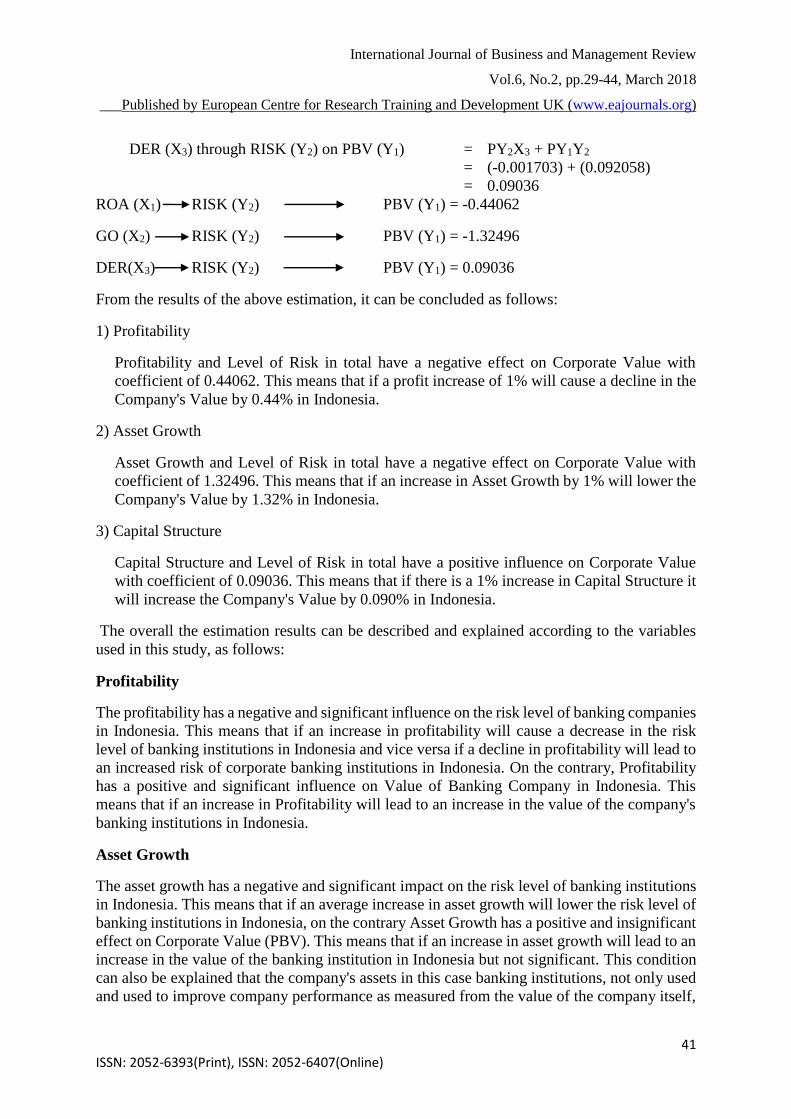
The total relationship of ROA (X1), GO (X2), DER (X3) through RISK (Y2) to Company
Value (Y1) is as follows
Figure 2
Indirect Influence ROA, GO, DER through RISK against PBV
PY2X1 = -0.532683
PY2X2 = -1.417016 PY1Y2 = 0.092058
PY2X3 = -0.001703
From 2 it is interpreted with the following model:
Total Relationship ROA (X1) through RISK (Y2)
on PBV (Y1)
=
PY2X1 + PY1Y2
= (-0.532683) + (0.092058)
= -0.44062
GO (X2) through RISK (Y2) on PBV (Y1) = PY2X2 + PY1Y2
= (-1.417016) + (0.092058)
= -1.32496
Profitability
(ROA) – X1
Assets Growth
(GO)–X2 Firm Value
(PBV) – Y1 Risk Level
(RISK) – Y2
Capital
Structure (DER)
– X3
International Journal of Business and Management Review
Vol.6, No.2, pp.29-44, March 2018
___Published by European Centre for Research Training and Development UK (www.eajournals.org)
41 ISSN: 2052-6393(Print), ISSN: 2052-6407(Online)
DER (X3) through RISK (Y2) on PBV (Y1)
=
PY2X3 + PY1Y2
= (-0.001703) + (0.092058)
= 0.09036
ROA (X1) RISK (Y2) PBV (Y1) = -0.44062
GO (X2) RISK (Y2) PBV (Y1) = -1.32496
DER(X3) RISK (Y2) PBV (Y1) = 0.09036
From the results of the above estimation, it can be concluded as follows:
1) Profitability
Profitability and Level of Risk in total have a negative effect on Corporate Value with
coefficient of 0.44062. This means that if a profit increase of 1% will cause a decline in the
Company's Value by 0.44% in Indonesia.
2) Asset Growth
Asset Growth and Level of Risk in total have a negative effect on Corporate Value with
coefficient of 1.32496. This means that if an increase in Asset Growth by 1% will lower the
Company's Value by 1.32% in Indonesia.
3) Capital Structure
Capital Structure and Level of Risk in total have a positive influence on Corporate Value
with coefficient of 0.09036. This means that if there is a 1% increase in Capital Structure it
will increase the Company's Value by 0.090% in Indonesia.
The overall the estimation results can be described and explained according to the variables
used in this study, as follows:
Profitability
The profitability has a negative and significant influence on the risk level of banking companies
in Indonesia. This means that if an increase in profitability will cause a decrease in the risk
level of banking institutions in Indonesia and vice versa if a decline in profitability will lead to
an increased risk of corporate banking institutions in Indonesia. On the contrary, Profitability
has a positive and significant influence on Value of Banking Company in Indonesia. This
means that if an increase in Profitability will lead to an increase in the value of the company's
banking institutions in Indonesia.
Asset Growth
The asset growth has a negative and significant impact on the risk level of banking institutions
in Indonesia. This means that if an average increase in asset growth will lower the risk level of
banking institutions in Indonesia, on the contrary Asset Growth has a positive and insignificant
effect on Corporate Value (PBV). This means that if an increase in asset growth will lead to an
increase in the value of the banking institution in Indonesia but not significant. This condition
can also be explained that the company's assets in this case banking institutions, not only used
and used to improve company performance as measured from the value of the company itself,

International Journal of Business and Management Review
Vol.6, No.2, pp.29-44, March 2018
___Published by European Centre for Research Training and Development UK (www.eajournals.org)
42 ISSN: 2052-6393(Print), ISSN: 2052-6407(Online)
but company assets are used also to maintain and cope with corporate financial problems. In
this case is exemplified by banking institutions of Bukopin, where in 2008, the growth of assets
of these banking institutions dropped to below zero percent.
CONCLUSION
Profitability-Risk Level and Asset Growth - Risk Level totally have a negative effect on the
value of the banking companies in Indonesia. Meanwhile, the Capital Structure - The Risk
Level totally have a positive influence on the value of banking companies in Indonesia. The
estimation result shows that the profitability variable has the biggest influence directly
compared with indirectly. Meanwhile, the asset growth variable and the capital structure have
the biggest influence indirectly.
REFERENCES
Ariyanto, Taufik, 2004, Profil Persaingan Usaha Dalam Industri Perbankan Indonesia,
Komisi Pengawas Persaingan Usaha (KPPU), Jakarta
Aviliani, 2012, Segmentasi Nasabah Tabungan Mikro Berdasarkan Recency, Frequency dan
Monetary : Kasus Bank BrI, Finance and Banking Journal, Vol. 13 No. 1
Alhadeff, David A., 1951,The Market Structure of Commercial Banking in the United States.
The Quarterly Journal of Economics Vol 65 No 1 (Feb., 195i), pp 62-86. The MIT
Press.
Anonimous. 2004. Laporan Pengawasan Perbankan Tahun 2004. Bank Indonesia: Jakarta
___________2005. Laporan Pengawasan Perbankan Tahun 2005. Bank Indonesia : Jakarta.
___________2006. Laporan Pengawasan Perbankan Tahun 2006. Bank Indonesia: Jakarta.
___________2007.Laporan Pengawasan Perbankan Tahun 2007. Bank Indonesia: Jakarta.
Abdullah, B dan W. Santoso, 2001, The Indonesian Bangking Industry :Compotition,
Consolidation and systemic Stability, BIS Paper No. 4.
Bain, Joe E, 1951, Relation of Profit Rate to Industry Compotition : American
Manufacturing, 1936-1950, The Quartely of Economic, 65 hsl.
Baltagi, H. Badi. 2005. Econometric Analysis of Panel Data 3rd ed., John Wiley & Sons,
Ltd.: Chichester, England. Journal of Indonesian Applied Economics Vol. 4 No. 1 Mei
2010, 1-10
Bank Indonesia, 2007, Sejarah Perbankan Periode 1983-1997. http://www.bi.go.id/ NR/
rdonlyres/ D1FC7FE4-7400-4A35-B021- A4596387C20A/827/ Sejarah Perbankan
Periode 19831997.pdf
Bikker, JA dan Grieneveld, JM, 1998, Competition and Concentration in the EU Banking
Industry. Research Series Supervision no 8.
Bikker, JA dan Haaf Katharina, 2001, Competition, Concentration and Their Relationship: an
Empirical Analysis of the Banking Industry. Journal Banking and Finance.
Bikker, B., Spierdijk, L dan Finnie, P., 2006, Misspesification of the PanzarRosse Model:
Assesing Competition in the Banking Industry. Working Paper no 114/2006, de
Nederlansche Bank NV
Bikker, Jakob A. dan Haaf, Katharina. 2002. Competiton, Concentration and Their
Relationship: An Empirical Analysis of The Banking Industry. Journal of Banking &
Finance 26 (2002) 21912214.++++

International Journal of Business and Management Review
Vol.6, No.2, pp.29-44, March 2018
___Published by European Centre for Research Training and Development UK (www.eajournals.org)
43 ISSN: 2052-6393(Print), ISSN: 2052-6407(Online)
Cetorelli, Nicholson, 2001, Competition Among Banks: Good or Bad?, Economic Perspective
Federal Reserve Bank of Chicago.
Chandler, Lester V., 1938, Monopolistic Elements in Commercial Banking. TheJournal of
Political Economy Vol. 46 No 1 (Feb. 1938), pp 1-22.
Claessen, S, Laeven, L Bikker, JA danHaaf Katharina, 2001, Competition, Concentration and
Their Relationship: an Empirical Analysis of the Banking Industry. Journal Banking
and Finance.
Claessens, Stijn dan Laeven, Luc. 2003. What Drive Bank Competition? Some International
Evidence. World Bank Policy Research: Working Paper 3113.
Claessen, S dan Laeven, L., 2004, What Drives Bank Competition: Some International
Evidence. Journal of Money, Credit, and Banking.
Dahlan Siamat, 2005, Manajemen Lembaga Keuangan, Kebijakan Moneter dan Perbankan,
Edisi Kelima, Jakarta, LP-FEUI.
Daruri A Denidan Edward Djoni, 2004, BPPN: Garbage In Garbage Out. Center for Banking
Crisis. Jakarta
deRozas, Luis Guitierrez, 2007, Testing for the Competition in the Spanish Banking Industry
: the Pazar-Rosse Approach Revisited. Madrid:The Working Paper Series, Banco de
Espana.
De Jonghe, Olivier danVennet, Rudi Vander. 2008. Competition versus efficiency: What
drives Franchise values in European banking?. Journal of Banking & Finance
De Guavara, Maudos, dan Perez, 2002, Market Power in European Banking Sector. IVIE
Working Papers.
E. Mamatzakiz, C. Staikouras dan N. Koutsomanoli-Fillipaki. 2005. Competition and
Concentration in The Banking Sector of The South Eastern European Region. Emerging
Market Review 6 (2005) 192-209.
Ferry N. Idroes dan Sugiarto, 2006, Manajemen Risiko Perbankan Dalam Konteks
Kesepakatan Basel dan Peraturan Bank Indonesia, Jakarta, Graha Ilmu.
Gilarso, T, 2007, Pengantar Ekonomi Mikro, Kanisius, Yogyakarta
Gujarati, Damodar N., 2003,Basic Econometric Fourth Edition. Singapore: McGraw-
Hill/Irwin 436 Buletin Ekonomi Moneter dan Perbankan, April 2013.
Gujarati, Damodar 2004.Basic Econometrics 4th Edition.McGraw-Hill Publisher.
Heffernan, Shelagh. 2005. Modern Banking, John Wiley & Sons, Ltd.: Chichester, England.
Hondroyiannis, G., Lolos S., dan Papapetrou E. 1999. Assesing Competitive Conditions in
The Greek Banking System. Journal of International Financial Markets, Institutions and
Money 9 (1999) 377-391.
Jim Wong, Eric Wong, Tom Fong dan K.F. Choi. 2006. Competition in Hong Kong’s
BankingSector : A Panzar-Rosse Assesment. Research Departement, Hong Kong
Monetary Authority.
Kuncoro, Mudrajad. 2007. Metode Kuantitatif : Teori dan Aplikasi untuk Bisnis dan
Ekonomi. Edisi Ketiga. Yogyakarta: UPP AMP YKPN.
Lindegren, C, Garcia, G. danSaal, MI., 1996, Bank Soundness and Macroeconomic Policy.
Washington, DC: International Monetary Fund- Publication Service.
McLeod, Ross, 1999, Control and Competition : Banking deregulation and re-gulation
Indonesia, Journal of the Asia Pasific Economy,
Manurung, Mandala, 2004, Uang, Perbankan, dan Ekonomi Moneter : Kajian Kontekstual
Indonesia. Jakarta: FakultasEkonomi UI.
Mulyaningsih, Tri. dan Daly, Anne. 2011. Competitive Conditions In Banking Industri: An
Empirical Analysis Of The Consolidation, Competition And Concentration In The

International Journal of Business and Management Review
Vol.6, No.2, pp.29-44, March 2018
___Published by European Centre for Research Training and Development UK (www.eajournals.org)
44 ISSN: 2052-6393(Print), ISSN: 2052-6407(Online)
Indonesia Banking Industri Between 2001 And 2009”. Bank Indonesia. Buletin
Ekonomi, Moneter dan Perbankan, Oktober 2011: 151-185.
Nachrowi D Nachrowi dan Usman, Hardius, 2006, Pendekatan Populer dan Praktis
Ekonometrika untuk Analisis Ekonomi dan Keuangan. Jakarta: LembagaPenerbit FEUI.
Narbuko, Cholid dan Achmadi, Abu. 1999. Metodologi Penelitian, Jakarta: PT. Bumi Aksara.
Nawawi. 1993. Metode Penelitian Kuantitatif, LP3S: Jakarta.
Nicholson, Walter, 2005,Microeconomic Theory: Basic Principles and Extensions. USA:
Thomson South-Western.
Setyowati, Rini, 2004, Tingkat Persaingan Industri Perbankan di Indonesia Tahun 1991-
2002. Tesis untuk mendapatkan gelar Magister Sains Ekonomi di PSIE UI.
Shaffer, Sherrill, 1982, A Nonstructural Test for Competition in Financial Market.
Proceeding of a Conference on Bank Structure and Competition. Federal Reserve Bank
of Chicago.Sato, Yuri. 2005. Bank Restructuring and Financial Institutional Reform in
Indonesia. The Developing Economies XLIII-1 (March 2005): 91-120.
Shaffer, Sherrill. 2004. Patterns of Competition in Banking. Journal of Economics and
Business 56 (2004) 287-313. Soedrajat.Maret, 2004. Menuju Sistem Perbankan Untuk
Mendukung Pertumbuhan.
Suhartati, Joesron Tati dan Fathorrazi, M. 2004. Teori Ekonomi Mikro. Salemba Empat.
Jakarta.
Sugiharto, Agus. 2003. Arsitektur Perbankan Indonesia: Suatu Kebutuhan dan Tantangan
Perbankan kedepan. Jakarta.
Varian, Hal R., 1992, Microeconomic Analysis. New York: WW Norton & Company, Inc.
Yildirim, SH dan Philippatos GC., 2004, Competition and Contestability in Central and
Eastern European Banking Markets.
https://core.ac.uk/download/pdf/11734478.pdf
http://rahajeng25b025.blogspot.co.id/2014/12/pengaruh-besarnya-uah-kerja-terhadap.html)
http://www.organisasi.org/1970/01/tiga-teori-upah-kompensasi-ekonomi-sdm-teori-ekonomi-
pasar-teori-standar-hidup-dan-teori-kemampuan-untuk-
membayar.html#.Wh6GSbBpHDc
http://repository.uin-suska.ac.id/4484/3/10.BAB%20II.pdf
http://library.gunadarma.ac.id/pengendalian-piutang-terhadap-pendapatan.html/
http://www.kompasiana.com/pengaruh-kenaikan-umr-terhadap-perekonomian.58/


