
Versão impressa ISSN 1676-689X / Versão on line ISSN 1980-6477 http://www.abms.org.br
Revista Brasileira de Milho e Sorgo, v.13, n.3, p. 347-363, 2014
AN ALTERNATIVE APPROACH TO THE ACTUAL BRAZILIAN MAIZE CROP ZONING
JÉSSICA DE SOUSA PAIXÃO1, CAMILO DE LELIS TEIXEIRA DE ANDRADE2, AXEL GARCIA Y GARCIA3, TALES ANTÔNIO AMARAL4, ANTONIO JOSÉ STEIDLE NETO1 AND FÁBIO
RICARDO MARIN5
1UFSJ, Sete Lagoas, MG, Brasil, [email protected], [email protected] Milho e Sorgo, Sete Lagoas, MG, Brasil, [email protected] of Minnesota, Minnesota, MN, USA, [email protected], Pelotas, RS, Brasil, [email protected], Piracicaba, SP, Brasil, [email protected]
RESUMO - O cultivo de milho em regime de sequeiro é afetado pelas variabilidades climáticas anual e interanual, especialmente os veranicos, que reduzem a produtividade. Uma das estratégias mais simples e de baixo custo para mitigar esse problema é a determinação de uma janela de semeadura. O estudo objetivou: a) usar a produtividade de milho simulada com um modelo baseado em processos para estabelecer períodos de semeadura; e b) comparar os resultados obtidos com a atual metodologia do Zoneamento Agrícola de Risco Climático (ZRC) empregada pelo Ministério da Agricultura, Pecuária e Abastecimento (Mapa). Utilizou-se o modelo CSM-Ceres-Maize para simular cenários de épocas de semeadura semanais, sob condições de sequeiro, para municípios selecionados do estado de Minas Gerais. Para cada época de semeadura, determinou-se a quebra de rendimento, comparando o rendimento médio da época de semeadura atual com o maior rendimento médio obtido a partir de todas as datas de semeadura. O uso de um modelo baseado em processos para simular o rendimento das culturas permite a integração de muitos fatores não considerados na atual metodologia do ZRC-Mapa. A abordagem proposta tem vantagens sobre a metodologia do ZRC-Mapa, entre as quais a possibilidade de determinar o rendimento médio esperado e a sua amplitude.Palavras-chave: Zea mays L., risco climático; janela de semeadura; modelagem; DSSAT.
UMA METODOLOGIA ALTERNATIVA PARA O ZONEAMENTO DE RISCO CLIMÁTICO DA CULTURA DO MILHO
ABSTRACT - Maize cropping under rainfed conditions are highly affected by the annual and intra-seasonal climate variability, especially dry spells, that affect yield. One of the simplest strategies with low cost to mitigate this problem is the determination of a sowing window. The study aimed to: a) use the maize yield simulated with a process-based model to establish sowing windows and, b) compare our results with the current Agricultural Crop Zoning of Climate Risk (ZRC) methodology employed by the Brazilian Ministry of Agriculture, Livestock and Supply (MAPA). The CSM-CERES-Maize model was used to simulate scenarios of weekly sowing dates, under rainfed conditions, for selected counties of Minas Gerais State, Brazil. For each sowing date it was determined the yield break by comparing the average yield of the current sowing date with the highest average yield obtained from all sowing dates. The use of a process-based model to simulate crop yield allows for the integration of several factors not considered in the ZRC-MAPA approach. The proposed methodology has advantages over the ZRC-MAPA approach in that it includes the possibility of determining the expected average yield and its amplitude.Key words: Zea mays L., climate risk; sowing window; modeling; DSSAT.
Revista Brasileira de Milho e Sorgo, v.13, n.3, p. 347-363, 2014 Versão impressa ISSN 1676-689X / Versão on line ISSN 1980-6477 - http://www.abms.org.br
Paixão et al.348
Grown in almost every continent, maize economic importance is characterized by the vari-ous forms of its use, from grazing to biofuels. Worldwide, Brazil is the third largest maize grow-er, with the state of Minas Gerais ranking third in production within the country (Agrianual, 2013). The average maize yield in Brazil is low with high variation within a region. In Minas Gerais, the av-erage maize yield ranges from 6299 kg ha-1 in the Triângulo Mineiro region to 1898 kg ha-1 in the north region (IBGE, 2010). Possible causes of this low yield are related to the low level of technology employed by farmers, including sowing at inad-equate time, water stress due to dry spells, and the use of cultivars with low adaptation to the region (Cruz et al., 2009; Forsthofer, 2004).
Minas Gerais agriculture is mainly rainfed. The rainfall in the state, ranging from 650 mm in the north region to 2100 mm in the south/south-west regions, is related to topography and geog-raphy (Santana, 2004; Guimarães et al., 2010). It is expected, therefore, that the main factor affect-ing maize yield in the state is water. Among all climatic factors, rainfall, temperature and solar radiation, are the most important as they directly affect the production of dry matter and grain (Sans & Guimarães, 2006; Brachtvogel et al., 2009). Water availability and temperature are the most important factors to be considered to characterize the best growing seasons within a region (Wagner et al., 2013).
One strategy to minimize the risk of yield losses due to climatic conditions is sowing at the right time. The success of such approach is tightly related to the planning capability of the farmer as it is highly dependent on several factors associ-ated to weather conditions (Sans & Guimarães,
2006). The Brazilian Ministry of Agriculture, Livestock and Supply (MAPA) provides farmers with an Agricultural Crop Zoning of Climate Risk (ZRC) tool, which is also used by policy makers and risk management agencies. The ZRC-MAPA is prepared annually with the objective of minimiz-ing the risks associated to weather and to allow producers to identify the best sowing window for various crops with varied cropping season and growing on different soil types (Brasil, 2013).
The ZRC-MAPA approach is based only on a soil-water balance approach. Process-based simulation models that simulate growth, develop-ment, and yield of crops based on weather, soil, cultivar-specific coefficients, and management practices, are better tools to assist in the determi-nation of sowing windows. These dynamic crop models describe daily changes in the inputs used to simulate the main crop physiological processes (Dallacort et al., 2006). Dynamic crop simulation models are useful tools when the effects on crops depend on complex interactions with soil, weath-er and with other factors related to the manage-ment of agro-ecosystems (Jones et al., 2006). The CERES (Crop Environment Resource Synthesis) consists of group of models developed by the Grassland Soil and Water Research Laboratory (Jones & Kiniry, 1986). Among the CERES mod-els, CERES-Maize was developed for the maize crop and allows simulations of the growth and de-velopment of maize, water balance, N levels and also enables economic evaluations based on four input variables: soil, climate, crop management and genotypes (Soler, 2000). The cropping season of maize in the CERES-Maize is divided into vari-ous phases (germination, emergence, end of juve-nile phase, floral induction, silking, beginning of

Revista Brasileira de Milho e Sorgo, v.13, n.3, p. 347-363, 2014 Versão impressa ISSN 1676-689X / Versão on line ISSN 1980-6477 - http://www.abms.org.br
An alternative approach to the actual brazilian maize... 349
grain filling, and harvest maturity), while devel-opment is influenced by the thermal sum or ther-mal time, expressed in degree-days (DD), which is calculated based on the minimum and maximum daily temperatures. The thermal time required to progress from one stage of development to another is a user input and can be defined as: P1 - Thermal time from seedling emergence to the end of the juvenile phase (expressed in DD above a base tem-perature of 8 oC), during which the plant is not re-sponsive to changes in photoperiod; P2 - Extent to which development (expressed in days) is delayed for each hour increase in photoperiod above the longest photoperiod at which development pro-ceeds at a maximum rate (which is considered to be 12.5 hours); P5 - Thermal time from silking to physiological maturity (expressed in DD above a base temperature of 8 oC); G2 - Maximum possible number of kernels per plant; G3 - Kernel filling rate during the linear grain filling stage and under op-timum conditions (mg day-1); PHINT - Phylochron interval, the interval in DD between successive leaf tip appearances (Ritchie et al., 1998; Jones et al., 2003). The CSM-CERES-Maize is part of the Decision Support System for Agrotechnology Transfer, DSSAT (Jones et al., 2003; Hoogenboom et al., 2013), a software that includes models for 28 different crops. The cropping system simulation model (CSM) included in DSSAT v4.5 simulates growth and development of maize at a daily time step, from planting to maturity. Several studies have demonstrated the applicability of DSSAT as a tool to help making management decisions. For example, a study conducted by Singh & Srinivas (2007) in India aimed at determining best plant-ing dates for irrigated and rainfed maize in a suc-cession system with chickpeas. Soler et al. (2007)
assessed the effect of different sowing dates for maize cultivars of different cycles growing on irri-gated and rainfed fields for conditions in Manduri and Piracicaba counties, state of São Paulo, Brazil.
The objectives of this study were to use a simulation approach to determine best sowing win-dows for maize production and to compare those results with the current methodology employed by the ZRC-MAPA.
Material and Methods
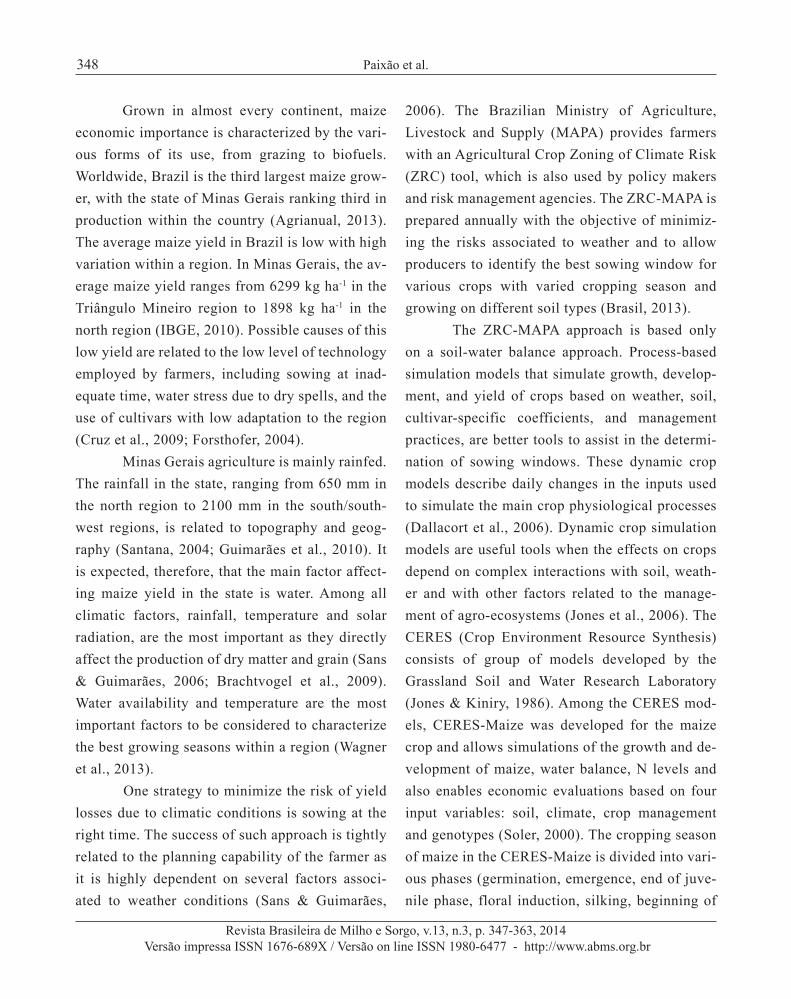
The CSM-CERES-Maize model of DSSAT, version 4.5.1.013 (Hoogenboom et al., 2013) was used to simulate maize yield under rainfed condi-tions. The simulations were set weekly, from August 01 to July 24 for conditions in 49 of 853 counties of the State of Minas Gerais, Brazil (Figure 1). The counties were selected based on the availability of climate series data. Daily data were obtained from the National Institute of Meteorology (INMET) database for the period 1961 to 2010, totaling 49 years. Weatherman, a DSSAT tool to facilitate the manipulation of weather data, was used to analyze the consistency of the data, to fill up short periods (< 7 days) of gaps on air temperature and rainfall in the series and to estimate solar radiation from sunlight records.
The genetic coefficients of the single-cross hybrid BRS1030 were previously determined from observed data obtained from maize field trials con-ducted under optimum conditions of growth and development (Santana et al., 2010). The adjusted coefficients were 263.8 for P1; 0.5 for P2; 1034 for P5; 648 for G2; 5.14 for G3; 44.22 for PHINT. Because of the lack of specific soil information in the areas of interest (selected counties), the same

Revista Brasileira de Milho e Sorgo, v.13, n.3, p. 347-363, 2014 Versão impressa ISSN 1676-689X / Versão on line ISSN 1980-6477 - http://www.abms.org.br
Paixão et al.350
approach used by the current ZRC-MAPA was used (Sans et al., 2001). The ZRC-MAPA criteria consists of a maize crop with a root system 0.50 m deep and three generic soil types with low (20 mm), medium (40 mm) and high (60 mm) water retention capacity. The values of the lower and upper limits of available water of each layer of ex-isting DSSAT´s soil profiles data were adjusted to become similar, in terms of water retention, to the three soil types used in the ZRC-MAPA (Table 1).
The management conditions used in the simulations was obtained from the Embrapa Maize and Sorghum online recommendations for maize production (Cruz, 2009). The model was set for 0.90 m row spacing and a plant population of 68,000 plants ha-1. Fertilization consisted of 500 kg ha-1 of 8-28-16 + Zn applied at sowing and 200 kg ha-1 of nitrogen as urea + 70 kg ha-1 of K2O in, as potassium chloride, side-dressed at 40 days after sowing (DAS).
FIGURE 1. Location of weather stations of the state of Minas Gerais, Brazil, used in the study.

Revista Brasileira de Milho e Sorgo, v.13, n.3, p. 347-363, 2014 Versão impressa ISSN 1676-689X / Versão on line ISSN 1980-6477 - http://www.abms.org.br
An alternative approach to the actual brazilian maize... 351
TABLE 1. Attributes of the three generic soil profiles.
Soil type one
Layer base depth (m)
Lower limit
(m3 m-3)
Upper limit
(m3 m-3)
Saturation (m3 m-3)
Root growth factor
Saturated hydraulic
conductivity(m h-1)
Bulk density(kg m-3)
Organic carbon
(%)
Clay (%)
Silt (%)
pH in Water
0.05 0.050 0.075 0.438 1.0 0.682 1460 0.35 10 1 5.50.10 0.050 0.075 0.438 1.0 0.682 1460 0.35 10 1 5.50.20 0.060 0.085 0.416 1.0 0.601 1540 0.21 9 1 5.50.40 0.067 0.095 0.429 0.8 0.625 1480 0.15 11 1 5.50.60 0.067 0.110 0.439 0.5 0.327 1470 0.13 13 3 5.50.80 0.067 0.114 0.450 0.2 0.451 1430 0.16 15 1 5.51.00 0.067 0.125 0.441 0.0 0.436 1460 0.12 16 0 5.51.20 0.067 0.125 0.441 0.0 0.436 1460 0.12 16 0 5.51.50 0.067 0.125 0.441 0.0 0.436 1460 0.12 16 0 5.5
Soil type two0.05 0.290 0.340 0.568 1.0 0.0523 1050 2.18 63 19 5.70.10 0.280 0.340 0.577 1.0 0.0977 1020 2.10 63 22 5.80.20 0.280 0.350 0.569 1.0 0.0881 1040 2.00 66 21 5.80.40 0.280 0.340 0.580 0.8 0.0715 1010 1.79 70 17 5.50.60 0.270 0.335 0.605 0.5 0.1474 904 1.65 72 13 5.10.80 0.258 0.340 0.619 0.2 0.3011 910 1.53 72 14 5.01.00 0.252 0.335 0.629 0.0 0.3725 880 1.43 72 14 5.01.20 0.252 0.335 0.629 0.0 0.3725 880 1.43 72 14 5.01.50 0.252 0.335 0.629 0.0 0.3725 880 1.43 72 14 5.0
Soil type three0.05 0.265 0.370 0.465 1.0 0.790 1310 2.03 26 36 6.40.10 0.275 0.380 0.452 1.0 0.790 1350 2.03 26 36 6.40.20 0.285 0.385 0.445 1.0 0.790 1370 2.03 27 37 6.40.40 0.280 0.370 0.455 0.8 0.790 1340 2.03 27 37 6.40.60 0.275 0.360 0.451 0.5 0.790 1350 0.44 27 37 6.70.80 0.260 0.360 0.458 0.2 0.790 1330 0.44 29 36 6.71.00 0.260 0.360 0.446 0.0 0.790 1360 0.29 25 32 7.31.20 0.260 0.350 0.410 0.0 0.790 1470 0.15 20 28 7.91.50 0.260 0.350 0.403 0.0 0.790 1490 0.15 18 31 7.9

Revista Brasileira de Milho e Sorgo, v.13, n.3, p. 347-363, 2014 Versão impressa ISSN 1676-689X / Versão on line ISSN 1980-6477 - http://www.abms.org.br
Paixão et al.352
The seasonal analysis tool of DSSAT, which simulates yield for each sowing week and each year, was used. Additionally, the water and nutrient balance routine from the model was turned off to allow the simulation of maize potential yield, in which the crop is grown without any biotic or abiotic stresses. The model was set to perform weekly sowings, beginning on August 01 and extending for 52 weeks to July 24, generating 49 simulation scenarios at each county.
The highest average simulated yield was identified among all sowing dates and a yield break was calculated for each county according to (Amaral et al., 2009):
Yb= [1 - (Yw / Ymax)] × 100
where Yb is the yield break in percentage; Yw is the aver-age yield of week “w” in kg ha-1; and Ymax is the maxi-mum average yield among all weeks in kg ha-1.
An analysis of the yield break curve was per-formed to determine the sowing windows for differ-ent levels of risk that the decision maker would be willing to take. We arbitrarily assumed a risk level of 10%; i.e., the decision maker would tolerate a yield reduction of up to 10%. In the example showed in Figure 2, the sowing windows would be from October 24 to December 19, October 17 to December 26 and from October 10 to December 26, for soil type 1, type 2 and type 3, respectively.
The criteria used to determine whether a county was suitable or not for maize production was based on the relationship:
Ypr = [1 - (Ystr / Ypot)] × 100
where Ypr is the yield break relative to the potential yield in percentage; Ystr is the average
rainfed yield, for the sowing window, in kg ha-1 and Ypot is the average potential yield, for the same sowing window, in kg ha-1. A county was consid-ered suitable for maize production when Ypr was 60% or less. This procedure was performed for the three soil types in all counties.
The simulated yields from the 49 counties and for the three different soils were then interpo-lated by using a kriging procedure. The software gvSIG 1.11 (gvSIG, 2013) and Quantum GIS 1.9 (Quantum, 2013) were used to create the yield maps.
The yield break curve approach allowed determining the suitability for maize production and the establishment of a sowing window for each selected county as demonstrated for Uberaba, Minas Gerais, Brazil (Figure 2). Our results were compared with the suitability and sowing windows established by the ZRC-MAPA. Additionally, the average expected maize yield was determined for each soil type and county. Results for soil type 2, the most common in Brazil, were compared to the average estimated yield provided by the Brazilian Institute of Geography and Statistics (IBGE), for the period 2003 to 2011.
Results and Discussion
Our results showed large maize yield vari-ation as a consequence of the climatic diversity in the state of Minas Gerais, characterized by humid climate in the south to semi-arid climate in the north and northeastern regions (Figure 3).
The average yield of maize, for the sowing window, ranged from 750 kg ha-1, in Espinosa, to 10,523 kg ha-1, in Maria da Fé. Regardless of the soil-water retention capacity, the regions North,

Revista Brasileira de Milho e Sorgo, v.13, n.3, p. 347-363, 2014 Versão impressa ISSN 1676-689X / Versão on line ISSN 1980-6477 - http://www.abms.org.br
An alternative approach to the actual brazilian maize... 353
Jequitinhonha and Vale do Rio Doce, which are drier and warmer, presented the lowest yield, while the south region, which is wetter and has milder temperatures, showed the highest. Yields below 1,000 kg ha-1 were considerably larger in the regions North, Jequitinhonha, Vale do Mucuri and Vale do Rio Doce, especially in soils with poor water holding capacity (soil type 1). For soils with medium or high water holding capacity (soils type 2 and type 3), the amplitude of the simulated yield was higher due to better crop response to nitrogen fertilization in years with more favorable climatic conditions (Figure 3). This yield variability ob-served in our results is the consequence of the inter-actions between crop, soil and climatic conditions, especially water. Crop productivity is the result of the interaction of various factors, especially those
related to soil attributes. However, Bergamaschi et al. (2004), indicate that water is the main factor that affects maize yield worldwide.
There is a close relationship between the average simulated maize yield and elevation and latitude of the sites (Figure 4). The higher the lati-tude and altitude, the greater the simulated maize yields. This is because for conditions in Minas Gerais, rainfall and air temperature are related to both, elevation and latitude (Guimarães et al., 2010; Santana, 2004).
When comparing the average simulated yield of the sowing window, for soil type two, with the average maize yield estimated by IBGE, for the 2003 to 2011 period and for the same counties, considerable differences can be observed (Figure 5). These gaps indicate that the average maize
0
10
20
30
Yie
ld b
reak
(%)
Sowing date
Soil type one
Soil type two
Soil type three
FIGURE 2. Maize yield break for different sowing dates in a rainfed production system for conditions in Uberaba, Minas Gerais, Brazil.

Revista Brasileira de Milho e Sorgo, v.13, n.3, p. 347-363, 2014 Versão impressa ISSN 1676-689X / Versão on line ISSN 1980-6477 - http://www.abms.org.br
Paixão et al.354
yield is considerably lower than the potential yield in many counties. The largest yield gaps are in the southern counties, such as Maria da Fé, which has climatic conditions for high maize yields but rugged topography that is not suited for maize production.
On the other hand, in some counties, such as Uberaba, Unai and Frutal, the average simu-lated yields are lower than the average yield esti-mated by IBGE, indicating that in these counties the farmers are utilizing more technology, includ-ing cultivars better than the BRS1030 and, irriga-tion. Maize yield from Unai county is an unusual case because the IBGE data reflects the yield of farms located on the plateau, 300 meters above the location where the weather station is installed.
This difference in elevation has a considerable ef-fect on maize yield mainly due to changes in the amount and distribution of rainfall and in tem-perature. According to a study conducted in the region by Landau et al. (2011) during the 2010 growing season, large increase in maize produc-tion were observed in the south/southwest and western (Campos das Vertentes) regions, eastern of Triângulo Mineiro, and west of the northwest region, which was in agreement with our results (Figure 3).
There is a large variation in the start and in the length of the sowing window (Table 2), as a consequence of the interactions between the crop and the weather conditions of the counties, captured by the simulation model. The shortest
FIGURE 3. Distribution of the average simulated maize yield for the state of Minas Gerais, Brazil, consider-ing soils with different water holding capacity.

Revista Brasileira de Milho e Sorgo, v.13, n.3, p. 347-363, 2014 Versão impressa ISSN 1676-689X / Versão on line ISSN 1980-6477 - http://www.abms.org.br
An alternative approach to the actual brazilian maize... 355
y = 629x - 6879,7R² = 0,6063
100020003000400050006000700080009000
1000011000
14 15 16 17 18 19 20 21 22
Ave
rage
sim
. yie
ld fo
r soi
l typ
e 2
(kg
ha-1
)
Latitude South (decimal)
A
y = 5.5658x + 854.59R² = 0.5634
100020003000400050006000700080009000
1000011000
0 200 400 600 800 1000 1200
Ave
rage
sim
. yie
l for
soil
type
2 (k
g ha
-1)
Elevation (m)
B
FIGURE 4. Maize yield in relation to latitude south (A) and to elevation (B), for soil type two.
FIGURE 5. Average simulated yield for soil type 2 in relation to average yield estimated by IBGE, for the period of 2003-2011.
0
1000
2000
3000
4000
5000
6000
7000
8000
9000
10000
11000
0 1000 2000 3000 4000 5000 6000 7000 8000 9000 10000 11000
Ave
rage
sim
. yie
ld fo
r soi
l typ
e 2
(kg
ha-1
)
Average IBGE yield (kg ha-1)
Unai
Uberaba
Frutal
Maria da FeLine (1:1)

Revista Brasileira de Milho e Sorgo, v.13, n.3, p. 347-363, 2014 Versão impressa ISSN 1676-689X / Versão on line ISSN 1980-6477 - http://www.abms.org.br
Paixão et al.356
TAB
LE
2. S
owin
g w
indo
w a
nd a
vera
ge si
mul
ated
mai
ze y
ield
for c
ount
ies o
f Min
as G
erai
s sta
te, B
razi
l. D
ashe
s ind
icat
e co
unty
uns
uita
ble
for m
aize
pro
duct
ion.
Reg
ions
Cou
ntie
sSo
il ty
pe o
neSo
il ty
pe tw
oSo
il ty
pe th
ree
Sow
ing
win
dow
N° o
f da
ysY
ield
(k
g ha
-1)
Sow
ing
win
dow
N° o
f da
ysY
ield
(k
g ha
-1)
Sow
ing
win
dow
N° o
f da
ysY
ield
(k
g ha
-1)
Triâ
ngul
o M
inei
ro/A
lto
Para
naib
a
Cap
inóp
olis
--
-26
13N
ov-1
4D
ec-1
936
5391
Oct
-17
Dec
-12
5758
59Fr
utal
--
-21
34N
ov-2
1D
ec-2
636
4307
Nov
-7D
ec-2
650
4801
Ube
raba
Oct
-24
Dec
-19
5730
83O
ct-1
7D
ec-2
671
5968
Oct
-10
Dec
-26
7863
63Itu
iuta
ba-
--
2803
Nov
-7D
ec-2
650
5080
Oct
-24
Dec
-26
6458
36A
raxá
Oct
-10
Nov
-21
4336
48O
ct-1
7D
ec-5
5065
88O
ct-1
0N
ov-2
850
7006
Pato
s de
Min
as-
--
2947
Oct
-17
Dec
-19
6458
42O
ct-1
0D
ec-1
971
6181
Nor
te (n
orth
)
Mon
te A
zul
--
-96
1-
--
2096
Oct
-24
Nov
-14
2232
66Ju
ram
ento
--
-21
13-
--
2881
Oct
-17
Oct
-24
845
17Es
pino
sa-
--
709
--
-13
79-
--
2088
Jana
uba
--
-12
28-
--
2171
--
-30
87Ja
nuar
ia-
--
1237
--
-24
35O
ct-2
4O
ct-3
18
3450
Mon
tes C
laro
s-
--
1867
--
-34
54O
ct-1
7O
ct-3
115
4174
Pira
pora
--
-16
19O
ct-2
4N
ov-7
1537
93O
ct-1
7N
ov-1
429
4304
Salin
as-
--
1245
--
-26
13O
ct-1
7O
ct-3
115
3504
Nor
oest
e (n
orth
wes
t)
João
Pin
heiro
--
-29
42O
ct-3
1N
ov-2
122
5896
Oct
-24
Nov
-21
2965
22Fo
rmos
o-
--
3000
Nov
-21
Dec
-12
2249
89O
ct-2
4D
ec-1
957
5671
Arin
os-
--
1992
Oct
-24
Nov
-21
2945
15O
ct-1
7N
ov-1
429
5485
Para
catu
--
-29
97O
ct-2
4N
ov-2
836
5521
Oct
-17
Nov
-21
3662
21U
nai
--
-25
01O
ct-1
7N
ov-2
136
4936
Oct
-17
Nov
-14
2957
58
Jequ
itinh
onha
Car
boni
ta-
--
2247
Oct
-24
Oct
-31
835
48O
ct-1
0O
ct-3
122
4286
Pedr
a Azu
l-
--
1601
--
-23
26-
--
3587
Ara
çuai
--
-78
0-
--
2007
Oct
-17
Nov
-722
2587
Dia
man
tina
--
-33
14O
ct-1
7N
ov-1
429
6655
Oct
-10
Nov
-14
3669
66Ita
mar
andi
ba-
--
2163
Oct
-10
Nov
-14
3641
36O
ct-1
0N
ov-1
436
4846
Car
atin
ga-
--
2038
Oct
-10
Nov
-21
4341
91O
ct-3
Nov
-14
4348
58A
imor
és-
--
949
Oct
-24
Nov
1422
2668
Oct
-17
Nov
-722
3564

Revista Brasileira de Milho e Sorgo, v.13, n.3, p. 347-363, 2014 Versão impressa ISSN 1676-689X / Versão on line ISSN 1980-6477 - http://www.abms.org.br
An alternative approach to the actual brazilian maize... 357
Oes
te (w
est)
Bam
buí
Oct
-31
Dec
-536
3366
Oct
-10
Nov
-28
5058
82O
ct-1
0N
ov-2
850
6914
Oliv
eira
Oct
-10
Out
-31
2237
33O
ct-1
0N
ov-2
143
6295
Oct
-3N
ov-2
150
6968
Div
inóp
olis
Oct
-17
Nov
-722
4283
Oct
-17
Nov
-21
3667
09O
ct-1
7N
ov-1
429
7702
Sul /
Su
does
te
(sou
th /
sou-
thw
est)
Pass
a Q
uatro
Sep-
19D
ec-2
699
3690
Oct
-10
Dec
-557
6633
Sep-
26D
ec-1
278
7051
Mar
ia d
a Fé
--
-48
79Se
p-19
Nov
-28
7110
166
Sep-
26N
ov-2
864
8646
Mac
hado
Oct
-17
Dec
-19
6435
93O
ct-1
7D
ec-1
964
6490
Oct
-17
Dec
-19
6469
13
Lam
bari
Oct
-10
Nov
-28
5049
22O
ct-1
7D
ec-5
5077
23O
ct-1
0D
ec-5
5785
47
Cal
das
Nov
-14
Dec
-26
4346
28N
ov-7
Dec
-26
5075
79O
ct-1
7Ja
n-2
7879
41
Lavr
asO
ct-1
7D
ec-1
964
3464
Oct
-10
Dec
-12
6463
62O
ct-1
0D
ec-5
5768
78
São
Lour
enço
Oct
-3D
ec-1
978
3780
Oct
-10
Dec
-19
7167
31O
ct-1
0D
ec-1
971
7190
Zona
da
Mat
a
Cap
araó
Oct
-10
Dec
-557
4022
Oct
-3N
ov-2
857
5903
Oct
-3N
ov-7
3671
37
Juiz
de
Fora
Oct
-3D
ec-1
271
2871
Oct
-3Ja
n-9
100
5651
Oct
-3Ja
n-16
107
6013
Viç
osa
--
-27
89O
ct-1
0N
ov-2
850
4894
Oct
-3N
ov-2
857
5542
Cen
tral
Bom
Des
pach
o-
--
2982
Oct
-24
Nov
-14
2254
91O
ct-1
0N
ov-7
2965
73
Pom
péu
--
-27
29O
ct-2
4N
ov-1
422
5229
Oct
-10
Nov
-14
3612
45
Cur
velo
--
-17
55O
ct-1
7N
ov-2
136
3948
Oct
-17
Nov
-21
3645
40
Met
ropo
litan
a de
Bel
o H
oriz
onte
Flor
esta
l-
--
3082
Oct
-17
Nov
-28
4356
59O
ct-3
1D
ec-2
657
6866
Bel
o H
oriz
onte
--
-21
27O
ct-1
7D
ec-5
5048
95O
ct-1
0D
ec-5
5752
03
Con
ceiç
ão d
o M
ato
Den
tro-
--
2460
Oct
-10
Nov
-28
5051
77O
ct-1
0N
ov-2
143
5623
Sete
Lag
oas
--
-24
26O
ct-1
0N
ov-2
143
5091
Oct
-3N
ov-2
150
5626
Ibiri
téO
ct-1
7O
ct-3
115
3576
Oct
-10
Nov
-28
5058
89O
ct-1
0N
ov-7
2967
79
João
Mon
leva
de-
--
2644
Oct
-24
Nov
-14
2253
67O
ct-1
0N
ov-1
436
5954
Cam
pos d
as
Verte
ntes
Bar
bace
naSe
p-26
Dec
-12
7837
87O
ct-3
Dec
-564
6864
Oct
-3D
ec-5
6472
94

Revista Brasileira de Milho e Sorgo, v.13, n.3, p. 347-363, 2014 Versão impressa ISSN 1676-689X / Versão on line ISSN 1980-6477 - http://www.abms.org.br
Paixão et al.358
sowing windows, of eight days, were simulated for counties in the North and Jequitinhonha regions, which are the driest and have the highest temper-atures. The longest windows were simulated for the south/southwest and Zona da Mata regions (Table 2). The soil water retention capacity had an important role in defining the start and length of the sowing window, especially in cities with low rainfall.
Shorter sowing windows were also associ-ated with lower yields (Figure 3 and Table 2). It is possible that the sowing date used by farmers is not the most appropriate for each site, contribut-ing to lower than expected yields indicated by the estimates made by IBGE (Figure 5). Sowing out of the appropriate period is the major cause of low maize yield in Brazil (Forsthofer, 2004).
The methodology used to define the suit-ability of a certain county for dryland maize production proved consistent (Table 2). Most of the counties that were considered unsuitable for maize production are located in the North and Jequitinhonha regions, which receive lower amounts of precipitation and, in some cases, are associated with high temperatures. Obviously, the smaller the water holding capacity of the soils, the greater the number of counties considered unsuit-able for rainfed maize production.
When comparing the sowing window and the suitability of the county for maize production (Tables 2 and 3), it can be observed that the pro-posed methodology is more restrictive than the ZRC-MAPA approach. According to the proposed methodology, and regardless of soil type, the counties of Espinoza, Janauba and Pedra Azul are not suitable for rainfed maize production, while when using the ZRC-MAPA approach those same
counties are only suitable for maize production if the soil is of type three. If the soil has low water holding capacity (soil type 1), 34 counties are con-sidered non suitable for rainfed maize production, against nine counties considered non suitable by the ZRC-MAPA approach. For soils with average water holding capacity (soil type 2), nine coun-ties are considered non suitable by the proposed method while all counties are considered suitable by the ZRC-MAPA approach. For the ZRC-MAPA approach (Table 3), the beginning of the sowing window in all counties and for the three soil types, is October 01, while by the proposed methodol-ogy (Table 2), the starting of the sowing win-dow ranged from September 19, in Passa Quatro and Maria da Fé, to November 21, in Formoso. Additionally, by the proposed methodology, the duration of the sowing window varied from eight days in Juramento, Januaria and Carbonita to 107 days, in Juiz de Fora.
For the ZRC-MAPA approach the expect-ed duration of the sowing window is 31, 20, 20 and 92 days, respectively for Juramento, Januaria, Carbonita and Juiz de Fora. In general, in drier re-gions the proposed methodology was more restric-tive than the ZRC-MAPA approach, establishing shorter sowing windows.
The discrepancy in the results obtained with the proposed methodology and the ZRC-MAPA is due to the use of different approaches to determine the sowing window and the suit-ability of the different counties for maize pro-duction. The ZRC-MAPA is based solely on crop water requirements satisfaction, determined through a simple soil water balance (Sans et al., 2001). The proposed methodology is based on a yield break curve, obtained from a process-based

Revista Brasileira de Milho e Sorgo, v.13, n.3, p. 347-363, 2014 Versão impressa ISSN 1676-689X / Versão on line ISSN 1980-6477 - http://www.abms.org.br
An alternative approach to the actual brazilian maize... 359
model, which takes into consideration the crop re-sponse to several factors, including air tempera-ture, radiation and water requirements. The CSM-CERES-Maize model, used in the present study, simulates growth, development and yield of crops deterministically resulting in accurate predictions of the variables of interest; i.e., without any prob-ability distribution or random element associated. One of the advantages of the proposed methodol-ogy is the ability to estimate the expected average yield for each county, which is not provided by the ZRC-MAPA approach. On the other hand, the ZRC-MAPA approach only considers a land area as suitable for maize production if the crop water requirement satisfaction index is greater than 0.6, something that was not considered in the proposed methodology.
The shortest sowing windows and lowest yields were found to be in the North, Jequitinhonha and Vale do Rio Doce regions by both methodolo-gies. These results properly reflect the low levels of economic and social development of those re-gions, which economies are primarily based in ag-riculture. The human development index for the North and Jequitinhonha regions are in the range of 0.568 to 0.707 as compared to 0.744 to 0.841 from of Triângulo and south regions (Santos & Pales, 2012).
Based on this study, it is evident that the current ZRC-MAPA can be improved through the use of process-based simulation models. However, calibration of model´s coefficient for new cultivars and characterization of soil and climate for other Brazilian counties is required. Through the use of the proposed methodology one could improve policies for technology transfer and for granting credit for maize production.
Conclusões
The use of process-based simulation model allowed the establishment of sowing windows as well as the determination of the expected aver-age maize yield for various counties in the state of Minas Gerais, Brazil.
Our results indicate that there is a potential to increase rainfed maize yield for conditions in the state of Minas Gerais.
The proposed methodology turned out to be more restrictive than the approach currently used by the ZRC-MAPA.
The study highlights the needs for bet-ter monitoring of environmental conditions in the state of Minas Gerais, a necessary step to en-able the widespread application of the proposed methodology.
Acknowledgements
To the National Institute of Meteorology (INMET) for providing the historical weather data used in this study. To Embrapa and Monsanto for their support through the project: Evaluation mechanisms of adaptation and genome association applied to the development of genetic resources of cereals drought tolerant.
Referências
AGRIANUAL. Anuário da agricultura brasileira - São Paulo: Instituto FNP, 2013. 480 p.
AMARAL, T. A.; ANDRADE C. L. T.; OLIVEIRA, A. C.; SILVA, D. F.; SANTANA, C. B.; MOURA, B. F.; CASTRO, L. A. Metodologia para o estabelecimento do período de semeadura

Revista Brasileira de Milho e Sorgo, v.13, n.3, p. 347-363, 2014 Versão impressa ISSN 1676-689X / Versão on line ISSN 1980-6477 - http://www.abms.org.br
Paixão et al.360
TABLE 3. Sowing window and number of days of the sowing window for different counties of Minas Gerais state, Brazil, as established by the ZRC-MAPA.
Regions Counties
Soil type one Soil type two Soil type three
Sowing window N° of days Sowing window N° of
days Sowing windowN° of
days
Triângulo Mineiro/Alto
Paranaiba
Capinópolis Oct-1 Nov-30 61 Oct-1 Dec-31 92 Oct-1 Dec-31 92
Frutal Oct-1 Dec-31 92 Oct-1 Dec-31 92 Oct-1 Dec-31 92
Uberaba Oct-1 Dec-31 92 Oct-1 Dec-31 92 Oct-1 Dec-31 92
Ituiutaba Oct-1 Dec-31 92 Oct-1 Dec-31 92 Oct-1 Dec-31 92
Araxá Oct-1 Dec-31 92 Oct-1 Dec-31 92 Oct-1 Dec-31 92
Patos de Minas Oct-1 Nov-10 41 Oct-1 Dec-31 92 Oct-1 Dec-31 92
Norte (north)
Monte Azul - - - Oct-1 Oct-20 20 Oct-1 Oct-31 31
Juramento - - - Oct-1 Oct-31 31 Oct-1 Nov-10 41
Espinosa - - - Oct-1 Oct-20 20 Oct-1 Oct-20 20
Janauba - - - Oct-1 Oct-31 31 Oct-1 Nov-10 41
Januaria Oct-1 Oct-20 20 Oct-1 Oct-31 31 Oct-1 Nov-10 41
Montes Claros Oct-1 Oct-20 20 Oct-1 Oct-31 31 Oct-1 Nov-10 41
Pirapora - - - Oct-1 Oct-31 31 Oct-1 Nov-10 41
Salinas - - - - - - Oct-1 Oct-31 31
Noroeste (northwest)
João Pinheiro Oct-11 Oct-20 10 Oct-1 Dec-31 92 Oct-1 Dec-31 92
Formoso Oct-1 Oct-20 20 Oct-1 Oct-31 31 Oct-1 Nov-20 51
Arinos Oct-1 Oct-20 20 Oct-1 Oct-31 31 Oct-1 Dec-20 81
Paracatu Oct-1 Nov-30 61 Oct-1 Dec-31 92 Oct-1 Dec-31 92
Unai Oct-1 Nov-10 41 Oct-1 Nov-30 61 Oct-1 Dec-10 71
Jequitinhonha
Carbonita Oct-1 Oct-20 20 Oct-1 Nov-10 41 Oct-1 Nov-20 51
Pedra Azul - - - Oct-1 Oct-20 20 Oct-1 Oct-31 31
Araçuai - - - Oct-1 Oct-20 20 Oct-1 Oct-31 31
Diamantina Oct-1 Oct-31 31 Oct-1 Nov-20 51 Oct-1 Nov-30 61
Itamarandiba Oct-1 Oct-20 20 Oct-1 Nov-10 41 Oct-1 Nov-20 51
Caratinga Oct-1 Oct-20 20 Oct-1 Nov-10 41 Oct-1 Nov-20 51
Aimorés - - - Oct-1 Oct-31 31 Oct-1 Oct-31 31

Revista Brasileira de Milho e Sorgo, v.13, n.3, p. 347-363, 2014 Versão impressa ISSN 1676-689X / Versão on line ISSN 1980-6477 - http://www.abms.org.br
An alternative approach to the actual brazilian maize... 361
Oeste (west)
Bambuí Oct-1 Nov-30 61 Oct-1 Dec-31 92 Oct-1 Dec-31 92
Oliveira Oct-1 Nov-30 61 Oct-1 Dec-31 92 Oct-1 Dec-31 92
Divinópolis Oct-1 Nov-10 41 Oct-1 Dec-31 92 Oct-1 Dec-31 92
Sul / Sudoeste
(south / sou-thwest)
Passa Quatro Oct-1 Dec-31 92 Oct-1 Dec-31 92 Oct-1 Dec-31 92
Maria da Fé Oct-1 Dec-31 92 Oct-1 Dec-31 92 Oct-1 Dec-31 92
Machado Oct-1 Dec-20 81 Oct-1 Dec-31 92 Oct-1 Dec-31 92
Lambari Oct-1 Dec-20 81 Oct-1 Dec-31 92 Oct-1 Dec-31 92
Caldas Oct-1 Dec-31 92 Oct-1 Dec-31 92 Oct-1 Dec-31 92
Lavras Oct-1 Dec-20 81 Oct-1 Dec-31 92 Oct-1 Dec-31 92
São Lourenço Oct-1 Dec-20 81 Oct-1 Dec-31 92 Oct-1 Dec-31 92
Zona da Mata
Caparao Oct-1 Oct-20 20 Oct-1 Nov-10 41 Oct-1 Nov-20 51
Juiz de Fora Oct-1 Nov-20 51 Oct-1 Nov-30 61 Oct-1 Dec-31 92
Viçosa Oct-1 Nov-10 41 Oct-1 Dec-31 92 Oct-1 Dec-31 92
Central
Bom Despacho Oct-1 Oct-31 31 Oct-1 Nov-20 51 Oct-1 Dec-31 92
Pompéu Oct-1 Oct-31 31 Oct-1 Nov-20 51 Oct-1 Dec-31 92
Curvelo Oct-1 Oct-20 20 Oct-1 Nov-10 41 Oct-1 Nov-30 61
Metropolitana de Belo
Horizonte
Florestal Oct-1 Nov-20 51 Oct-1 Dec-31 92 Oct-1 Dec-31 92
Belo Horizonte Oct-1 Nov-20 51 Oct-1 Dec-31 92 Oct-1 Dec-31 92
Conc. do Mato Dentro Oct-1 Nov-10 41 Oct-1 Nov-30 61 Oct-1 Dec-31 92
Sete Lagoas Oct-1 Oct-31 31 Oct-1 Nov-20 51 Oct-1 Nov-30 61
Ibirité Oct-1 Nov-20 51 Oct-1 Dec-31 92 Oct-1 Dec-31 92
João Monlevade Oct-1 Oct-31 31 Oct-1 Nov-20 51 Oct-1 Nov-30 61
Campos das Vertentes Barbacena Oct-1 Nov-20 51 Oct-1 Dec-31 92 Oct-1 Dec-31 92

Revista Brasileira de Milho e Sorgo, v.13, n.3, p. 347-363, 2014 Versão impressa ISSN 1676-689X / Versão on line ISSN 1980-6477 - http://www.abms.org.br
Paixão et al.362
de milho. Sete Lagoas: Brasil. Embrapa Milho e Sorgo. 13 p. 2009. (Embrapa Milho e Sorgo. Documentos 88).
BERGAMASCHI, H.; DALMAGO, G. A.; BERGONCI, J. I.; BIANCHI, C. A. M.; MÜLLER, A. G.; COMIRAN, F.; HECKLER, B. M. M. Distribuição hídrica no período crítico do milho e produção de grãos. Pesquisa Agropecuária Brasileira, Brasília, DF, v. 39, p. 831-839, 2004.
BRACHTVOGELL, E. L., PEREIRA, F. R. S.; CRUZ, S. C. S.; BICUDO, S. J. Densidades populacionais de milho em arranjos espaciais convencional e equidistante entre plantas. Ciência Rural, Santa Maria, v. 39, n. 8, p. 2334-2339, 2009.
BRASIL. Ministério da Agricultura, Pecuária e Abastecimentos. Zoneamento Agrícola de Risco Climático. Disponivel em:< http://www.agricultura.gov.br/politica-agricola/zoneamento-agricola > Acesso em: 21 mai. 2013.
CRUZ, J. C. (Ed.). Cultivo do milho. 5. ed. Sete Lagoas: Embrapa Milho e Sorgo, 2009. (Embrapa Milho e Sorgo. Sistemas de produção, 1).
CRUZ, J. C.; PEREIRA FILHO, I. A.; GARCIA, J. C.; GOMES, P. H. A.; FERNANDES, J. S. C; ALBERNAZ, W. M. Avaliação de sistemas de produção de milho na região de Sete Lagoas, MG. Sete Lagoas: Embrapa Milho e Sorgo, 2009. 6 p. (Embrapa Milho e Sorgo. Circular Técnica, 123).
DALLACORT, R.; FREITAS. P. S. L.; FARIA, R. T.; GONÇALVES, A. C. A.; RESENDE, R.; BERTONHA, A. Utilização do modelo Cropgro-soybean na determinação de melhores épocas
de semeadura da cultura da soja, na região de Palotina, Estado do Paraná. Acta Scientiarum, Maringá. V. 28, n. 4, p. 583-589.Maringá, v. 28, n. 4, p. 583-589, Out./Dez., 2006.
FORSTHOFER, E. L. Rendimento de grãos e desempenho econômico do milho em cinco níveis de manejo e três épocas de semeadura. 2004. 96 f. Dissertação (Mestrado em Fitotecnia) - Faculdade de Agronomia, Universidade Federal Rio Grande do Sul, Porto Alegre.
GUIMARÃES, D. P.; REIS, R. J. R.; LANDAU, E. C. Índices Pluviométricos em Minas Gerais. Sete Lagoas: Embrapa Milho e Sorgo, 2010. 88 p. (Embrapa Milho e Sorgo. Boletim de pesquisa e desenvolvimento, 30).
gvSIG 1.11. 2013. Available at: www.gvsig.org/web/. Acessed in: 7 june 2013.
HOOGENBOOM, G.; JONES, J. W.; WILKENS, P. W.; PORTE, C. H.; BOOTE, K. J.; HUNT, L. A.; SINGH, U.; LIZASO, J. L.; WHITE, J. W.; URYASEV, O.; ROYCE, F. S.; OGOSHI, R.; GIJSMAN, A. J.; TSUJI, G. Y. Decision Support System for Agrotechnology Transfer: version 4.5.1.013. Honolulu: University of Hawaii, 2013. 1 CD-ROM.
IBGE. Instituto Brasileiro de Geografia e Estatística. Levantamento sistemático da produção agrícola. 2010. Disponivel em: <http://www.ibge.gov.br>. Acesso em: 25 abr. 2013.
JONES, J. W.; HOOGENBOOM, G.; PORTER, C. H.; BOOTE, K. J.; BATCHELOR, W. D.; HUNT, L. A.; WILKENS, P. W.; SINGH, U.; GIJSMAN, A. J.; RITCHIE, J. T. DSSAT cropping system model. European Journal of Agronomy, Amsterdam, v. 18, p. 235-265, 2003.
JONES, J. W.; MAKOWSKI, D.; WALLACH, D. Introduction to section II. In: WALLACH, D.;

Revista Brasileira de Milho e Sorgo, v.13, n.3, p. 347-363, 2014 Versão impressa ISSN 1676-689X / Versão on line ISSN 1980-6477 - http://www.abms.org.br
An alternative approach to the actual brazilian maize... 363
MAKOWSKI, D.; JONES, J. W. Working with dynamic crop models: evaluation, analysis, parameterization and applications. Amsterdam: Elsevier, 2006. p. 251-256.
LANDAU, E. C.; GUIMARÃES, L. S.; PENNA, L. B. Variação da produção estadual de milho no Brasil entre 2000 e 2009. Sete Lagoas: Embrapa Milho e Sorgo, 2011. 42 p. Disponivel em: <http://www.infoteca.cnptia.embrapa.br/bitstream/doc/920747/1/bol39.pdf>. Acesso em: 24 set. 2013.
Quantum GIS. 2013. Disponível em: www.qgis.org/. Acesso em: 7 jun. 2013.
SANS, L. M. A.; ASSAD, E. D.; GUIMARÃES, D. P.; AVELLAR, G. Zoneamento de riscos climáticos para a cultura de milho na Região Centro-Oeste do Brasil e para o estado de Minas Gerais. Revista Brasileira de Agrometeorologia, Santa Maria, v. 9, n. 3, p. 1-10, 2001. Nº Especial: Zoneamento Agrícola.
SANS, L. M. A.; GUIMARÃES, D. P. Zoneamento Agrícola de Riscos Climáticos para a Cultura do Milho. Sete Lagoas: Embrapa Milho e Sorgo, 2006. 5 p (Embrapa Milho e Sorgo. Documentos, 82).
SANTANA, C. B.; ANDRADE, C. L. T.; AMARAL, T. A.; SILVA, D. F.; MOURA, B. F.; CASTRO, L. A. Parametrização do modelo Ceres-Maize para cultivares de milho. In: SEMINÁRIO DE INICIAÇÃO CIENTÍFICA PIBIC/BIC JÚNIOR, 1., 2010, Sete Lagoas. [Trabalhos apresentados]. Sete Lagoas: Embrapa Milho e Sorgo, 2010. 1 CD-ROM.
SANTANA, M. O. Análise espaço-temporal do
regime de chuvas e seus efeitos no rendimento agrícola no estado de Minas Gerais. 2004. 155 f. (Doutorado) - Universidade Federal de Viçosa, MG.
SANTOS, G. R.; PALES, R. C. Desenvolvimento regional e desigualdades sociais entre as macrorregiões de planejamento de Minas Gerais. In: ENCONTRO ANUAL DA ANPOCS, 36, 2012, Montes Claros. 2012. Disponivel em: <http://www.anpocs.org/portal/index.php?option=com_docman&task=doc_view&gid=7905&Itemid=76>. Acesso em: 21 jun. 2013.
SINGH, P.; SRINIVAS, K. Crop simulation models as decision-making tools for managing agricultural droughts. In: RAMAKRISHNA, Y. S.; RAO, G. G. S. N.; SASTRY, P. S. N.; RAO, V. U. M. (Ed.). Agricultural droughts: aspects of micrometeorology: a lecture notes of 4th SERC School. Hyderabad: CRIDA, 2007.
SOLER, C. M. T.; SENTELHAS, P. C.; HOOGENBOOM, G. Application of the CSM-CERES - Maize model for planting date evaluation and yield forecasting for maize grown off-season in a subtropical environment. European Journal of Agronomy, Amsterdam, v. 27, p. 165-177, 2007.
WAGNER, M. V.; SIDNEI O. JADOSKI, S. O.; MAGGI, M. F.; SAITO, L. R.; LIMA, A. S. Estimativa da produtividade do milho em função da disponibilidade hídrica em Guarapuava, PR, Brasil. Revista Brasileira de Engenharia Agrícola e Ambiental, Campina Grande, v. 17, n. 2, p. 170-179, 2013.


