Download - AN ABSTRACT OF THE CAPSTONE PROJECT OF
!!
AN ABSTRACT OF THE CAPSTONE PROJECT OF Anna Morgan-Hayes for the degree of Master of Natural Resources, presented on August 22, 2018 Title: Laws, regulations, and management plans to improve streamflow and stream temperature: A case study in the North Fork Burnt River Watershed Abstract Approved______________________________________________________________ Academic Advisor – Lynette de Silva
As the western United States faces warmer and increasingly varied climate conditions, as well as
predicted water insecurity, concerns over water quality and water availability are growing. While humans,
fish, and wildlife are dependent on clean water for survival in the present, management of water resources
needs to consider future generations as well. In order to protect water quality and streamflow, federal-
level laws and regulations provide an overarching framework for State and local governments to operate
under. Further, important public resources originate from National forests and other public lands
governed by federal agency land and resources management planning.
This capstone project explored the effectiveness of a management plan on improving streamflow and
stream temperature. Examining the case study of the North Fork Burnt River Watershed in northeastern
Oregon, will allow a better understanding of how plans improved stream temperature and streamflow,
answering the question to date, Have management plans effectivity been implemented as they were
intended to improve water quality and water resources in the case study area? A review of the Wallowa-
Whitman National Forest Land and Resources Management Plan (WWFMP) (1990), the guiding
document for managing watershed resources in the North Fork Burnt River Watershed (NFBR), as well as
federal and state-level laws and regulations, identified expectations and metrics of success for
improvements. Additionally, analysis of long-term stream temperature and streamflow data determined
whether expectations are being met for streams within the NFBR Watershed, or if there is a need for
additional restoration efforts and what restoration strategies might be most effective. Key findings of the
data analysis results and the desktop review indicate a lack of improvements for both streamflow and
stream temperatures for the case study area, and a need for additional restoration efforts. While some
improvements to stream temperature have been made in tributary streams, the recent temperature
decreases reflect localized environmental and land management changes and the monitoring data points to
potential strategies for restoration such as riparian enhancement, channel reconstruction, and the
supported establishment and expansion of beaver. Each restoration strategy serves to improve either
streamflow or stream temperature and have unique ecological benefits as well as challenges. Importantly,
sustainable management of watershed resources, and planning for future generations, must take into
account a variety of strategies and actions to address local concerns while promoting ecological,
economic, and social adaptability to climate change and natural disasters.

© Copyright by Anna Morgan-Hayes August 22, 2018
All Rights Reserved !
!
!
!
!
!
!
!
!
!
!
!
Laws, regulations, and management plans to improve streamflow and stream temperature: A case study in the North Fork Burnt River Watershed
by Anna Morgan-Hayes
A CAPSTONE
submitted to
Oregon State University
in partial fulfillment of the requirements for the degree of
Master of Natural Resources
Presented August 22, 2018 Commencement June 2018
Master of Natural Resources Capstone Defense of Anna Morgan-Hayes presented on Defense Date
APPROVED:
_____________________________________________________________________
Lynette de Silva, representing Master of Natural Resources
_____________________________________________________________________
Jeanine Creighton, Director of the Department of Natural Resources
_____________________________________________________________________
Dean of the Graduate School
I understand that my thesis will become part of the permanent collection of Oregon State University libraries. My signature below authorizes release of my thesis to any reader upon request.
_____________________________________________________________________
Anna Morgan-Hayes, Author
ACKNOWLEDGEMENTS
The following OSU instructors, affiliate faculty advisors have provided mentorship, patient guidance,
insight, and personal support throughout the completion of the Master of Natural Resources program and
this capstone project.
Lynette de Silva
Suzanne Fouty
Holly Campbell
This capstone project was made possible by the help and resources from the following individuals and
organizations. Their invaluable assistance throughout the past year has provided data, background
information, regional history, photographs, analysis, and personal support.
Christo Morris, Powder Basin Watershed Council
Forest Service, Wallowa-Whitman
John Dadoly, Oregon Department of Environmental Quality
Further, I would like to acknowledge my husband, Joseph Hayes, and three sons, Lucas, Levi, and Josey
and my family, who provided continued love, flexibility, and enthusiasm throughout my capstone project
and the completion of my Master of Natural Resources degree from Oregon State University.
TABLE OF CONTENTS Page 1. Introduction ................................................................................................................................... 1
1.1 Statement of the Problem ........................................................................................................ 1 1.2 Historical Context ................................................................................................................... 2 1.3 Regional Context .................................................................................................................... 2 1.4 Research Questions ................................................................................................................. 3 1.5 Purpose of this Study .............................................................................................................. 4
2. Methods and Materials .................................................................................................................. 5
2.1 Desktop Review ...................................................................................................................... 5 2.2 Data Analysis .......................................................................................................................... 5
2.2.1 Quality Assurance ....................................................................................................... 6
3. Desktop Review ............................................................................................................................ 8 3.1 Important Federal Legislation for Water Resources Management ......................................... 8 3.2. State Clean Water Act Authority ......................................................................................... 13 3.3 Wallowa-Whitman Land and Resource Management Plan, 1990 ........................................ 15
3.3.1 Forest Plan Resources Summary .............................................................................. 16 3.3.2 Measures of Success: Desired Future Conditions of the Forest for Riparian and Water Resources ................................................................................................................ 17
4. Case Study: North Fork Burnt River Watershed ........................................................................ 20 4.1 North Fork Burnt River Watershed Overview ...................................................................... 20
4.1.1 Geographical Location .............................................................................................. 20 4.1.2 Water Quality and Streamflow ................................................................................. 20 4.1.3 Climate and Hydrology ............................................................................................. 22 4.1.4 Soil ............................................................................................................................ 23 4.1.5 Vegetation ................................................................................................................. 24 4.1.6 Management Indicator Species & Threatened, Endangered and Sensitive Species . 25 4.1.7 Designated Beneficial Uses ...................................................................................... 26
4.2 Monitoring Locations ........................................................................................................... 27
5. Results ......................................................................................................................................... 30 5.1 Streamflow ............................................................................................................................ 30 5.2 Stream Temperature ............................................................................................................. 34
5.2.1 Site Specific Results ................................................................................................. 38 5.3 Summary of Conditions ........................................................................................................ 45 5.4 Data Limitations .................................................................................................................. 47
6. Hypotheses Findings ................................................................................................................... 49
7. Discussion ................................................................................................................................... 51
8. Restoration Strategies for Improving Streamflow and Stream Temperature ............................. 54 8.1 Sustainability in Resource Management ............................................................................... 54 8.2 Riparian Enhancement, Channel Reconstruction and Floodplain Connectivity ................... 55
8.2.1 Ecological Benefits ................................................................................................... 56 8.2.2 Challenges to Riparian Enhancement, Channel Reconstruction and Floodplain Connectivity ....................................................................................................................... 57
8.3 Supported Establishment of Beaver ...................................................................................... 57 8.3.1 Ecological Benefits ................................................................................................... 58 8.3.2 Challenges to Beaver Establishment ........................................................................ 61
9. Conclusion .................................................................................................................................. 64
Bibliography ................................................................................................................................... 66 Appendices ...................................................................................................................................... 72
LIST OF TABLES
Table Page
1. Oregon 2014 Nonpoint Source Pollution Plan Management Actions/Requirements for Public Lands 14
2. Wallowa-Whitman National Forest Management Goals 17
3. Annual Average Temperatures, Precipitation, Snow Depth, and Snow Fall for Austin, Oregon (#350356), 1912-2012 22
4. Drought Severity Designations for last day, March-August, provided by the U.S. Drought Monitor Map. 23
5. Annual Peak Daily Mean and July 31st Daily Mean Streamflow (cfs) measured at NFBR Stream Gage (OWRD, Station ID# 13269300), 1990-2017 31
6. Summer Daily Mean Streamflow (cfs) for June 1, June 15, July 1, July 31, and August 15 measured at North Fork Burnt River stream gage (#1326900), 1992-2017 33
7. The Highest 7-day moving average of the daily maximum stream temperatures (7-day MAX) for selected streams in the North Fork Burnt River Watershed, 1995-2017 34
8. The 7-day moving averages of the daily maximum stream temperatures for selected streams in the North Fork Burnt River Watershed on July 15, July 31, and August 15, 1995-2017 36
9. The highest 7-day moving averages of the daily maximum stream temperatures (7-day MAX) for Camp Creek and daily maximum stream temperatures on July 15, July 31, and August 15, 2014-2017
39
10. The highest 7-day moving averages of the daily maximum stream temperatures (7-day MAX) for Trout Creek and NFBR sites and daily maximum July 15th, July 31st, and August 15th, 1997 and 2017
43
11. Changes in stream temperature for comparison sites using the mean 7-day moving average of the daily maximum stream temperatures (7-day MAX) and mean daily maximum temperatures for July 15th, July 31st, and August 15th
47
12. Stakeholders Identified for future North Fork Burnt River restoration projects 63
LIST OF MAPS
Map
Page
1. North Fork Burnt River Watershed Vicinity Map 21
2. North Fork Burnt River Water Quality Case Study Area Subwatersheds and location of Water Temperature and Streamflow Gage Sites 29
LIST OF FIGURES
Figure
Page
1. Photo Point: NFBR 83A.1, in thalweg, looking upstream, June 2018 34
2. Photo Point: North of Antlers Guard Station, looking upstream of beaver dam, Fall 1992 60
3. Photo Point: Trout 83D.1 water temperature site, facing downstream, May 15, 2018 60
4. Bank incision on North Fork Burnt River, looking upstream, June 2018 61
LIST OF CHARTS
Chart
Page 1. North Fork Burnt River Stream Gage near Whitney Valley, Oregon for Hydrographs, 1992-2012 32
2. North Fork Burnt River Stream Gage near Whitney Valley, Oregon Hydrographs for 2007, 2011, and 2016 32
3. Comparison of the 7-day moving average of the daily maximum stream temperature (7-day MAX) for Camp 83F.1, 1995-2017 39
4. Comparison of the 7-day moving average of the daily maximum stream temperature (7-day MAX) for Camp 83F.2, 2014-2017 40
5. Comparison of the 7-day moving average of the daily maximum stream temperature (7-day MAX) for NFBR 83E.2, 1995-2017 41
6. Comparison of the 7-day moving average of the daily maximum stream temperature (7-day MAX) for Trout 83D.1, 1997-2017 42
7. Comparison of the 7-day moving average of the daily maximum stream temperature (7-day MAX) for Trout 83D.1, Trout 83D.3, and NFBR 83E.2, 1997 44
8. Comparison of the 7-day moving average of the daily maximum stream temperature (7-day MAX) for Trout 83D.1, Trout 83D.3, and NRBR 83E.2, 2017 44
9. Comparison of the 7-day moving average of the daily maximum stream temperature (7-day MAX) for Trout 83D.1, Trout 83D.3, and Trout 83D.5, 2017 45
LIST OF APPENDICES
Appendix
A. Resources identified by the Wallowa-Whitman Land and Resources Management Plan (WWFMP 1990)
B. ODEQ Assessment Categories for 303(d) Listing
C. Drought Severity Criteria and Assessment Indicators
D. Methodology for analyzing and quality control checking of stream temperature data
E. Monitoring Sites Photos
F. Stream Temperature Comparison Statistics
F1. Comparison of the 7-day moving average of the daily maximum stream temperature (7-day MAX) for different monitoring sites to assess the changes in relationships over time
F2. July 15: Comparison of the daily maximum stream temperature for different monitoring sites to assess changes in their relationships over time
F3. July 31: Comparison of the daily maximum stream temperature for different monitoring sites to assess changes in their relationships over time
F4. August 15: Comparison of the daily maximum stream temperature for different monitoring sites to assess changes in their relationships over time
F5. Changes in magnitude of temperature exceedances for the 7-day moving average of the daily maximum stream temperatures in degrees (°F) from the State standard (68°F) over time
LIST OF ACRONYMS
AUM Animal Unit Month AMP Allotment Management Plan BAT Best Available Technology BMP Best Management Practices BPCT Best Practicable Control Technology CWA Clean Water Act DOI Department of the Interior EIS Environmental Impact Statement EPA Environmental Protection Agency ESA Endangered Species Act MOU Memoranda of Understanding MUSYA Multiple-use Sustained Yield Act NEPA National Environmental Protection Act NFBR North Fork Burnt River NFMA National Forest Management Act NPS Nonpoint Source Pollution OAR Oregon Administrative Rule ODEQ Oregon Department of Environmental Quality ODFW Oregon Department of Fish and Wildlife QAPP Quality Assurance Project Plan OWRD Oregon Water Resources Department PBWC Powder Basin Watershed Council RHCA Riparian Habitat Conservation Area RPA Forest and Rangeland Renewable Resources Planning Act ROD Record of Decision TESS Threatened & Endangered Sensitive Species TMDL Total Maximum Daily Load USDA United States Department of Agriculture USGS United States Geological Survey WWFMP Wallowa-Whitman Land and Resource Management Plan WWNF Wallowa-Whitman National Forest
1
1.! Introduction
1.1.! Statement of the problem Water is essential for supporting fish and wildlife, and the ecological, sociocultural, and economic way of
life for human beings. Due to the necessity of water resources, water quality and water availability are
crucial issues of national and regional scale. Streamflow, an often-crucial source of continuous year-
round supply of water for communities, can be extremely sensitive to varying snowpack, changing
climate conditions, and increased frequency of drought conditions all of which are forecast to increase
over coming decades (Dalton et al. 2017). Streamflow is a critical determinant of water quality because
flow volumes strongly influence stream temperatures, dissolved oxygen levels, and toxin concentrations
in water bodies. Streamflow is dynamic and primarily influenced by precipitation (rainfall and snowmelt)
but can be affected by other natural or human-induced mechanisms, such as soil-water storage, seeps and
springs, reservoirs, beaver activity, groundwater and surface water withdrawal. Maintaining continuous,
fresh water through river systems is necessary to prevent stagnation and harmful side effects to humans,
domestic animals, wildlife, and fish.
Unfortunately, western North America is facing serious water quality problems such as oxygen depletion,
elevated stream temperatures, eutrophication, and poor ecological health (Moore 2009, 53-55). In some
instances, stream temperatures are documented well above recommended standards. High stream
temperatures affect the biology and life history cycles of aquatic species, increase toxicity and
concentrations of contaminants already present in water bodies, and can change the chemical composition
of water bodies resulting in dangerous effects on human health. Stream temperature standards protect
Oregon’s native aquatic species, such as salmon, trout, and amphibians, and vary by species. It is
important for stream water to remain at or below the state standards to protect the multiple uses, including
fish. Temperature of surface water can be affected by latitude, elevation, flow rate, water depth, season,
time of day, circulation, and environmental surroundings like the amount and type of streamside shade
provided by various vegetation types and land use.
To protect water resources and address important social and environmental values, citizens look to the
many federal-level laws and regulations. In addition to setting legal standards, federal laws set forth the
objectives, responsibilities, goals and national institutional values which have evolved over the decades as
they apply to public lands and preserving common resources for future generations. Even with
2
compliance with federal laws however, many Oregon waters are sensitive to increases in water
temperature and changes in streamflow due to changing climate conditions and land management factors.
1.2.! Historical Context States and federal governments establish the regulatory framework for watershed management decision-
making administered at local levels. Further, federal laws are the foundation for National Forest
management plans, which aim to manage both land and resources for the common good. Some forms of
management plans, such as National Forest Plans, address resource uses on public lands. Others, like
State Nonpoint Source Pollution Plans, manage pollutants and levels of contaminants on a state-wide
basis. Together, these plans accomplish many goals, including: informing management of public water
resources, establishing what activities and resources take precedence, and serving as guiding documents
that can be in place for decades. Embedded in both federal and state laws, and management plans, are
methods for sustainably managing resources. Sustainable management, as defined in the Brundtland
Report, is the practice of pursuing the goal of meeting the needs of the present without compromising
future generation’s ability to meet their own needs (WCED 1987). In this paper, the success of these laws
and management plans in improving aspects of water resources: stream temperature, a parameter of water
quality, and water availability, is measured through the analysis of long-term stream temperature and
streamflow data. Monitoring data provide communities with the information they need to determine
whether they are meeting water quality goals over time. Furthermore, communities can use this
information to determine if management of the current condition of water resources, and expected future
condition, is in the most appropriate long-term interest of the community.
1.3.! Regional Context
The North Fork Burnt River Watershed (HUC 10#1705020201) is located in Northeastern Oregon
primarily in the Wallowa-Whitman National Forest of the Blue Mountain Ecoregion and is the case study
area. The watershed is comprised of eight subwatersheds, however, for the purposes of the case study,
data from monitoring sites existing in the five northern-most subwatersheds (HUC 12# 1705020201-08)
are evaluated. These five subwatersheds are made up of approximately ninety-one percent public lands
and the remaining are privately owned land. The case study will highlight conditions in the NFBR
Watershed with respect to streamflow and the water quality parameter, stream temperature, in order to
assess the effectiveness to date of the management plans in place for this watershed. The public lands
3
within the NFBR watershed falls under the administration of the Wallowa-Whitman National Forest Land
and Resources Management Plan (1990) as well as Oregon State water quality standards.
1.4.! Research Questions 11
The following research questions were evaluated to better assess the effectiveness of laws, regulations,
and management plans in managing water resources in the North Fork Burnt River Watershed. The
primary research question is: have management plans effectively been implemented as they were intended
to improve water quality and water resources in the case study area?
Other research questions include:
1.! What management plans, laws, and regulations are in place to protect water resources in the
North Fork Burnt River Watershed?
2.! Do stream temperature and streamflow in the case study area meet the expectations outlined in
the management plans?
3.! Is there a need for additional restoration efforts for improving streamflow and stream temperature
in the North Fork Burnt River Watershed?
4.! Based on the streamflow and stream temperature data in the North Fork Burnt River Watershed,
what strategies should be considered to further enhance these parameters?
Three hypotheses were developed for examination, they include:
H1. Implementation of the Wallowa-Whitman Land and Resources Management Plan (WWFMP)
(1990) improved streamflow in the North Fork Burnt River Watershed.
H2. Implementation of the Wallowa-Whitman Land and Resources Management Plan (WWFMP)
(1990) improved or maintained stream temperature, as reflected in the 7-day moving averages of
the daily maximum stream temperatures, in the North Fork Burnt River Watershed.
4
H3. Additional restoration efforts are not needed for the North Fork Burnt River Watershed, the
current efforts suffice.!
1.5.! Purpose of this Study With this framework in mind, this paper will do the following:
1)! Present a desktop review of literature. This review will:
a)! Identify key federal laws that pertain to the use and protection of water resources and explore the
evolving national values as they apply to water.
b)! Examine the Wallowa-Whitman National Forest Land and Resource Management Plan
(WWFMP) (1990) and the State of Oregon’s water quality standards to identify the protection of
water resources on the public lands within their jurisdiction.
2)! Complete a data analysis. This analysis will:
a)! Examine existing data in the NFBR watershed for changes in streamflow and stream
temperatures.
b)! Evaluate the effectiveness of the two management plans on improving stream temperatures and
streamflow, two indicators of watershed conditions, in this case study watershed.
3)! Explore additional management strategies for improving conditions in the North Fork Burnt River
Watershed.
5
2.! Methods and Materials The methods for this capstone project includes both a desktop review and data analysis section which is
followed by an emphasis on quality assurance.
2.1.! Desktop Review The desktop review provides key information regarding three of the secondary research questions
(Section 1.3) in the following manner:
Secondary research question 1: What management plans, laws, and regulations are in place to protect
watershed resources in the North Fork Burnt River Watershed?
Evaluation of the federal laws and regulations, Oregon’s NPS Plan (2014) and the WWFMP (1990) will
highlight important components that are included to protect resources in the North Fork Burnt River
Watershed.
Secondary research question 2: Does the outcome of the data for stream temperature and streamflow in
the case study area meet the expectations outlined in the management plans?
Assessing expectations outlined in the WWFMP (1990) will identify the metric of success for evaluating
data.
Secondary research questions 3 and 4: Is there a need for additional restoration efforts for improving
streamflow and stream temperature in the North Fork Burnt River Watershed? Based on the North Fork
Burnt River Watershed streamflow and stream temperature data, what strategies should be considered to
enhance these parameters?
Utilizing information from the management plan and data, restoration strategies for enhancing parameters
are selected specific to the North Fork Burnt River Watershed.
2.2.! Data Analysis Data analysis is crucial in determining secondary research questions 2 through 4. Specifically, analysis of
data will identify whether the expectations for stream temperature and streamflow were being met,
whether additional restoration efforts are needed, and which strategies may be conducive to improving
stream temperature and streamflow conditions in the NFBR Watershed. The precipitation data and
drought severity data were also reviewed for more information about broad-scale climate patterns.
The following data are used in this paper:
6
1-! Streamflow data from North Fork Burnt River near Whitney stream gage, OWRD##13269300
(1992-2017)
2-! Stream temperature data from WWNF and the Powder Basin Watershed Council (PBWC) (1995-
2017)
Surface Flow data
Flow data were compiled from the Oregon Water Resources Department (OWRD stream gage
#13269300). Mean daily cubic feet per second (cfs) were graphed for the stream gage station from 1990
to 2017 to highlight seasonal peak flows, timing and duration compared to the low flow season. Baseflow
conditions were assessed by selecting specific dates through the summer months (June 1st, June 15th, July
1st, July 15th, July 31st, August 15th) and daily mean values for these dates were plotted to identify change
over time. Timing in peak streamflow events to baseflow conditions was assessed for each year to
determine if the rate of the reduction in flow slowed over time.
Stream Temperature data
Stream temperature data was collected by the WWNF and PWBC from 1995-2017 with intermittent gaps
in years monitored. The 7-day moving average of the daily maximum stream temperature (7-day MAX)
were graphed for all temperature sites for each year of sampling to determine outliers and long-term
trends. Temperatures from adjacent stream monitoring were compared for similarities in patterns.
Monitoring data from an expanded monitoring group of sites were compared to long-term monitoring
sites to assess whether changes observed at the long-term monitoring sites were indicative of a change in
stream temperature throughout a given stream, or if broad climate conditions were impacting streams.
The 7-day MAX temperatures were compared to the state standard 68°F to determine whether they met or
exceeded standards. Last, daily maximums for July 15th and 31st, and August 15th were listed to assess
relationships at individual sites and between monitoring sites within the watershed. Evaluating
relationships between sites allows for the identification of land management and environmental changes
that may be occurring in the watershed versus climate changes.
2.2.1.! Quality Assurance Streamflow data was collected, analyzed and reported by the Oregon Water Resources Department. Data
is not made available to the public until passing through internal quality control methods which can be
found at the OWRD website
(https://www.oregon.gov/owrd/pages/sw/about_data.aspx#Final_or_Published_Data_). Stream
7
temperature data collection and entry were completed by both the PBWC and WWNF staff and is not
readily available to the public. As such, there is more detailed discussion of quality assurance and
methods in this paper.
Methodology for analyzing stream temperature data followed the Draft Methodology for Oregon’s 2018
Water Quality Report and Limited Waters (ODEQ 2018) as well as the Aqs Water Temperature Surveys
Guide (USDA 2016). All PBWC temperature data followed protocols set forth in the Volunteer Water
Quality Monitoring Quality Assurance Project Plan (QAPP) as well as the EPA National Functional
Guidelines for Data Review and is sufficient quality to share with partners. The 7-day moving average of
the daily maximum stream temperature (7-day MAX), the minimum and maximum temperatures, and the
change in temperatures for the 7-day period were calculated using continuous temperature data and a
spreadsheet designed by ODEQ (7_day_MACRO_Bloom_v2.xls). Further methodology for analyzing
stream temperature included plotting maximum and minimum daily temperatures to find discrepancies in
patterns caused by possible logger exposure. The WWNF followed parallel procedures for quality
assurance which meets ODEQ standards for continuous temperature data collection. Indicators that were
considered to ensure the proper methods for quality assurance were taken, include: precision,
accuracy/bias, sensitivity, representativeness, comparability, and completeness.
Onset HOBO temperature data logger calibration was verified using ODEQ protocols to ensure that they
read within a specified criterion. Field audits for the temperature loggers were completed using NIST
certified field thermometers at deployment and retrieval. After the sampling season, post calibration
verification tests were performed for all the temperature loggers retrieved.
Continuous temperature data were downloaded from the loggers and entered into the ODEQ data quality
spreadsheet, Audit_Master.xls, provided on the ODEQ website
(http://www.deq.state.or.us/lab/wqm/volmonresources.htm). The spreadsheet, along with the Aqs Water
Temperature Surveys Guide, enabled the ranking of data quality. Data for all sites were graphed and
further compared for anomalies. After data quality analysis had been performed, data that failed to meet
quality control limits were eliminated from further analysis. For example, if temperature data showed
abnormal peaks that could not be confirmed by further analysis or historical patterns, it was not included
in the analysis for this study. Additional internal audits were performed at both the PBWC and WWNF to
ensure correctness of continuous temperature data (Appendix D).
8
3.! Desktop Review Numerous laws, regulations and planning documents are relevant to management of the watersheds on
public lands. These laws, regulations and plans set forth the underlying objectives, responsibilities, goals,
and institutional values that land managers, the public, and other stakeholders must follow if we are to
preserve public lands and our common resources for future generations. The following provides a
chronological, historical context of relevant legislation and key features of that legislation as they apply to
water resources management.
3.1.! Important Federal Legislation for Water Resources Management The Organic Administration Act of 1897 A century after the adoption of the US Constitution, America’s leaders sought to address governance of
American lands. Abundant forests across the continent provided plentiful resources and security to the
new generations of settlers. In true American ingenuity, Congress established the first act which federally
recognized reserved public spaces. These areas were designated as Forest Reserves by the Forest Reserve
Act of 1891 [16 U.S.C. §471 et seq.] and are referred to as such in the Organic Act of 1897 [16 U.S.C.
§473 et seq.]. The Organic Act establishes management of these reserves under the Department of the
Interior (DOI) becoming National Forest, while others later became National Parks. At this time, this
policy also enabled the DOI to oversee the authority of rule-making of regulations for reserves.
Today, the 1897 Organic Act remains one of the most important laws concerning public lands
management primarily because of its clearly written intent: “Public forest reservations are established to
protect and improve the forests for the purpose of securing a permanent supply of timber for the people
and insuring conditions favorable to continuous water flow” (§2). The early recognition of the importance
of maintaining both forest health and streamflow, now and into the future, became a key component of
future legislation. This language may have been the first formal attempt at instituting concepts of
sustainability planning for public natural resources. Still, at the time of the Act’s creation, the nation was
relatively young and the complexities of technology, pollution, resource exploitation and scarcity,
especially concerning water, had yet been fully understood.
Multiple-Use Sustained-Yield Act of 1960 (MUSYA) Following the Organic Act of 1897, the nation’s population grew, filling in new territories and creating
new and efficient ways to use resources. Post WWII economic conditions resulted in a population boom
requiring an abundance of timber and forest resources. This resulted in the nation’s watersheds showing
9
signs of stress and pollution, causing many citizens to take a keener look at environmental issues.
Arguments over prioritization of resources and land management began to take shape, and Congress
sought to furnish a solution with the Multiple-Use Sustainable-Yield Act of 1960 (MUSYA) [16 U.S.C.
§§ 528-531]. MUSYA established that National Forests “shall be administered for outdoor recreation,
range, timber, watershed, and wildlife and fish purposes” [16 U.S.C. §528].
MUSYA effectively reinforced earlier notions of forests as working components of America’s landscape,
but also delineated specific uses of public forests which would become very important in later legislation.
According to Section 4(a) of the Act, “multiple use” is clearly outlined as [16 U.S.C. §531]:
the management of all the various renewable surface resources of the national forests, so that they
are utilized in combination that will best meet the needs of the American people; making the most
judicious use of the land for some or all of these resources or related service over areas large
enough to provide specific latitude for periodic adjustments in use to conform to the changing
needs and conditions; that some land will be used for less than all of the resources; and
harmonious and coordinated management of the various resources, each with the other, without
impairment of the productivity of the land, with consideration being given to the relative values
of the various resources, and not necessarily the combination of uses that will give the greatest
dollar return or the greatest unit of output.
The section above highlights the value placed on national resources, as well as an increased interest in
preserving the sustained productivity of forest land regardless of short-term financial return. Additionally,
with the passage of this act, authority over forest reserves was transferred from the DOI to the Secretary
of Agriculture.
National Environmental Protection Act 1970 (NEPA) The National Environmental Policy Act of 1970 (NEPA) requires the federal government to complete
step-by-step assessments of proposed actions and consider their potential environmental effects prior to
making decisions [42 U.S.C. §§ 4321 et seq.]. The step-by-step assessments act as procedural guidance
for management planning and implementation, is intended to ensure adequate protection of resources and
prevent environmental harm by decisions made at the federal level.
10
The Clean Water Act 1972 (CWA) In 1969, an important event occurred which spurred an interest in creating broad legislation to protect
National waters: the Cuyahoga River caught fire. In fact, the Cuyahoga River had caught fire numerous
times, beginning in 1948, killing and injuring many over the years and causing an estimated one million
dollars in damage due to contamination caused by debris, oils, sludge, industrial wastes and sewage. Prior
to this event, surface water pollution was widely seen as a local issue and regulation was limited to
interstate waters (Copeland 2016, 2). However, the inflammatory cocktail of pollutants contaminating
America’s rivers became difficult to ignore as the public put increasing pressure on the federal
government to create solutions. Congress responded with what is undoubtedly, one of the most ambitious
environmental laws, the Clean Water Act of 1972 [33 U.S.C. §1251-1387] (CWA). As a two-pronged
approach, the law authorizes financial assistance for municipal sewage plant construction and establishes
regulation of pollution discharges into surface waters by industry and municipalities (Copeland 2016, 2).
Shortly after enactment of CWA, dramatic decreases in point-source pollution were documented.
Among the many significant provisions of the act, several remain important to the discussion of National
Forests. First, the CWA provides pollution abatement procedures, including the requirement for industry
to utilize “best practicable control technology” (BPCT) as well as “best available technology” (BAT) for
pollution cleanup and prevention. Second, the CWA determined that activities which proposed dredging
or filling material (under the 1977 CWA amendment §404) into surface waters and wetlands would
require a permit. The requirements worked well for point source pollution but it did not apply to nonpoint
source polluters because pollution from most farming, ranching, and silvicultural activities are exempt
from the Section 404 permitting under the CWA. This exemption explains why there is a great deal of
nonpoint source pollution in the form of runoff from these industry activities. However, nonpoint source
pollution (NPS), such as runoff from farm lands, forests, construction sites, and urban areas, was not
addressed until 1987.
In 1987, the federal CWA underwent amendments to include Section 319. This section requires states to
develop plans for controlling NPS pollution. Oregon had already begun to address NPS pollution through
its NPS Control Program, established in 1978. The current Oregon NPS Plan, now tied to the CWA, is a
guiding document as of 2014 for regulation of Oregon’s waters. Regulation of NPS pollution remains a
complicated issue today, with an estimate of more than fifty percent of the water pollution problems being
created by NPS pollution (Copeland 2016, 3).
11
Another important feature of the CWA is that it delegated regulatory responsibilities to the states while
the EPA maintained back-stop authority. In Oregon, the Oregon Department of Environmental Quality
(ODEQ) has regulatory responsibilities for all surface waters in the State, including the case study area.
ODEQ sets limits on pollutants based on biological and ecological criteria. These limits reflect a
maximum amount of a pollutant allowance present without impairment to the uses designated for the
water body. Uses of a water body may include: fish and aquatic life, drinking water, industry, and
agricultural. With rare exceptions, under the CWA, all U.S. waters must meet the basic quality for
“fishable and swimmable” (§ 101(a)(2)).
Forest and Rangeland Renewable Resources Planning Act of 1974 (RPA) Two years after adopting America’s most aggressive water pollution law, Congress passed the Forest and
Rangeland Renewable Resources Planning Act of 1974 (RPA) [16 U.S.C. §106-580]. RPA requires a
decadal Assessment of Renewable Resources by the Secretary of Agriculture. Amended in 2000, the Act
included objectives which sought to determine and analyze the availability, demand, supply, present, and
potential of the nation’s renewable resources. Later objectives included the analysis of global climate
changes on forest, range, and other associated lands, as well as mitigation of atmospheric carbon dioxide.
Important language emerged from RPA with respect to the required Assessments of Renewable
Resources, which are formally referred to as the Renewable Resource Program in the Act. The language
in Section 4(C) [16 U.S.C 1602] highlights the requirements of the Renewable Resource Program
specifically stating that the Program must “recognize the fundamental need to protect and where
appropriate, improve the quality of soil, water, and air resources.”
Further in RPA, the Act discusses National Forest Resource Planning, outlining requirements of resource
management planning. Section 6 [16 U.S.C 1602] directly pertains to resource and forest management
plans that encompass the case study area in the Wallowa-Whitman National Forest. Of the requirements,
the most relevant to surface water resources include:
Sec 6 (e) In developing, maintaining, and revising plans for units of the National Forest System pursuant
to this section, the Secretary [of Agriculture] shall assure that such plans-
6e (1) Provide for multiple use and sustained yield of the products and services obtained
therefrom in accordance with the Multiple-Use Sustained Yield Act of 1960, and, in particular
12
include coordination of outdoor recreation, range, timber, watershed, wildlife and fish, and
wilderness
Sec 6(g) The regulations shall include, but not be limited to-
(2) Specifying guidelines for land management plans developed to achieve the goals of the
Program which-
6g(3)(E) insure that timber will be harvested from National Forest System lands only where- (i) soil, slope, or other watershed conditions will not be irreversibly damaged;
(iii) protection is provided for streams, streambanks, shorelines, lakes, wetlands, and other bodies
of water from detrimental changes in water temperatures, blockages of water courses, and
deposits of sediment, where harvests are likely to seriously and adversely affect water conditions
or fish habitat.
The RPA created a framework for resource planning that recognized the need to protect the nation’s rivers
and waterways, as well as to protect resources for future generations.
National Forest Management Act of 1976 (NFMA) The RPA shaped the management and planning of the National Forest system, but the act was clearly
lacking specifics, particularly in the regulation of clear cutting on forest lands. The continuing
controversy over deforestation and environmental degradation stayed at the forefront of American minds,
leading to the passage of the “Planning Act” or National Forest Management Act of 1976 (NFMA) [16
U.S.C. §§ 1600-1614]. This Act currently remains the primary statute governing administration of
National Forests. The 1976 NFMA expanded and redefined the Renewable Resource Program initially
established in the 1974 RPA. The 1976 NFMA still requires a decadal assessment of natural resources,
but the language relative to natural resources and logging is more clearly defined. The 1976 NFMA
retained the core elements of the 1974 RPA, that forests need be managed according to MUSYA, but also
added that management plans must closely adhere to requirements set forth in the NEPA (1969) which
required that all branches of government consider the environment prior to participating in major federal
action that significantly impacts the environment.
13
Regarding the case study area and National Forest planning documents, such as the Wallowa Whitman
Forest Management Plan (1990), the NFMA reiterates strong priorities for natural resource planning.
Section 5 amends the RPA (1974) to include the language that planning must “recognize a fundamental
need to protect and where appropriate, improve the quality of soil, water, and air resources” [16 U.S.C.
§1602]. This continuation and refinement of previous language found in earlier environmental laws
(RPA, CWA, MUSYA and the Organic Act) make Congressional priorities inarguable: soil, water, and
air resources are of primary importance in public land management, need be protected, and where
appropriate improved. In addition, resource planning should not only be within guidelines set out in
MUSYA and the RPA, but also, “include coordination of outdoor recreation, range, timber, watershed,
wildlife and fish, and wilderness” [16 U.S.C. §1604].
The environmental laws examined above help provide a background for understanding the larger social,
cultural, economic, and environmental values embedded in local management decisions. Further decisions
by federal laws and regulations, guided by an overarching premise of protecting water quality and
conditions favorable to water flow, are important to maintaining sustainability of water resources. A
thread of similarity central to natural resource planning, and water resources planning in particular, is that
management and regulations need be done with long-term sustainable objectives in mind. In order to
achieve these long-term objectives, inclusion, transparency, and accountability are keystone. These
tenants of sustainability incorporate both access to decision-making by federal agencies and monitoring of
public lands resources as important components of State and National Forest level planning.
3.2.! State Clean Water Act Authority
The Oregon Department of Environmental Quality (ODEQ) has been given the broad authority under the
CWA to implement water quality standards and regulations for the State, including both public and
private land. Provisions of the CWA (§319) gives authority to the ODEQ to identify, implement, and
evaluate measures designed to prevent and eliminate water pollution from NPS’s in all waterbodies in the
State of Oregon. ODEQ’s recent 2014 Nonpoint Source Management Plan sets objectives, goals,
priorities and strategies for meeting water pollution goals. Additionally, the 2014 plan now creates an
approach for identifying water quality issues, implementing plans, and prioritizing actions within a five-
year reoccurring timeframe. This is important for the future because NPS pollution currently poses a
greater risk to water quality than point source pollution because point source pollution is regulated.
14
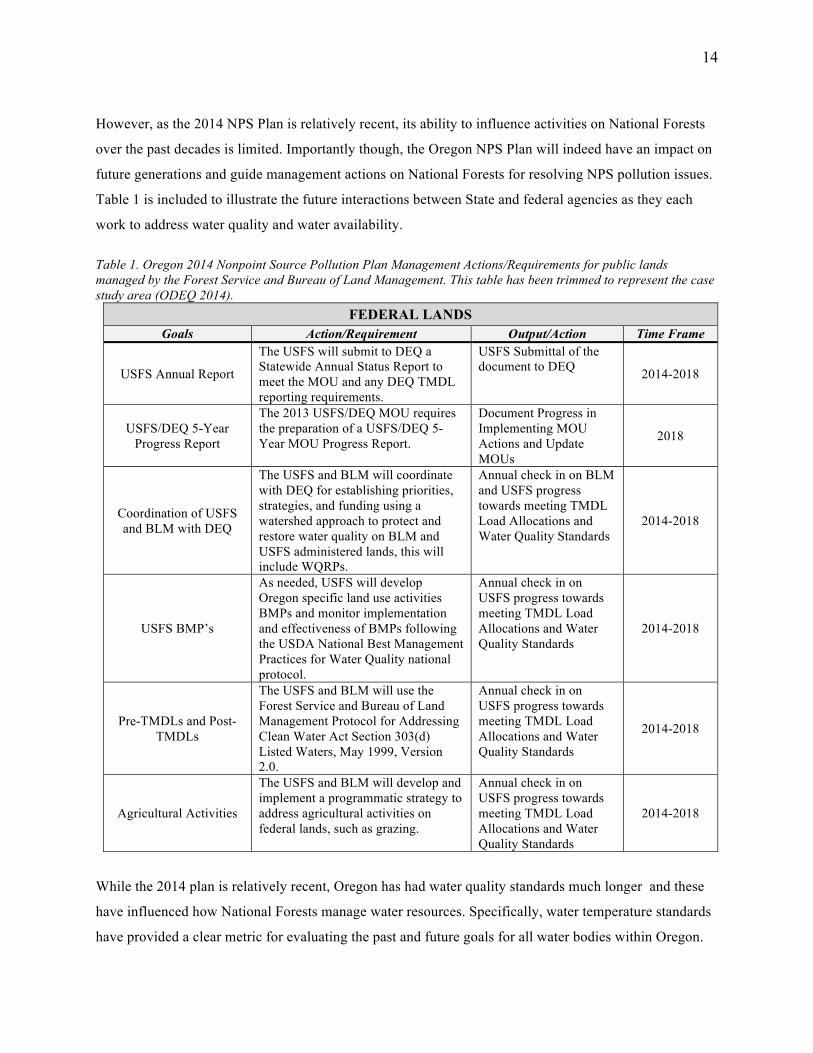
However, as the 2014 NPS Plan is relatively recent, its ability to influence activities on National Forests
over the past decades is limited. Importantly though, the Oregon NPS Plan will indeed have an impact on
future generations and guide management actions on National Forests for resolving NPS pollution issues.
Table 1 is included to illustrate the future interactions between State and federal agencies as they each
work to address water quality and water availability.
Table 1. Oregon 2014 Nonpoint Source Pollution Plan Management Actions/Requirements for public lands managed by the Forest Service and Bureau of Land Management. This table has been trimmed to represent the case study area (ODEQ 2014).
FEDERAL LANDS Goals Action/Requirement Output/Action Time Frame
USFS Annual Report
The USFS will submit to DEQ a Statewide Annual Status Report to meet the MOU and any DEQ TMDL reporting requirements.
USFS Submittal of the document to DEQ 2014-2018
USFS/DEQ 5-Year Progress Report
The 2013 USFS/DEQ MOU requires the preparation of a USFS/DEQ 5-Year MOU Progress Report.
Document Progress in Implementing MOU Actions and Update MOUs
2018
Coordination of USFS and BLM with DEQ
The USFS and BLM will coordinate with DEQ for establishing priorities, strategies, and funding using a watershed approach to protect and restore water quality on BLM and USFS administered lands, this will include WQRPs.
Annual check in on BLM and USFS progress towards meeting TMDL Load Allocations and Water Quality Standards
2014-2018
USFS BMP’s
As needed, USFS will develop Oregon specific land use activities BMPs and monitor implementation and effectiveness of BMPs following the USDA National Best Management Practices for Water Quality national protocol.
Annual check in on USFS progress towards meeting TMDL Load Allocations and Water Quality Standards
2014-2018
Pre-TMDLs and Post-TMDLs
The USFS and BLM will use the Forest Service and Bureau of Land Management Protocol for Addressing Clean Water Act Section 303(d) Listed Waters, May 1999, Version 2.0.
Annual check in on USFS progress towards meeting TMDL Load Allocations and Water Quality Standards
2014-2018
Agricultural Activities
The USFS and BLM will develop and implement a programmatic strategy to address agricultural activities on federal lands, such as grazing.
Annual check in on USFS progress towards meeting TMDL Load Allocations and Water Quality Standards
2014-2018
While the 2014 plan is relatively recent, Oregon has had water quality standards much longer and these
have influenced how National Forests manage water resources. Specifically, water temperature standards
have provided a clear metric for evaluating the past and future goals for all water bodies within Oregon.
15
The ODEQ’s NPS Plan provides activities and associated timelines for federal lands agencies. For public
lands agencies, the applicable decision activities required by the NPS plan include continuous monitoring
and reporting requirements. Additionally, the NPS Plan requires the development of specific land use
activities Best Management Practices (BMPs) in accordance with the USDA National Best Management
Practices for Water Quality national protocols (USDA 2012). Federal and state agency collaboration is
one of the key strategies provided by the NPS plan to implement successful water quality programs and is
highlighted in a Memorandum of Understanding (MOU) with the Forest Service (USDA 2013).
Additional language in the MOU, requires the Forest Service to implement programs and regulations
which must take “all feasible steps toward achieving the highest quality attainable” with regard to water
resources (USDA 2013). However, the impact of the Oregon NPS Plan will be seen in the future.
3.3.! Wallowa-Whitman Land and Resources Management Plan (1990) In addition to the State standards for stream temperature, National Forest Management Plans also set
goals and strategies for protecting water resources. The Wallowa-Whitman Land and Resource
Management Plan (1990) (WWFMP) was the guiding document as of 2017 for managing all Wallowa-
Whitman National Forest resources and activities, including surface water. The release of an updated
Land and Resources Management Plan for the WWNF occurred in July 2018 and will guide management
actions for the next decade or more. The 2018 Forest Management Plan will undoubtedly have an impact
on future generations. For the purposes of evaluating the effectiveness of National Forest management
plans on improving past streamflow and stream temperature, the WWFMP (1990) is the most relevant
management plan.
The 1990 WWFMP’s plan purpose was to “provide direction for multiple use management and sustained
yield of goods and services from the Forest in an environmentally sound manner”1 in accordance with the
NFMA (1976). The plan established five broad purposes for the over 2.3 million acres of federally
managed public land. They include: 1-! Established Forest-wide multiple use goals and objectives;
2-! Established Forest-wide standards and guidelines applying to future activities;
3-! Established management area direction including management area prescriptions and standards
and guidelines applying to future management activities in management areas;
4-! Established the allowable sale quantity of timber and identifies land suitable for timber
1 R.M. Richmond, Wallowa-Whitman National Forest Supervisor, Letter to Reviewer, April 1990.
16
management, also sets timber sale program quantity;
5-! Established monitoring and evaluation requirements.
Although the plan objectives have been in place for twenty-seven years, the original intent was to guide
management agencies through a ten-year cycle, “or at least every fifteen years” between revisions
(WWNF 1990, 1.1). While the plan encompasses numerous resources (Appendix A), this study focuses
on the effectiveness of the plan on its ability to protect and improve water resources in the case study area
in relation to applicable federal and state-level legislation.
The WWFMP, accompanied by an Environmental Impact Statement (EIS) and Record of Decision
(ROD), also included management alternatives. These alternatives included other options for planning as
well as substantial public input. Gathering public input in the planning process ensures attention is given
to public concerns regarding management decisions. Regarding water resources, public comment revealed
concerns about: erosion control, water storage, and the effects of recreational use and livestock use on
domestic water quality (WWNF 1990, 2.14).
3.3.1.!Forest Plan Resources Summary A summary analysis of forest conditions before the implementation of the WWFMP in 1990 revealed that
past management activities such as clear-cutting, land modification for logging roads, creation of utility
corridors, mining, rock quarries, livestock grazing and water impoundments which were all expected to
increase or stabilize (WWNF 1990, 2.10-19). As a result, for each natural resource listed, the WWFMP
set forth objectives, standards, guidelines, and goals to strive toward over the following decades. The
following summary of the WWFMP as it pertains to water resources provides a context for conditions in
the case study watershed as well as historical management regimes and applicable information regarding
the multiple use premise described in MUSYA.
The objectives of the WWFMP were created with the overarching concept which recognized that the
biological, physical, and social ecosystems were the foundation for the planning process (WWNF 1990,
2.33). Under this concept, the WWFMP adopted an ecosystem approach perspective which identified
areas of importance to Forest Planning:
Old growth, riparian/aquatic and upper-slope ecosystems are examples where more information
would be desirable to test planning assumptions as future plans are developed. Human visitors in
17
the forest are an integral part of these ecosystems. People’s needs, and expectations of the Forest
should be considered in Forest Planning.
3.3.2.!Measures of Success: Desired Future Conditions of the Forest for
Riparian and Water Resources
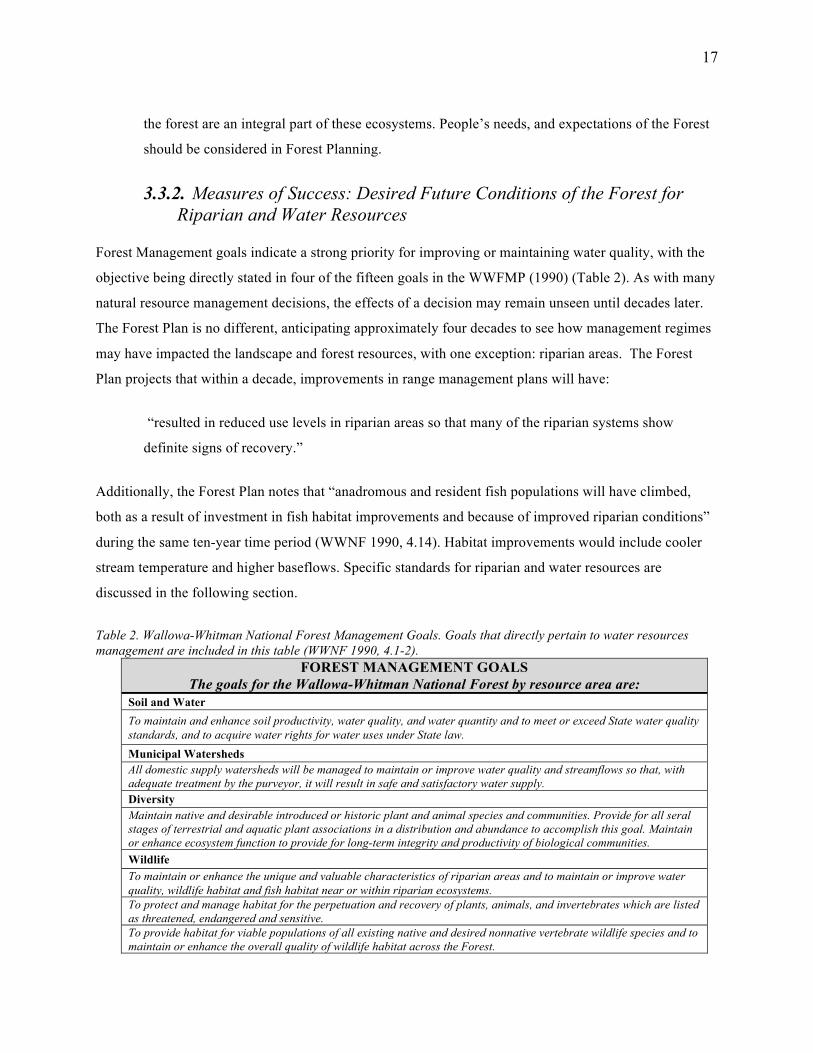
Forest Management goals indicate a strong priority for improving or maintaining water quality, with the
objective being directly stated in four of the fifteen goals in the WWFMP (1990) (Table 2). As with many
natural resource management decisions, the effects of a decision may remain unseen until decades later.
The Forest Plan is no different, anticipating approximately four decades to see how management regimes
may have impacted the landscape and forest resources, with one exception: riparian areas. The Forest
Plan projects that within a decade, improvements in range management plans will have:
“resulted in reduced use levels in riparian areas so that many of the riparian systems show
definite signs of recovery.”
Additionally, the Forest Plan notes that “anadromous and resident fish populations will have climbed,
both as a result of investment in fish habitat improvements and because of improved riparian conditions”
during the same ten-year time period (WWNF 1990, 4.14). Habitat improvements would include cooler
stream temperature and higher baseflows. Specific standards for riparian and water resources are
discussed in the following section.
Table 2. Wallowa-Whitman National Forest Management Goals. Goals that directly pertain to water resources management are included in this table (WWNF 1990, 4.1-2).
FOREST MANAGEMENT GOALS The goals for the Wallowa-Whitman National Forest by resource area are:
Soil and Water To maintain and enhance soil productivity, water quality, and water quantity and to meet or exceed State water quality standards, and to acquire water rights for water uses under State law. Municipal Watersheds All domestic supply watersheds will be managed to maintain or improve water quality and streamflows so that, with adequate treatment by the purveyor, it will result in safe and satisfactory water supply. Diversity Maintain native and desirable introduced or historic plant and animal species and communities. Provide for all seral stages of terrestrial and aquatic plant associations in a distribution and abundance to accomplish this goal. Maintain or enhance ecosystem function to provide for long-term integrity and productivity of biological communities. Wildlife To maintain or enhance the unique and valuable characteristics of riparian areas and to maintain or improve water quality, wildlife habitat and fish habitat near or within riparian ecosystems. To protect and manage habitat for the perpetuation and recovery of plants, animals, and invertebrates which are listed as threatened, endangered and sensitive. To provide habitat for viable populations of all existing native and desired nonnative vertebrate wildlife species and to maintain or enhance the overall quality of wildlife habitat across the Forest.
18
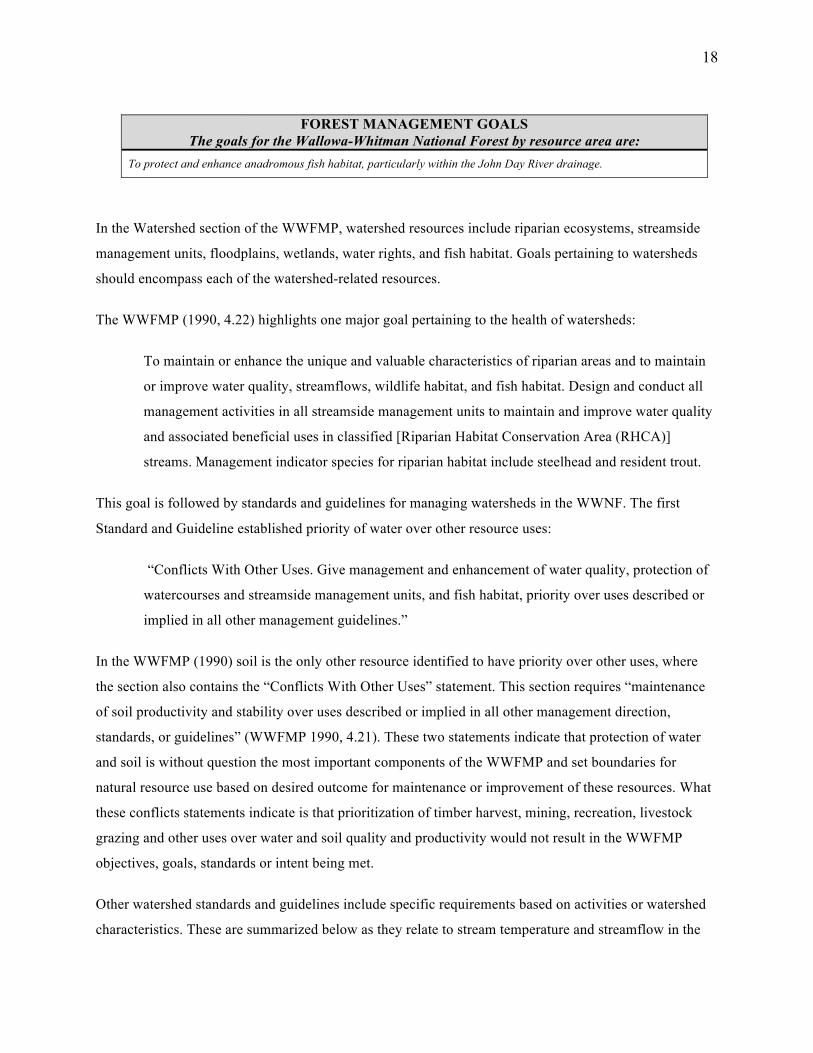
FOREST MANAGEMENT GOALS The goals for the Wallowa-Whitman National Forest by resource area are:
To protect and enhance anadromous fish habitat, particularly within the John Day River drainage.
In the Watershed section of the WWFMP, watershed resources include riparian ecosystems, streamside
management units, floodplains, wetlands, water rights, and fish habitat. Goals pertaining to watersheds
should encompass each of the watershed-related resources.
The WWFMP (1990, 4.22) highlights one major goal pertaining to the health of watersheds:
To maintain or enhance the unique and valuable characteristics of riparian areas and to maintain
or improve water quality, streamflows, wildlife habitat, and fish habitat. Design and conduct all
management activities in all streamside management units to maintain and improve water quality
and associated beneficial uses in classified [Riparian Habitat Conservation Area (RHCA)]
streams. Management indicator species for riparian habitat include steelhead and resident trout.
This goal is followed by standards and guidelines for managing watersheds in the WWNF. The first
Standard and Guideline established priority of water over other resource uses:
“Conflicts With Other Uses. Give management and enhancement of water quality, protection of
watercourses and streamside management units, and fish habitat, priority over uses described or
implied in all other management guidelines.”
In the WWFMP (1990) soil is the only other resource identified to have priority over other uses, where
the section also contains the “Conflicts With Other Uses” statement. This section requires “maintenance
of soil productivity and stability over uses described or implied in all other management direction,
standards, or guidelines” (WWFMP 1990, 4.21). These two statements indicate that protection of water
and soil is without question the most important components of the WWFMP and set boundaries for
natural resource use based on desired outcome for maintenance or improvement of these resources. What
these conflicts statements indicate is that prioritization of timber harvest, mining, recreation, livestock
grazing and other uses over water and soil quality and productivity would not result in the WWFMP
objectives, goals, standards or intent being met.
Other watershed standards and guidelines include specific requirements based on activities or watershed
characteristics. These are summarized below as they relate to stream temperature and streamflow in the
19
case study area (WWNF 1990, 4.23-24):
•! “Mitigate negative impacts causing reduction in water quality to return water quality to previous
levels in as short a time as possible.”.
•! “[Timber] harvest will not occur within 100 feet of the high-water line on either Class I or Class
II [now referred to as RHCA]. Harvest may occur along these streams, for other than timber
management purposes, when doing so would enhance water quality, fish habitat or wildlife
habitat. Along Class III and IV streams, manage tree stands to maintain the vegetative
characteristics needed for water quality protection or improvement and to maintain or enhance
stream channel stability. Only those treatments that maintain or enhance water and riparian
quality and are consistent with riparian management and fish habitat goals will be applied.”
•! “Prevent measureable temperature increases in Class I Streams (less than a 0.5 degree Fahrenheit
change). Temperature increases on SMU Class II (and fish bearing SMU Class III) streams will
be limited to the criteria in State standards. Temperatures on other streams may be increased only
to the extent that water quality goals on downstream, fish-bearing streams will be met.”
•! “Enhance streambank vegetation and/or large woody debris where it can be effective in
improving channel stability or fish habitat.”
•! “Protect watershed values to the fullest extent possible under the existing laws in evaluating and
developing mineral operating plans.”
National Forest Management Plans, like the WWFMP, are an important tool for managing public
resources on a local level. Utilizing these plans in support of and conjunction with federal laws and
regulations provides clear and relevant direction to sustain resources. Their implementation takes place
via various projects, actions, and management decisions over the period of the plan. In the case of the
WWFMP (1990), the timeframe extended to a period of twenty-seven years resulting in more time for
improvement in the case study area.
20
4.! Case Study: North Fork Burnt River Watershed
4.1.! North Fork Burnt River Watershed Overview To assess the effectiveness of the WWFMP (1990) a case study was examined for improvements in water
resources since the implementation of the plan. The case study is the North Fork Burnt River Watershed
(HUC 10#1705020201) and examines the parameters streamflow and stream temperature.
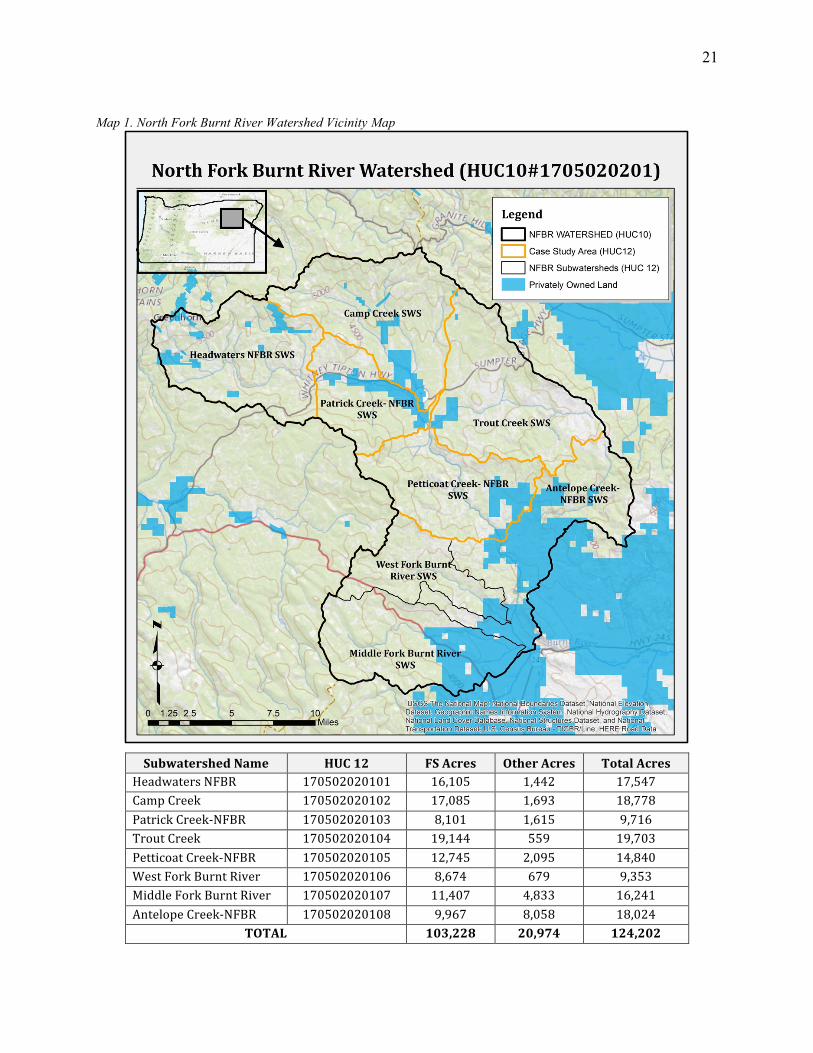
4.1.1.!Geographical Location The NFBR Watershed is located in the Elkhorn Mountains of Northeastern Oregon. It is composed of
eight subwatersheds and spans roughly 124,202 total acres (Map 1) (USDA/NRCS 2013). The watershed
consists of public and privately owned lands managed by the WWNF and private landowners. Nearly
eighty-three percent (103,228 acres) of the watershed occurs on public lands (WWNF 1995, 1.5). The
NFBR is a tributary to the Burnt River, and its headwaters originates near Greenhorn Mountain at roughly
7,500 feet in elevation. The stream flows south through Whitney Valley which is a privately owned,
meadow area, roughly nine miles long. After passing through Whitney Valley, the NFBR flows onto
National Forest for approximately seven miles, consisting of riparian floodplains and coniferous forest.
The stream then flows approximately six miles through ranch land before emptying into the Unity
Reservoir.
4.1.2.!Water Quality and Streamflow Water quality and streamflow historically have been altered by both natural and anthropogenic causes
including mining, logging, grazing, road building, and Native American practices (burning and hunting).
Particularly, the period between 1880-1920 experienced overgrazing and logging which caused erosion,
increases in surface runoff, and decreases in groundwater infiltration (Elmore 1992, 261; Hibbert 1976,
64; Platts 1981, 2). Land use activities continue to affect streamflow and stream temperature, some of
which could potentially lead to future controversy and conflict between users. These activities include
surface and groundwater water withdrawals for agriculture, livestock, and domestic use (WWNF 1990,
2.14). Since its 1998 water quality assessment, ODEQ has listed two streams in the NFBR Watershed as
impaired for stream temperature under Category 5 (a designated use is not supported, or a water quality
standard is not attained and a TMDL is needed) (Appendix B). Streams included on the 303(d) list for
temperature are the North Fork Burnt River and Trout Creek.
21
Map 1. North Fork Burnt River Watershed Vicinity Map
Subwatershed,Name, HUC,12, FS,Acres, Other,Acres, Total,Acres,
Headwaters)NFBR) 170502020101) 16,105) 1,442) 17,547)Camp)Creek) 170502020102) 17,085) 1,693) 18,778)Patrick)Creek@NFBR) 170502020103) 8,101) 1,615) 9,716)Trout)Creek) 170502020104) 19,144) 559) 19,703)Petticoat)Creek@NFBR) 170502020105) 12,745) 2,095) 14,840)West)Fork)Burnt)River) 170502020106) 8,674) 679) 9,353)Middle)Fork)Burnt)River) 170502020107) 11,407) 4,833) 16,241)Antelope)Creek@NFBR) 170502020108) 9,967) 8,058) 18,024)
TOTAL, 103,228, 20,974, 124,202,
22
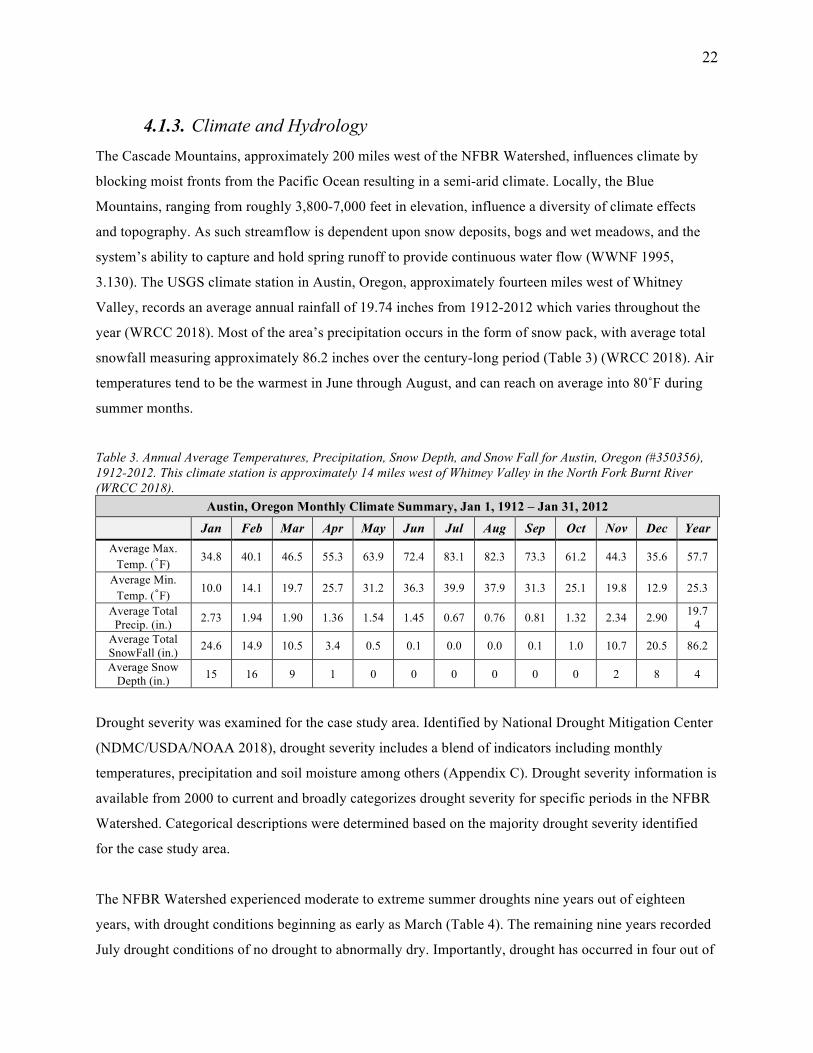
4.1.3.!Climate and Hydrology The Cascade Mountains, approximately 200 miles west of the NFBR Watershed, influences climate by
blocking moist fronts from the Pacific Ocean resulting in a semi-arid climate. Locally, the Blue
Mountains, ranging from roughly 3,800-7,000 feet in elevation, influence a diversity of climate effects
and topography. As such streamflow is dependent upon snow deposits, bogs and wet meadows, and the
system’s ability to capture and hold spring runoff to provide continuous water flow (WWNF 1995,
3.130). The USGS climate station in Austin, Oregon, approximately fourteen miles west of Whitney
Valley, records an average annual rainfall of 19.74 inches from 1912-2012 which varies throughout the
year (WRCC 2018). Most of the area’s precipitation occurs in the form of snow pack, with average total
snowfall measuring approximately 86.2 inches over the century-long period (Table 3) (WRCC 2018). Air
temperatures tend to be the warmest in June through August, and can reach on average into 80˚F during
summer months.
Table 3. Annual Average Temperatures, Precipitation, Snow Depth, and Snow Fall for Austin, Oregon (#350356), 1912-2012. This climate station is approximately 14 miles west of Whitney Valley in the North Fork Burnt River (WRCC 2018).
Austin, Oregon Monthly Climate Summary, Jan 1, 1912 – Jan 31, 2012 Jan Feb Mar Apr May Jun Jul Aug Sep Oct Nov Dec Year
Average Max. Temp. (˚F) 34.8 40.1 46.5 55.3 63.9 72.4 83.1 82.3 73.3 61.2 44.3 35.6 57.7
Average Min. Temp. (˚F) 10.0 14.1 19.7 25.7 31.2 36.3 39.9 37.9 31.3 25.1 19.8 12.9 25.3
Average Total Precip. (in.) 2.73 1.94 1.90 1.36 1.54 1.45 0.67 0.76 0.81 1.32 2.34 2.90 19.7
4 Average Total SnowFall (in.) 24.6 14.9 10.5 3.4 0.5 0.1 0.0 0.0 0.1 1.0 10.7 20.5 86.2
Average Snow Depth (in.) 15 16 9 1 0 0 0 0 0 0 2 8 4
Drought severity was examined for the case study area. Identified by National Drought Mitigation Center
(NDMC/USDA/NOAA 2018), drought severity includes a blend of indicators including monthly
temperatures, precipitation and soil moisture among others (Appendix C). Drought severity information is
available from 2000 to current and broadly categorizes drought severity for specific periods in the NFBR
Watershed. Categorical descriptions were determined based on the majority drought severity identified
for the case study area.
The NFBR Watershed experienced moderate to extreme summer droughts nine years out of eighteen
years, with drought conditions beginning as early as March (Table 4). The remaining nine years recorded
July drought conditions of no drought to abnormally dry. Importantly, drought has occurred in four out of
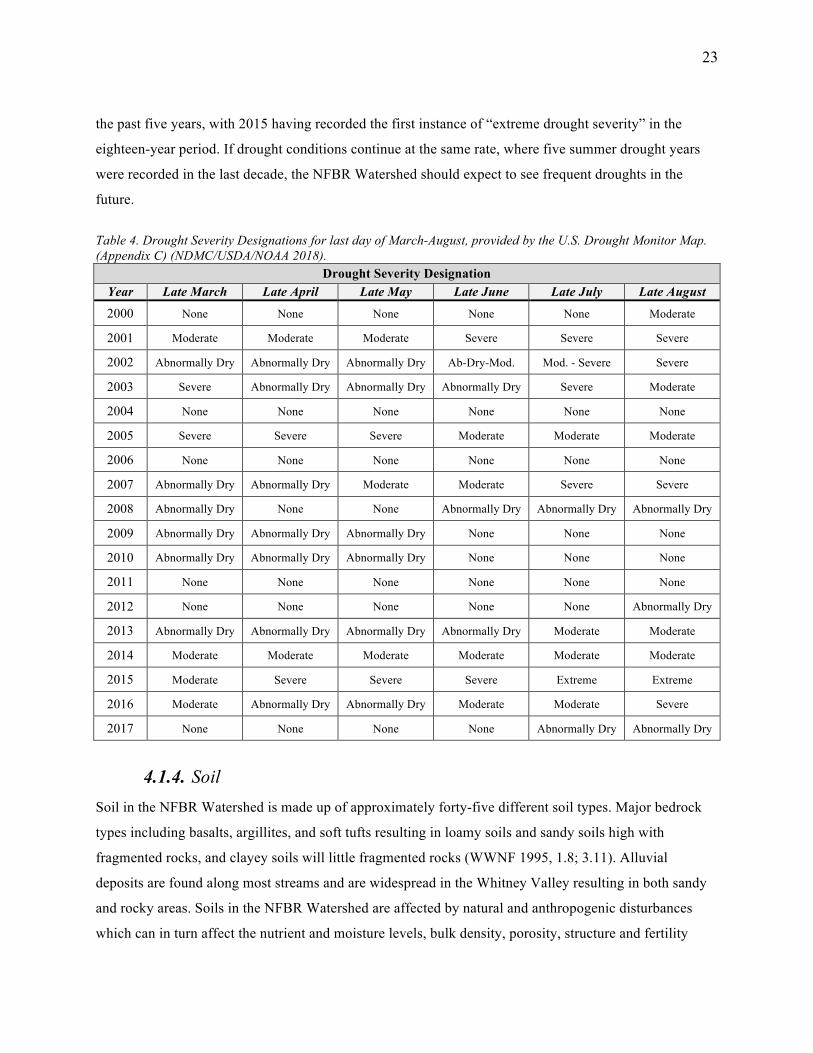
23
the past five years, with 2015 having recorded the first instance of “extreme drought severity” in the
eighteen-year period. If drought conditions continue at the same rate, where five summer drought years
were recorded in the last decade, the NFBR Watershed should expect to see frequent droughts in the
future.
Table 4. Drought Severity Designations for last day of March-August, provided by the U.S. Drought Monitor Map. (Appendix C) (NDMC/USDA/NOAA 2018).
Drought Severity Designation Year Late March Late April Late May Late June Late July Late August 2000 None None None None None Moderate
2001 Moderate Moderate Moderate Severe Severe Severe
2002 Abnormally Dry Abnormally Dry Abnormally Dry Ab-Dry-Mod. Mod. - Severe Severe
2003 Severe Abnormally Dry Abnormally Dry Abnormally Dry Severe Moderate
2004 None None None None None None
2005 Severe Severe Severe Moderate Moderate Moderate
2006 None None None None None None
2007 Abnormally Dry Abnormally Dry Moderate Moderate Severe Severe
2008 Abnormally Dry None None Abnormally Dry Abnormally Dry Abnormally Dry
2009 Abnormally Dry Abnormally Dry Abnormally Dry None None None
2010 Abnormally Dry Abnormally Dry Abnormally Dry None None None
2011 None None None None None None
2012 None None None None None Abnormally Dry
2013 Abnormally Dry Abnormally Dry Abnormally Dry Abnormally Dry Moderate Moderate
2014 Moderate Moderate Moderate Moderate Moderate Moderate
2015 Moderate Severe Severe Severe Extreme Extreme
2016 Moderate Abnormally Dry Abnormally Dry Moderate Moderate Severe
2017 None None None None Abnormally Dry Abnormally Dry
4.1.4.!Soil Soil in the NFBR Watershed is made up of approximately forty-five different soil types. Major bedrock
types including basalts, argillites, and soft tufts resulting in loamy soils and sandy soils high with
fragmented rocks, and clayey soils will little fragmented rocks (WWNF 1995, 1.8; 3.11). Alluvial
deposits are found along most streams and are widespread in the Whitney Valley resulting in both sandy
and rocky areas. Soils in the NFBR Watershed are affected by natural and anthropogenic disturbances
which can in turn affect the nutrient and moisture levels, bulk density, porosity, structure and fertility
24
(Harvey et al. 1994, 21). These disturbances include: wildfires, timber harvest (clear cutting), grazing by
ungulates (domestic and wild), farming, and mining. Disturbances such as these have caused
displacement, compaction and erosion which can take anywhere from five years to decades to recover
from (WWNF 1995, 3.14-15). The WWFMP (1990) recognizes soil compaction as a major factor
affecting longevity of soil productivity, specifically regarding timber harvest and tractor activity.
Decreased watershed conditions, surface and streambank erosion are identified as needing restoration due
to past timber harvest, road construction, and grazing (WWNF 1990, 2.17).
4.1.5.!Vegetation Three vegetation types dominate the NFBR Watershed: riparian vegetation (wide variety of shrubs,
grasses, and sedges), upland non-forested vegetation (juniper woodlands, grasslands, and scablands), and
hillslope forest (conifer dominance with some inclusion of quaking aspen) (WWNF 1995, 1.8).
Vegetation composition and type have been altered throughout history by natural and anthropogenic
disturbances: fire, livestock grazing, mining, and logging. Historically, ranges were overstocked in the
late 1800’s and overgrazed in the early 1900’s resulting in widespread changes which altered riparian
plant diversity, compacted soils, and caused erosion (Elmore and Beschta 1987, 262). Placer and
hydraulic mining (1860-1900), bucketline dredges (1900-1930), and lode mining (after 1900) have also
altered riparian habitats by disturbing streamside vegetation and inhibited plant development along stream
channels (WWNF 1995, 3.25-26).
Prior to the settlers moving to western America, the NFBR Watershed was made up of a diverse mix of
seral type, Ponderosa pine and Western larch. After harvests began, climax-type Douglas-fir and grand fir
have become more dominant (WWNF 1995, 3.48). Clear cutting in riparian areas and introduction of
exotic plants have also posed challenges to natural plant communities. As much as a third of the
watershed has been harvested for timber since the late 1970s, however, harvest activity in riparian areas
has been limited after the 1980s. In the NFBR Watershed Analysis (1995, 3.52), since the 1960’s there
are signs of downcut channels revegetating and density increases in sedge and riparian grasses. The
improvement has been attributed to better stewardship, revised allotment management, and reintroduction
of beaver (WWNF 1995, 3.52).
25
4.1.6.!Management Indicator Species & Threatened, Endangered, and
Sensitive Species Streams in the NFBR Watershed are home to many aquatic species, including redband trout
(Oncorhynchus mykiss gairdneri) and rainbow trout (salmo gairdineri). Two indicator species, the
steelhead trout and redband trout are identified by the WWFMP, though the creation of the Columbia and
Snake River dams has prevented steelhead from possible migration into the NFBR system. Two sensitive
species are identified in the WWNF: redband and bull trout (Salvelinus confluentus). Due to the failure to
verify existence of bull trout in the NFBR (Ratliff and Howell 1993) (USFWS 2015, C3), and the absence
of steelhead trout, many water quality standards are contingent upon redband and rainbow trout survival.
Populations of both rainbow and redband trout have been reduced due to the loss of available habitats and
introduction of hatchery rainbow trout and subsequent hybridization (WWNF 1995, 3.112-113) (Bacon et
al. 1980, 20).
NFMA regulations require that “fish and wildlife habitat should be managed to maintain viable
populations of existing…species in the planning area.” Further, the WWFMP asserts that to protect viable
population, two primary objectives should be met (WWNF 1990, 2.9):
1.! “Habitat must be provided to support, at least, a minimum number of reproductive individuals”
2.! “Habitat must be well-distributed so that those individuals can interact with others in this
planning area.”
The objectives for minimum habitat requirements are applicable to the conservation of redband trout, a
Species of Concern under the United States Fish and Wildlife Service Threatened & Endangered Species
System (TESS) (USFWS 2000). The abundance of this species relies on riparian coverage, including
riparian characteristics such as undercut banks, large woody debris, and overhanging vegetation as well as
variety of channel and substrate types (USFWS 2000).
The Endangered Species Act of 1973 protects all threatened, endangered, and sensitive species are by
allowing the Secretary of Agriculture to “establish and implement a program to conserve fish, wildlife,
and plants, including federally listed species” (ESA; 16 U.S.C. § 1531 et seq.). When forest management
plans pose an effect to any threatened, endangered and sensitive species the Forest Service must first
consult the USFWS for review and approval.
26
4.1.7.!Designated Beneficial Uses In addition to water, many resources and resource uses exist in the NFBR Watershed. They include:
aquatic and wildlife, vegetation, fuelwood, hunting, grazing, farming, berry picking, mining, timber
harvest, rock sources, utilities, transportation, mining, recreation and cultural/historical. Each of these
resources is indicative of the value the NFBR Watershed has for the local and regional community and
are considered important components to management of the case study area.
The following list includes the designated surface water beneficial uses for the Burnt Subbasin
(HUC10#1705020201), in which the case study occurs (OAR 340-41-0260). For State-level water
resources management planning, each of these beneficial uses apply:
•! Private Domestic Water Supply
•! Industrial Water Supply
•! Public Domestic Water Supply
•! Irrigation
•! Livestock Watering
•! Fish and Aquatic Life
•! Wildlife and Hunting
•! Fishing
•! Boating
•! Water Contact Recreation
•! Aesthetic Quality
With water being one of the most publicly used resources, substantial input was received during the
public comment period in the creation of the WWFMP (1990), resulting in the following concerns:
•! Maintenance and improvements in water quality
•! Maintenance of streamflows and runoff timing
•! Dam construction
•! Use of herbicides
•! Development of hydropower
Some of the major users of surface water identified in the WWFMP include: agriculture (largest and
increasing), industry, municipal supply, and other domestic use. Other users include fish, both resident
27
and anadromous, which rely on water quality and water quantity (Appendix A). In addition to being
listed as a Designated Beneficial Use in OAR 340-41-0260, recreation, including camping, hiking,
boating, fishing, and ATV use is included in the resource summary for the WWFMP (1990). Several
dispersed campsites exist in the NFBR Watershed; however, recreation has a limited impact on the
hydrological processes taking place in the NFBR Watershed.
4.2.! Monitoring Locations For the case study, five subwatersheds were selected due to available long-term streamflow and stream
temperature data. The subwatersheds and stream temperature monitoring sites are detailed below and
include both the long-term and expanded monitoring sites (Map 2). Photos of the monitoring sites are
found in Appendix E.
Headwaters North Fork Burnt River SWS (HUC12 #170502020101) is located on the northwestern
portion of the NFBR Watershed and is drained by Greenhorn, Snow, China, and Geiser Creeks. This
subwatershed contains the following water temperature monitoring site: Snow 83G.1. Snow 83G.1 is
located on a tributary upstream at the confluence with NFBR and downstream of the confluence with
Greenhorn Creek. The stream is narrow, densely forested, and located on public land.
Camp Creek SWS (HUC12#170502020102) is located at the northern end of the NFBR Watershed and is
drained by Camp, Dry, Mosquito, and Gimlet Creeks. This subwatershed encompasses the north and
eastern portions of Whitney Valley. This subwatershed contains the following water temperature
monitoring sites: Camp 83F.1 and extended monitoring site Camp 83F.2. Camp 83F.1 is located upstream
of its confluence with Pinus Creek on public land. The monitoring site occurs in a narrow channel with
large wood in the stream, and occurs at the downstream end of an area that has not been grazed since
20062. Stream-side shade is provided by conifers and alders. Camp 83F.2 is located approximately 1.5
stream miles downstream of Camp 83F.1, after the stream passes through a large meadow and a grazing
allotment. The stretches of stream between the two sites show some channel straightening and riparian
woody vegetation is limited in some places. Recent restoration work has included in-stream wood to
provide bank protection from stream erosion.
2!S. Fouty, US Forest Service, Wallowa-Whitman National Forest District Hydrologist, ret., Personal communication, August 5, 2018.!
28
Patrick Creek-North Fork Burnt River SWS (HUC12#170502020103) is located from river mile 8 to
river mile 14. The subwatershed is drained by Patrick Creek and numerous springs and contains the north
and west portions of Whitney Valley. This subwatershed contains the following water temperature
monitoring site: NFBR 83E.3 and NFBR 83E.2. NFBR 83E.3 is located upstream of NFBR 83E.2, above
Whitney Valley and downstream of Highway 7. The stream channel is wide and the streambanks up and
downstream of the monitoring site are densely populated with willow and alder. NFBR 83E.2 is located
just upstream of the confluence with Trout Creek and downstream of Whitney Valley and NFBR 83E.3.
Approximately eight miles of stream separate these most-upstream NFBR sites. The stream flows through
Whitney Valley, a valley bottom with very limited riparian woody vegetation, abundant bare streambank,
and an incised channel which parallels Highway 7. Beaver activity occurs at and downstream of NFBR
83E.2, slowing river velocity and creating pools.
Trout Creek SWS (HUC12#170502020104) is located on the southeastern corner of the NFBR. It
includes the Trout Creek drainage as well as Bridge and Alder Creeks, Three Cent Gulch, and numerous
springs. This subwatershed contains the following water temperature monitoring site: Trout 83D.1 and
expanded monitoring sites Trout 83D.3 and Trout 83D.5. Trout 83D.1 is located just upstream of the
confluence with NFBR, less than a mile from NFBR 83E.2. The stream channel is narrow and deep for
the entire monitoring season. In the early 1990’s beavers were introduced to the area. Currently, several
active beaver dams exist on both upstream and downstream reaches of the creek, creating impoundments
that are deep and cool. Streambanks are vegetated with alder, willow, and other shrubs.
Petticoat Creek- North Fork Burnt River SWS (HUC12#170502020105) includes the NFBR from the
Big Flat Ditch diversion to river mile 8. It is drained by Second, Third, and Fourth Creeks. This
subwatershed contains old-growth ponderosa stands and the Unity Ranger District centennial old-growth
stand. The following water temperature monitoring site and stream gage site are located in this
subwatershed: NFBR 83A.1 and OWRD Stream Gage North Fork Burnt River near Whitney Valley
#13269300. NFBR 83A.1 is the most downstream monitoring site on the NFBR having passed through
forested over-story and extensive stretches of stream bank with ample riparian vegetation. The stream is
wide and becomes shallow during the summer months.
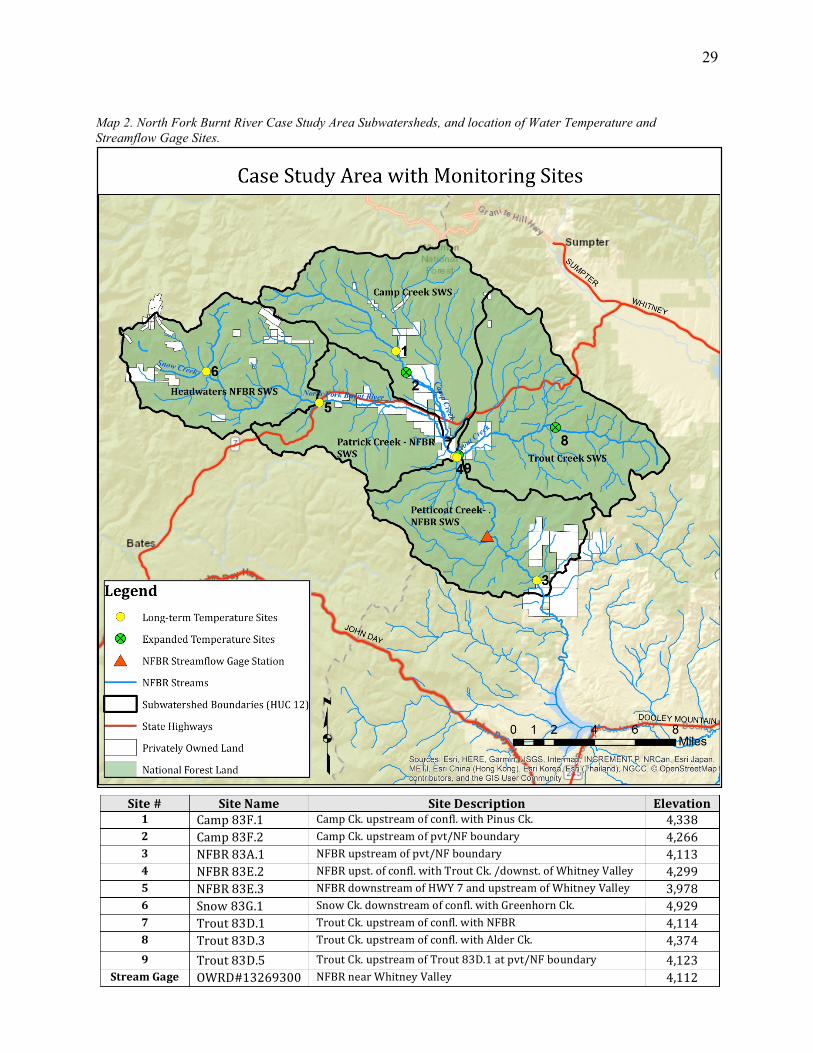
29
Map 2. North Fork Burnt River Case Study Area Subwatersheds, and location of Water Temperature and Streamflow Gage Sites.
,
,
,
,
Site,#, Site,Name, Site,Description, Elevation,1, Camp)83F.1) Camp)Ck.)upstream)of)confl.)with)Pinus)Ck.)) 4,338)2, Camp)83F.2) Camp)Ck.)upstream)of)pvt/NF)boundary) 4,266)3, NFBR)83A.1) NFBR)upstream)of)pvt/NF)boundary) 4,113)4, NFBR)83E.2) NFBR)upst.)of)confl.)with)Trout)Ck.)/downst.)of)Whitney)Valley) 4,299)5, NFBR)83E.3) NFBR)downstream)of)HWY)7)and)upstream)of)Whitney)Valley) 3,978)6, Snow)83G.1) Snow)Ck.)downstream)of)confl.)with)Greenhorn)Ck.)) 4,929)7, Trout)83D.1) Trout)Ck.)upstream)of)confl.)with)NFBR) 4,114)8, Trout)83D.3) Trout)Ck.)upstream)of)confl.)with)Alder)Ck.)) 4,374)9, Trout)83D.5) Trout)Ck.)upstream)of)Trout)83D.1)at)pvt/NF)boundary) 4,123)
Stream,Gage, OWRD#13269300) NFBR)near)Whitney)Valley) 4,112)
30
5.! Results
5.1.! Streamflow The NFBR stream gage (OWRD#13269300), encompasses a drainage area of 110 square miles and
accounts for streamflow through all the monitored stream temperature site locations except for the most
downstream site, NFBR 83A.1 (Map 2). There are no reservoirs or diversions upstream of the gage but
there is some unknown contribution of flow from the Pete Mann Ditch which diverts some water from the
tributaries of the North Fork John Day River into the headwaters of the NFBR (WWNF 1995, 3.29).
Therefore, streamflow reflects the snowmelt and precipitation events, as well as the Pete Mann Ditch
inputs.
Several characteristics emerged from examining the NFBR streamflow gage data. Peak events tend to
occur March through April, however, can occur as early as February and late as June (Table 5). Earlier
and later peak events are attributed to major climate events like rain on snow or early season snow melt.
Peak flow events range from 121cfs to 1100 cfs, with the median peak flow falling at approximately
511cfs (Table 5, Chart 1). The range of streamflow documented over the twenty-six-year period of
monitoring can be considered the range in potential streamflow volume in the NFBR. On some years,
peaks in flow occur more than once (Chart 2), indicative of an early season thaw, then re-freezing, then
melting. After the last peak event in the spring months, streamflow drops rapidly until reaching baseflow
conditions around mid-July with baseflows reduced to less than one percent of its annual peak flow for
most years (Table 5). Throughout the summer, late June through August, streamflow continues to stay
low (Chart 1, Table 6). Late summer flows (July 31st) were less than 10 cfs at a maximum. Some stretches
of the NFBR are wide and shallow during the summer months3 increasing exposure to long and short-
wave radiation. An example of stream conditions is provided in Figure 1. In conclusion, the data show no
changes in the shape of the hydrograph or baseflows in the past twenty-six years indicating that
conditions have not improved from 1992-2017. The lack baseflows have remained low and peak
streamflow continues to have short duration, high peak hydrographs versus longer duration, lower
magnitude peaks during the monitoring time span.
3 A. Morgan-Hayes, Powder Basin Watershed Council, Water Quality Coordinator, Personal field observation, August 14, 2017
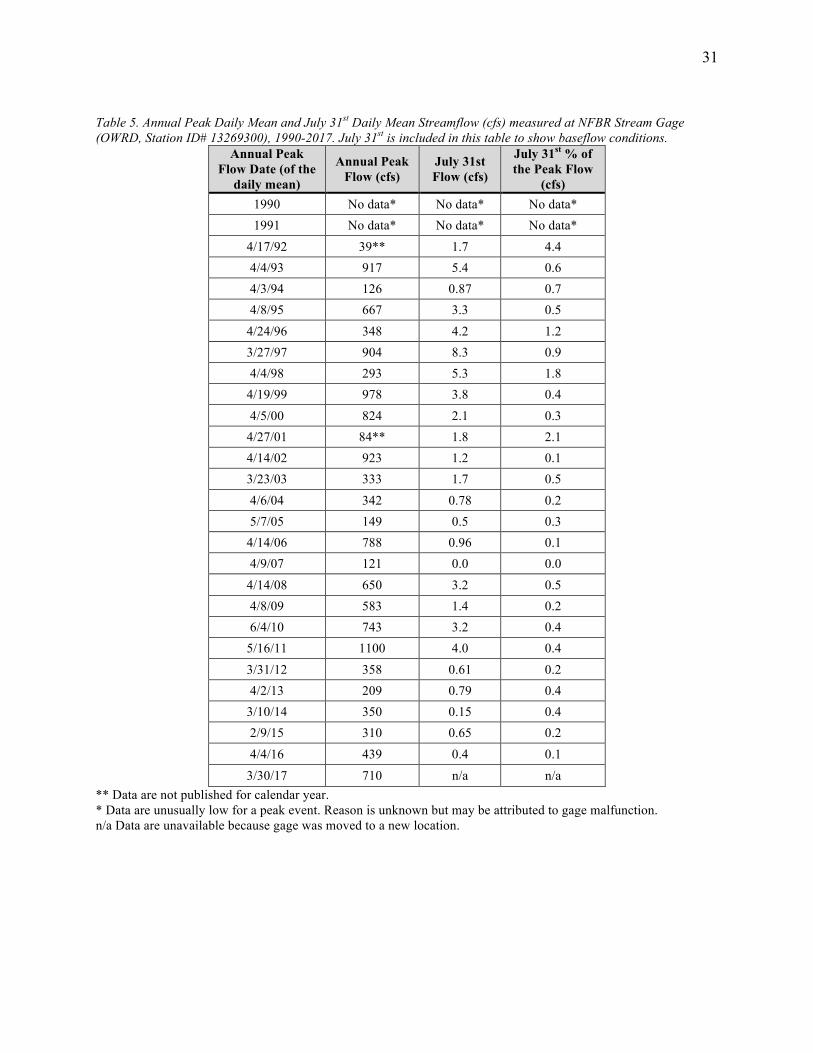
31
Table 5. Annual Peak Daily Mean and July 31st Daily Mean Streamflow (cfs) measured at NFBR Stream Gage (OWRD, Station ID# 13269300), 1990-2017. July 31st is included in this table to show baseflow conditions.
Annual Peak Flow Date (of the
daily mean)
Annual Peak Flow (cfs)
July 31st Flow (cfs)
July 31st % of the Peak Flow
(cfs) 1990 No data* No data* No data* 1991 No data* No data* No data*
4/17/92 39** 1.7 4.4 4/4/93 917 5.4 0.6 4/3/94 126 0.87 0.7 4/8/95 667 3.3 0.5
4/24/96 348 4.2 1.2 3/27/97 904 8.3 0.9 4/4/98 293 5.3 1.8
4/19/99 978 3.8 0.4 4/5/00 824 2.1 0.3
4/27/01 84** 1.8 2.1 4/14/02 923 1.2 0.1 3/23/03 333 1.7 0.5 4/6/04 342 0.78 0.2 5/7/05 149 0.5 0.3
4/14/06 788 0.96 0.1 4/9/07 121 0.0 0.0
4/14/08 650 3.2 0.5 4/8/09 583 1.4 0.2 6/4/10 743 3.2 0.4
5/16/11 1100 4.0 0.4 3/31/12 358 0.61 0.2 4/2/13 209 0.79 0.4
3/10/14 350 0.15 0.4 2/9/15 310 0.65 0.2 4/4/16 439 0.4 0.1
3/30/17 710 n/a n/a ** Data are not published for calendar year. * Data are unusually low for a peak event. Reason is unknown but may be attributed to gage malfunction. n/a Data are unavailable because gage was moved to a new location.
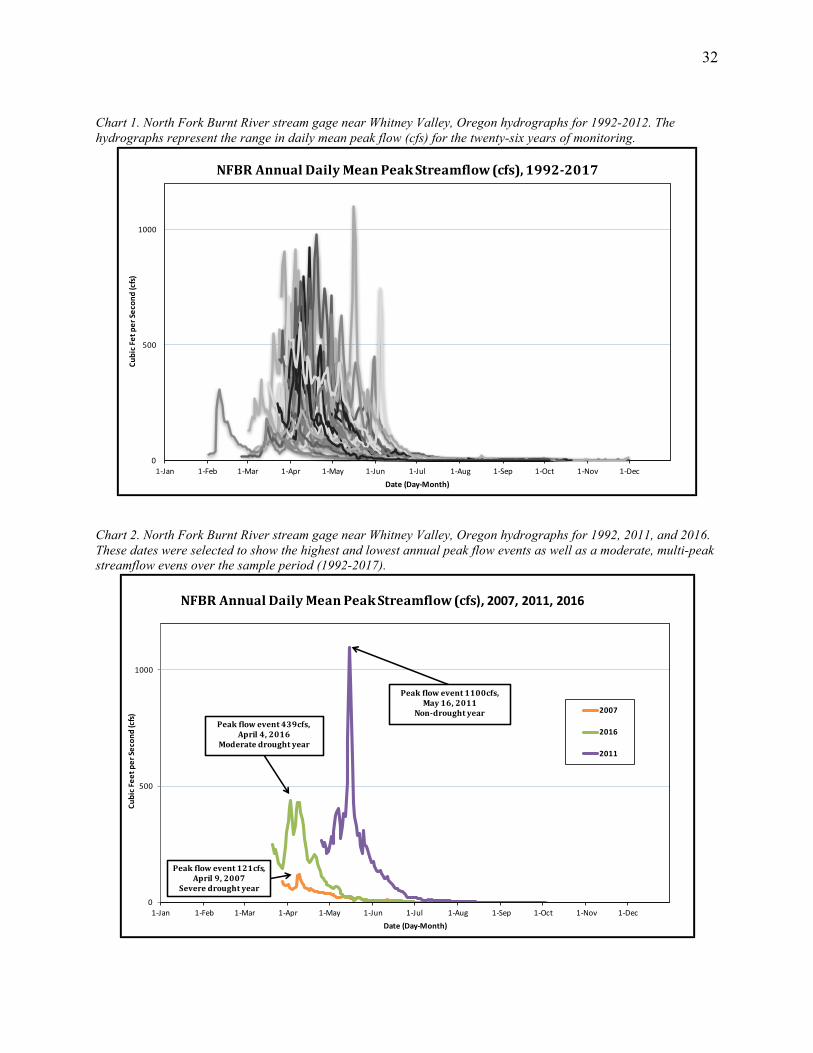
32
Chart 1. North Fork Burnt River stream gage near Whitney Valley, Oregon hydrographs for 1992-2012. The hydrographs represent the range in daily mean peak flow (cfs) for the twenty-six years of monitoring.
Chart 2. North Fork Burnt River stream gage near Whitney Valley, Oregon hydrographs for 1992, 2011, and 2016. These dates were selected to show the highest and lowest annual peak flow events as well as a moderate, multi-peak streamflow evens over the sample period (1992-2017).
0
500
1000
1$Jan 1$Feb 1$Mar 1$Apr 1$May 1$Jun 1$Jul 1$Aug 1$Sep 1$Oct 1$Nov 1$Dec
Cubic&F
et&per&Se
cond
&(cfs)
Date&(Day7Month)
NFBR%Annual%Daily%Mean%Peak%Streamflow%(cfs),%1992A2017%
0
500
1000
1$Jan 1$Feb 1$Mar 1$Apr 1$May 1$Jun 1$Jul 1$Aug 1$Sep 1$Oct 1$Nov 1$Dec
Cubic&F
eet&p
er&Se
cond
&(cfs)
Date&(Day7Month)
NFBR%Annual%Daily%Mean%Peak%Streamflow%(cfs),&2007,&2011,&2016
2007
2016
2011
Peak%flow%event%1100cfs,%May%16, 2011
NonBdrought%year
Peak%flow%event%121cfs,%April 9,%2007
Severe%drought%year
Peak%flow%event%439cfs,%April 4,%2016
Moderate%drought%year
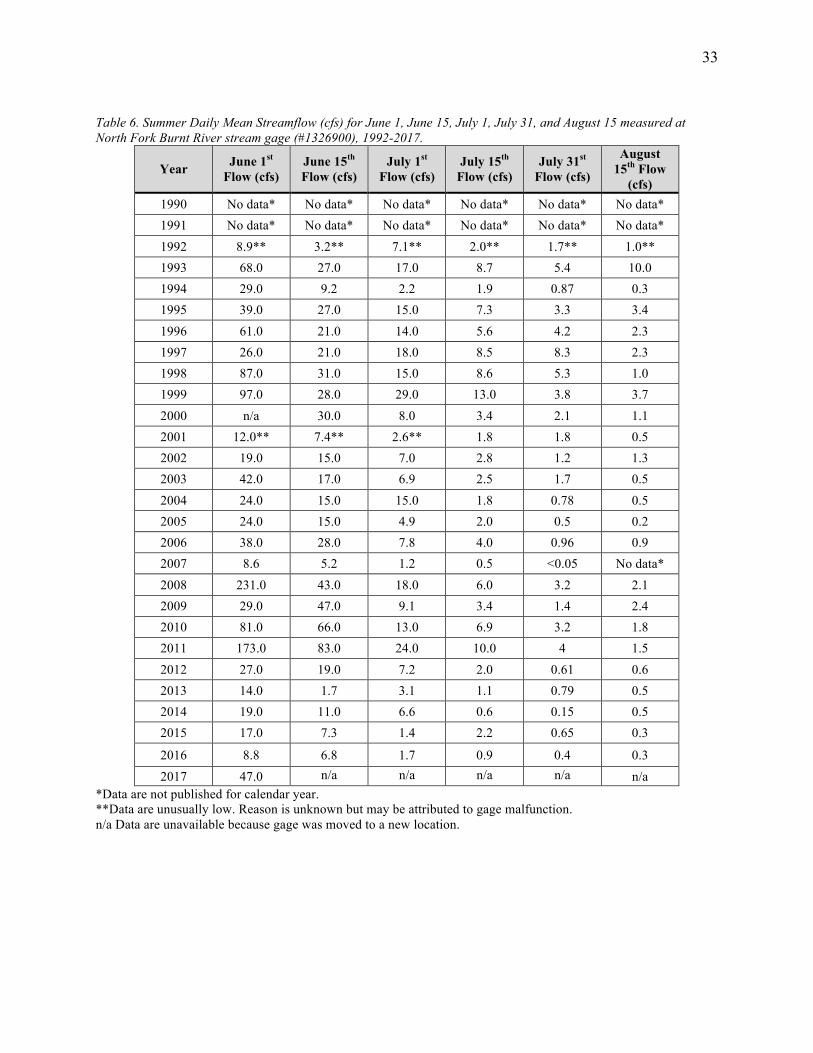
33
Table 6. Summer Daily Mean Streamflow (cfs) for June 1, June 15, July 1, July 31, and August 15 measured at North Fork Burnt River stream gage (#1326900), 1992-2017.
Year June 1st Flow (cfs)
June 15th Flow (cfs)
July 1st Flow (cfs)
July 15th Flow (cfs)
July 31st Flow (cfs)
August 15th Flow
(cfs) 1990 No data* No data* No data* No data* No data* No data* 1991 No data* No data* No data* No data* No data* No data* 1992 8.9** 3.2** 7.1** 2.0** 1.7** 1.0** 1993 68.0 27.0 17.0 8.7 5.4 10.0 1994 29.0 9.2 2.2 1.9 0.87 0.3 1995 39.0 27.0 15.0 7.3 3.3 3.4 1996 61.0 21.0 14.0 5.6 4.2 2.3 1997 26.0 21.0 18.0 8.5 8.3 2.3 1998 87.0 31.0 15.0 8.6 5.3 1.0 1999 97.0 28.0 29.0 13.0 3.8 3.7 2000 n/a 30.0 8.0 3.4 2.1 1.1 2001 12.0** 7.4** 2.6** 1.8 1.8 0.5 2002 19.0 15.0 7.0 2.8 1.2 1.3 2003 42.0 17.0 6.9 2.5 1.7 0.5 2004 24.0 15.0 15.0 1.8 0.78 0.5 2005 24.0 15.0 4.9 2.0 0.5 0.2 2006 38.0 28.0 7.8 4.0 0.96 0.9 2007 8.6 5.2 1.2 0.5 <0.05 No data* 2008 231.0 43.0 18.0 6.0 3.2 2.1 2009 29.0 47.0 9.1 3.4 1.4 2.4 2010 81.0 66.0 13.0 6.9 3.2 1.8 2011 173.0 83.0 24.0 10.0 4 1.5 2012 27.0 19.0 7.2 2.0 0.61 0.6 2013 14.0 1.7 3.1 1.1 0.79 0.5 2014 19.0 11.0 6.6 0.6 0.15 0.5 2015 17.0 7.3 1.4 2.2 0.65 0.3
2016 8.8 6.8 1.7 0.9 0.4 0.3 2017 47.0 n/a n/a n/a n/a n/a
*Data are not published for calendar year. **Data are unusually low. Reason is unknown but may be attributed to gage malfunction. n/a Data are unavailable because gage was moved to a new location.
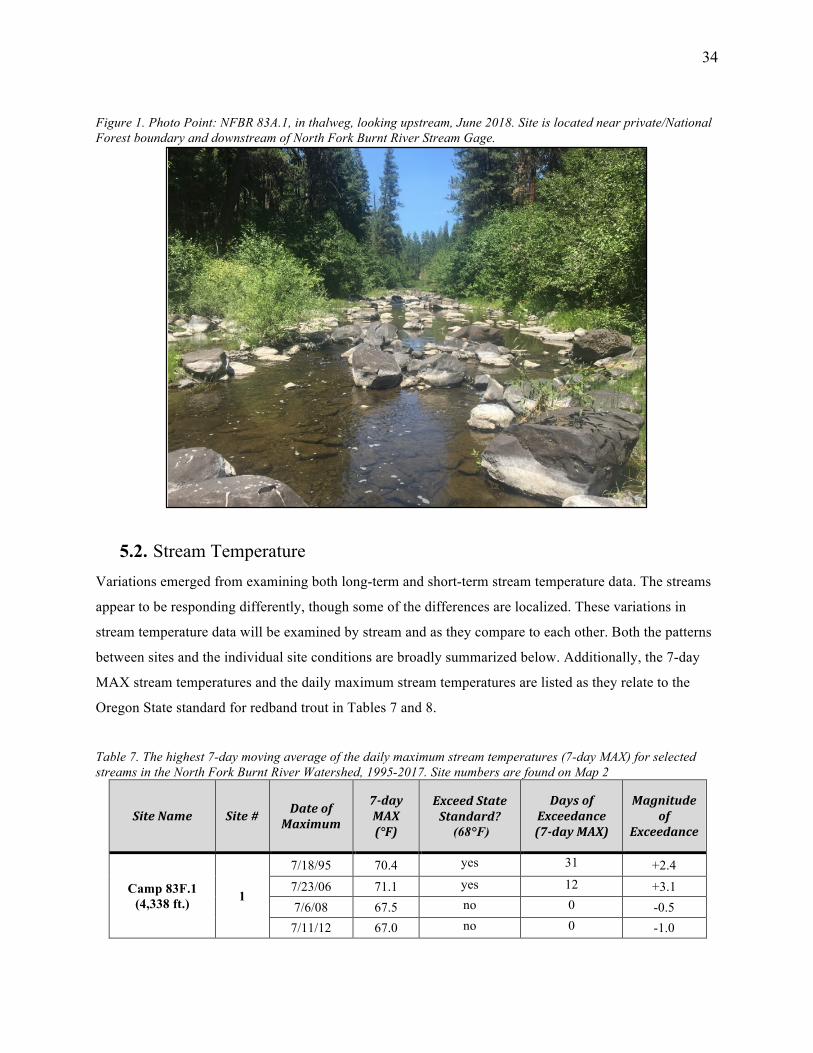
34
Figure 1. Photo Point: NFBR 83A.1, in thalweg, looking upstream, June 2018. Site is located near private/National Forest boundary and downstream of North Fork Burnt River Stream Gage.
5.2.! Stream Temperature Variations emerged from examining both long-term and short-term stream temperature data. The streams
appear to be responding differently, though some of the differences are localized. These variations in
stream temperature data will be examined by stream and as they compare to each other. Both the patterns
between sites and the individual site conditions are broadly summarized below. Additionally, the 7-day
MAX stream temperatures and the daily maximum stream temperatures are listed as they relate to the
Oregon State standard for redband trout in Tables 7 and 8.
Table 7. The highest 7-day moving average of the daily maximum stream temperatures (7-day MAX) for selected streams in the North Fork Burnt River Watershed, 1995-2017. Site numbers are found on Map 2
Site%Name% Site%#% Date%of%Maximum%
71day%MAX%(°F)%
Exceed%State%Standard?%
(68°F)%
Days%of%Exceedance%(71day%MAX)%
Magnitude%of%
Exceedance%
Camp 83F.1 (4,338 ft.) 1
7/18/95 70.4 yes 31 +2.4 7/23/06 71.1 yes 12 +3.1 7/6/08 67.5 no 0 -0.5
7/11/12 67.0 no 0 -1.0

35
Site%Name% Site%#% Date%of%Maximum%
71day%MAX%(°F)%
Exceed%State%Standard?%
(68°F)%
Days%of%Exceedance%(71day%MAX)%
Magnitude%of%
Exceedance%
7/16/14* 66.8 Unknown* Unknown* -1.2 6/27/15 68.7 yes 4 +0.7 6/27/16 64.9 no 0 -3.1 7/5/17 64.6 no 0 -3.4
NFBR 83E.2 (4,113 ft.) 3
7/25/95 76.8 yes 40 +8.8 7/24/96 77.3 yes 63 +9.3 8/5/97 78.7 yes 82 +10.7
7/23/06 83.5 yes 49 +15.5 8/15/08 78.0 yes 51 +10.0 7/10/12 79.7 yes 79 +11.7
7/16/2014* 81.0 yes** 62 +13.0 7/2/15 85.0 yes 83 +17.0
7/27/16 82.3 yes 78 +14.3 7/8/17 81.1 yes 85 +13.1
NFBR 83E.3 (4,299 ft.) 4
8/5/97 76.0 yes 45 +8.0 8/14/08 72.8 yes 45 +4.8 7/10/12 75.3 yes 51 +7.3 7/13/14 79.0 yes 52 +11.0 6/30/15 81.2 yes 74 +13.2 7/27/16 76.5 yes 50 +8.5 7/8/17 77.0 yes 73 +9.0
NFBR 83A.1 (3,978 ft.) 5
7/25/95 75.2 yes 41 +7.2 7/9/12 78.6 yes 60 +10.6
7/13/14 79.7 yes 47 +11.7 7/30/15 82.6 yes 84 +14.6 7/28/16 77.9 yes 68 +9.9 7/6/17 78.1 yes 58 +10.1
Snow 83G.1 (4,929 ft.) 6
8/3/95 61.4 no 0 -6.6 7/12/96 64.6 no 0 -3.4 8/4/05 66.1 no 0 -1.9
7/24/06 65.6 no 0 -2.4 8/15/08 60.8 no 0 -7.2 7/10/12 62.2 no 0 -5.8 7/14/14 64.3 no 0 -3.7 6/30/15 65.8 no 0 -2.2 7/27/16 63.4 no 0 -4.6
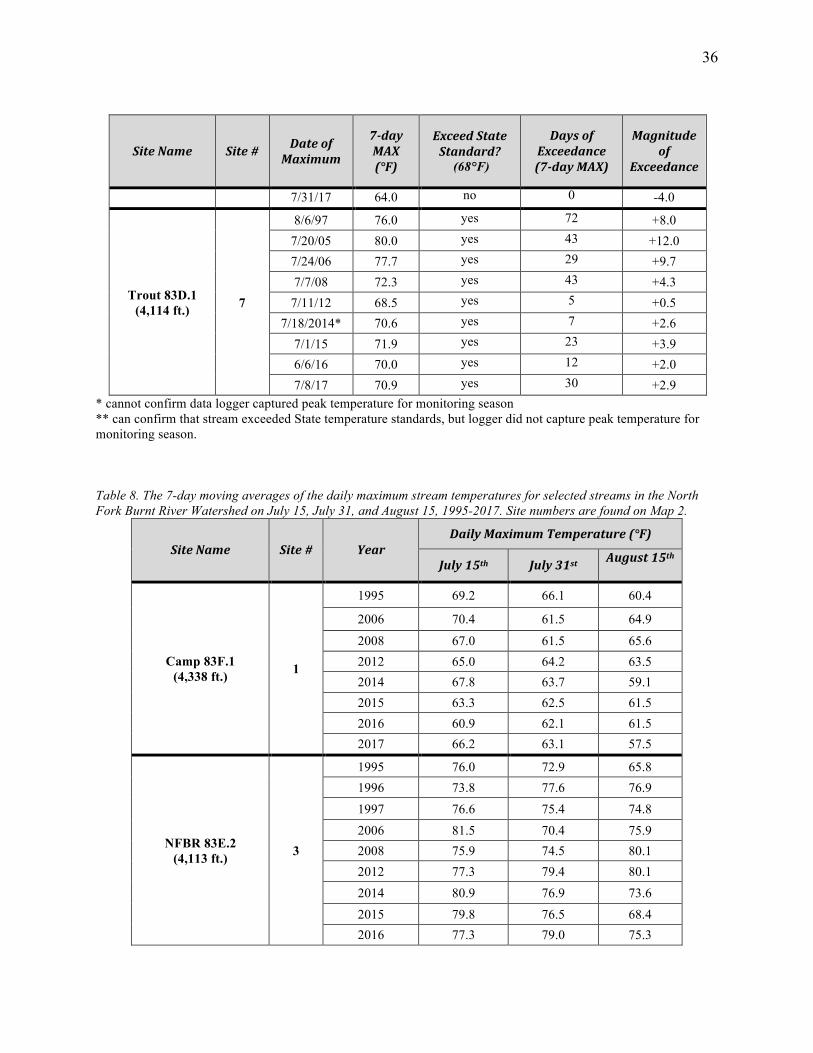
36
Site%Name% Site%#% Date%of%Maximum%
71day%MAX%(°F)%
Exceed%State%Standard?%
(68°F)%
Days%of%Exceedance%(71day%MAX)%
Magnitude%of%
Exceedance%
7/31/17 64.0 no 0 -4.0
Trout 83D.1 (4,114 ft.) 7
8/6/97 76.0 yes 72 +8.0 7/20/05 80.0 yes 43 +12.0 7/24/06 77.7 yes 29 +9.7 7/7/08 72.3 yes 43 +4.3
7/11/12 68.5 yes 5 +0.5 7/18/2014* 70.6 yes 7 +2.6
7/1/15 71.9 yes 23 +3.9 6/6/16 70.0 yes 12 +2.0 7/8/17 70.9 yes 30 +2.9
* cannot confirm data logger captured peak temperature for monitoring season ** can confirm that stream exceeded State temperature standards, but logger did not capture peak temperature for monitoring season. Table 8. The 7-day moving averages of the daily maximum stream temperatures for selected streams in the North Fork Burnt River Watershed on July 15, July 31, and August 15, 1995-2017. Site numbers are found on Map 2.
Site%Name% Site%#% Year%Daily%Maximum%Temperature%(°F)%
July%15th% July%31st% August%15th%%
Camp 83F.1 (4,338 ft.) 1
1995 69.2 66.1 60.4
2006 70.4 61.5 64.9
2008 67.0 61.5 65.6 2012 65.0 64.2 63.5 2014 67.8 63.7 59.1 2015 63.3 62.5 61.5 2016 60.9 62.1 61.5 2017 66.2 63.1 57.5
NFBR 83E.2 (4,113 ft.) 3
1995 76.0 72.9 65.8 1996 73.8 77.6 76.9 1997 76.6 75.4 74.8 2006 81.5 70.4 75.9 2008 75.9 74.5 80.1 2012 77.3 79.4 80.1 2014 80.9 76.9 73.6 2015 79.8 76.5 68.4 2016 77.3 79.0 75.3
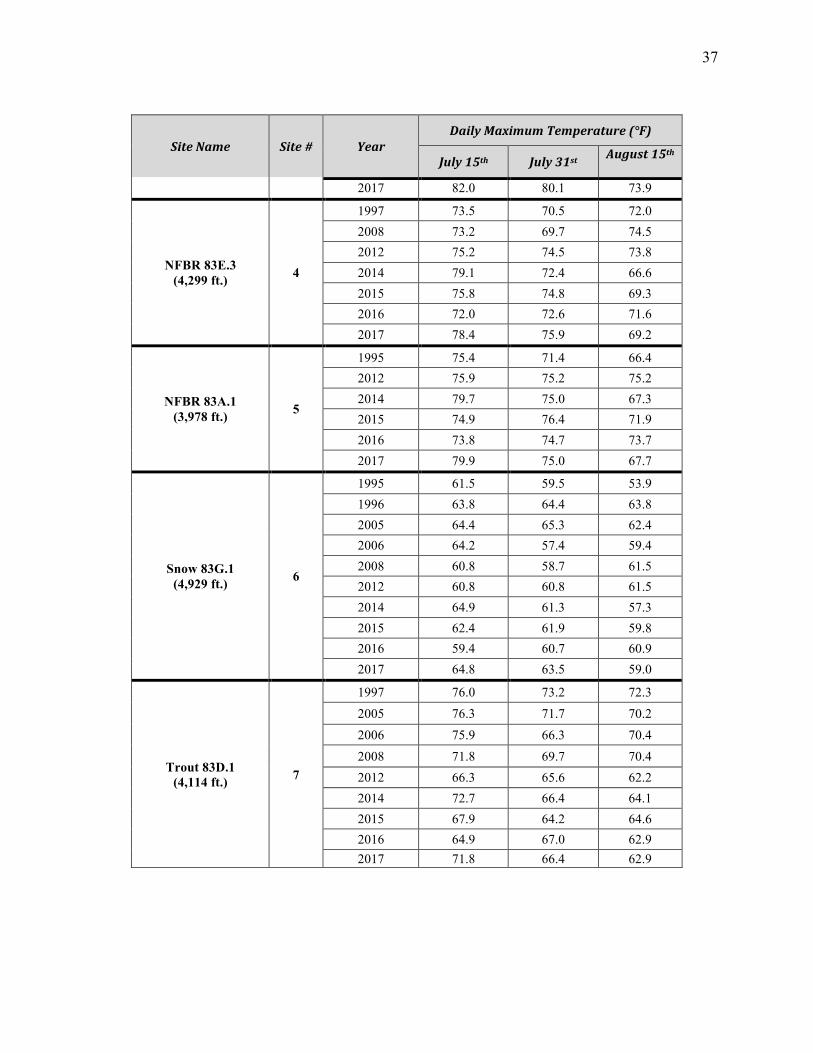
37
Site%Name% Site%#% Year%Daily%Maximum%Temperature%(°F)%
July%15th% July%31st% August%15th%%
2017 82.0 80.1 73.9
NFBR 83E.3 (4,299 ft.) 4
1997 73.5 70.5 72.0 2008 73.2 69.7 74.5 2012 75.2 74.5 73.8 2014 79.1 72.4 66.6 2015 75.8 74.8 69.3 2016 72.0 72.6 71.6 2017 78.4 75.9 69.2
NFBR 83A.1 (3,978 ft.) 5
1995 75.4 71.4 66.4 2012 75.9 75.2 75.2 2014 79.7 75.0 67.3 2015 74.9 76.4 71.9 2016 73.8 74.7 73.7 2017 79.9 75.0 67.7
Snow 83G.1 (4,929 ft.) 6
1995 61.5 59.5 53.9 1996 63.8 64.4 63.8 2005 64.4 65.3 62.4 2006 64.2 57.4 59.4 2008 60.8 58.7 61.5 2012 60.8 60.8 61.5 2014 64.9 61.3 57.3 2015 62.4 61.9 59.8 2016 59.4 60.7 60.9 2017 64.8 63.5 59.0
Trout 83D.1 (4,114 ft.) 7
1997 76.0 73.2 72.3 2005 76.3 71.7 70.2 2006 75.9 66.3 70.4 2008 71.8 69.7 70.4 2012 66.3 65.6 62.2 2014 72.7 66.4 64.1 2015 67.9 64.2 64.6 2016 64.9 67.0 62.9 2017 71.8 66.4 62.9
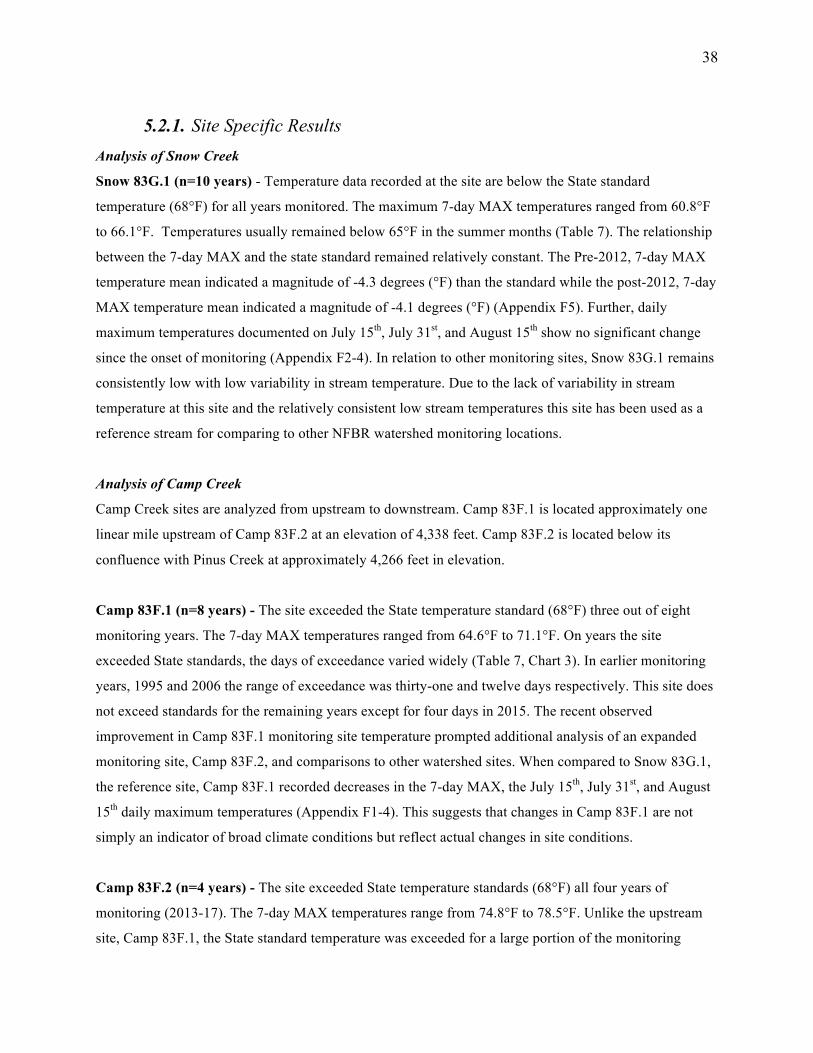
38
5.2.1.!Site Specific Results Analysis of Snow Creek
Snow 83G.1 (n=10 years) - Temperature data recorded at the site are below the State standard
temperature (68°F) for all years monitored. The maximum 7-day MAX temperatures ranged from 60.8°F
to 66.1°F. Temperatures usually remained below 65°F in the summer months (Table 7). The relationship
between the 7-day MAX and the state standard remained relatively constant. The Pre-2012, 7-day MAX
temperature mean indicated a magnitude of -4.3 degrees (°F) than the standard while the post-2012, 7-day
MAX temperature mean indicated a magnitude of -4.1 degrees (°F) (Appendix F5). Further, daily
maximum temperatures documented on July 15th, July 31st, and August 15th show no significant change
since the onset of monitoring (Appendix F2-4). In relation to other monitoring sites, Snow 83G.1 remains
consistently low with low variability in stream temperature. Due to the lack of variability in stream
temperature at this site and the relatively consistent low stream temperatures this site has been used as a
reference stream for comparing to other NFBR watershed monitoring locations.
Analysis of Camp Creek
Camp Creek sites are analyzed from upstream to downstream. Camp 83F.1 is located approximately one
linear mile upstream of Camp 83F.2 at an elevation of 4,338 feet. Camp 83F.2 is located below its
confluence with Pinus Creek at approximately 4,266 feet in elevation.
Camp 83F.1 (n=8 years) - The site exceeded the State temperature standard (68°F) three out of eight
monitoring years. The 7-day MAX temperatures ranged from 64.6°F to 71.1°F. On years the site
exceeded State standards, the days of exceedance varied widely (Table 7, Chart 3). In earlier monitoring
years, 1995 and 2006 the range of exceedance was thirty-one and twelve days respectively. This site does
not exceed standards for the remaining years except for four days in 2015. The recent observed
improvement in Camp 83F.1 monitoring site temperature prompted additional analysis of an expanded
monitoring site, Camp 83F.2, and comparisons to other watershed sites. When compared to Snow 83G.1,
the reference site, Camp 83F.1 recorded decreases in the 7-day MAX, the July 15th, July 31st, and August
15th daily maximum temperatures (Appendix F1-4). This suggests that changes in Camp 83F.1 are not
simply an indicator of broad climate conditions but reflect actual changes in site conditions.
Camp 83F.2 (n=4 years) - The site exceeded State temperature standards (68°F) all four years of
monitoring (2013-17). The 7-day MAX temperatures range from 74.8°F to 78.5°F. Unlike the upstream
site, Camp 83F.1, the State standard temperature was exceeded for a large portion of the monitoring
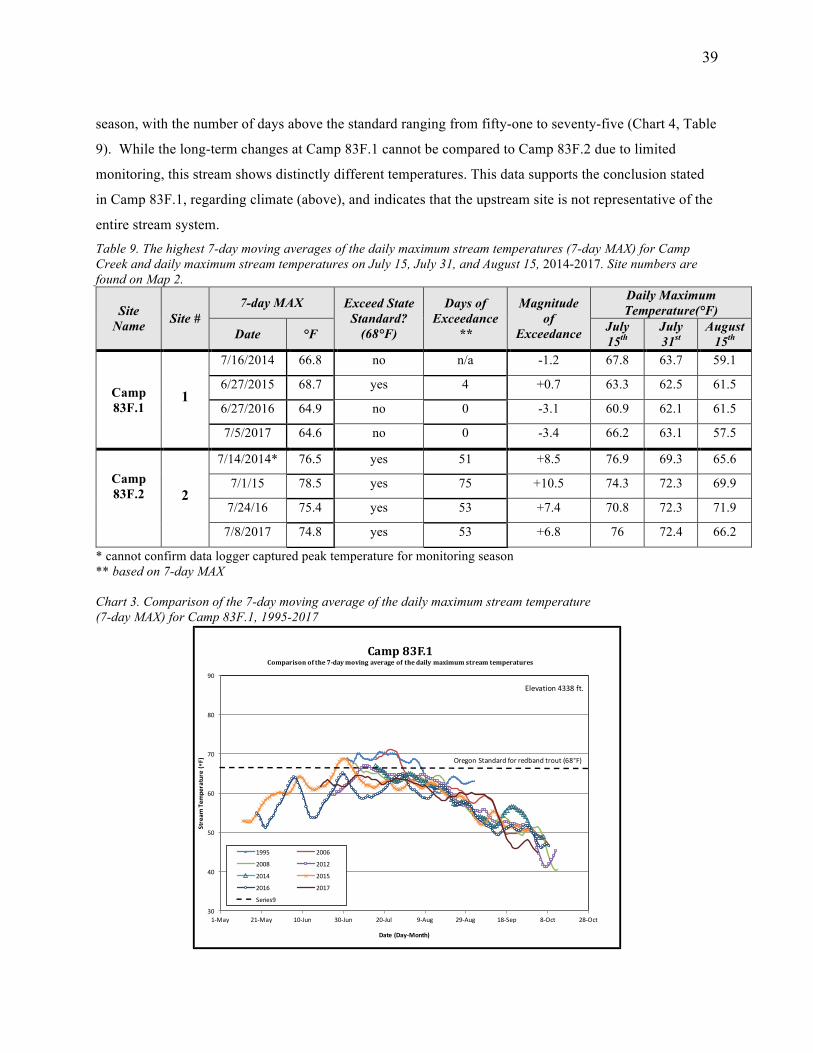
39
season, with the number of days above the standard ranging from fifty-one to seventy-five (Chart 4, Table
9). While the long-term changes at Camp 83F.1 cannot be compared to Camp 83F.2 due to limited
monitoring, this stream shows distinctly different temperatures. This data supports the conclusion stated
in Camp 83F.1, regarding climate (above), and indicates that the upstream site is not representative of the
entire stream system.
Table 9. The highest 7-day moving averages of the daily maximum stream temperatures (7-day MAX) for Camp Creek and daily maximum stream temperatures on July 15, July 31, and August 15, 2014-2017. Site numbers are found on Map 2.
Site Name Site #
7-day MAX Exceed State Standard?
(68°F)
Days of Exceedance
**
Magnitude of
Exceedance
Daily Maximum Temperature(°F)
Date °F July 15th
July 31st
August 15th
Camp 83F.1
1
7/16/2014 66.8 no n/a -1.2 67.8 63.7 59.1
6/27/2015 68.7 yes 4 +0.7 63.3 62.5 61.5
6/27/2016 64.9 no 0 -3.1 60.9 62.1 61.5
7/5/2017 64.6 no 0 -3.4 66.2 63.1 57.5
Camp 83F.2
2
7/14/2014* 76.5 yes 51 +8.5 76.9 69.3 65.6
7/1/15 78.5 yes 75 +10.5 74.3 72.3 69.9
7/24/16 75.4 yes 53 +7.4 70.8 72.3 71.9
7/8/2017 74.8 yes 53 +6.8 76 72.4 66.2
* cannot confirm data logger captured peak temperature for monitoring season ** based on 7-day MAX Chart 3. Comparison of the 7-day moving average of the daily maximum stream temperature (7-day MAX) for Camp 83F.1, 1995-2017
30
40
50
60
70
80
90
1*May 21*May 10*Jun 30*Jun 20*Jul 9*Aug 29*Aug 18*Sep 8*Oct 28*Oct
Stream
'Tem
perature'(�
F)
Date'(Day0Month)
Camp%83F.1%Comparison%of%the%75day%moving%average%of%the%daily%maximum%stream%temperatures%
1995 2006
2008 2012
2014 2015
2016 2017
Series9
ElevationA4338 ft.
OregonAStandardAforAredbandAtrout (68°F)
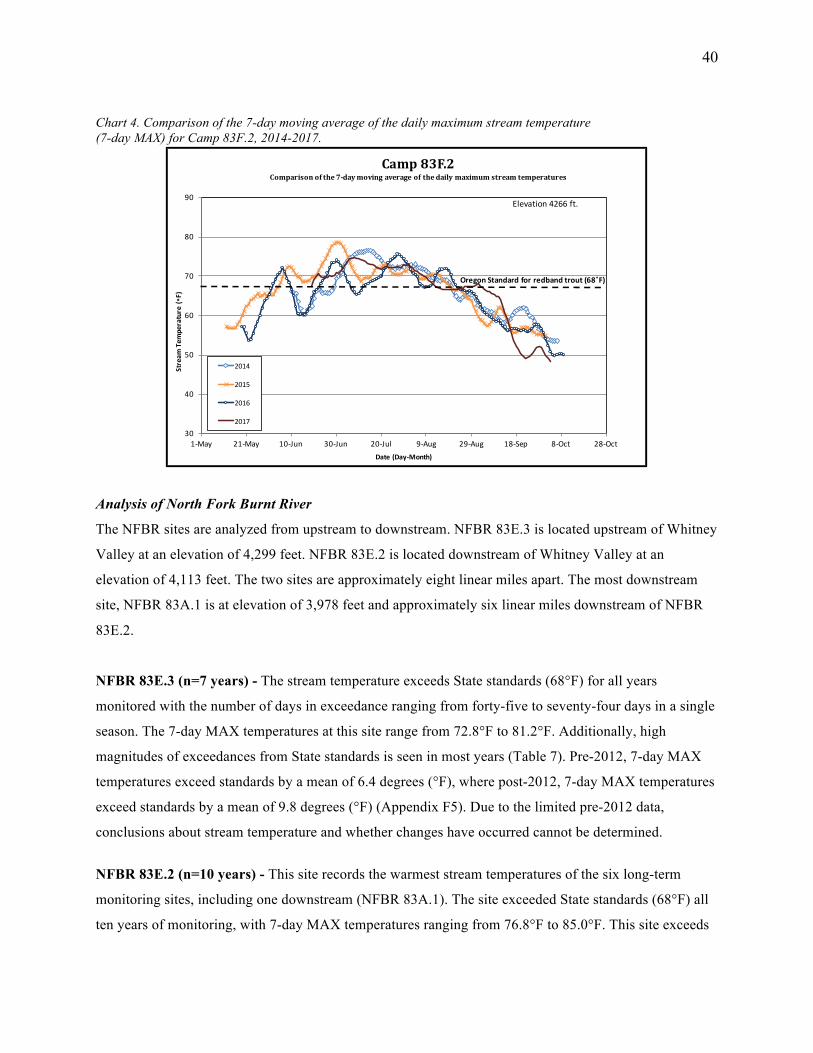
40
Chart 4. Comparison of the 7-day moving average of the daily maximum stream temperature (7-day MAX) for Camp 83F.2, 2014-2017.
Analysis of North Fork Burnt River
The NFBR sites are analyzed from upstream to downstream. NFBR 83E.3 is located upstream of Whitney
Valley at an elevation of 4,299 feet. NFBR 83E.2 is located downstream of Whitney Valley at an
elevation of 4,113 feet. The two sites are approximately eight linear miles apart. The most downstream
site, NFBR 83A.1 is at elevation of 3,978 feet and approximately six linear miles downstream of NFBR
83E.2.
NFBR 83E.3 (n=7 years) - The stream temperature exceeds State standards (68°F) for all years
monitored with the number of days in exceedance ranging from forty-five to seventy-four days in a single
season. The 7-day MAX temperatures at this site range from 72.8°F to 81.2°F. Additionally, high
magnitudes of exceedances from State standards is seen in most years (Table 7). Pre-2012, 7-day MAX
temperatures exceed standards by a mean of 6.4 degrees (°F), where post-2012, 7-day MAX temperatures
exceed standards by a mean of 9.8 degrees (°F) (Appendix F5). Due to the limited pre-2012 data,
conclusions about stream temperature and whether changes have occurred cannot be determined.
NFBR 83E.2 (n=10 years) - This site records the warmest stream temperatures of the six long-term
monitoring sites, including one downstream (NFBR 83A.1). The site exceeded State standards (68°F) all
ten years of monitoring, with 7-day MAX temperatures ranging from 76.8°F to 85.0°F. This site exceeds
30
40
50
60
70
80
90
1*May 21*May 10*Jun 30*Jun 20*Jul 9*Aug 29*Aug 18*Sep 8*Oct 28*Oct
Stream
'Tem
perature'(�
F)
Date'(Day0Month)
Camp%83F.2Comparison%of%the%75day%moving%average%of%the%daily%maximum%stream%temperatures
2014
2015
2016
2017
Elevation?4266 ft.
Oregon'Standard'for'redband trout'(68˚F)'
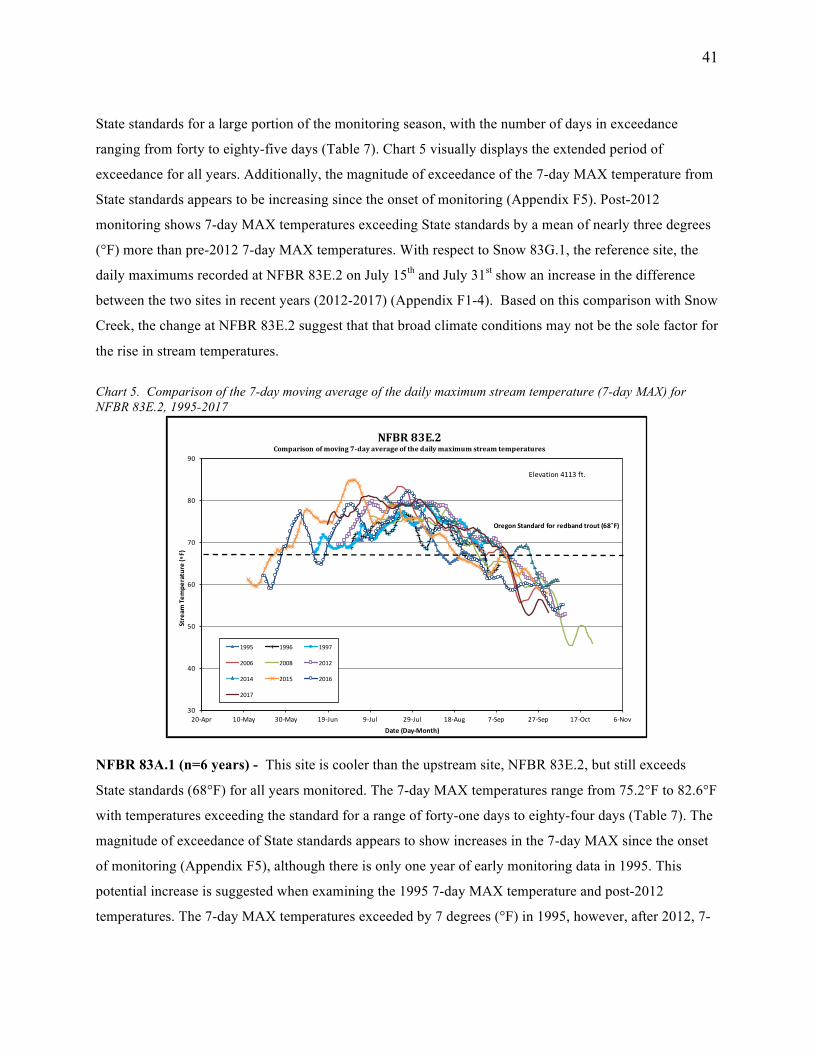
41
State standards for a large portion of the monitoring season, with the number of days in exceedance
ranging from forty to eighty-five days (Table 7). Chart 5 visually displays the extended period of
exceedance for all years. Additionally, the magnitude of exceedance of the 7-day MAX temperature from
State standards appears to be increasing since the onset of monitoring (Appendix F5). Post-2012
monitoring shows 7-day MAX temperatures exceeding State standards by a mean of nearly three degrees
(°F) more than pre-2012 7-day MAX temperatures. With respect to Snow 83G.1, the reference site, the
daily maximums recorded at NFBR 83E.2 on July 15th and July 31st show an increase in the difference
between the two sites in recent years (2012-2017) (Appendix F1-4). Based on this comparison with Snow
Creek, the change at NFBR 83E.2 suggest that that broad climate conditions may not be the sole factor for
the rise in stream temperatures.
Chart 5. Comparison of the 7-day moving average of the daily maximum stream temperature (7-day MAX) for NFBR 83E.2, 1995-2017
NFBR 83A.1 (n=6 years) - This site is cooler than the upstream site, NFBR 83E.2, but still exceeds
State standards (68°F) for all years monitored. The 7-day MAX temperatures range from 75.2°F to 82.6°F
with temperatures exceeding the standard for a range of forty-one days to eighty-four days (Table 7). The
magnitude of exceedance of State standards appears to show increases in the 7-day MAX since the onset
of monitoring (Appendix F5), although there is only one year of early monitoring data in 1995. This
potential increase is suggested when examining the 1995 7-day MAX temperature and post-2012
temperatures. The 7-day MAX temperatures exceeded by 7 degrees (°F) in 1995, however, after 2012, 7-
30
40
50
60
70
80
90
20*Apr 10*May 30*May 19*Jun 9*Jul 29*Jul 18*Aug 7*Sep 27*Sep 17*Oct 6*Nov
Stream
'Tempe
rature'(�F)
Date'(Day0Month)
NFBR%83E.2Comparison%of%moving%78day%average%of%the%daily%maximum%stream%temperatures%
1995 1996 1997
2006 2008 2012
2014 2015 2016
2017
ElevationA4113 ft.
Oregon'Standard'for'redband trout'(68˚F)'
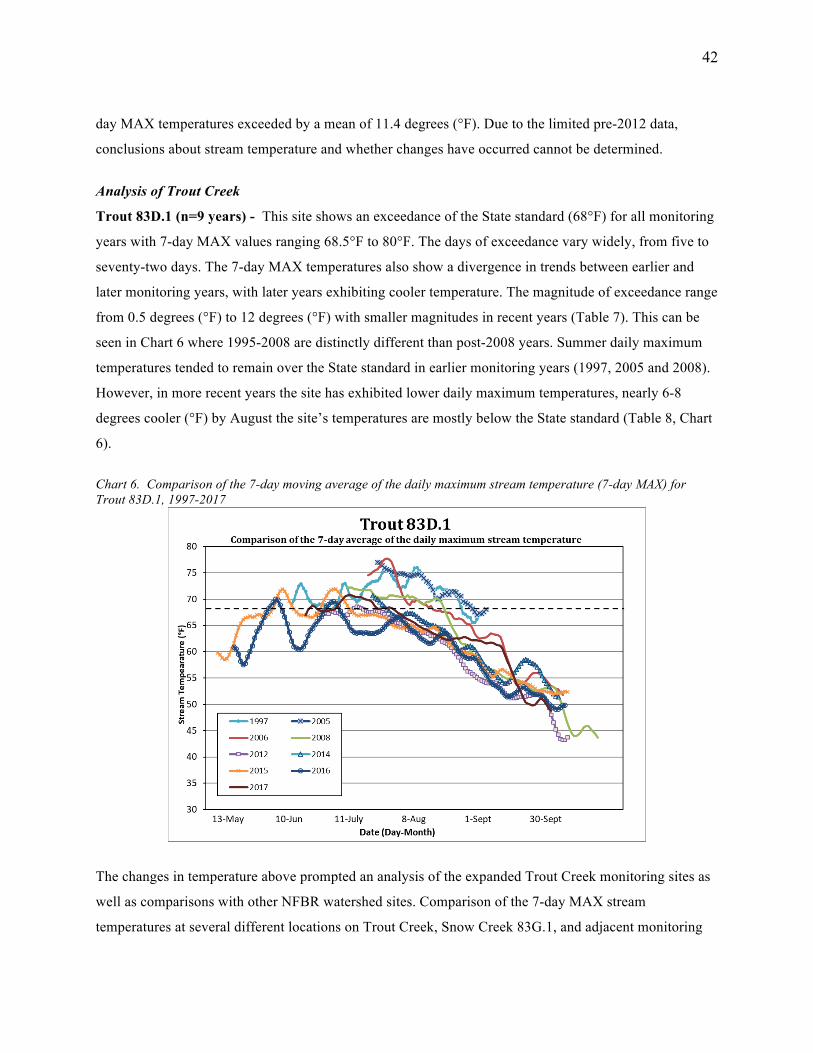
42
day MAX temperatures exceeded by a mean of 11.4 degrees (°F). Due to the limited pre-2012 data,
conclusions about stream temperature and whether changes have occurred cannot be determined.
Analysis of Trout Creek
Trout 83D.1 (n=9 years) - This site shows an exceedance of the State standard (68°F) for all monitoring
years with 7-day MAX values ranging 68.5°F to 80°F. The days of exceedance vary widely, from five to
seventy-two days. The 7-day MAX temperatures also show a divergence in trends between earlier and
later monitoring years, with later years exhibiting cooler temperature. The magnitude of exceedance range
from 0.5 degrees (°F) to 12 degrees (°F) with smaller magnitudes in recent years (Table 7). This can be
seen in Chart 6 where 1995-2008 are distinctly different than post-2008 years. Summer daily maximum
temperatures tended to remain over the State standard in earlier monitoring years (1997, 2005 and 2008).
However, in more recent years the site has exhibited lower daily maximum temperatures, nearly 6-8
degrees cooler (°F) by August the site’s temperatures are mostly below the State standard (Table 8, Chart
6).
Chart 6. Comparison of the 7-day moving average of the daily maximum stream temperature (7-day MAX) for Trout 83D.1, 1997-2017
The changes in temperature above prompted an analysis of the expanded Trout Creek monitoring sites as
well as comparisons with other NFBR watershed sites. Comparison of the 7-day MAX stream
temperatures at several different locations on Trout Creek, Snow Creek 83G.1, and adjacent monitoring
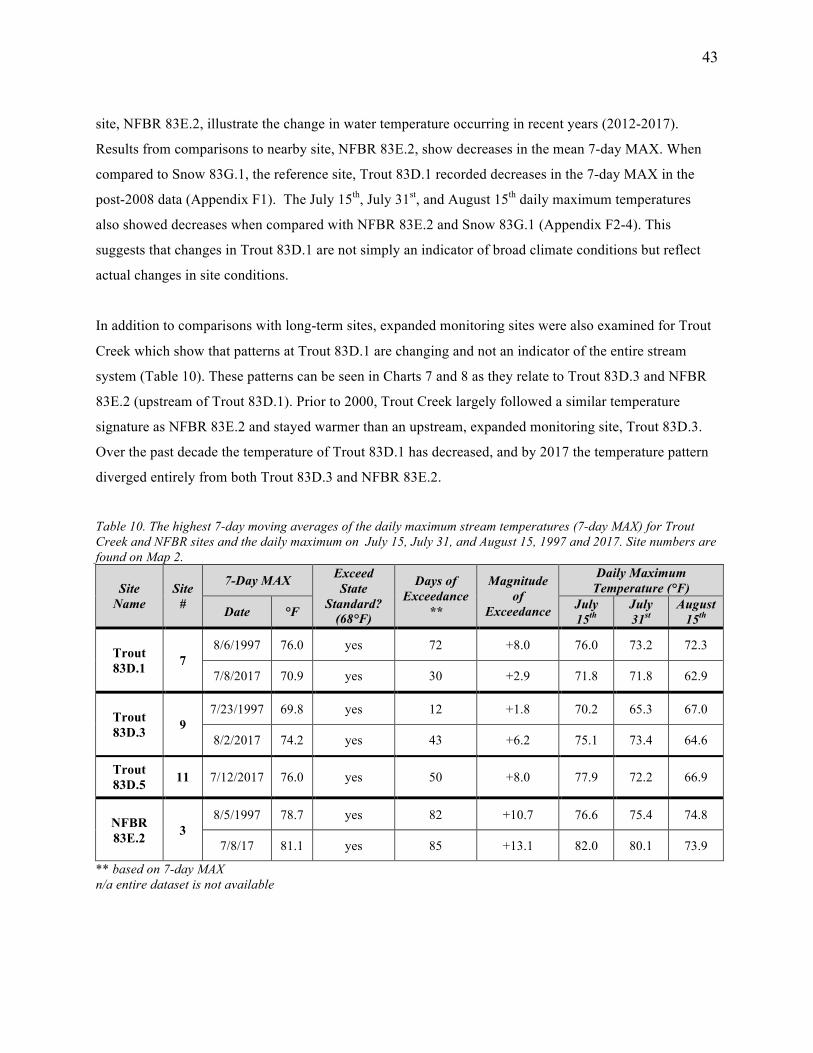
43
site, NFBR 83E.2, illustrate the change in water temperature occurring in recent years (2012-2017).
Results from comparisons to nearby site, NFBR 83E.2, show decreases in the mean 7-day MAX. When
compared to Snow 83G.1, the reference site, Trout 83D.1 recorded decreases in the 7-day MAX in the
post-2008 data (Appendix F1). The July 15th, July 31st, and August 15th daily maximum temperatures
also showed decreases when compared with NFBR 83E.2 and Snow 83G.1 (Appendix F2-4). This
suggests that changes in Trout 83D.1 are not simply an indicator of broad climate conditions but reflect
actual changes in site conditions.
In addition to comparisons with long-term sites, expanded monitoring sites were also examined for Trout
Creek which show that patterns at Trout 83D.1 are changing and not an indicator of the entire stream
system (Table 10). These patterns can be seen in Charts 7 and 8 as they relate to Trout 83D.3 and NFBR
83E.2 (upstream of Trout 83D.1). Prior to 2000, Trout Creek largely followed a similar temperature
signature as NFBR 83E.2 and stayed warmer than an upstream, expanded monitoring site, Trout 83D.3.
Over the past decade the temperature of Trout 83D.1 has decreased, and by 2017 the temperature pattern
diverged entirely from both Trout 83D.3 and NFBR 83E.2.
Table 10. The highest 7-day moving averages of the daily maximum stream temperatures (7-day MAX) for Trout Creek and NFBR sites and the daily maximum on July 15, July 31, and August 15, 1997 and 2017. Site numbers are found on Map 2.
Site Name
Site #
7-Day MAX Exceed State
Standard? (68°F)
Days of Exceedance
**
Magnitude of
Exceedance
Daily Maximum Temperature (°F)
Date °F July 15th
July 31st
August 15th
Trout 83D.1 7
8/6/1997 76.0 yes 72 +8.0 76.0 73.2 72.3
7/8/2017 70.9 yes 30 +2.9 71.8 71.8 62.9
Trout 83D.3 9
7/23/1997 69.8 yes 12 +1.8 70.2 65.3 67.0
8/2/2017 74.2 yes 43 +6.2 75.1 73.4 64.6
Trout 83D.5 11 7/12/2017 76.0 yes 50 +8.0 77.9 72.2 66.9
NFBR 83E.2 3
8/5/1997 78.7 yes 82 +10.7 76.6 75.4 74.8
7/8/17 81.1 yes 85 +13.1 82.0 80.1 73.9
** based on 7-day MAX n/a entire dataset is not available
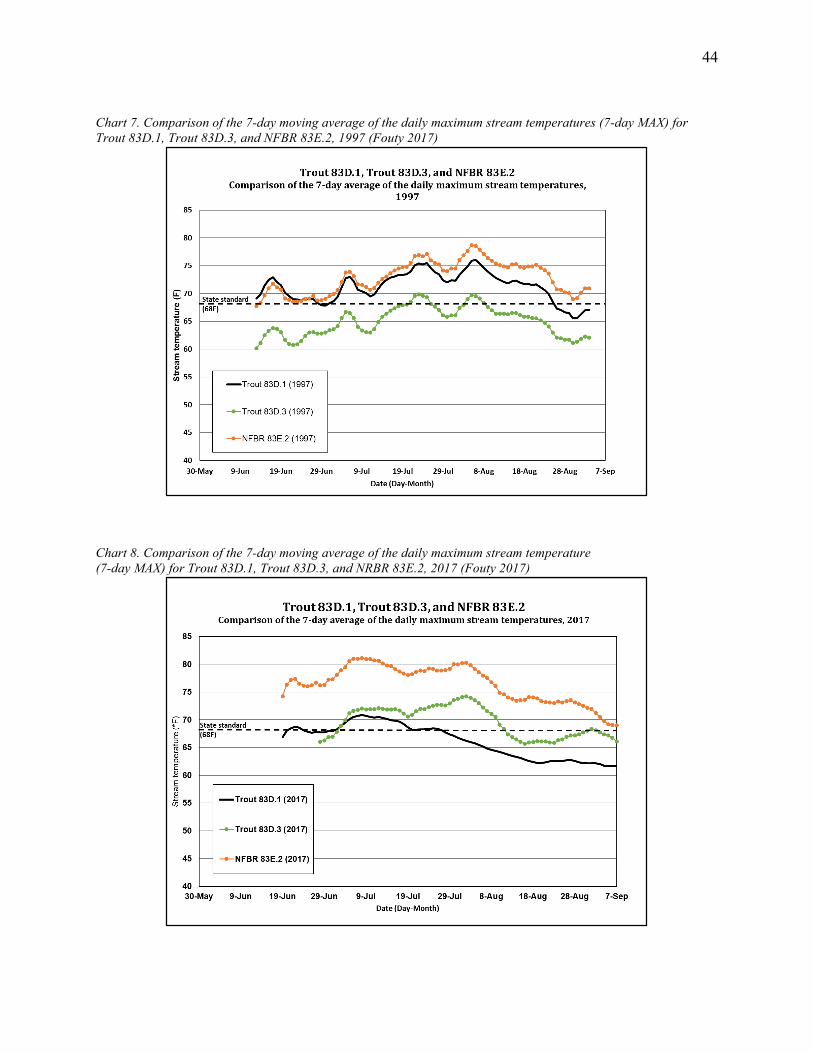
44
Chart 7. Comparison of the 7-day moving average of the daily maximum stream temperatures (7-day MAX) for Trout 83D.1, Trout 83D.3, and NFBR 83E.2, 1997 (Fouty 2017)
Chart 8. Comparison of the 7-day moving average of the daily maximum stream temperature (7-day MAX) for Trout 83D.1, Trout 83D.3, and NRBR 83E.2, 2017 (Fouty 2017)
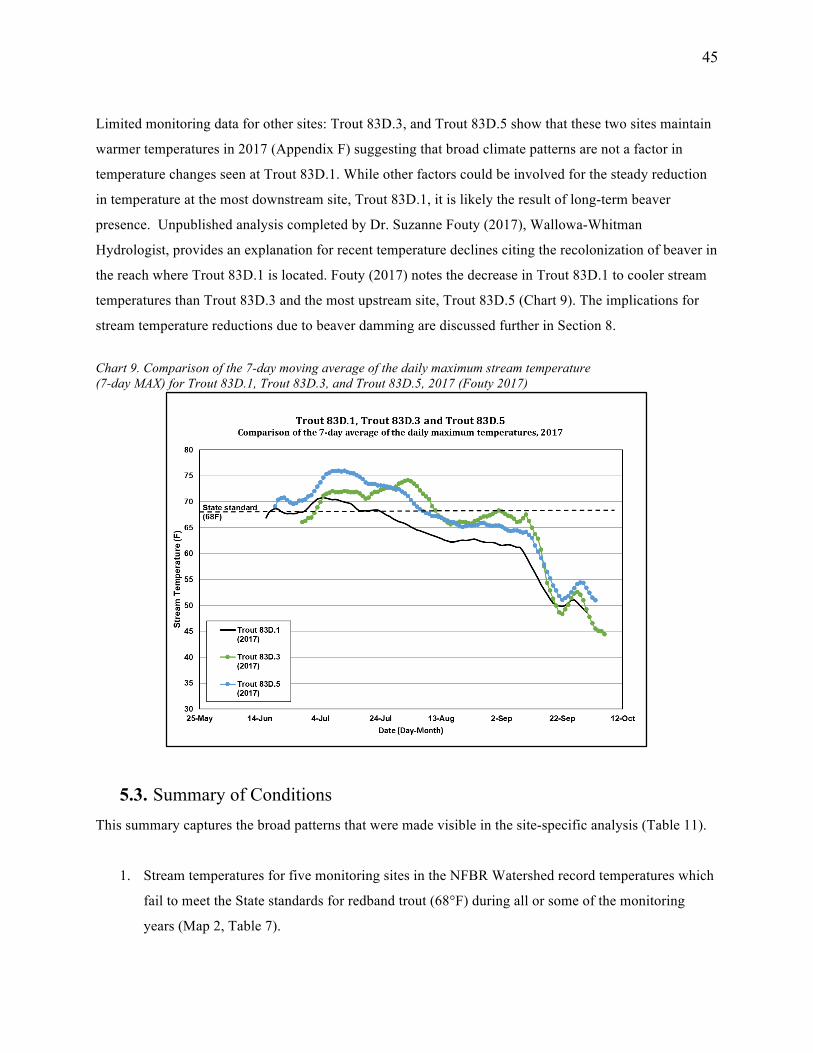
45
Limited monitoring data for other sites: Trout 83D.3, and Trout 83D.5 show that these two sites maintain
warmer temperatures in 2017 (Appendix F) suggesting that broad climate patterns are not a factor in
temperature changes seen at Trout 83D.1. While other factors could be involved for the steady reduction
in temperature at the most downstream site, Trout 83D.1, it is likely the result of long-term beaver
presence. Unpublished analysis completed by Dr. Suzanne Fouty (2017), Wallowa-Whitman
Hydrologist, provides an explanation for recent temperature declines citing the recolonization of beaver in
the reach where Trout 83D.1 is located. Fouty (2017) notes the decrease in Trout 83D.1 to cooler stream
temperatures than Trout 83D.3 and the most upstream site, Trout 83D.5 (Chart 9). The implications for
stream temperature reductions due to beaver damming are discussed further in Section 8.
Chart 9. Comparison of the 7-day moving average of the daily maximum stream temperature (7-day MAX) for Trout 83D.1, Trout 83D.3, and Trout 83D.5, 2017 (Fouty 2017)
5.3.! Summary of Conditions This summary captures the broad patterns that were made visible in the site-specific analysis (Table 11).
1.! Stream temperatures for five monitoring sites in the NFBR Watershed record temperatures which
fail to meet the State standards for redband trout (68°F) during all or some of the monitoring
years (Map 2, Table 7).
46
2.! Temperatures tend to exceed State standards mostly in July and August, except for a few
instances when exceedance occurred as early as June (Table 8).
3.! Stream temperatures at Snow Creek remained unchanged throughout the monitoring years and
continues to be a high-quality water temperature site. For the purposes of this study, Snow Creek
83G.1 has been applied as a constant point of reference for examining changes in other NFBR
watershed streams.
4.! Patterns emerged in the analysis of Camp 83F.1 showing a decrease in temperatures in relation to
comparable sites in the NFBR watershed. This decrease prompted further analysis of expanded
monitoring sites and local changes in land and water management. Results showed that the
decreases seen at Camp 83F.1 were not indicative of the entire stream system but appear to reflect
some local change.
5.! Stream temperature conditions at all three NFBR sites continually do not meet State standards
(Table 7). The sites exceed standards for all monitoring years approximately forty to eighty-five
days in a single season. The magnitude of exceedance tends to be high, ranging from 4.8°F to
17.9°F above the standard. There is some indication that the amount of exceedance days and
magnitude may be increasing in the most recent years (2012-2017), however, this may be
attributed to increases in summer air temperatures.
6.! Patterns emerged in the analysis of Trout 83D.1 when compared to a site in proximity, NFBR
83E.2, promoting further examination of expanded monitoring sites and local changes in land and
water management. Results from expanded monitoring analysis showed that the decreases seen at
Trout 83D.1 were not inductive of the entire stream system, but appear to reflect some local
change.
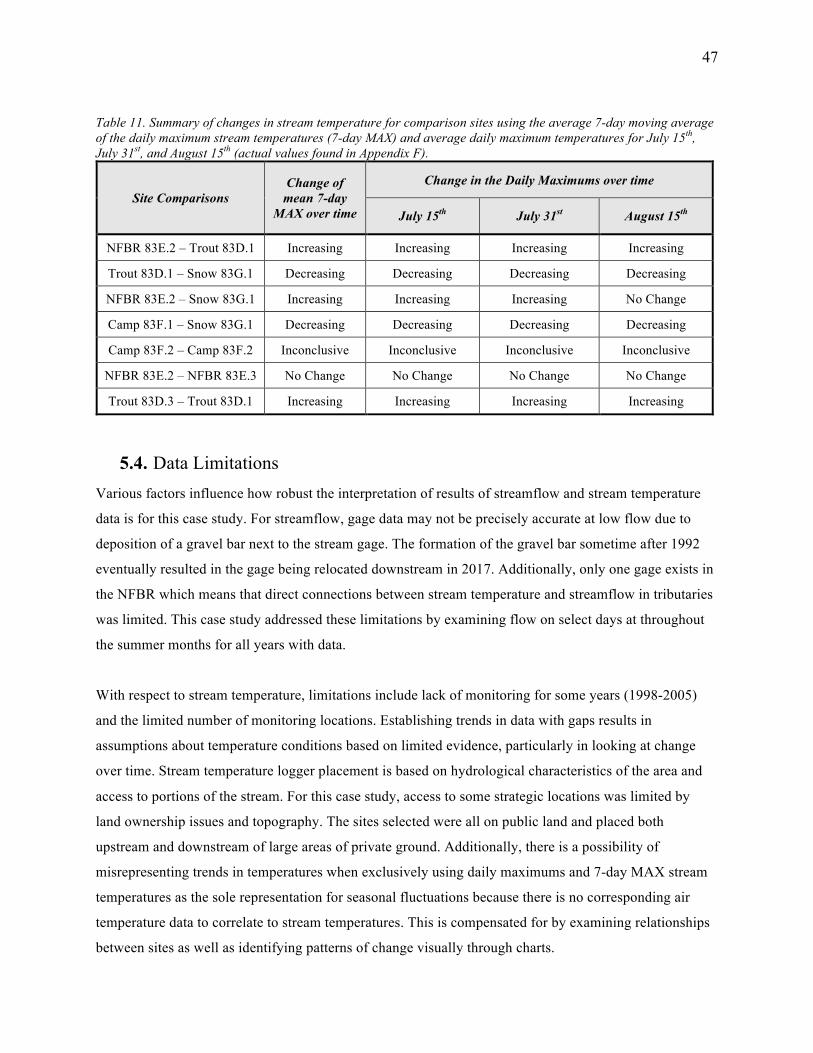
47
Table 11. Summary of changes in stream temperature for comparison sites using the average 7-day moving average of the daily maximum stream temperatures (7-day MAX) and average daily maximum temperatures for July 15th, July 31st, and August 15th (actual values found in Appendix F).
Site Comparisons Change of
mean 7-day MAX over time
Change in the Daily Maximums over time
July 15th July 31st August 15th
NFBR 83E.2 – Trout 83D.1 Increasing Increasing Increasing Increasing
Trout 83D.1 – Snow 83G.1 Decreasing Decreasing Decreasing Decreasing
NFBR 83E.2 – Snow 83G.1 Increasing Increasing Increasing No Change
Camp 83F.1 – Snow 83G.1 Decreasing Decreasing Decreasing Decreasing
Camp 83F.2 – Camp 83F.2 Inconclusive Inconclusive Inconclusive Inconclusive
NFBR 83E.2 – NFBR 83E.3 No Change No Change No Change No Change
Trout 83D.3 – Trout 83D.1 Increasing Increasing Increasing Increasing
5.4.! Data Limitations Various factors influence how robust the interpretation of results of streamflow and stream temperature
data is for this case study. For streamflow, gage data may not be precisely accurate at low flow due to
deposition of a gravel bar next to the stream gage. The formation of the gravel bar sometime after 1992
eventually resulted in the gage being relocated downstream in 2017. Additionally, only one gage exists in
the NFBR which means that direct connections between stream temperature and streamflow in tributaries
was limited. This case study addressed these limitations by examining flow on select days at throughout
the summer months for all years with data.
With respect to stream temperature, limitations include lack of monitoring for some years (1998-2005)
and the limited number of monitoring locations. Establishing trends in data with gaps results in
assumptions about temperature conditions based on limited evidence, particularly in looking at change
over time. Stream temperature logger placement is based on hydrological characteristics of the area and
access to portions of the stream. For this case study, access to some strategic locations was limited by
land ownership issues and topography. The sites selected were all on public land and placed both
upstream and downstream of large areas of private ground. Additionally, there is a possibility of
misrepresenting trends in temperatures when exclusively using daily maximums and 7-day MAX stream
temperatures as the sole representation for seasonal fluctuations because there is no corresponding air
temperature data to correlate to stream temperatures. This is compensated for by examining relationships
between sites as well as identifying patterns of change visually through charts.
48
Other limitations that exist beyond the data when interpreting stream temperature and streamflow
information and are difficult to quantify include: changes in land and water use and management on
private land, or increases and decreases in groundwater inputs. Broad climate patterns and drought
severity info provide an overall understanding of watersheds conditions, but direct correlations between
air temperatures and stream temperatures could not be made.
49
6.! Hypotheses Findings The following results address the hypotheses made in this study:
H1 Implementation of the WWFMP (1990) improved streamflow in NFBR watershed. !!
Based on streamflow-related desktop reviews and data analysis; several findings emerged, rejecting H1.
The results demonstrated a lack of increase in baseflow, and no indication of streamflow improving from
short duration, high peak hydrographs to longer duration, lower magnitude peaks during the monitoring
time span of twenty-six years (1992-2017). The lack of change over twenty-six years was longer than the
anticipated time frame for improvement in conditions. Therefore, improvements to streamflow in the
NFBR as a result of WWFMP (1990) are not evident.
H2. Implementation of the WWFMP (1990) improved or maintained stream temperature,
with respect to 7-day moving averages of the daily maximum stream temperatures, in the
North Fork Burnt River Watershed.! Stream temperature study results rejected H2 for the following long-term sites: NFBR 83E.3, NFBR
83E.2, and NFBR 83A.1. Stream temperature data from these sites showed all of the following trends: a.! The 7-day MAX stream temperatures maintained above State standards for redband trout (68°F).
b.! Increases occurred in magnitude of temperature exceedances from the State standards, since onset
of monitoring.
c.! Increases occurred in the number of days of exceedances from the State standards, since the onset
of monitoring.
Stream temperature data analysis results for Snow 83G.1 accepted H2 for this long-term monitoring site,
displaying the following trends:
a.! Stream temperatures consistently met State standards.
b.! There has been no evidence of changes that suggest a change in the relationship to the State
standard or any evidence of improvement since the onset of monitoring.
!
Stream temperature data analysis results for Camp 83F.1 accepted H2 and required expanded monitoring
to determine representativeness of stream temperature conditions in the sample location. The following
trends allowed for the acceptance of H2 based on the long-term site:
50
a.! In recent years (2008-2017), there have been decreases in the magnitude of temperature
exceedance from State standards.
b.! In recent years (2008-2017), when stream temperatures exceed standards, there have been
decreases in the days of exceedance of State standards.
c.! In recent years (2008-2017), stream temperatures have improved and most years fall
below State standards.
!
Stream temperature data analysis results for Trout 83D.1 accepted H2 for this long-term site, and required
expanded monitoring to determine representativeness of stream temperature conditions for the stream.
The following trends allowed for the acceptance of H2:
a.! In recent years (2008-2017), there have been decreases in the magnitude of temperature
exceedance amount from State standards.
b.! In recent years (2008-2017), there have been decreases in the days of exceedance of State
standards.
c.! In recent years (2008-2017), stream temperatures have improved but remain above State
standards.
While long-term data shows improvements for Trout 83D.1 and Camp 83F.1, expanded monitoring on
these two creeks indicated that portions of these streams still exceed State standards and by a considerable
amount. Due to the lack of overall improvements in stream temperature, continued failure to meet State
standards for the mainstem NFBR, and high stream temperatures recorded at the expanded monitoring
sites it can be concluded that the WWFMP (1990) did not achieve its expectations.
H3. Additional efforts are not needed for the North Fork Burnt River Watershed, the
current efforts suffice.! Results from streamflow data and the long-term and expanded stream temperature monitoring sites
resulted in rejection of H3, as the data showed that streams would benefit from additional efforts for
improvement. Strategies for future improvement will be discussed in Section 8.
51
7.! Discussion Interpretation of streamflow and stream temperature data in the North Fork Burnt River Watershed sought
to answer the primary research question: have management plans, laws, and regulations effectively been
implemented as they were intended to improve water quality and water resources in the case study area?
It can be concluded from examination of the twenty-six years of streamflow data and intermittent stream
temperature data, that the WWFMP (1990) has not met the intent of the framework, as set forth by federal
and state laws and regulations, which is to improve water quality and water resources. Recalling previous
expectations stated in the WWFMP (1990, 4.22), the intended goal was to maintain or improve water
quality, streamflows, riparian areas, wildlife habitat, and fish habitat within a decade. The WWFMP
(1990) also required that all management activities to be conducted in a way that maintained and
improved water quality in streamside management units (RHCA streams).
Though the WWFMP (1990) suggested a decade for improvements in riparian and fish habitat conditions,
monitoring data collected for a period twice as long yields different results. While the plan sought to
prioritize watershed resources, the result of management efforts may be less impactful than expected for
the NFBR. Baseflow conditions during the summer months show little change in value in the NFBR.
While climate may be a factor in timing of peaks and snow pack conditions, the variability in climate is a
given for both Eastern Oregon and, across the United States; and should be considered more intently in
watershed planning.
Results from NFBR summer/fall base streamflow data has shown that even under optimal climate
conditions (no drought severity designations, ample snow pack) baseflow conditions are still less than one
percent of peak flow events (Table 5). By reviewing hydrographs from 1992 to 2017, a sense of potential
streamflow volume through the NFBR system becomes clear. The median peak streamflow occurs at
approximately 511cfs, meaning that roughly half of all peak flow events will register higher than this. If
stream channel conditions were optimal, storing water instream and in the valley floor and floodplain
sediments could buffer seasonal variability so that baseflows are no longer less than one percent of the
yearly peak.
Stream temperatures at the six long-term monitoring sites in the NFBR watershed have shown mid-
summer daily maximum highs beyond state designated limits year after year for most sites (Tables 7 and
8). High summer stream temperatures are the result of many factors. They are influenced by limited
streamflow, limited groundwater inputs, warm air temperatures, and management activities, like mining,
52
grazing, and timber harvest. These activities can reduce stream-side, shade providing vegetation and
indirectly cause channels to widen.
While most stream temperature data have revealed a lack of improvement in conditions in the past two
decades, there has been a few notable exceptions. Camp 83F.1 has recorded significant improvements to
stream temperatures when compared to Snow 83G.1, the reference site (Table 9, Appendix F1-4).
However, the roughly one linear mile, downstream site, Camp 83F.2 shows distinct differences in stream
temperature. Camp 83F.2 data consists of monitoring years 2014 to 2017, so comparison to earlier years
is not possible. A potential impact on stream temperature at the Camp 83F.1 site may have been the result
of an upstream livestock allotment becoming vacant in 2006. The Camp Creek allotment includes a
roughly four mile stretch of Camp Creek upstream of the Camp 83F.1 site. Other factors for cooling can
include a change in ground water inputs or beaver dams, however both factors are unlikely as neither have
been documented in the area.
The changes at Camp 83F.1 show promising strategies for reducing stream temperature, however other
areas in the NFBR still are facing high stream temperature conditions. Although there have been efforts to
reduce ungulate grazing in riparian areas through fencing and allowing allotments to remain vacant,
livestock continue to put pressure on riparian zones in Whitney Valley (private land) and just downstream
of the Valley the NFBR records highest temperatures of any other monitored site. In recent decades,
regulations have been put in place to protect riparian areas from logging and mining on public land
however more needs to be done to minimize impacts caused by nonpoint source pollution such as
livestock grazing.
The Trout 83D.1 data collected just upstream of its confluence with the NFBR and below a section of
private land show considerable decrease in stream temperature in recent years (Charts 6 through 9). After
comparisons to expanded monitoring sites, and to NFBR 83E.2, the reductions in temperature can be
concluded to be a result of localized factors. Factors for the temperature change include the influence of
beaver recolonization in the lower section of this creek in the area of Trout 83D.1 and possibly a
modification in irrigation regimes on the upstream private land though this cannot be documented (Fouty
2017). Importantly, the change represents a potential solution for stream temperature in other NFBR
watershed streams.
53
The ODEQ’s is charged with identifying water bodies needing protection and implementing water quality
standards. Several streams have been identified in the NFBR for stream temperature pollution and listed
in the 303(d) as Category 5 streams (water quality impaired). Given that most of the case study area is
within the WWNF administration (approximately ninety-one percent), the primary responsibility of the
WWNF is to create management plans and best management practices that identify actions for improving
streamflow and stream temperatures in the NFBR watershed.
In part, the WWFMP (1990) was created to address management of watersheds in the WWNF, including
streamflow and stream temperatures. A major goal listed in the WWFMP (1990) for the health of
watersheds was “To maintain or enhance the unique and valuable characteristics of riparian areas and to
maintain or improve water quality, streamflows, wildlife habitat, and fish habitat.” The streamflow data
indicates that this goal indeed was not met in the NFBR watershed. Further, in accordance with the major
legislation under which the WWNF operates, many laws require that fundamental water flow and water
quality must be protected and prioritized. For example, the Organic Act (1897) plainly states the objective
of forest reservations was for “securing a permanent supply of timber for the people and insuring
conditions favorable to continuous water flow” (§2). Similarly, the NFMA (1976) requires that planning
must recognize and provide protection, “and where appropriate, improve the quality of soil, water, and air
resources” [16 U.S.C. §1602]. While the WWFMP (1990) may have recognized the need for protection of
watershed resources, and clearly stated its priority alongside soil over other resources, the management
plan as enacted did not effectively protect or improve streamflow or overall stream temperatures. Lack of
monitoring also points to a fundamental issue when trying to determine the success of the WWFMP in
protecting watershed resources or improving water quality in the past and into the future. As previously
indicated, there were large gaps in temperature data, suggesting a lack of priority for water quality
conditions, whether intended or implied by the WWFMP.
Lastly, additional restoration strategies and efforts have emerged as viable options for improving the
NFBR watershed stream temperatures and streamflow. These options can be used in conjunction with
management plans, laws, and regulations, and will be detailed in the following section.
54
8.! Restoration Strategies for Improving Streamflow and Stream
Temperatures Fire, drought, warmer air temperatures, increased atmospheric carbon, large decreases in snow pack,
earlier snowmelt, flooding, reduced summer streamflows, and increases in invasive species are becoming
more commonplace in a highly variable climate (Beschta et al. 2012, 1-3). Research has suggested that
there are many solutions for addressing warming stream temperature and decreased streamflow
conditions, for example, by increasing shade on streams with riparian enhancement projects, restructuring
straightened stream channels to add meanders, expanding floodplains habitats, and allowing beaver to
recolonize areas with appropriate habitat conditions. Each type of restoration strategy has its challenges;
however, they offer many ecological benefits that can address important water quality issues and create
high functioning, sustainable, and adaptable ecosystems.
8.1.! Sustainability in Resource Management Clean and continuous water supplies are integral to maintaining high-functioning ecosystems and
sustaining wildlife, fish, and human populations. Sustainable natural resource management, that is,
management of water, soil, air, plants, minerals, aquatic life, and animals is the practice of decision-
making utilizing a framework of objectives. These objectives embody the following definition established
in the Brundtland Report: “development that meets the needs of the present without compromising future
generation’s abilities to meet their own needs” (WCED 1987). The exact meaning of natural resource
sustainability is somewhat varied across the globe, unique to different value systems and cultures;
however, the generally accepted definition is both broad and comprehensive, falling within a triangle of
values: economic, societal/cultural, and environmental. Some scholars (Carrol 2004; Dunlap 2006) would
say a fourth realm of sustainability exists, transforming the sustainability triangle to a tetrahedron:
spiritual sustainability. Even further, many would reject the geometric distance between corners of a
triangle, noting the nonexistence of spatial distinctness between sustainable parameters, rather placing the
components of sustainability with a nested model, where each is part of the others - holistic and connected
based on ideas of persons, place, and permanence (Seghezzo 2009).
Given the many varied definitions of sustainable management, resource managers generally agree on
several objectives as they relate to sustainability: (1) “A healthy environment allows us to benefit from
the many ‘ecosystem services’ provided by the natural world, now and into the future” (Simon-Brown
2011, 20). This concept involves the understanding that ecosystem services are valuable and worth
55
conserving, and to do so managers must recognize their functioning in a larger ecosystem. In this sense,
each component of the ecosystem need be managed for both individual value and intrinsic value. Soil,
water, minerals, vegetation and wildlife each have value unto themselves, and different value as they
function together. Under this type of sustainability, biodiversity and ecological resilience become core
objectives. (2) Another tenant of sustainable resource management that finds its way into many scholarly
works is the idea that sustainability must include reductions of both inputs and outputs. Pauly et al. (2002,
6) highlights this concept as it relates to global fisheries, citing the heavy over depletion of fish stocks and
vast environmental degradation of marine environments. A rigorous evaluation of modern aquaculture
practices has many scientists concerned with the ability for oceans to continue providing at rates expected
largely attributed to overwhelming consumption and increased demand. While many would argue that
humans are simply passive consumers, resource managers understand that an overhaul in values,
education, beliefs, and policies is necessary for sustainable resources. Recognizing the cyclical nature and
scale of resource issues is key to creating restorative environmental policies that will prevent further
devastation and provide resources well into the future.
Different definitions of sustainable management are important in that they broaden the scope of how
policy makers choose to incorporate concepts into subjective resource issues and across diverse cultures.
For this study, sustainability embodies managing natural resources in a way that provides equitable use,
environmental integrity, ecosystem functioning, and resilience. Managing resources in this manner will
preserve important ecosystem services, enhance biodiversity, and increase economic and environmental
sustainability for all. Further, all recommended restoration strategies and efforts should incorporate
principles of sustainable management in addition to supporting current management plans, laws, and
regulations. Restoration strategies and efforts that embody these tenants of sustainability are discussed
below.
8.2.! Riparian Enhancement, Channel Reconstruction, and Floodplain
Connectivity Projects which encompass riparian enhancement, channel reconstruction, and floodplain connectivity
have been shown to reduce stream temperatures, improve streamflow, and restore stream functioning and
have an overall effect on the resiliency of streams to increased climate warming. These strategies and
efforts, if applied appropriately, have great potential to sustainably restore streams in the NFBR
Watershed.
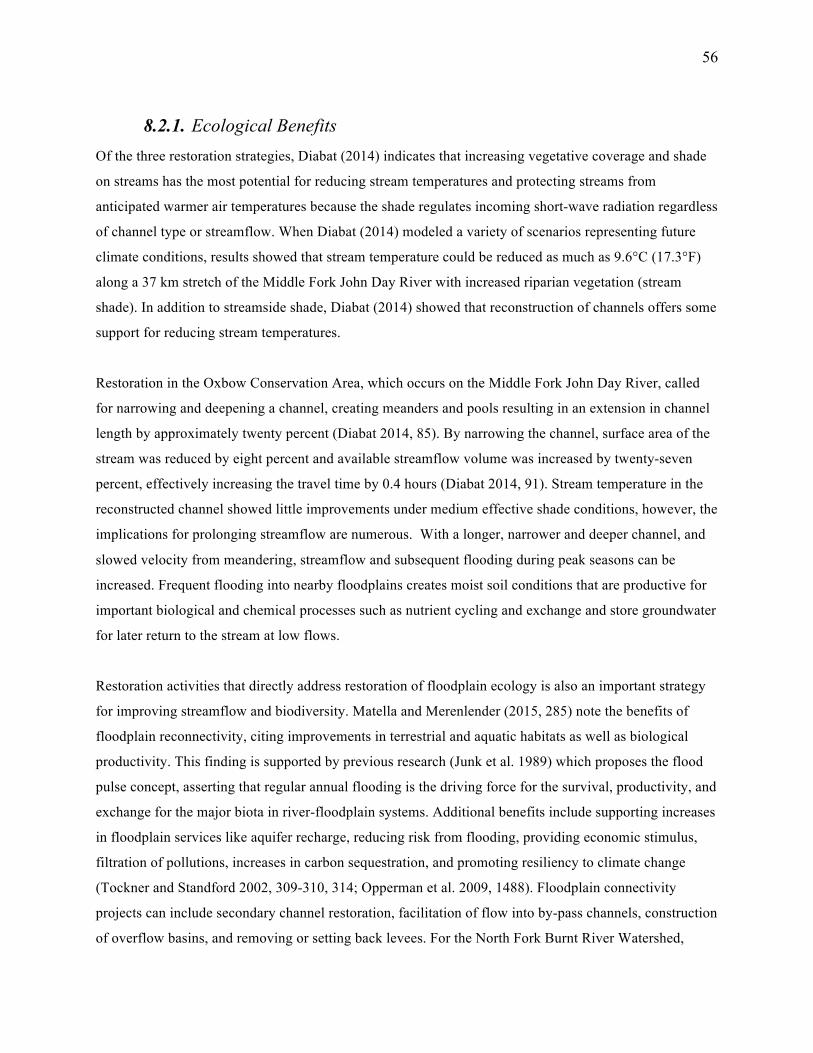
56
8.2.1.!Ecological Benefits Of the three restoration strategies, Diabat (2014) indicates that increasing vegetative coverage and shade
on streams has the most potential for reducing stream temperatures and protecting streams from
anticipated warmer air temperatures because the shade regulates incoming short-wave radiation regardless
of channel type or streamflow. When Diabat (2014) modeled a variety of scenarios representing future
climate conditions, results showed that stream temperature could be reduced as much as 9.6°C (17.3°F)
along a 37 km stretch of the Middle Fork John Day River with increased riparian vegetation (stream
shade). In addition to streamside shade, Diabat (2014) showed that reconstruction of channels offers some
support for reducing stream temperatures.
Restoration in the Oxbow Conservation Area, which occurs on the Middle Fork John Day River, called
for narrowing and deepening a channel, creating meanders and pools resulting in an extension in channel
length by approximately twenty percent (Diabat 2014, 85). By narrowing the channel, surface area of the
stream was reduced by eight percent and available streamflow volume was increased by twenty-seven
percent, effectively increasing the travel time by 0.4 hours (Diabat 2014, 91). Stream temperature in the
reconstructed channel showed little improvements under medium effective shade conditions, however, the
implications for prolonging streamflow are numerous. With a longer, narrower and deeper channel, and
slowed velocity from meandering, streamflow and subsequent flooding during peak seasons can be
increased. Frequent flooding into nearby floodplains creates moist soil conditions that are productive for
important biological and chemical processes such as nutrient cycling and exchange and store groundwater
for later return to the stream at low flows.
Restoration activities that directly address restoration of floodplain ecology is also an important strategy
for improving streamflow and biodiversity. Matella and Merenlender (2015, 285) note the benefits of
floodplain reconnectivity, citing improvements in terrestrial and aquatic habitats as well as biological
productivity. This finding is supported by previous research (Junk et al. 1989) which proposes the flood
pulse concept, asserting that regular annual flooding is the driving force for the survival, productivity, and
exchange for the major biota in river-floodplain systems. Additional benefits include supporting increases
in floodplain services like aquifer recharge, reducing risk from flooding, providing economic stimulus,
filtration of pollutions, increases in carbon sequestration, and promoting resiliency to climate change
(Tockner and Standford 2002, 309-310, 314; Opperman et al. 2009, 1488). Floodplain connectivity
projects can include secondary channel restoration, facilitation of flow into by-pass channels, construction
of overflow basins, and removing or setting back levees. For the North Fork Burnt River Watershed,
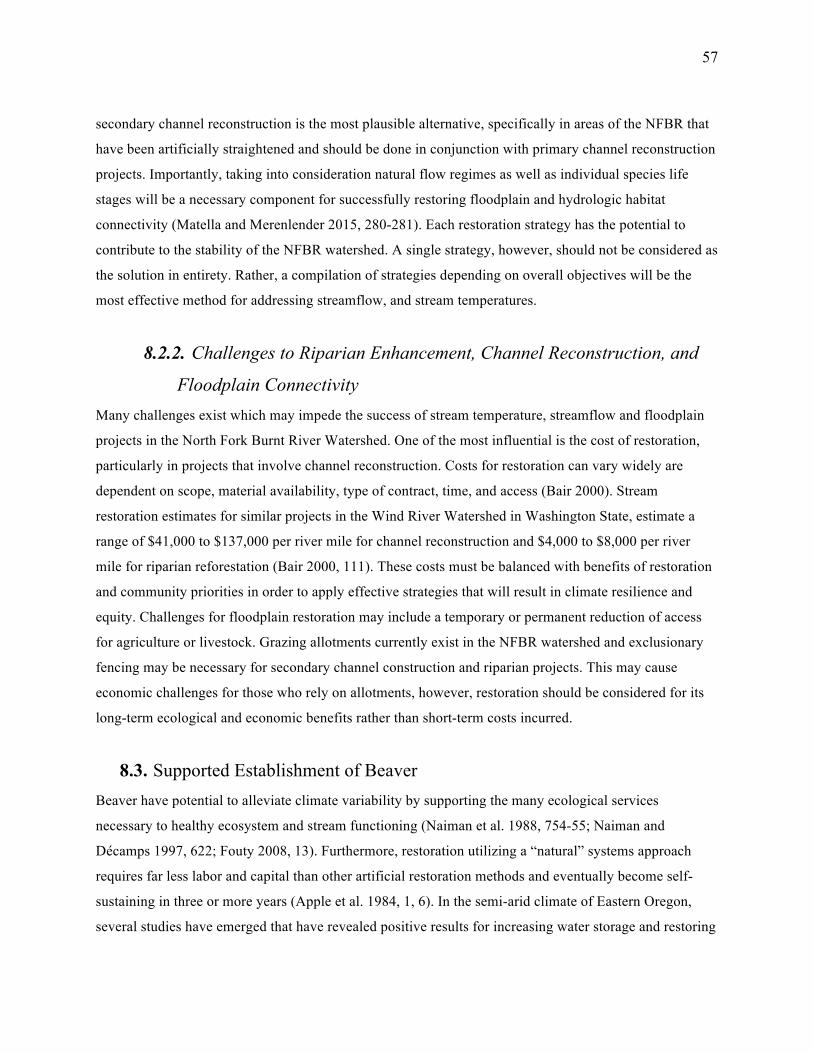
57
secondary channel reconstruction is the most plausible alternative, specifically in areas of the NFBR that
have been artificially straightened and should be done in conjunction with primary channel reconstruction
projects. Importantly, taking into consideration natural flow regimes as well as individual species life
stages will be a necessary component for successfully restoring floodplain and hydrologic habitat
connectivity (Matella and Merenlender 2015, 280-281). Each restoration strategy has the potential to
contribute to the stability of the NFBR watershed. A single strategy, however, should not be considered as
the solution in entirety. Rather, a compilation of strategies depending on overall objectives will be the
most effective method for addressing streamflow, and stream temperatures.
8.2.2.!Challenges to Riparian Enhancement, Channel Reconstruction, and
Floodplain Connectivity Many challenges exist which may impede the success of stream temperature, streamflow and floodplain
projects in the North Fork Burnt River Watershed. One of the most influential is the cost of restoration,
particularly in projects that involve channel reconstruction. Costs for restoration can vary widely are
dependent on scope, material availability, type of contract, time, and access (Bair 2000). Stream
restoration estimates for similar projects in the Wind River Watershed in Washington State, estimate a
range of $41,000 to $137,000 per river mile for channel reconstruction and $4,000 to $8,000 per river
mile for riparian reforestation (Bair 2000, 111). These costs must be balanced with benefits of restoration
and community priorities in order to apply effective strategies that will result in climate resilience and
equity. Challenges for floodplain restoration may include a temporary or permanent reduction of access
for agriculture or livestock. Grazing allotments currently exist in the NFBR watershed and exclusionary
fencing may be necessary for secondary channel construction and riparian projects. This may cause
economic challenges for those who rely on allotments, however, restoration should be considered for its
long-term ecological and economic benefits rather than short-term costs incurred.
8.3.! Supported Establishment of Beaver Beaver have potential to alleviate climate variability by supporting the many ecological services
necessary to healthy ecosystem and stream functioning (Naiman et al. 1988, 754-55; Naiman and
Décamps 1997, 622; Fouty 2008, 13). Furthermore, restoration utilizing a “natural” systems approach
requires far less labor and capital than other artificial restoration methods and eventually become self-
sustaining in three or more years (Apple et al. 1984, 1, 6). In the semi-arid climate of Eastern Oregon,
several studies have emerged that have revealed positive results for increasing water storage and restoring
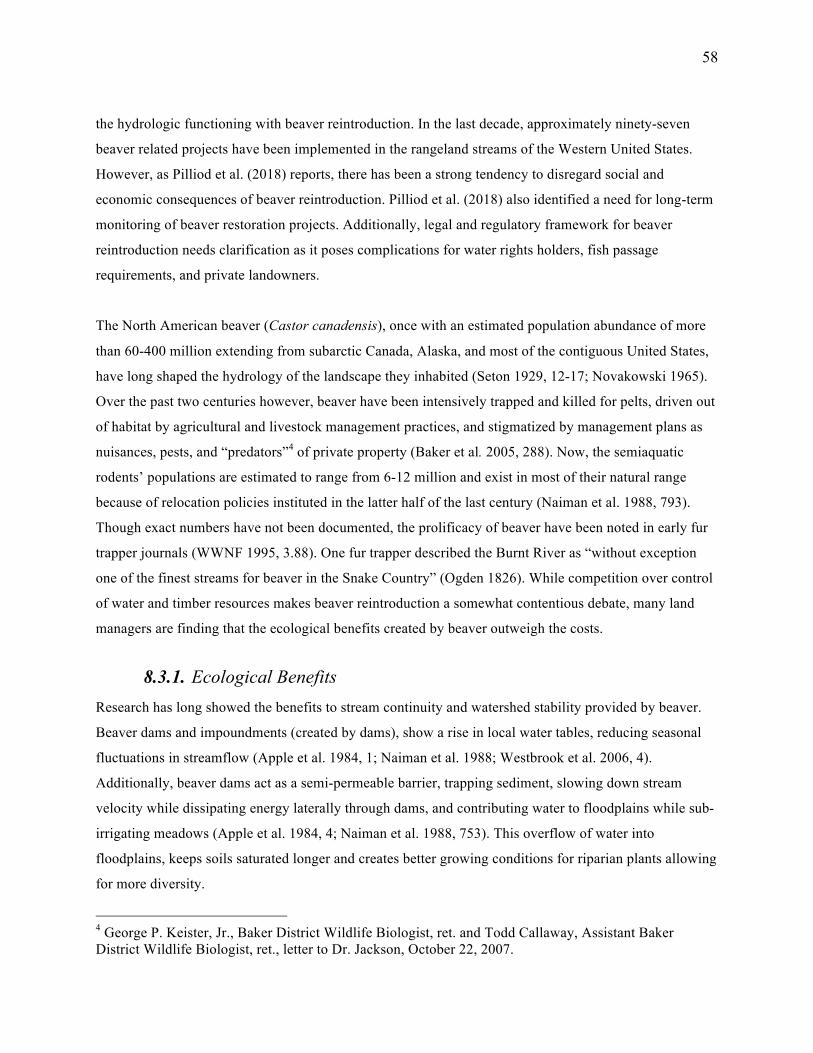
58
the hydrologic functioning with beaver reintroduction. In the last decade, approximately ninety-seven
beaver related projects have been implemented in the rangeland streams of the Western United States.
However, as Pilliod et al. (2018) reports, there has been a strong tendency to disregard social and
economic consequences of beaver reintroduction. Pilliod et al. (2018) also identified a need for long-term
monitoring of beaver restoration projects. Additionally, legal and regulatory framework for beaver
reintroduction needs clarification as it poses complications for water rights holders, fish passage
requirements, and private landowners.
The North American beaver (Castor canadensis), once with an estimated population abundance of more
than 60-400 million extending from subarctic Canada, Alaska, and most of the contiguous United States,
have long shaped the hydrology of the landscape they inhabited (Seton 1929, 12-17; Novakowski 1965).
Over the past two centuries however, beaver have been intensively trapped and killed for pelts, driven out
of habitat by agricultural and livestock management practices, and stigmatized by management plans as
nuisances, pests, and “predators”4 of private property (Baker et al. 2005, 288). Now, the semiaquatic
rodents’ populations are estimated to range from 6-12 million and exist in most of their natural range
because of relocation policies instituted in the latter half of the last century (Naiman et al. 1988, 793).
Though exact numbers have not been documented, the prolificacy of beaver have been noted in early fur
trapper journals (WWNF 1995, 3.88). One fur trapper described the Burnt River as “without exception
one of the finest streams for beaver in the Snake Country” (Ogden 1826). While competition over control
of water and timber resources makes beaver reintroduction a somewhat contentious debate, many land
managers are finding that the ecological benefits created by beaver outweigh the costs.
8.3.1.!Ecological Benefits
Research has long showed the benefits to stream continuity and watershed stability provided by beaver.
Beaver dams and impoundments (created by dams), show a rise in local water tables, reducing seasonal
fluctuations in streamflow (Apple et al. 1984, 1; Naiman et al. 1988; Westbrook et al. 2006, 4).
Additionally, beaver dams act as a semi-permeable barrier, trapping sediment, slowing down stream
velocity while dissipating energy laterally through dams, and contributing water to floodplains while sub-
irrigating meadows (Apple et al. 1984, 4; Naiman et al. 1988, 753). This overflow of water into
floodplains, keeps soils saturated longer and creates better growing conditions for riparian plants allowing
for more diversity.
4 George P. Keister, Jr., Baker District Wildlife Biologist, ret. and Todd Callaway, Assistant Baker District Wildlife Biologist, ret., letter to Dr. Jackson, October 22, 2007.
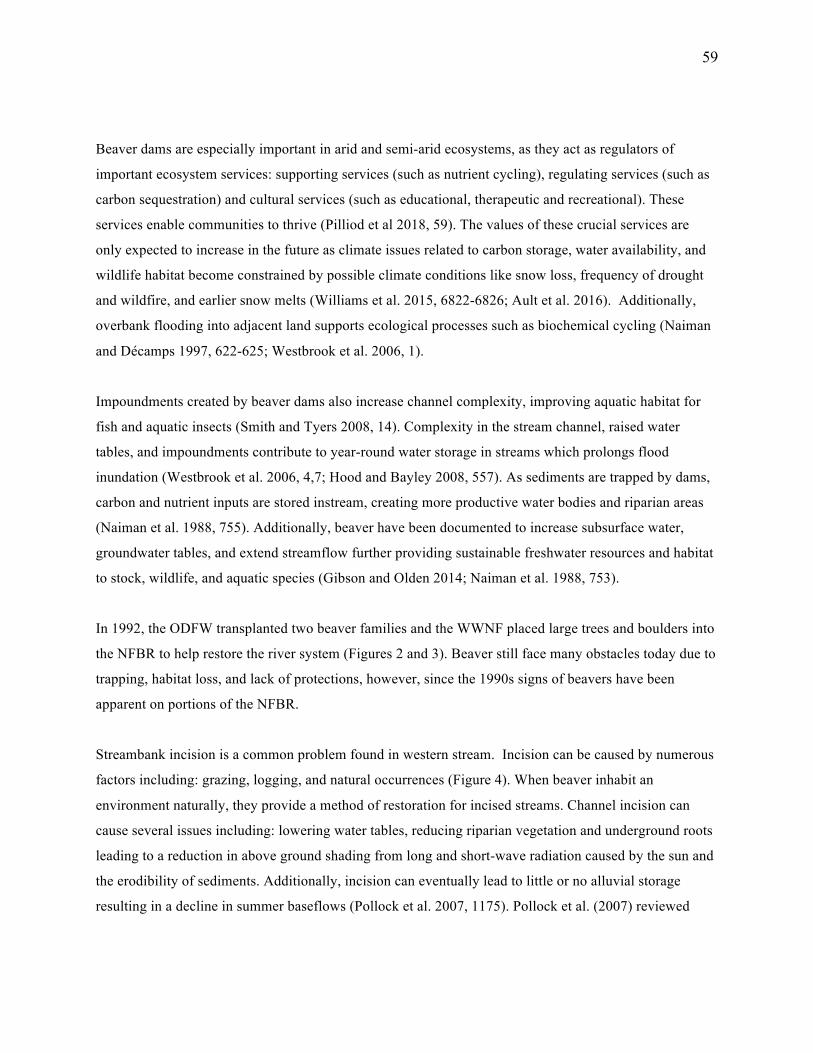
59
Beaver dams are especially important in arid and semi-arid ecosystems, as they act as regulators of
important ecosystem services: supporting services (such as nutrient cycling), regulating services (such as
carbon sequestration) and cultural services (such as educational, therapeutic and recreational). These
services enable communities to thrive (Pilliod et al 2018, 59). The values of these crucial services are
only expected to increase in the future as climate issues related to carbon storage, water availability, and
wildlife habitat become constrained by possible climate conditions like snow loss, frequency of drought
and wildfire, and earlier snow melts (Williams et al. 2015, 6822-6826; Ault et al. 2016). Additionally,
overbank flooding into adjacent land supports ecological processes such as biochemical cycling (Naiman
and Décamps 1997, 622-625; Westbrook et al. 2006, 1).
Impoundments created by beaver dams also increase channel complexity, improving aquatic habitat for
fish and aquatic insects (Smith and Tyers 2008, 14). Complexity in the stream channel, raised water
tables, and impoundments contribute to year-round water storage in streams which prolongs flood
inundation (Westbrook et al. 2006, 4,7; Hood and Bayley 2008, 557). As sediments are trapped by dams,
carbon and nutrient inputs are stored instream, creating more productive water bodies and riparian areas
(Naiman et al. 1988, 755). Additionally, beaver have been documented to increase subsurface water,
groundwater tables, and extend streamflow further providing sustainable freshwater resources and habitat
to stock, wildlife, and aquatic species (Gibson and Olden 2014; Naiman et al. 1988, 753).
In 1992, the ODFW transplanted two beaver families and the WWNF placed large trees and boulders into
the NFBR to help restore the river system (Figures 2 and 3). Beaver still face many obstacles today due to
trapping, habitat loss, and lack of protections, however, since the 1990s signs of beavers have been
apparent on portions of the NFBR.
Streambank incision is a common problem found in western stream. Incision can be caused by numerous
factors including: grazing, logging, and natural occurrences (Figure 4). When beaver inhabit an
environment naturally, they provide a method of restoration for incised streams. Channel incision can
cause several issues including: lowering water tables, reducing riparian vegetation and underground roots
leading to a reduction in above ground shading from long and short-wave radiation caused by the sun and
the erodibility of sediments. Additionally, incision can eventually lead to little or no alluvial storage
resulting in a decline in summer baseflows (Pollock et al. 2007, 1175). Pollock et al. (2007) reviewed
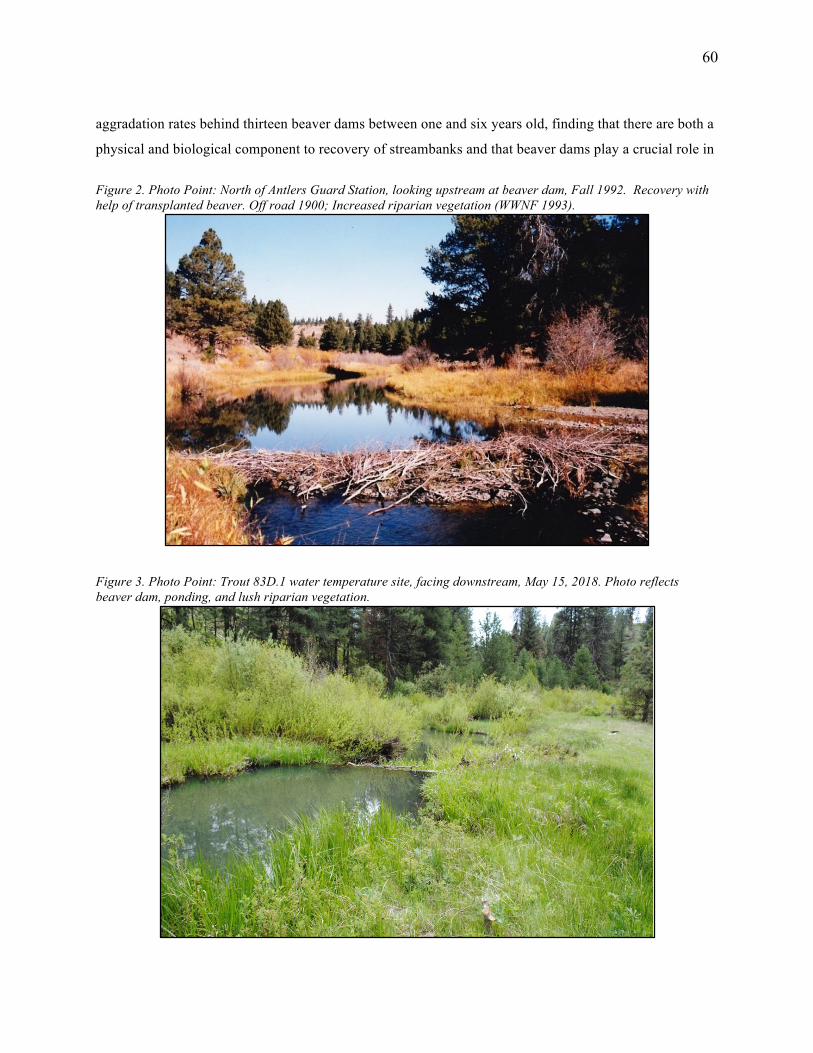
60
aggradation rates behind thirteen beaver dams between one and six years old, finding that there are both a
physical and biological component to recovery of streambanks and that beaver dams play a crucial role in
Figure 2. Photo Point: North of Antlers Guard Station, looking upstream at beaver dam, Fall 1992. Recovery with help of transplanted beaver. Off road 1900; Increased riparian vegetation (WWNF 1993).
Figure 3. Photo Point: Trout 83D.1 water temperature site, facing downstream, May 15, 2018. Photo reflects beaver dam, ponding, and lush riparian vegetation.
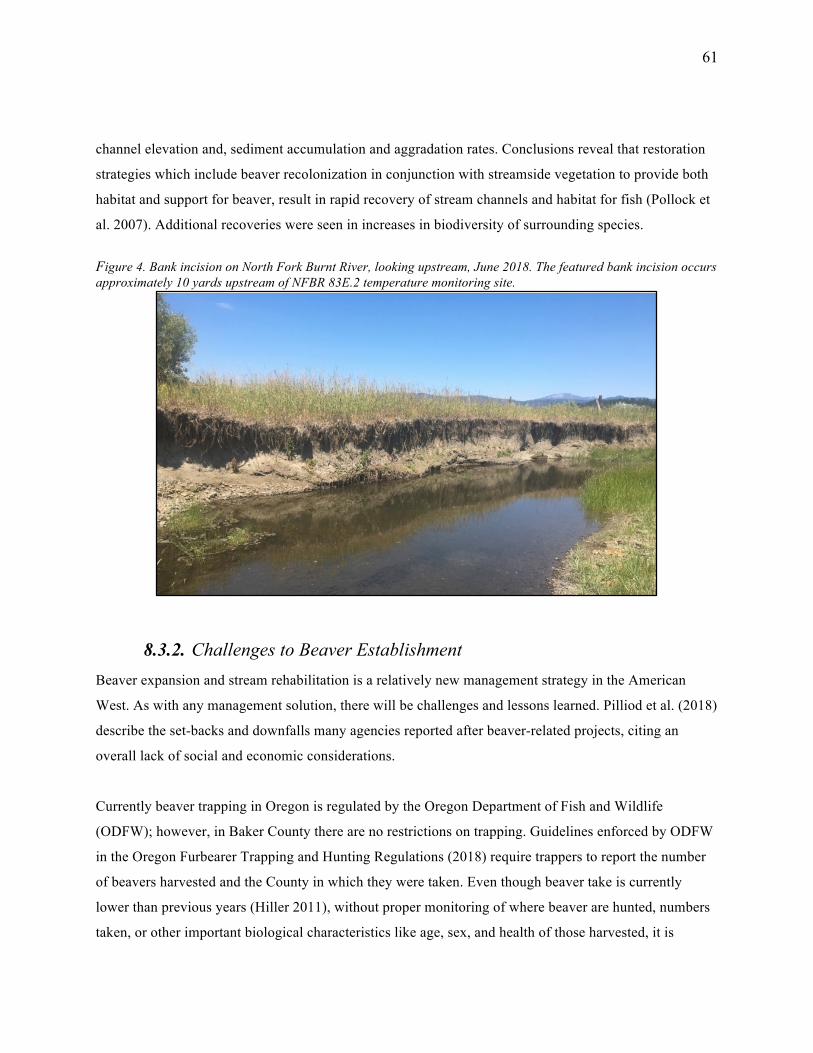
61
channel elevation and, sediment accumulation and aggradation rates. Conclusions reveal that restoration
strategies which include beaver recolonization in conjunction with streamside vegetation to provide both
habitat and support for beaver, result in rapid recovery of stream channels and habitat for fish (Pollock et
al. 2007). Additional recoveries were seen in increases in biodiversity of surrounding species.
Figure 4. Bank incision on North Fork Burnt River, looking upstream, June 2018. The featured bank incision occurs approximately 10 yards upstream of NFBR 83E.2 temperature monitoring site.
8.3.2.!Challenges to Beaver Establishment Beaver expansion and stream rehabilitation is a relatively new management strategy in the American
West. As with any management solution, there will be challenges and lessons learned. Pilliod et al. (2018)
describe the set-backs and downfalls many agencies reported after beaver-related projects, citing an
overall lack of social and economic considerations.
Currently beaver trapping in Oregon is regulated by the Oregon Department of Fish and Wildlife
(ODFW); however, in Baker County there are no restrictions on trapping. Guidelines enforced by ODFW
in the Oregon Furbearer Trapping and Hunting Regulations (2018) require trappers to report the number
of beavers harvested and the County in which they were taken. Even though beaver take is currently
lower than previous years (Hiller 2011), without proper monitoring of where beaver are hunted, numbers
taken, or other important biological characteristics like age, sex, and health of those harvested, it is
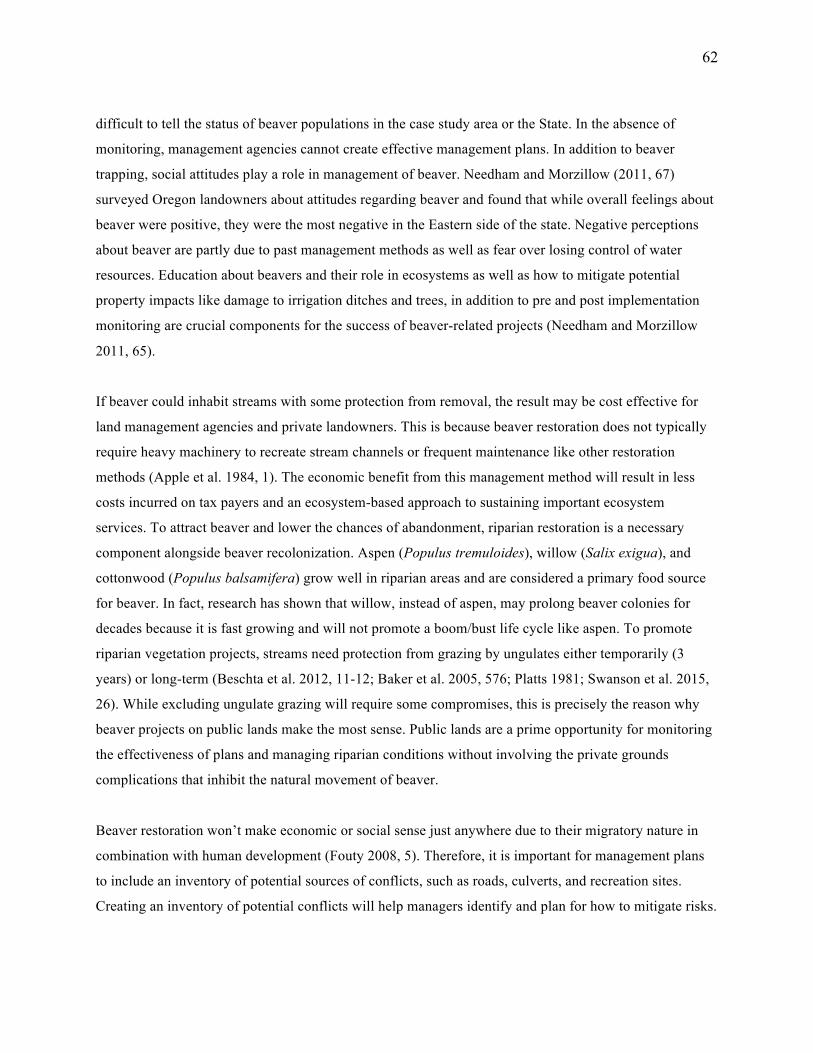
62
difficult to tell the status of beaver populations in the case study area or the State. In the absence of
monitoring, management agencies cannot create effective management plans. In addition to beaver
trapping, social attitudes play a role in management of beaver. Needham and Morzillow (2011, 67)
surveyed Oregon landowners about attitudes regarding beaver and found that while overall feelings about
beaver were positive, they were the most negative in the Eastern side of the state. Negative perceptions
about beaver are partly due to past management methods as well as fear over losing control of water
resources. Education about beavers and their role in ecosystems as well as how to mitigate potential
property impacts like damage to irrigation ditches and trees, in addition to pre and post implementation
monitoring are crucial components for the success of beaver-related projects (Needham and Morzillow
2011, 65).
If beaver could inhabit streams with some protection from removal, the result may be cost effective for
land management agencies and private landowners. This is because beaver restoration does not typically
require heavy machinery to recreate stream channels or frequent maintenance like other restoration
methods (Apple et al. 1984, 1). The economic benefit from this management method will result in less
costs incurred on tax payers and an ecosystem-based approach to sustaining important ecosystem
services. To attract beaver and lower the chances of abandonment, riparian restoration is a necessary
component alongside beaver recolonization. Aspen (Populus tremuloides), willow (Salix exigua), and
cottonwood (Populus balsamifera) grow well in riparian areas and are considered a primary food source
for beaver. In fact, research has shown that willow, instead of aspen, may prolong beaver colonies for
decades because it is fast growing and will not promote a boom/bust life cycle like aspen. To promote
riparian vegetation projects, streams need protection from grazing by ungulates either temporarily (3
years) or long-term (Beschta et al. 2012, 11-12; Baker et al. 2005, 576; Platts 1981; Swanson et al. 2015,
26). While excluding ungulate grazing will require some compromises, this is precisely the reason why
beaver projects on public lands make the most sense. Public lands are a prime opportunity for monitoring
the effectiveness of plans and managing riparian conditions without involving the private grounds
complications that inhibit the natural movement of beaver.
Beaver restoration won’t make economic or social sense just anywhere due to their migratory nature in
combination with human development (Fouty 2008, 5). Therefore, it is important for management plans
to include an inventory of potential sources of conflicts, such as roads, culverts, and recreation sites.
Creating an inventory of potential conflicts will help managers identify and plan for how to mitigate risks.
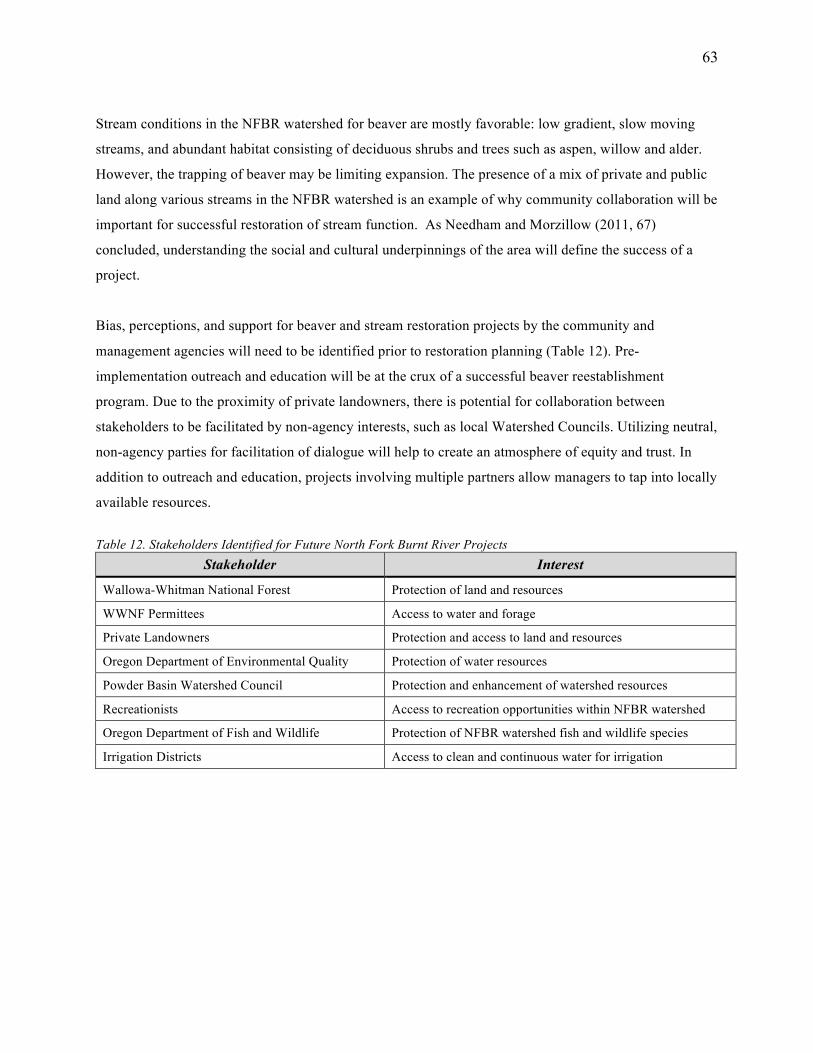
63
Stream conditions in the NFBR watershed for beaver are mostly favorable: low gradient, slow moving
streams, and abundant habitat consisting of deciduous shrubs and trees such as aspen, willow and alder.
However, the trapping of beaver may be limiting expansion. The presence of a mix of private and public
land along various streams in the NFBR watershed is an example of why community collaboration will be
important for successful restoration of stream function. As Needham and Morzillow (2011, 67)
concluded, understanding the social and cultural underpinnings of the area will define the success of a
project.
Bias, perceptions, and support for beaver and stream restoration projects by the community and
management agencies will need to be identified prior to restoration planning (Table 12). Pre-
implementation outreach and education will be at the crux of a successful beaver reestablishment
program. Due to the proximity of private landowners, there is potential for collaboration between
stakeholders to be facilitated by non-agency interests, such as local Watershed Councils. Utilizing neutral,
non-agency parties for facilitation of dialogue will help to create an atmosphere of equity and trust. In
addition to outreach and education, projects involving multiple partners allow managers to tap into locally
available resources.
Table 12. Stakeholders Identified for Future North Fork Burnt River Projects
Stakeholder Interest
Wallowa-Whitman National Forest Protection of land and resources
WWNF Permittees Access to water and forage
Private Landowners Protection and access to land and resources
Oregon Department of Environmental Quality Protection of water resources
Powder Basin Watershed Council Protection and enhancement of watershed resources
Recreationists Access to recreation opportunities within NFBR watershed
Oregon Department of Fish and Wildlife Protection of NFBR watershed fish and wildlife species
Irrigation Districts Access to clean and continuous water for irrigation
64
9.! Conclusion National Forest areas are key for capture and storage of clean water, and often are the main source of
drinking water for local communities. By 2025, 1.8 billion people are expected to live in water-scarce
regions, around the globe (UNESCO 2012). Changing climate conditions pointing to a variable and
uncertain future for forests and water resources; therefore, management of water resources, especially in
forested areas, must have an emphasis on sustainability. Further, past management methods have not
always shown success in improving or maintaining water resources in National Forests, therefore it is
imperative to consider additional approaches for sustaining water. Additionally, sustainable management
is at the crux of addressing local concerns while promoting ecological, economic, and social adaptability
to climate change and natural disasters.
Federal policies and National Forest management plans were created to protect and plan for natural
resources in America to promote sustainability for the use by future generations. For the NFBR
Watershed, the WWFMP (1990) was the guiding document for protecting these resources in the WWNF
for roughly twenty-seven years. Despite identifying watershed resources as a priority, the WWFMP
(1990) has not improved either streamflow or overall stream temperatures, key indicators of watershed
health, during this timeframe in the NFBR watershed. Streamflow data has continued to show little to no
evidence of water storage capacity in the NFBR system with summer baseflows reduced to less than one
percent of the annual peak flow most of the time. Though there have been some recent improvements,
high stream temperatures continue to be an issue for the NFBR and its tributaries. Sites showing
improvement on Camp Creek and Trout Creek have revealed an interesting connection to restoration
strategies, including increasing vegetation along streambanks and beaver establishment.
Recent research has brought to light the ecological and economic benefits of using additional strategies to
the WWFMP (1990). These strategies might include: (1) combining more shrubs and trees with
meandering stream reaches and/or (2) floodplain restoration and (3) the recolonization and expansion of
beaver. Alongside beaver recolonization, riparian vegetation projects and ungulate exclusion and changes
in patterns of use will increase the success of projects. Additionally, social and cultural perceptions of
stream restoration should be identified for the NFBR community. Stakeholders working in tandem to
create solutions based on evidence and equity will be a first step towards creating a more adaptable
community. Managing water resources in a way that is conducive to both the natural inhabitants and

65
humans can improve watershed health and in turn help create robust environmental, sociocultural, and
economic systems.
66
Bibliography Apple, Larry L. Bruce H. Smith, James D. Dunder, and Bruce W. Baker. 1984. “The Use of Beavers for
Riparian/Aquatic Habitat Restoration of Cold Desert, Gully-Cut Stream Systems in Southwestern Wyoming.” Paper presented at the American Fisheries Society/Wildlife Society Joint Chapter Meeting, Logan, Utah. February 8, 9, 10, 1984.
Ault, T.R., J.S. Mankin, B.I. Cook, and J.E. Smerdon. 2016. “Relative impacts of mitigation, temperature,
and precipitation on 21st Century megadrought risk in the American Southwest.” Sci. Adv.2(10) e1600873. DOI:10.1126/sciadv.1600873.
Bacon, M., P. Brouha, M. Rode, and C. Staley. 1980. Redband trout (salmo sp.) Shasta-Trinity National
Forest, California, Comprehensive Habitat Management Plan. U.S. Department of Agriculture. Forest Service, Shasta-Trinity National Forest, Redding, California.
Bair, Brian, 2000. “Stream Restoration Cost Estimates. In: Allen, S.T., Thomson, C., Carlson, R.
(Eds.).” Proceedings of the Salmon Habitat Restoration Cost Workshop, Gladstone, OR, Nov. 14e16. Pacific States Marine Fisheries Commission, 104-113.
Baker, Bruce, H. Raul Peinetti, and Michael B. Coughenour. 2005. “Resilience of Willow Stems After
Release from Intense Elk Browsing. Rangeland Ecology & Management 58(6):575-581. DOI: 10.2458/azu_rangelands_v58i6_coughenour.
Beschta, Robert L., Debra L. Donahue, Dominick A. DellaSala, Jonathan J. Rhodes, James R. Karr, Mary
H. O’Brien, Thomas L. Fleischner, and Cindy Deacon Williams. 2012. “Adapting to Climate Change on Western Public Lands: Addressing the Ecological Effects of Domestic, Wild, and Feral Ungulates.” Environmental Management 51(2):474-491. DOI: 10.1007/s00267-012-9964-9.
Carrol, John E. 2004. “Sustainability and Spirituality.” State University of New York Press, Albany. Copeland, Claudia. 2016. “Clean Water Act: A Summary of the Law.” Congressional Research Service.
https://fas.org/sgp/crs/misc/RL30030.pdf. Dalton, M.M., K.D. Dello, L. Hawkins, P.W. Mote, and D.E. Rupp. 2017. “The Third Oregon Climate
Assessment Report.” Oregon Climate Change Research Institute, College of Earth, Ocean and Atmospheric Sciences, Oregon State University, Corvallis, Oregon. URL: http://www.occri.net/media/1055/ocar3_final_all_01-30-2017_compressed.pdf.
Diabat, Mousa. 2014. “The Influence of Climate Change and Restoration on Stream Temperature.” PhD
diss., Oregon State University, Scholars Archive, Corvallis, Oregon. Dunlap, Thomas R. 2006. “Environmentalism, a Secular Faith.” Environmental Values, 15(3):321-330.
DOI: https://doi-org.ezproxy.proxy.library.oregonstate.edu/10.3197/096327106778226284.
Elmore, Wayne and Robert L. Beschta. 1987. Riparian Areas: Perceptions in Management. Rangelands 9(6):260-265.
Fouty, Suzanne C. 2008. “Climate Change and Beaver Activity: How Restoring Nature’s Engineers Can
Alleviate Problems.” Beaversprite 23(1):4-5,13.
67
Fouty, Suzanne C. 2012. “Methodology for Analyzing and Quality Control Checking Stream
Temperature Data.” Wallowa-Whitman National Forest, Whitman Ranger District, Baker County, Oregon.
Fouty, Suzanne C. 2017. “Unpublished Analysis of Trout Creek Temperature Conditions.” Wallowa-
Whitman National Forest, Whitman Ranger District, Baker County, Oregon. Gibson, Polly P. and Julia D. Olden. 2014. “Ecology, Management, and Conservation Implications of
North American Beaver (Castor canadensis) in dryland streams.” Aquatic Conservation Marine and Freshwater Ecosystems, 24(3):391-409.
Harvey, Alan E.; Geist, J. Michael; McDonald, Gerald L; Jurgensen, Martin F.; Cochran, Patrick H.;
Zabowski, Darlene; Meurisse, Robert T. 1994. Biotic and abiotic processes in eastside ecosystems: the effects of management on soil properties, processes, and productivity. Gen. Tech. Rep. PNW-GTR-323. Portland, OR: U.S. Department of Agriculture, Forest Service, Pacific Northwest Research Station. DOI: https://doi.org/10.2737/PNW-GTR-323.
Hibbert, Alden R. 1976. “Percolation and Streamflows in Range and Forest Lands.” Proceedings, 5th Workshop on Watershed Management on Range and Forest Lands. United States-Australian Rangeland Panel, Utah State University, Utah Research Laboratory, Utah. 61-72.
Hiller, Tim L. 2011. “Oregon Furbearer Program Report.” Oregon Department of Fish and Wildlife,
Wildlife Division, Salem, Oregon. 1-42. URL: https://www.dfw.state.or.us/resources/hunting/small_game/docs/2011_furbearer_report.pdf
Hood, Glynnis A., and Suzanne E. Bayley. 2008. “Beaver (Castor Canadensis) Mitigate the Effects of
Climate on the Area of Open Water in Boreal Wetlands in Western Canada.” Biological Conservation 141(2)556-567. Accessed June 27, 2018. DOI: 10.1016/j.biocon.2007.12.003.
Junk, Wolfgang J., Bayley Peter B., and Richard E. Sparks. 1989. “The Flood Pulse Concept in River-
Floodplain Systems.” Canadian Special Publication of Fisheries and Aquatic Sciences. 106:110-127.
Matella, M.K. and A.M. Merenlender. 2015. “Scenarios for Restoring Floodplain Ecology Given Changes
to River Flows Under Climate Change: Case Study from the San Joaquin River, California.” River Res., 31:280-290. DOI: 10.1002/rra.2750.
Morgan-Hayes, Anna. 2018. “Powder Basin Water Quality Report, 2013-2017.” Powder Basin Watershed
Council, Baker City, Oregon. 1-138. Moore, R.D., Fleming, S.W., Menounos, B. Wheate, R., Fountain, A.,Stahl, K. Holm K., and Jakob, M.
2009. “Glacier change in western North America: influences on hydrology, geomorphic hazards and water quality.” Hydrological Processes: An International Journal 23(1), 42-61. DOI: 10.1002/hyp.7162.
Naiman, Robert J., Carol A. Johnston, and James C. Kelley. 1988. “Alterations of North American
Streams by Beaver.” BioScience 38(11)753-762, “How Animals Shape their Ecosystems.” Accessed June 18, 2018. URL: http://www.jstor.org/stable/1310784.
68
Naiman, Robert J. and Henri Décamps. 1997. “The Ecology of Interfaces: Riparian Zone.”Annual Review of Ecology and Systematics 28:621-658. Accessed June 18, 2018. URL: https://doi.org/10.1146/annurev.ecolsys.21=8.1.621.
[NDMC/USDA/NOAA] National Drought Mitigation Center. 2018. United States Drought Monitor Map:
Baker County 2000-17. University of Nebraska-Lincoln, Lincoln, Nebraska. URL: http://droughtmonitor.unl.edu.
Needham, Mark D. and Anita T. Morzillo. 2011. “Landowner Incentives and Tolerances for Managing Beaver Impacts in Oregon.” Oregon State University, Department of Forest Ecosystems and Society in Oregon State University, Corvallis, Oregon 1-123. URL: https://www.dfw.state.or.us/wildlife/living_with/docs/ODFW%20and%20OWEB%20-%20Landowner%20Beaver%20Project%20-%20Final%20Report%20-%20Needham%20and%20Morzillo.pdf.
Novakowski, Nicholas S. 1965. “Population dynamics of a beaver population in northern latitudes.” Ph.D. diss., University of Saskatchewan, Saskatoon, Canada.
[ODEQ] Oregon Department of Environmental Quality. 2012a. “Methodology for Oregon’s 2012 Water
Quality Report and List of Water Quality Limited Waters (Pursuant to Clean Water Act Sections 303(d) and 305(b) and OAR 340-041-0046).” Environmental Solutions Division, Portland, Oregon. URL: http://www.oregon.gov/deq/FilterDocs/AssessmentMethodologyRep.pdf.
[ODEQ] Oregon Department of Environmental Quality. 2012b. “Water Quality Assessment- Oregon’s
2012 Integrated Report Assessment Database and 303(d) List.” Environmental Solutions Division, Portland, Oregon. URL: http://www.deq.state.or.us/wq/assessment/rpt2012/search.asp.
ODEQ] Oregon Department of Environmental Quality. 2014. “2014 Final Oregon Nonpoint Source
Management Program Plan.” Watershed Management, Portland, Oregon. URL: http://www.oregon.gov/deq/FilterDocs/npsplanF.pdf.
[ODEQ] Oregon Department of Environmental Quality. 2018. “Draft Methodology for Oregon’s 2018
Water Quality Report and List of Water Quality Limited Waters.” Water Quality Division, Portland, Oregon. URL: https://www.oregon.gov/deq/FilterDocs/WQam2018.pdf.
[ODFW] Oregon Department of Fish and Wildlife. 2018. “Oregon Furbearer Trapping and Hunting
Regulations, July 1, 2018 through June 30, 2020.” State of Oregon, Salem, Oregon. 1-12. URL: https://www.dfw.state.or.us/resources/hunting/small_game/regulations/docs/Furbearer_Regulations.pdf
Ogden, Peter Skene. 1824-26. Snake Country Journal. Copies of Journal Entry Pages from Oregon
Department of Fish and Wildlife files. Baker City, Oregon. 1-12. Opperman, Jeffrey J., Gerald E. Galloway, Joseph Fargione, Jeffrey F. Mount, Brian D. Richter, and
Silvia Secchi. 2009. “Sustainable Floodplains through large-scale Reconnection to Rivers.” Science, 326:1487-1488. DOI: 10.1126/science.1178256.
Pauly, Daniel, Villy Christiansen, Sylvie Guenette, Tony J. Pitcher, U. Rashid Sumaila, Carl J. Walters,
R. Watson, and Dirk Zeller. 2002. “Towards Sustainability in World Fisheries.” Nature 418:689-695. Accessed May 5, 2018. DOI: https://doi.org/10.1038/nature01017.
69
Pilliod, D., Rohde, A., Charnley, S., Davee, R., Dunham, J., Gosnell, H., Grant, G., Hausner, M., Huntington, J., and C. Nash. 2018. Survey of Beaver-related Restoration Practices in Rangeland Streams of the Western USA. Environmental Management 61:58-68. DOI: 10.1007/s00267 -017 -0957 -6.
Platts, William.S. 1981. Effects of Livestock Grazing and Riparian/Stream Ecosystems Overview.
Influence of Forest and Rangeland Mangement on Anadromous Fish Habitat in Western North America. Gen. Tech. Rep. Portland, Oregon. PNW124. U.S. Department of Agriculture, Forest Service, Pacific Northwest Research Station. 1-19.
Pollock, Michael M., Beechie, Timothy J., and Chris E. Jordan. 2007. Geomorphic changes upstream of
beaver dams in Bridge Creek, an incised stream channel in the interior Columbia River basin, eastern Oregon. Earth Surf. Process. Landforms 32: 1174-1185. DOI: 10.1002/esp.1553.
Ratliff, D.E. and P.J. Howell. 1993. The Status of bull trout Populations in Oregon. Oregon Department
of Fish and Wildlife, Corvallis, Oregon. Seghezzo, Lucas. 2009. “The Five Dimensions of Sustainability.” Environmental Politics, 18(4):539-556.
DOI: 10.1080/09644010903063669.
Seton, Ernest T. 1929. “Lives of Game Animals.” 4(2), Rodents, etc. New York: Doubleday, Doran.
Simon-Brown, Viviane. 2011. "Sustainable Living: Handbook, A Citizen's Guide to Thoughtful Action". Contributions in Education and Outreach No. 4a. College of Forestry, Oregon State University.
Smith, Douglas W., and Daniel B. Tyers. 2008. “The Beavers of Yellowstone.” Yellowstone Science
16(3):4-15. Accessed June 26, 2018. Digital Commons. Swanson, Sherman, Sandra Wyman, and Carol Evans. 2015. “Practical Grazing Management to Maintain
or Restore Riparian Functions and Values on Rangelands.” Journal of Rangeland Applications 2:1-28. ISSN: 2331-5512.
Tockner, Klement and Jack A. Stanford. 2002. “Riverine Flood Plains: Present State and Future Trends.”
Environemental Conservation, 29:308-330. DOI: 10.1017/S037689290200022X. [UNESCO] United Nations Educational, Scientific, and Cultural Organization. 2012. “Managing Water
under Uncertainty and Risk.” United Nations World Water Development Report 4(1): 1-370. URL: http://www.unesco.org/new/fileadmin/MULTIMEDIA/HQ/SC/pdf/WWDR4%20Volume%201-Managing%20Water%20under%20Uncertainty%20and%20Risk.pdf
[USDA] U.S. Department of Agriculture. Forest Service. 2012. “National Best Management Practices for
Water Quality.” URL: https://www.fs.fed.us/.../watershed/pubs/FS_National_Core_BMPs_April2012.pdf.
[USDA] U.S. Department of Agriculture. Forest Service. Pacific Northwest Region. 2013. Memorandum
70
of Understanding between State of Oregon Department of Environmental Quality and the USDA, Forest Service, Pacific Northwest Region. Federal Register FS-1500-15. URL: http://www.oregon.gov/deq/FilterDocs/FSdeqWQmou2.pdf.
[USDA] U.S. Department of Agriculture. 2016. Aqs Water Temperature Surveys Data Entry User Guide.
Natural Resource Manager, Forest Service.
[USFWS] U.S. Department of the Interior. Fish and Wildlife Service. Pacific Region Headquarters. 2000. Endangered and Threatened Wildlife and Plants; 12-Month Finding for a Petition to List the Great Basin Redband Trout as Threatened or Endangered. Federal Register 54:14932-14936.
[USFWS] U.S. Fish and Wildlife Service. 2015. Mid-Columbia Recovery Unit Implementation for Bull
Trout (Salvelinus confluentus). Oregon Fish and Wildlife Office, Portland, Oregon. URL: https://www.fws.gov/pacific/bulltrout/pdf/Final_Mid_Columbia_RUIP_092915.pdf
Westbrook, Cherie J., David J. Cooper, and Bruce W. Baker. 2006. “Beaver Dams and Overbank Floods
Influence Groundwater-surface Water Interactions of a Rocky Mountain Riparian Area.” Water Resources Research. W0604, 42(6):1-12. DOI:10.1029/2005wr004560.
[WCED] World Commission on Environment and Development. 1987. “Our Common Future”. Oxford
University Press. Oxford, United Kingdom. Williams, A.P., R. Seager, J.T. Abatzoglou, B.I. Cook, J.E. Smerdon, and E.R. Cook. 2015. “Contribution
of anthropogenic warming to California drought during 2012-2014.” Geophys. Res. Lett., 42(16):6819-6828. DOI:10.1002/2015GL064924.
[WRCC] Western Regional Climate Center. 2016-18. Cooperative Climatological Data Summaries:
Austin 3S, Oregon (350356). Reno, Nevada. URL: https://wrcc.dri.edu/Climate/west_coop_summaries.php
[WWNF] U.S. Department of Agriculture. Forest Service. Pacific Northwest Region. Wallowa-Whitman
National Forest. 1990. Land and Resource Management Plan: Wallowa Whitman National Forest. Baker County, Oregon.
[WWNF] U.S. Department of Agriculture. Forest Service. Pacific Northwest Region. Wallowa-Whitman
National Forest. 1993. North Fork Burnt River Rehabilitation Photo Journal. Unity Ranger District. Baker County, Oregon.
[WWNF] U.S. Department of Agriculture. Forest Service. Pacific Northwest Region. Wallowa-Whitman
National Forest. 1995. North Fork Burnt River Watershed Analysis Report. Whitman Ranger District, Baker County, Oregon.
Law Clean Water Act of 1972 [33 U.S.C. §1251-1387], (US), October 18, 1972 Endangered Species Act of 1973 [16 U.S.C. § 1531 et seq.], (US), December 27, 1973 Forest and Rangeland Renewable Resources Planning Act of 1974 [As Amended Through Public Law 16 U.S.C. §106-580], (US) December 31, 2000
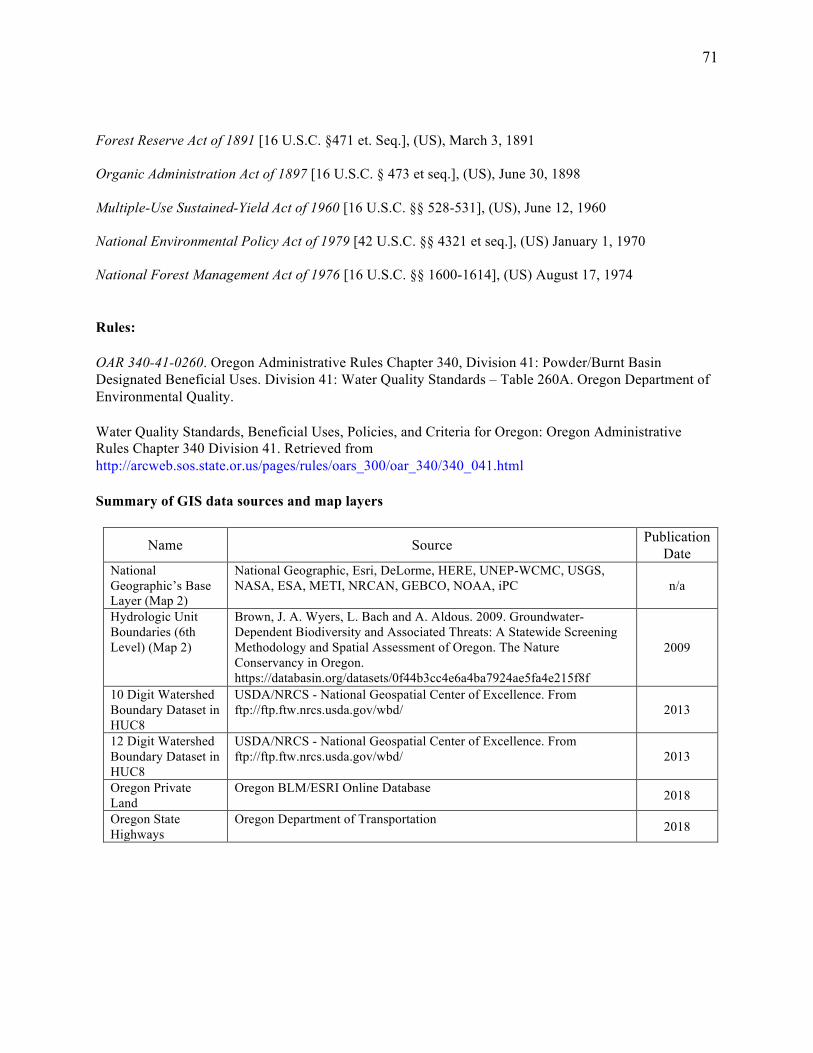
71
Forest Reserve Act of 1891 [16 U.S.C. §471 et. Seq.], (US), March 3, 1891 Organic Administration Act of 1897 [16 U.S.C. § 473 et seq.], (US), June 30, 1898 Multiple-Use Sustained-Yield Act of 1960 [16 U.S.C. §§ 528-531], (US), June 12, 1960 National Environmental Policy Act of 1979 [42 U.S.C. §§ 4321 et seq.], (US) January 1, 1970 National Forest Management Act of 1976 [16 U.S.C. §§ 1600-1614], (US) August 17, 1974
Rules:
OAR 340-41-0260. Oregon Administrative Rules Chapter 340, Division 41: Powder/Burnt Basin Designated Beneficial Uses. Division 41: Water Quality Standards – Table 260A. Oregon Department of Environmental Quality.
Water Quality Standards, Beneficial Uses, Policies, and Criteria for Oregon: Oregon Administrative Rules Chapter 340 Division 41. Retrieved from http://arcweb.sos.state.or.us/pages/rules/oars_300/oar_340/340_041.html
Summary of GIS data sources and map layers
Name Source Publication Date
National Geographic’s Base Layer (Map 2)
National Geographic, Esri, DeLorme, HERE, UNEP-WCMC, USGS, NASA, ESA, METI, NRCAN, GEBCO, NOAA, iPC n/a
Hydrologic Unit Boundaries (6th Level) (Map 2)
Brown, J. A. Wyers, L. Bach and A. Aldous. 2009. Groundwater-Dependent Biodiversity and Associated Threats: A Statewide Screening Methodology and Spatial Assessment of Oregon. The Nature Conservancy in Oregon. https://databasin.org/datasets/0f44b3cc4e6a4ba7924ae5fa4e215f8f
2009
10 Digit Watershed Boundary Dataset in HUC8
USDA/NRCS - National Geospatial Center of Excellence. From ftp://ftp.ftw.nrcs.usda.gov/wbd/ 2013
12 Digit Watershed Boundary Dataset in HUC8
USDA/NRCS - National Geospatial Center of Excellence. From ftp://ftp.ftw.nrcs.usda.gov/wbd/ 2013
Oregon Private Land
Oregon BLM/ESRI Online Database 2018
Oregon State Highways
Oregon Department of Transportation 2018

72
APPENDICES
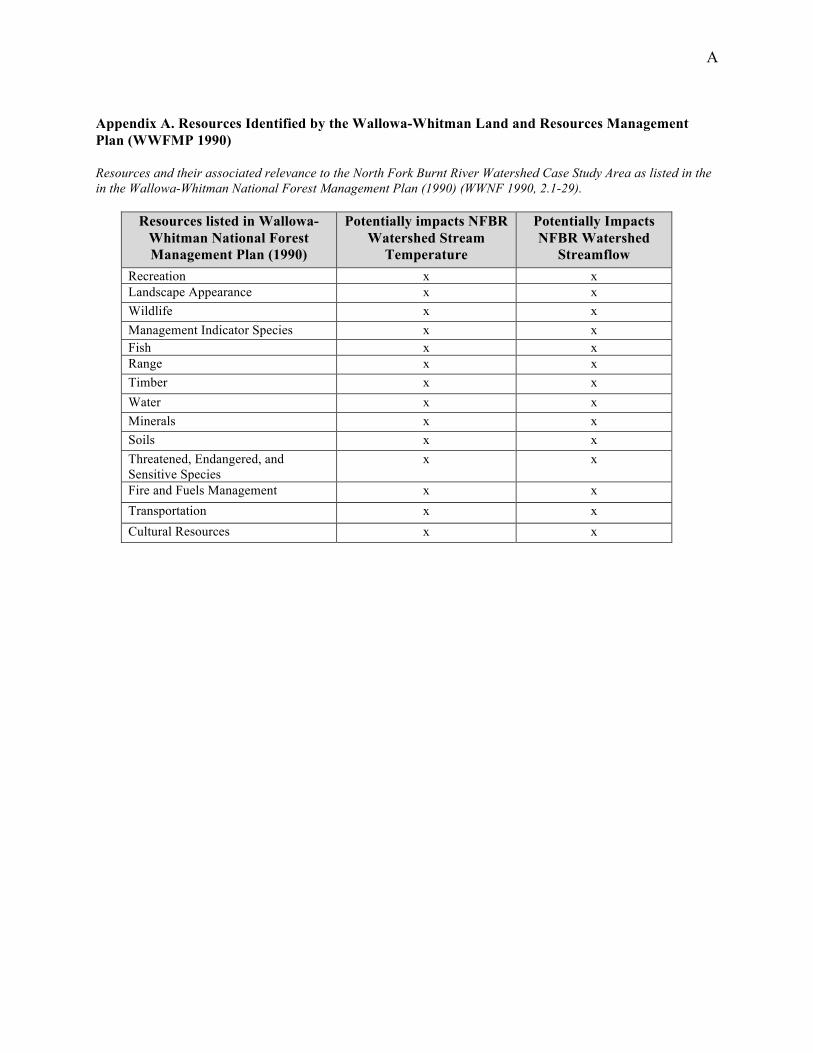
A
Appendix A. Resources Identified by the Wallowa-Whitman Land and Resources Management Plan (WWFMP 1990) Resources and their associated relevance to the North Fork Burnt River Watershed Case Study Area as listed in the in the Wallowa-Whitman National Forest Management Plan (1990) (WWNF 1990, 2.1-29).
Resources listed in Wallowa-Whitman National Forest Management Plan (1990)
Potentially impacts NFBR Watershed Stream
Temperature
Potentially Impacts NFBR Watershed
Streamflow Recreation x x Landscape Appearance x x Wildlife x x Management Indicator Species x x Fish x x Range x x Timber x x Water x x Minerals x x Soils x x Threatened, Endangered, and Sensitive Species
x x
Fire and Fuels Management x x Transportation x x Cultural Resources x x
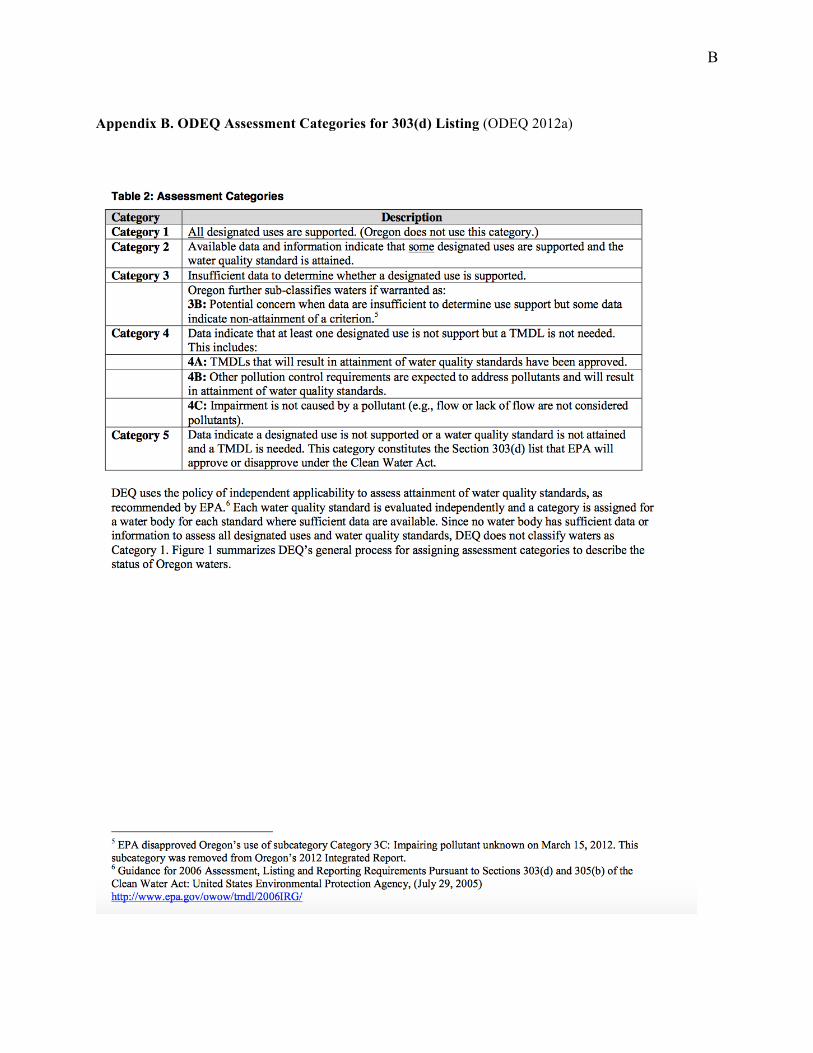
B
Appendix B. ODEQ Assessment Categories for 303(d) Listing (ODEQ 2012a)
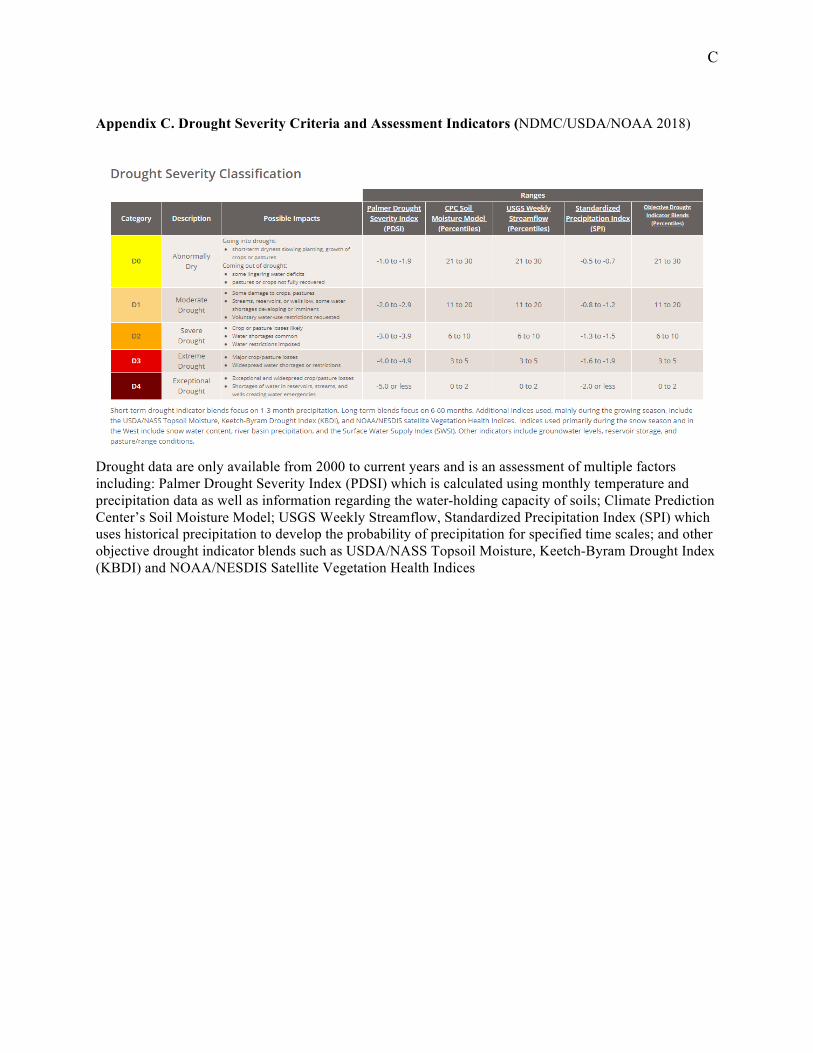
C
Appendix C. Drought Severity Criteria and Assessment Indicators (NDMC/USDA/NOAA 2018)
Drought data are only available from 2000 to current years and is an assessment of multiple factors including: Palmer Drought Severity Index (PDSI) which is calculated using monthly temperature and precipitation data as well as information regarding the water-holding capacity of soils; Climate Prediction Center’s Soil Moisture Model; USGS Weekly Streamflow, Standardized Precipitation Index (SPI) which uses historical precipitation to develop the probability of precipitation for specified time scales; and other objective drought indicator blends such as USDA/NASS Topsoil Moisture, Keetch-Byram Drought Index (KBDI) and NOAA/NESDIS Satellite Vegetation Health Indices
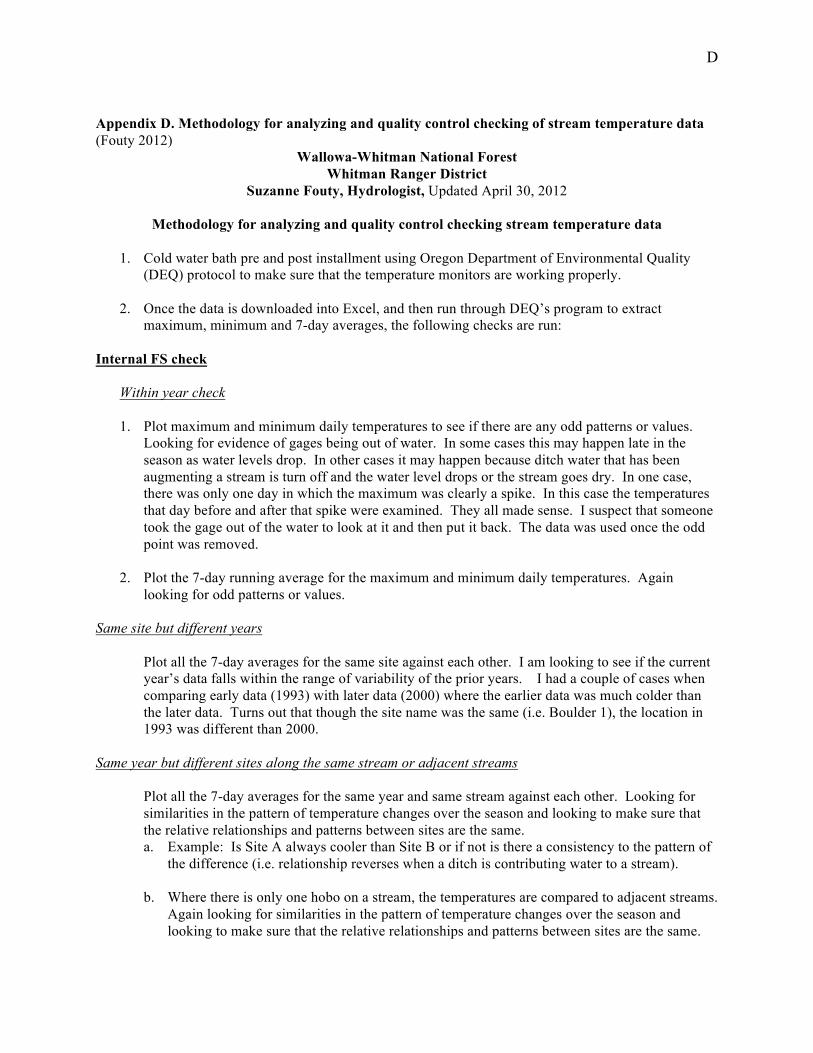
D
Appendix D. Methodology for analyzing and quality control checking of stream temperature data (Fouty 2012)
Wallowa-Whitman National Forest Whitman Ranger District
Suzanne Fouty, Hydrologist, Updated April 30, 2012
Methodology for analyzing and quality control checking stream temperature data
1.! Cold water bath pre and post installment using Oregon Department of Environmental Quality (DEQ) protocol to make sure that the temperature monitors are working properly.
2.! Once the data is downloaded into Excel, and then run through DEQ’s program to extract
maximum, minimum and 7-day averages, the following checks are run: Internal FS check
Within year check 1.! Plot maximum and minimum daily temperatures to see if there are any odd patterns or values.
Looking for evidence of gages being out of water. In some cases this may happen late in the season as water levels drop. In other cases it may happen because ditch water that has been augmenting a stream is turn off and the water level drops or the stream goes dry. In one case, there was only one day in which the maximum was clearly a spike. In this case the temperatures that day before and after that spike were examined. They all made sense. I suspect that someone took the gage out of the water to look at it and then put it back. The data was used once the odd point was removed.
2.! Plot the 7-day running average for the maximum and minimum daily temperatures. Again
looking for odd patterns or values. Same site but different years
Plot all the 7-day averages for the same site against each other. I am looking to see if the current year’s data falls within the range of variability of the prior years. I had a couple of cases when comparing early data (1993) with later data (2000) where the earlier data was much colder than the later data. Turns out that though the site name was the same (i.e. Boulder 1), the location in 1993 was different than 2000.
Same year but different sites along the same stream or adjacent streams
Plot all the 7-day averages for the same year and same stream against each other. Looking for similarities in the pattern of temperature changes over the season and looking to make sure that the relative relationships and patterns between sites are the same. a.! Example: Is Site A always cooler than Site B or if not is there a consistency to the pattern of
the difference (i.e. relationship reverses when a ditch is contributing water to a stream).
b.! Where there is only one hobo on a stream, the temperatures are compared to adjacent streams. Again looking for similarities in the pattern of temperature changes over the season and looking to make sure that the relative relationships and patterns between sites are the same.
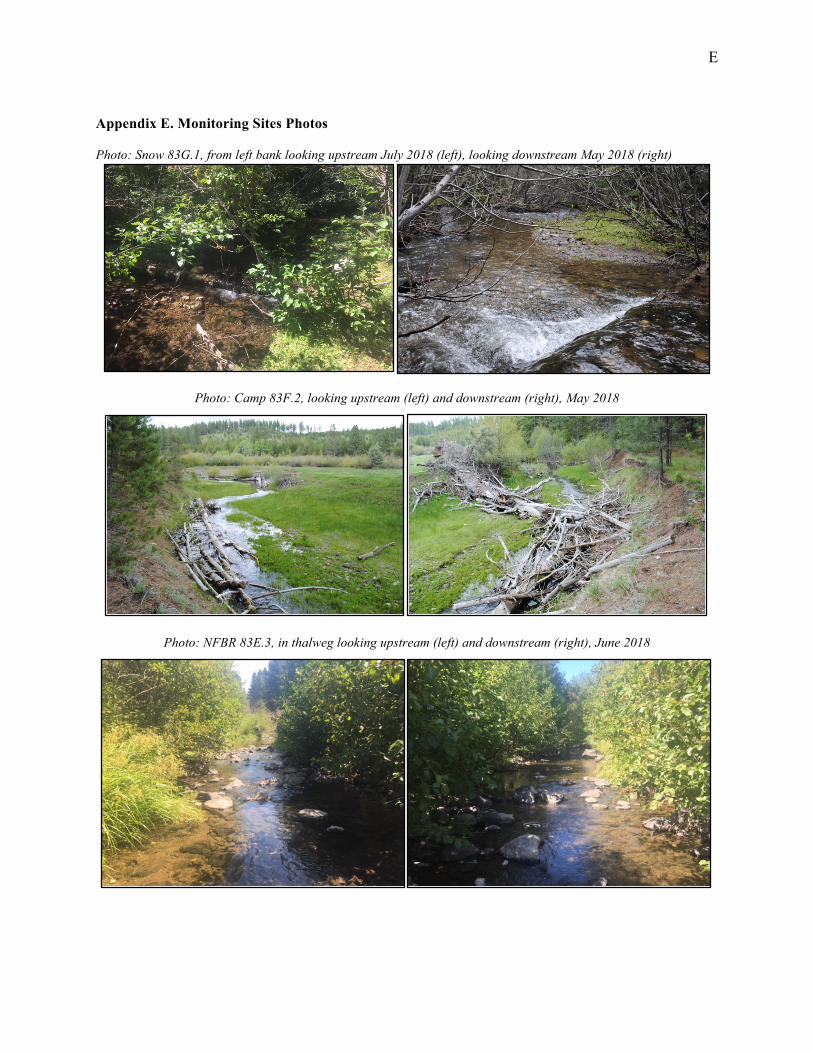
E
Appendix E. Monitoring Sites Photos Photo: Snow 83G.1, from left bank looking upstream July 2018 (left), looking downstream May 2018 (right)
Photo: Camp 83F.2, looking upstream (left) and downstream (right), May 2018
Photo: NFBR 83E.3, in thalweg looking upstream (left) and downstream (right), June 2018
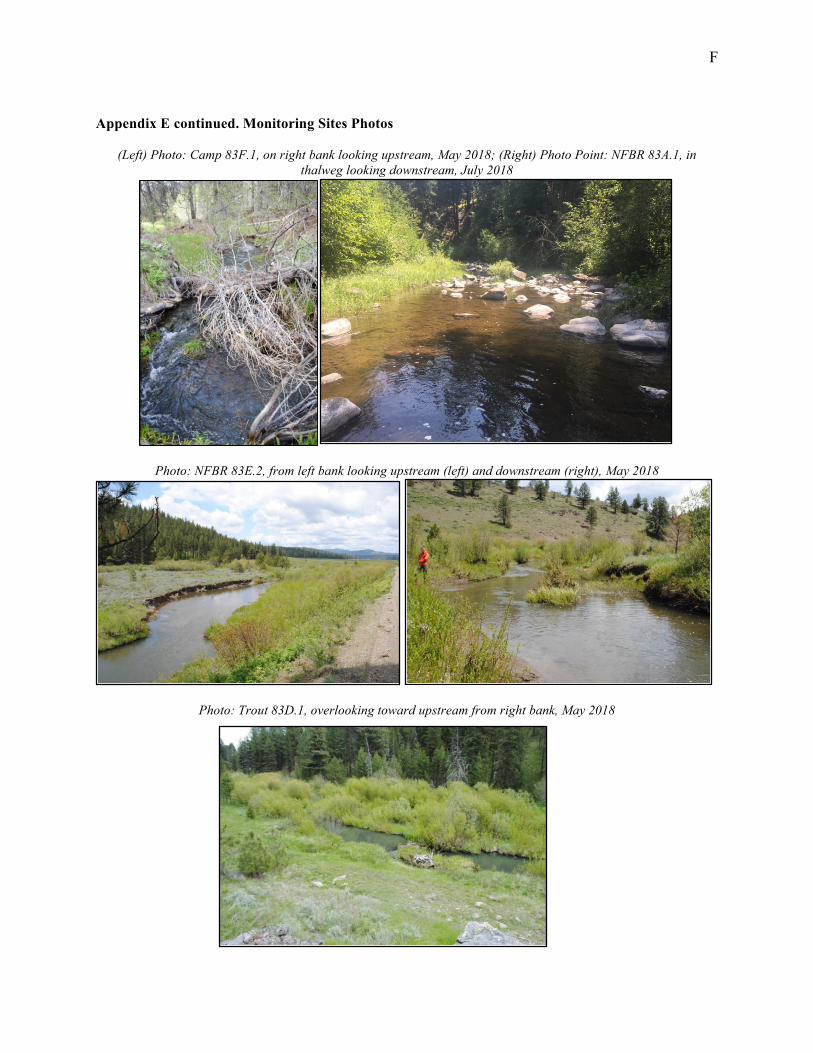
F
Appendix E continued. Monitoring Sites Photos
(Left) Photo: Camp 83F.1, on right bank looking upstream, May 2018; (Right) Photo Point: NFBR 83A.1, in thalweg looking downstream, July 2018
Photo: NFBR 83E.2, from left bank looking upstream (left) and downstream (right), May 2018
Photo: Trout 83D.1, overlooking toward upstream from right bank, May 2018
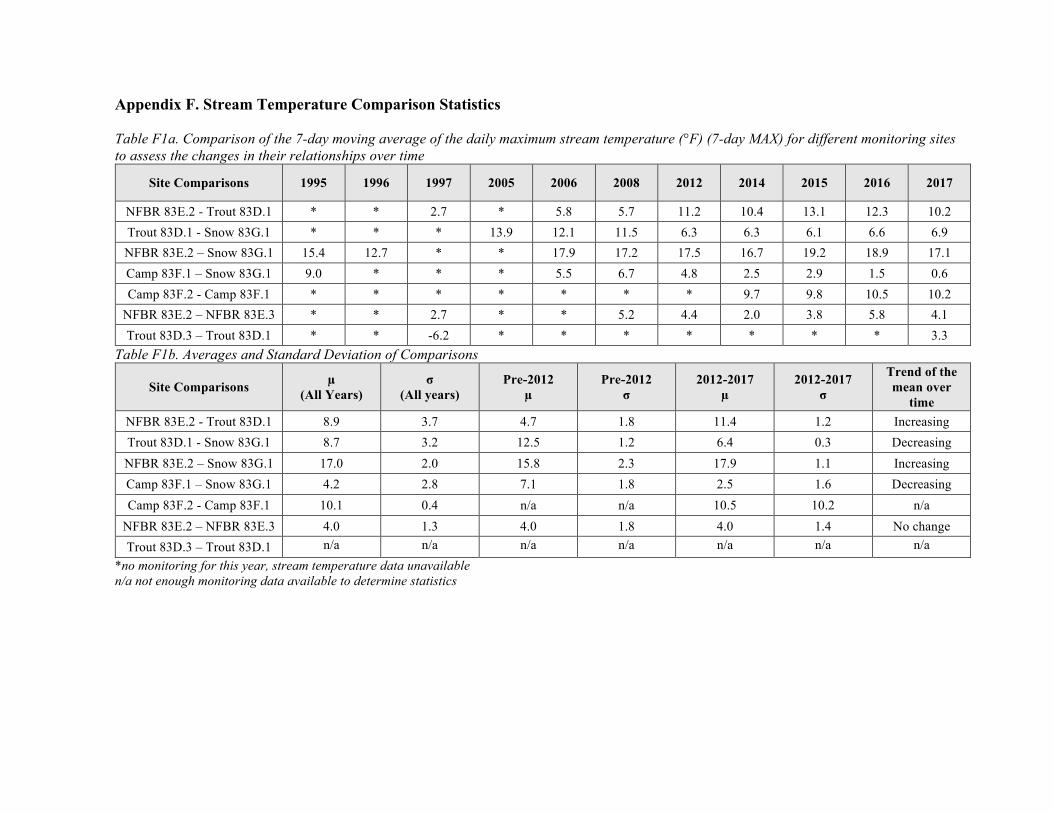
Appendix F. Stream Temperature Comparison Statistics Table F1a. Comparison of the 7-day moving average of the daily maximum stream temperature (°F) (7-day MAX) for different monitoring sites to assess the changes in their relationships over time
Site Comparisons 1995 1996 1997 2005 2006 2008 2012 2014 2015 2016 2017
NFBR 83E.2 - Trout 83D.1 * * 2.7 * 5.8 5.7 11.2 10.4 13.1 12.3 10.2
Trout 83D.1 - Snow 83G.1 * * * 13.9 12.1 11.5 6.3 6.3 6.1 6.6 6.9 NFBR 83E.2 – Snow 83G.1 15.4 12.7 * * 17.9 17.2 17.5 16.7 19.2 18.9 17.1
Camp 83F.1 – Snow 83G.1 9.0 * * * 5.5 6.7 4.8 2.5 2.9 1.5 0.6
Camp 83F.2 - Camp 83F.1 * * * * * * * 9.7 9.8 10.5 10.2 NFBR 83E.2 – NFBR 83E.3 * * 2.7 * * 5.2 4.4 2.0 3.8 5.8 4.1
Trout 83D.3 – Trout 83D.1 * * -6.2 * * * * * * * 3.3 Table F1b. Averages and Standard Deviation of Comparisons
Site Comparisons µ (All Years)
σ (All years)
Pre-2012 µ
Pre-2012 σ
2012-2017 µ
2012-2017 σ
Trend of the mean over
time NFBR 83E.2 - Trout 83D.1 8.9 3.7 4.7 1.8 11.4 1.2 Increasing
Trout 83D.1 - Snow 83G.1 8.7 3.2 12.5 1.2 6.4 0.3 Decreasing
NFBR 83E.2 – Snow 83G.1 17.0 2.0 15.8 2.3 17.9 1.1 Increasing
Camp 83F.1 – Snow 83G.1 4.2 2.8 7.1 1.8 2.5 1.6 Decreasing
Camp 83F.2 - Camp 83F.1 10.1 0.4 n/a n/a 10.5 10.2 n/a
NFBR 83E.2 – NFBR 83E.3 4.0 1.3 4.0 1.8 4.0 1.4 No change
Trout 83D.3 – Trout 83D.1 n/a n/a n/a n/a n/a n/a n/a
*no monitoring for this year, stream temperature data unavailable n/a not enough monitoring data available to determine statistics
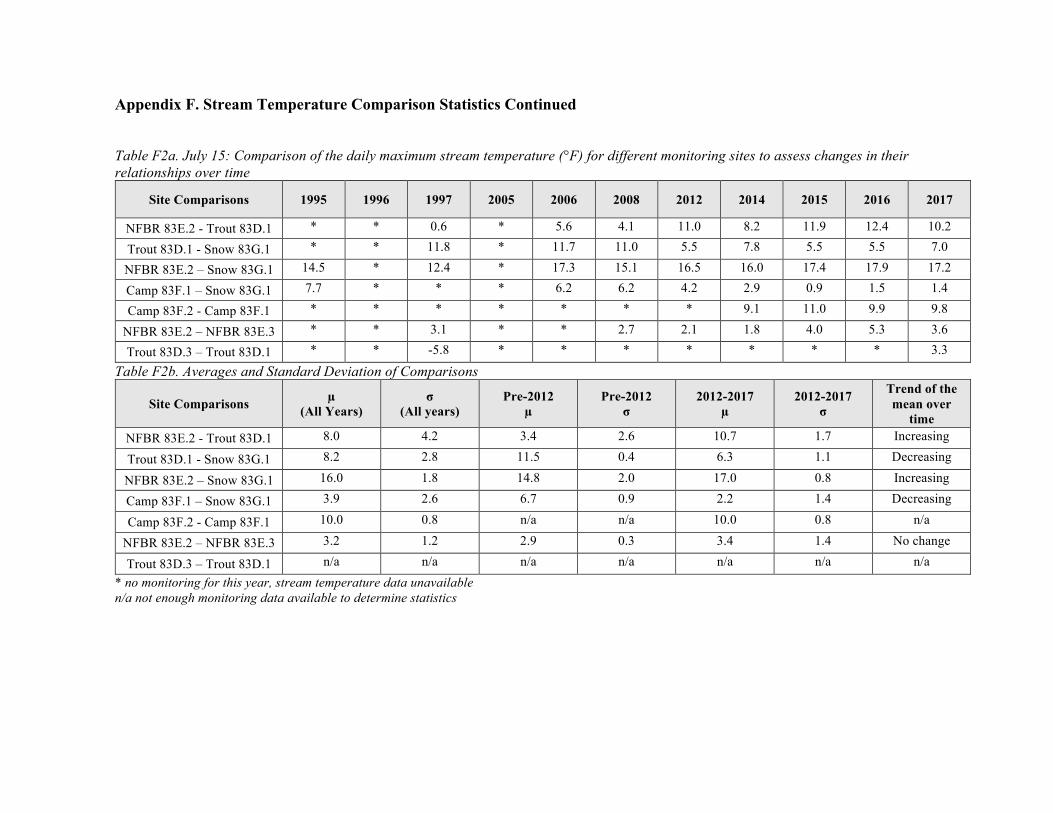
Appendix F. Stream Temperature Comparison Statistics Continued Table F2a. July 15: Comparison of the daily maximum stream temperature (°F) for different monitoring sites to assess changes in their relationships over time
Site Comparisons 1995 1996 1997 2005 2006 2008 2012 2014 2015 2016 2017
NFBR 83E.2 - Trout 83D.1 * * 0.6 * 5.6 4.1 11.0 8.2 11.9 12.4 10.2
Trout 83D.1 - Snow 83G.1 * * 11.8 * 11.7 11.0 5.5 7.8 5.5 5.5 7.0
NFBR 83E.2 – Snow 83G.1 14.5 * 12.4 * 17.3 15.1 16.5 16.0 17.4 17.9 17.2
Camp 83F.1 – Snow 83G.1 7.7 * * * 6.2 6.2 4.2 2.9 0.9 1.5 1.4
Camp 83F.2 - Camp 83F.1 * * * * * * * 9.1 11.0 9.9 9.8
NFBR 83E.2 – NFBR 83E.3 * * 3.1 * * 2.7 2.1 1.8 4.0 5.3 3.6
Trout 83D.3 – Trout 83D.1 * * -5.8 * * * * * * * 3.3
Table F2b. Averages and Standard Deviation of Comparisons
Site Comparisons µ (All Years)
σ (All years)
Pre-2012 µ
Pre-2012 σ
2012-2017 µ
2012-2017 σ
Trend of the mean over
time NFBR 83E.2 - Trout 83D.1 8.0 4.2 3.4 2.6 10.7 1.7 Increasing
Trout 83D.1 - Snow 83G.1 8.2 2.8 11.5 0.4 6.3 1.1 Decreasing
NFBR 83E.2 – Snow 83G.1 16.0 1.8 14.8 2.0 17.0 0.8 Increasing
Camp 83F.1 – Snow 83G.1 3.9 2.6 6.7 0.9 2.2 1.4 Decreasing
Camp 83F.2 - Camp 83F.1 10.0 0.8 n/a n/a 10.0 0.8 n/a
NFBR 83E.2 – NFBR 83E.3 3.2 1.2 2.9 0.3 3.4 1.4 No change
Trout 83D.3 – Trout 83D.1 n/a n/a n/a n/a n/a n/a n/a
* no monitoring for this year, stream temperature data unavailable n/a not enough monitoring data available to determine statistics
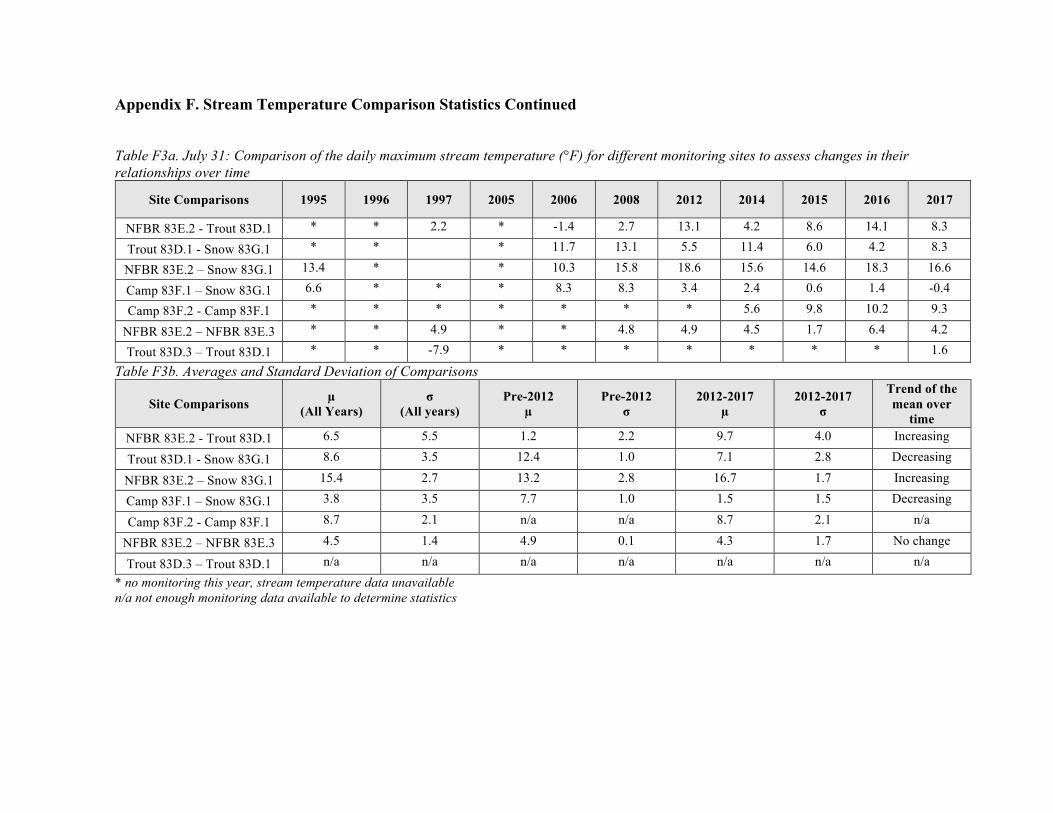
Appendix F. Stream Temperature Comparison Statistics Continued Table F3a. July 31: Comparison of the daily maximum stream temperature (°F) for different monitoring sites to assess changes in their relationships over time
Site Comparisons 1995 1996 1997 2005 2006 2008 2012 2014 2015 2016 2017
NFBR 83E.2 - Trout 83D.1 * * 2.2 * -1.4 2.7 13.1 4.2 8.6 14.1 8.3
Trout 83D.1 - Snow 83G.1 * * * 11.7 13.1 5.5 11.4 6.0 4.2 8.3
NFBR 83E.2 – Snow 83G.1 13.4 * * 10.3 15.8 18.6 15.6 14.6 18.3 16.6
Camp 83F.1 – Snow 83G.1 6.6 * * * 8.3 8.3 3.4 2.4 0.6 1.4 -0.4
Camp 83F.2 - Camp 83F.1 * * * * * * * 5.6 9.8 10.2 9.3
NFBR 83E.2 – NFBR 83E.3 * * 4.9 * * 4.8 4.9 4.5 1.7 6.4 4.2
Trout 83D.3 – Trout 83D.1 * * -7.9 * * * * * * * 1.6
Table F3b. Averages and Standard Deviation of Comparisons
Site Comparisons µ (All Years)
σ (All years)
Pre-2012 µ
Pre-2012 σ
2012-2017 µ
2012-2017 σ
Trend of the mean over
time NFBR 83E.2 - Trout 83D.1 6.5 5.5 1.2 2.2 9.7 4.0 Increasing
Trout 83D.1 - Snow 83G.1 8.6 3.5 12.4 1.0 7.1 2.8 Decreasing
NFBR 83E.2 – Snow 83G.1 15.4 2.7 13.2 2.8 16.7 1.7 Increasing
Camp 83F.1 – Snow 83G.1 3.8 3.5 7.7 1.0 1.5 1.5 Decreasing
Camp 83F.2 - Camp 83F.1 8.7 2.1 n/a n/a 8.7 2.1 n/a
NFBR 83E.2 – NFBR 83E.3 4.5 1.4 4.9 0.1 4.3 1.7 No change
Trout 83D.3 – Trout 83D.1 n/a n/a n/a n/a n/a n/a n/a
* no monitoring this year, stream temperature data unavailable n/a not enough monitoring data available to determine statistics
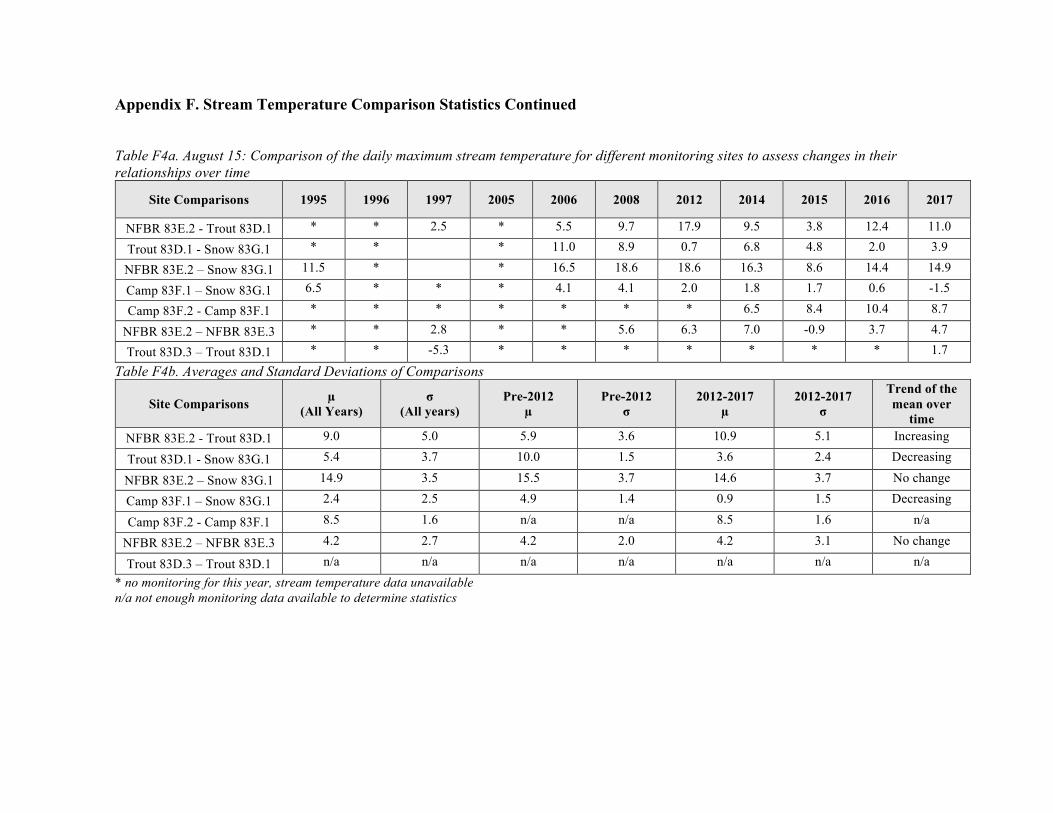
Appendix F. Stream Temperature Comparison Statistics Continued Table F4a. August 15: Comparison of the daily maximum stream temperature for different monitoring sites to assess changes in their relationships over time
Site Comparisons 1995 1996 1997 2005 2006 2008 2012 2014 2015 2016 2017
NFBR 83E.2 - Trout 83D.1 * * 2.5 * 5.5 9.7 17.9 9.5 3.8 12.4 11.0
Trout 83D.1 - Snow 83G.1 * * * 11.0 8.9 0.7 6.8 4.8 2.0 3.9
NFBR 83E.2 – Snow 83G.1 11.5 * * 16.5 18.6 18.6 16.3 8.6 14.4 14.9
Camp 83F.1 – Snow 83G.1 6.5 * * * 4.1 4.1 2.0 1.8 1.7 0.6 -1.5
Camp 83F.2 - Camp 83F.1 * * * * * * * 6.5 8.4 10.4 8.7
NFBR 83E.2 – NFBR 83E.3 * * 2.8 * * 5.6 6.3 7.0 -0.9 3.7 4.7
Trout 83D.3 – Trout 83D.1 * * -5.3 * * * * * * * 1.7
Table F4b. Averages and Standard Deviations of Comparisons
Site Comparisons µ (All Years)
σ (All years)
Pre-2012 µ
Pre-2012 σ
2012-2017 µ
2012-2017 σ
Trend of the mean over
time NFBR 83E.2 - Trout 83D.1 9.0 5.0 5.9 3.6 10.9 5.1 Increasing
Trout 83D.1 - Snow 83G.1 5.4 3.7 10.0 1.5 3.6 2.4 Decreasing
NFBR 83E.2 – Snow 83G.1 14.9 3.5 15.5 3.7 14.6 3.7 No change
Camp 83F.1 – Snow 83G.1 2.4 2.5 4.9 1.4 0.9 1.5 Decreasing
Camp 83F.2 - Camp 83F.1 8.5 1.6 n/a n/a 8.5 1.6 n/a
NFBR 83E.2 – NFBR 83E.3 4.2 2.7 4.2 2.0 4.2 3.1 No change
Trout 83D.3 – Trout 83D.1 n/a n/a n/a n/a n/a n/a n/a
* no monitoring for this year, stream temperature data unavailable n/a not enough monitoring data available to determine statistics
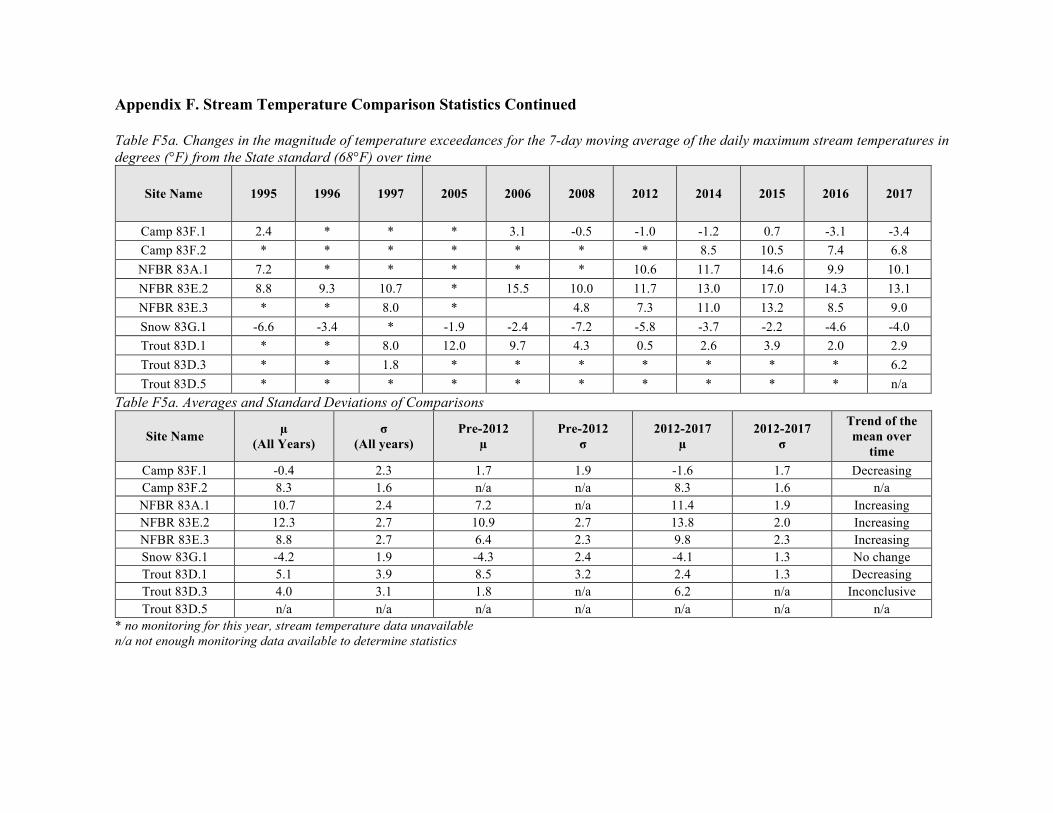
Appendix F. Stream Temperature Comparison Statistics Continued Table F5a. Changes in the magnitude of temperature exceedances for the 7-day moving average of the daily maximum stream temperatures in degrees (°F) from the State standard (68°F) over time
Site Name 1995 1996 1997 2005 2006 2008 2012 2014 2015 2016 2017
Camp 83F.1 2.4 * * * 3.1 -0.5 -1.0 -1.2 0.7 -3.1 -3.4 Camp 83F.2 * * * * * * * 8.5 10.5 7.4 6.8 NFBR 83A.1 7.2 * * * * * 10.6 11.7 14.6 9.9 10.1 NFBR 83E.2 8.8 9.3 10.7 * 15.5 10.0 11.7 13.0 17.0 14.3 13.1 NFBR 83E.3 * * 8.0 * 4.8 7.3 11.0 13.2 8.5 9.0 Snow 83G.1 -6.6 -3.4 * -1.9 -2.4 -7.2 -5.8 -3.7 -2.2 -4.6 -4.0 Trout 83D.1 * * 8.0 12.0 9.7 4.3 0.5 2.6 3.9 2.0 2.9 Trout 83D.3 * * 1.8 * * * * * * * 6.2 Trout 83D.5 * * * * * * * * * * n/a
Table F5a. Averages and Standard Deviations of Comparisons
Site Name µ (All Years)
σ (All years)
Pre-2012 µ
Pre-2012 σ
2012-2017 µ
2012-2017 σ
Trend of the mean over
time Camp 83F.1 -0.4 2.3 1.7 1.9 -1.6 1.7 Decreasing Camp 83F.2 8.3 1.6 n/a n/a 8.3 1.6 n/a NFBR 83A.1 10.7 2.4 7.2 n/a 11.4 1.9 Increasing NFBR 83E.2 12.3 2.7 10.9 2.7 13.8 2.0 Increasing NFBR 83E.3 8.8 2.7 6.4 2.3 9.8 2.3 Increasing Snow 83G.1 -4.2 1.9 -4.3 2.4 -4.1 1.3 No change Trout 83D.1 5.1 3.9 8.5 3.2 2.4 1.3 Decreasing Trout 83D.3 4.0 3.1 1.8 n/a 6.2 n/a Inconclusive Trout 83D.5 n/a n/a n/a n/a n/a n/a n/a
* no monitoring for this year, stream temperature data unavailable n/a not enough monitoring data available to determine statistics


