
AMEC – 2013

2
AMEC at a glance
* As at 11 July 2012
Delivering excellence

3
Where we work
Countries and locations where we work
Mongolia
Our 27,000 employees operate in 40 countries

4
AMEC revenue by markets and geography
4

5
Serving four markets across three geographic regions
Samir Brikho Chief Executive
Americas 57% of revenue*
Simon Naylor
Oil & Gas
Mining
Clean Energy
Environment &
Infrastructure
Europe 27% of revenue*
John Pearson
Growth Regions 16% of revenue*
Hisham Mahmoud
Supporting growth to 2015 and beyond
One AMEC approach
*Approximate, based on H1 2012. Full comparatives on new basis to be issued with FY results
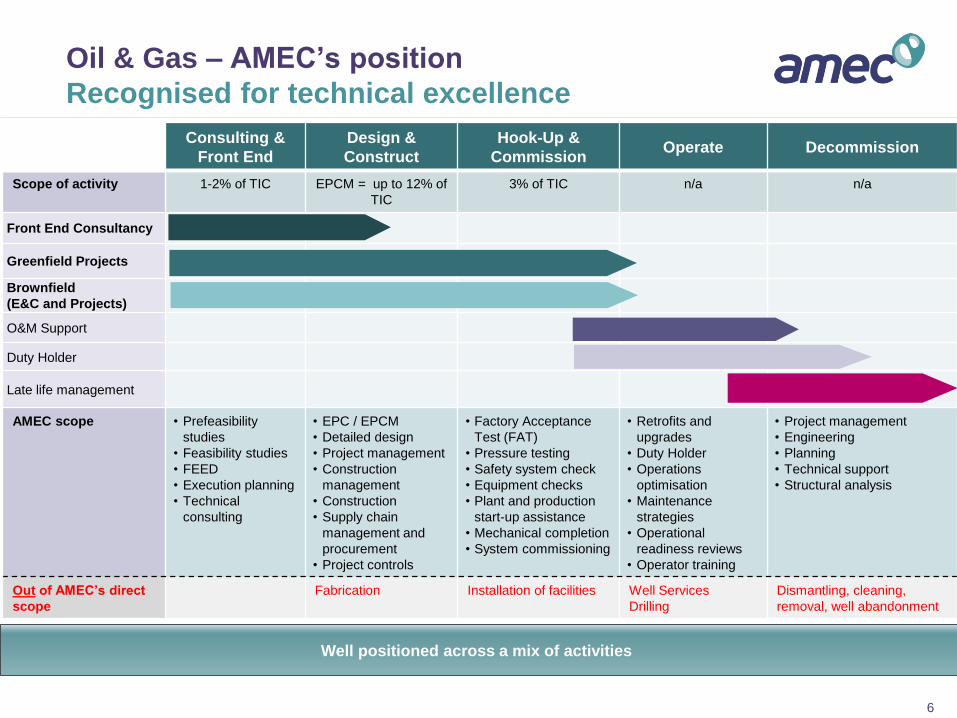
6
Consulting &
Front End
Design &
Construct
Hook-Up &
Commission Operate Decommission
Scope of activity 1-2% of TIC EPCM = up to 12% of
TIC
3% of TIC n/a n/a
Front End Consultancy
Greenfield Projects
Brownfield
(E&C and Projects)
O&M Support
Duty Holder
Late life management
AMEC scope • Prefeasibility
studies
• Feasibility studies
• FEED
• Execution planning
• Technical
consulting
• EPC / EPCM
• Detailed design
• Project management
• Construction
management
• Construction
• Supply chain
management and
procurement
• Project controls
• Factory Acceptance
Test (FAT)
• Pressure testing
• Safety system check
• Equipment checks
• Plant and production
start-up assistance
• Mechanical completion
• System commissioning
• Retrofits and
upgrades
• Duty Holder
• Operations
optimisation
• Maintenance
strategies
• Operational
readiness reviews
• Operator training
• Project management
• Engineering
• Planning
• Technical support
• Structural analysis
Out of AMEC’s direct
scope
Fabrication Installation of facilities Well Services
Drilling
Dismantling, cleaning,
removal, well abandonment
Well positioned across a mix of activities
Oil & Gas – AMEC’s position
Recognised for technical excellence
6
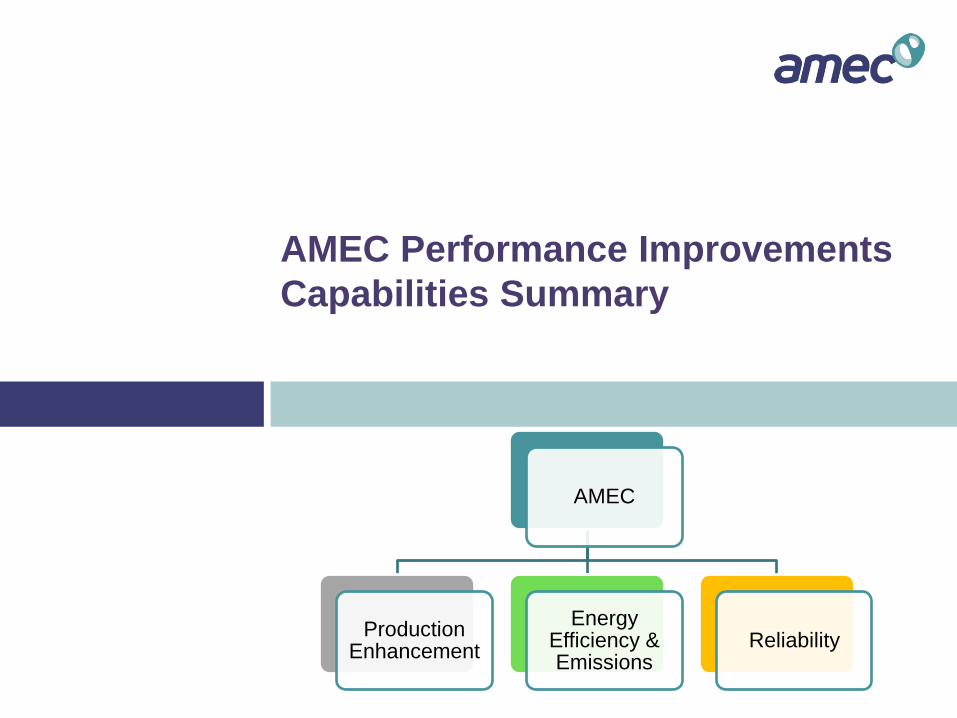
AMEC Performance Improvements
Capabilities Summary
AMEC
Production Enhancement
Energy Efficiency & Emissions
Reliability
8
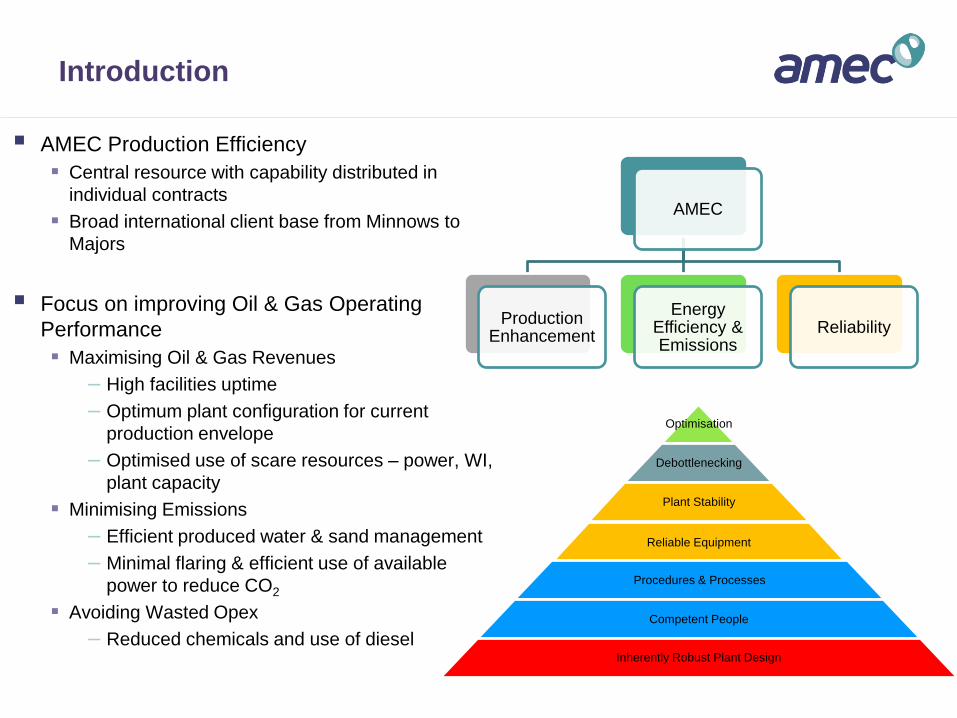
Introduction
AMEC Production Efficiency
Central resource with capability distributed in
individual contracts
Broad international client base from Minnows to
Majors
Focus on improving Oil & Gas Operating
Performance
Maximising Oil & Gas Revenues
– High facilities uptime
– Optimum plant configuration for current
production envelope
– Optimised use of scare resources – power, WI,
plant capacity
Minimising Emissions
– Efficient produced water & sand management
– Minimal flaring & efficient use of available
power to reduce CO2
Avoiding Wasted Opex
– Reduced chemicals and use of diesel
Optimisation
Debottlenecking
Plant Stability
Reliable Equipment
Procedures & Processes
Competent People
Inherently Robust Plant Design
AMEC
Production Enhancement
Energy Efficiency & Emissions
Reliability

9
What can AMEC bring to the table?
Experienced process facilitators to brainstorm
the issues and gain a common understanding
of the production enhancement opportunities
Technical expertise in niche areas
Measurement & Allocation
Choke Modelling & Product Loss Reporting
Well Testing, Allocation & Hydraulic Modelling
Separation & Produced Water Handling
Process Control
Gas Compression
Power Generation
Experience & proven methodologies for
Improving Facilities Uptime
Debottlenecking
Troubleshooting & Optimisation
Training, Competence & Knowledge Transfer
Process Studies, Operations Support &
Troubleshooting
Uptime Improvement & Debottlenecking
Process Control & Production Optimisation
Competency & Training
Production Enhancement
Choke Positions
Well Test
Data
Flow Assurance Issues
Slugging
Gas Lift
Distribution
Separator
Operating
Pressure Water Injection
Qw, Pw
Header Manifold
Configuration
*
*
*
*
SURG
E LI
NE
Surg
e Con
trol L
ine
b1
Rec
ycle
Trip
line
* Surge test points
Surg
e co
ntro
l lin
e m
odified
by
S.O
.
Rec
ycle
trip
line
mod
ified
by
S.O
.
n * b2
(note 1)
Actual Volumetric Flow or
Suction Flowmeter Pressure Drop
Com
pres
sor H
ead,
Pol
ytro
pic
Hea
d or
Com
pres
sion
Rat
io
100 % speed
90 % speed
80 % speed
70 % speed
Note 1 : n = number of S.O. occurances
Safe
ty O
n
S.O.
RT
RT
Gas Lift
Qg, Pg
Gas Compression
Optimised
Where?
Exhaust
Emissions
Power
Generation
Opex
££££

10
Typical Downward Asset Performance Cycle
Unreliable Power
No Water Injection
Lower Oil Revenue &
No Fuel Gas
Higher Opex & Lower
Investment
Poor GT Maintenance

11
Usual Challenges Encountered
Maximising plant uptime and hence production
Gas compression control & operability
Power generation uptime & cost of ownership
Operating excursions outside design basis
Workarounds – known equipment underperformance
Energy usage & hence emissions reduction
Sand management & mitigation
Poor well testing and measurement system validation
Alarm handling
Slugging
Opex reduction
Obsolescence (especially control systems)
Training & competence of personnel
Throughput
Time
Operating
Target
Design
Limit Operational Safety Margin
Break
Even
Loss
Shut Down
Profit
Partial Shut Down
Plant Upsets
Lost
Opportun
ity

12
0
1000
2000
3000
4000
5000
6000
7000
8000
9000
10000
Alarm ManagementReview
PC Alarm Tool
Visibility ofProduction Losses
Document Control
Change ControlProcedure
Settings Register
DCS Review
Mach. PerformanceMonitoring
Technical Query/Action Register
Capture OperatingConcerns
PC based tuningtool.
Control LoopAssessment
Training
Criticality BasedMaintenance
MaintenanceEffectiveness
Review
EquipmentReliability Review
Process UpsetReporting
PerformanceImprovementMeasurementOperational
Excellence TeamControl &
Operability Reviews
Override ControlProcedure
Controllers inManual Register
Operating & ControlPhilosophy
Single PointOwnership
CompetencyAssessment
Ergonomic Reviewof CCR
Vendor Assessment
Formal Induction
Advanced ControlReview
Capacity Review
ObsolescenceReview
ContingencyPlanning
Trip RationalisationReview
Steady StateProcess Model
Dynamic ProcessModel
DCS/ESD TX'sCompared on-line
CorrosionManagement
Best.(%)
Aver.(%)
Platform X Q204
This graph shows the highest
priority areas for performance
improvement. The further the
score from the centre of the web,
the larger the benefit that will be
obtained by focussing efforts on
that superior practice. All superior
practices have weighting factors.
Performance Improvement Chart
- Asset Benchmarking
13
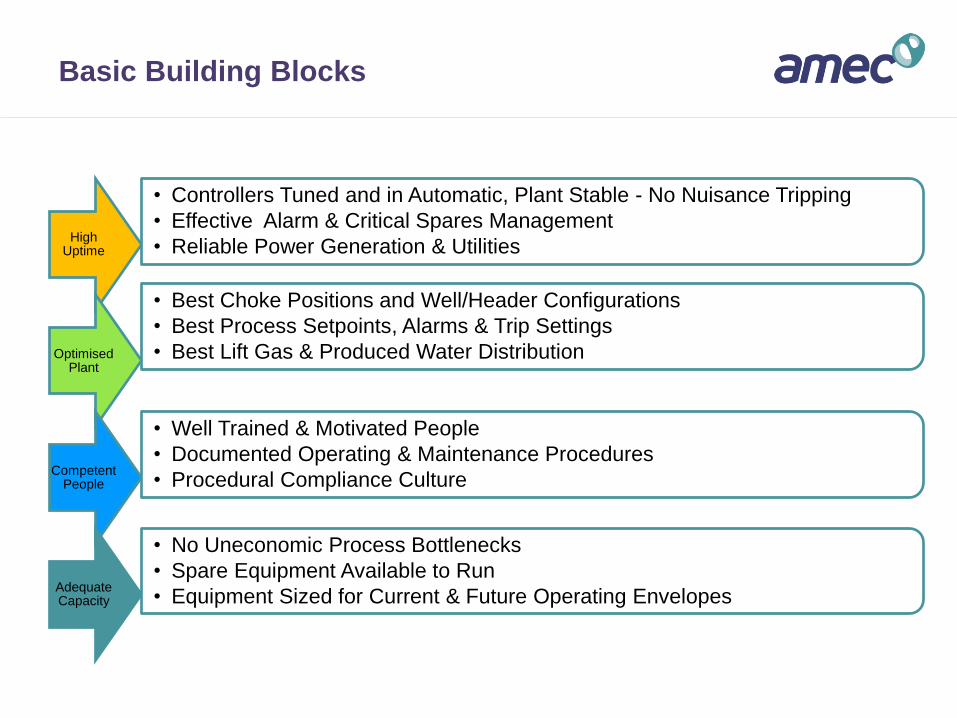
Basic Building Blocks
High Uptime
• Controllers Tuned and in Automatic, Plant Stable - No Nuisance Tripping
• Effective Alarm & Critical Spares Management
• Reliable Power Generation & Utilities
Optimised Plant
• Best Choke Positions and Well/Header Configurations
• Best Process Setpoints, Alarms & Trip Settings
• Best Lift Gas & Produced Water Distribution
Competent People
• Well Trained & Motivated People
• Documented Operating & Maintenance Procedures
• Procedural Compliance Culture
Adequate Capacity
• No Uneconomic Process Bottlenecks
• Spare Equipment Available to Run
• Equipment Sized for Current & Future Operating Envelopes

14
Energy Efficiency
Eliminating future gas shortages
Making the most of what you have left
Reducing effect of climate change
Maintaining your public perception
Fuel cost becoming greater part of
Opex
Improving your overall business benefits
AMEC uses 4 pronged approach....
Energy Assessments
Hands on
Energy Tracker
On-line real-time
Emissions Forecaster
Web based Competency & Training
Energy Efficiency & Emissions

15
Typical AMEC Asset Improvement Approach:
Chose one or more target assets (surface issues predominate)
Form a joint team with clear objectives & KPI’s
Provide coaching/training support
Facilitate brainstorm sessions
Identify what we know and don’t know
Agree key issues, risks & opportunities
Review production losses/choke model &/or trend data
Action Energy Assessment, Control & Operability Surveys
Agree quick wins
Implement together
Share & celebrate success
Repeat cycle

16
Typical Review Outcomes
Increased awareness of asset specific constraints
Many myths eliminated
Workarounds captured and challenged
True constraints documented and challenged as conditions change
Process interdependencies mapped out and mitigated
Critical equipment re-prioritised for urgent repair
More controllers in auto, fewer process trip inhibited
Lower alarm rates, less operator distraction
Improved and more regular well testing
Better daily optimisation “on the day” - increasing oil won
More efficient use of available power
Higher average water injection rates leading to more oil
Improved water quality and lower gaseous emissions/C02
All leading to higher production efficiency and higher revenues

17
“Can we Measure Benefits Delivered?”
Yes, results of our work on an asset are usually immediate & obvious!
More oil, less flaring
More stable plant
Fewer alarms
Actual UKCS Production Efficiency results:-
Oct 83%
Nov 88%
Dec 97%
Jan 94%
Feb 97%
14% increase achieved
Typical payback < 3 months, sometimes measured in hours!
75%
80%
85%
90%
95%
100%
Oct Nov Dec Jan Feb
Actual Production Efficiency for UKCS Asset
PE%

18
Control System Excellence
AMEC has World Class expertise in
Retrofit Gas Turbine Control Systems
Retrofit Compressor Control Systems
SCADA (Supervisory Control and Data Aquisition)
DCS (Distributed Control System)
Historian Systems
PID (Proportional Integral Derivative) Plant Tuning
Providing Field Service Support for all the above
Our Differentiators are simple:
A Proven Track Record of Technical Delivery, on Time & on Budget
Safe, Compliant Solutions that Meet all Applicable Standards
Competent, Highly Motivated People
Robust 24/7 Support Service
19
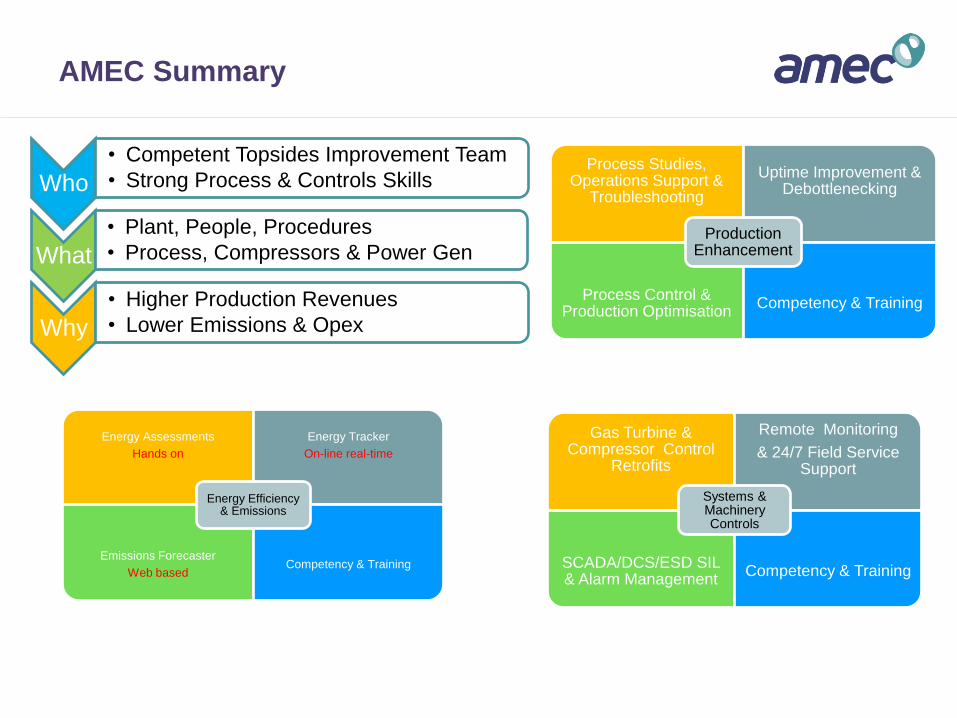
AMEC Summary
Who
• Competent Topsides Improvement Team
• Strong Process & Controls Skills
What
• Plant, People, Procedures
• Process, Compressors & Power Gen
Why
• Higher Production Revenues
• Lower Emissions & Opex
Process Studies, Operations Support &
Troubleshooting
Uptime Improvement & Debottlenecking
Process Control & Production Optimisation
Competency & Training
Production Enhancement
Gas Turbine & Compressor Control
Retrofits
Remote Monitoring
& 24/7 Field Service Support
SCADA/DCS/ESD SIL & Alarm Management
Competency & Training
Systems & Machinery Controls
Energy Assessments
Hands on
Energy Tracker
On-line real-time
Emissions Forecaster
Web based Competency & Training
Energy Efficiency & Emissions

Steady State Operations

21
Asset Management
Partnership in delivery across AMEC

22
ISC – Key features
• Highly integrated joint contractor/customer organisation
• No man marking, common tasks and targets, company personnel working for contractor
management and vice verse, soft issues given the same priority as “traditional” performance
measures, continual improvement embedded in the culture of the team.
• Performance assurance is driven through scorecards
• Integrated Asset performance scorecard with true win-win orientation.
• Multi location (front office/back office concept)
• Work done at the most cost effective location with extensive use of e-technology.
• Full spectrum of ISC services
• Comprehensive range of services provided by the ISC allows for maximum dilution of overheads.
• Highly focussed delivery philosophy
• Excellent delivery is a team expectation; all delivery failures are investigated to determine
learning opportunities.
• Benefits to Customer
• Open book on commercial and all delivery aspects
• Significant increases in efficiency, both on and offshore, throughout the duration of the contract
led to the client extending the contract duration.
• Campaign Maintenance: the aggregation of assets has enabled campaign maintenance to be
introduced, leading to savings of up to 30% on specific maintenance routines.

23
ISC - Experience
• Shell – Sigma 3 Integrated Support Contract
This contract provided engineering, maintenance and offshore services on the
installations that make up the Mature, Brent and Central Assets in the UKCS since
2002 - 2011
• BP – Forties Pipeline & Unity Support Contract
This contract has been providing engineering, maintenance, inspection, testing and
monitoring for the Forties Pipeline System since 1995
Successful delivery recognised through a further contract extension awarded in 2009
coupled with scope extension to include the Unity platform
• OneGas (Shell/Nam) Integrated Support Contract
This contract has been providing management, maintenance, modifications, logistical
and engineering support for 53 Shell and Nam Southern North Sea offshore assets
including two onshore gas processing plants since 2003
Successful delivery recognised through a further contract extension awarded in 2009

24
Maintenance Support Capability
• Criticality review/assessments of systems & equipment
• Maintenance philosophies & strategies
• Improvement plans
• CMMS Development, Construction & Population
• Maintainability Reviews
• Maintenance Planning, Programming and Optimisation
• Problem Solving & Troubleshooting
• Supervision & Labour Provision
• Vendor & Resource Management

25
Asset Improvement Programmes
BG Armada FLE Project
• 2009 / 10
• Extensive facilities upgrade
• Large offshore campaign
• Flotel
• Peak Manning offshore
• 220 trades
• 45 supervision & Admin
• Continuous Programme
Upgrade Projects
• Scale
• Multi Asset
• Multi Discipline
• Integrated Asset Plan
• Barge Management
Dunlin Improvement Programme
• Safety Case thorough review
• Service Water
• Drilling package Rejuvenation
• Shutdowns
• Systems Review
• Competence Development
PD

Performance Management

27
Production & Maintenance Management
• Production maintained when Operation below minimum turndown
• Highest WI rate , 211k BPD, for 6 years
• Production Downtime – planned and unplanned 8.8 % for 2012
• Maintenance Performance – study reduced SC tags from 17,000 to circa 5000
• SC backlog has reached lowest levels in 5 years for maintenance, the
inspection scope is currently under going a major review.
• Customer feedback has shown year on year improvement – strong relationship
with FEL
• Engineering: Picked up a lot of non-AMEC scopes e.g. GT3 £10 mm
• Worked within opex budgets over last 3 years
• Efficiency programme has realized £1.7mm year on year savings in 2012
• HSE - year on year reduction on DO’s, and HCR only one significant over a 3
year period.
• LTI’s 2010 – 3, 2011 – 1, 2012 – 0
• Dunlin current run of 490 days since last LTI
• Implemented offshore safety coaching program

28
Commercial Alignment
Common Approach To :-
• Terms & Conditions
• Risk Management
• Business Objectives
• Reporting
• Governance
• Performance
LEVEL 1 - Project (Overall Project)
LEVEL 2 - Filter (Individual Project)
LEVEL 2a - Sub-filter (Unit Grouping)
LEVEL 3 - Unit (Individual Units)

29
KPI
30
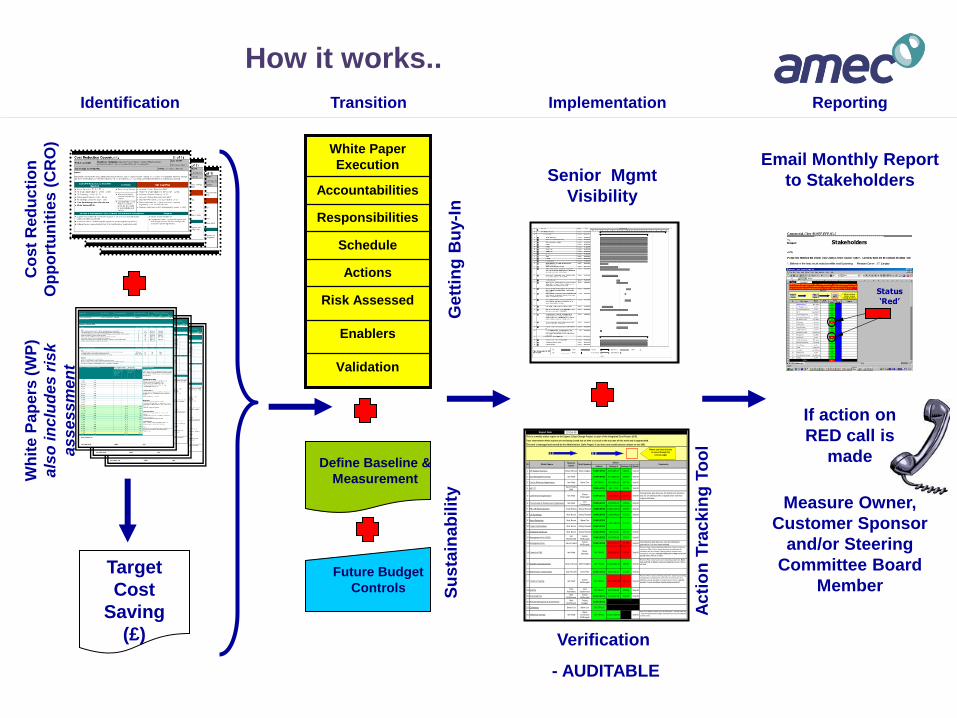
Identification Transition
Enablers
Risk Assessed
Validation
Actions
Schedule
Responsibilities
Accountabilities
White Paper
Execution Senior Mgmt
Visibility
Co
st
Red
uc
tio
n
Op
po
rtu
nit
ies
(C
RO
)
Wh
ite P
ap
ers
(W
P)
als
o in
clu
de
s r
isk
as
se
ssm
en
t
Action
Tracking
Tool
Define Baseline &
Measurement
Target
Cost
Saving
(£)
Future Budget
Controls
Verification
- AUDITABLE
Implementation
Su
sta
inab
ilit
y
22-Oct-08
Actions Savings £ Savings % Month
1 UP Support Services Brian Gilmour Mike Rodgers COMPLETED £525,286.07 100.0% Sep-08
2 Doc Management Group Iain Watt - COMPLETED £173,835.00 100.0% Sep-08
3 Cost & Planning Organisation Iain Watt Steve Cox ON TRACK £294,392.00 107.7% Sep-08
4 HR / ITKaren Hailes
(IW)- COMPLETED £87,777.00 100.0% Sep-08
5 Commercial Organisation Iain WattSusan
McDougallCOMPLETED £77,009.00 97.4% Sep-08
Saving below plan because the headcount reduction
was for an individual with a slightly lower rate than
original estimate.
6 Procurement & Warehouse Organisation Iain WattJon
ChristiansenCOMPLETED £229,926.00 116.5% Sep-08
7 PE / CE Rationalisation Andy McKay Jimmy Russell COMPLETED £1,501,420.00 103.6% Sep-08
8 CP Screening Muir Bruce Jimmy Russell COMPLETED £1,885,842.00 571.5% Sep-08
9 Norm Reduction Muir Bruce Steve Cox COMPLETED
10 Project Deliverables Muir Bruce Jimmy Russell COMPLETED
11 As Build & Close-out Muir Bruce Jimmy Russell COMPLETED £93,501.00 144.0% Sep-08
12 Management Fee HSEQIain
MacDonald
Susan
McDougallCOMPLETED £315,938.00 123.6% Sep-08
13 Management Fee Karen HailesSusan
McDougallCOMPLETED £519,453.00 97.7% Sep-08
Saving below plan because one demobiliastion
planned for July has been delayed.
14 Control of P&E Iain WattSteve
McHattieON TRACK -£292,306.83 -23.2% Sep-08
Recovery Plan in place and being progressed. There has been an
increase in P&E in July in August because of mobilisation for
shutdowns but this situation is being carefully monitored and
managed on all assets. Manage mobilisation of P&E and ensure
prompt return. Plan is on track
15 Standby / Downmanning Brian Gilmour Mike Rodgers ON TRACK £1,352,583.36 156.4% Sep-08
Recovery Plan in place and successfully being progressed. Every
time we STOP or DELAY someone mobilising it costs. Plan is
on track
16 Maintenance Organisation Alan Russell Chris Paul COMPLETED £584,108.00 107.3% Sep-08
17 Travel & Training Iain WattSusan
McDougallON TRACK -£1,263,730.00 -467.5% Sep-08
Recovery Plan in place and being progressed. Spending now being
managed but not expected to come back on track by year end.
Additional savings identified to compensate for overrun. Ask the
question ‘is non mandatory training really necessary’?
18 SORT4Paul
Abernethy
Jack
StephensonON TRACK £477,458.00 102.8% Sep-08
19 Overhead FeeAlan
McPherson
Susan
McDougallCOMPLETED £420,000.28 100.0% Sep-08
20 Reward Mechanism & GovernanceAlan
McPherson
Orietta
RuggierCOMPLETED
21 Estimating Steve Cox Steve Cox ON TRACK
22 Additional Savings Iain Watt
Steve
Cox/Susan
McDougall
ON TRACK £1,237,030.82 Sep-08
New CRO added to tracker for July 2008 report. Savings areas are
: S3/ICP Implementation budget underspend and cost normalisation
to 2007 prices.
CommentsShell Sponsor
171.7%£1,267,964.00 Sep-08
Measure
OwnerWhite Papers
Your intervention when actions are not being closed out on time is crucial to the success of this work and is appreciated.
Report Date
This is a weekly status report on the Sigma 3 Step Change Project, as part of the Integrated Cost Project (ICP).
IDStatus
This tool is managed and owned by the Administrator (Julie Paget). If you have any trouble please contact on ext 3801
Please use these buttons
to move through the
various pages
Acti
on
Tra
ckin
g T
oo
l
Gett
ing
Bu
y-I
n
Reporting
Stakeholders
Status
‘Red’
StakeholdersStakeholders
Status
‘Red’
Email Monthly Report
to Stakeholders
If action on
RED call is
made
Measure Owner,
Customer Sponsor
and/or Steering
Committee Board
Member
How it works..

31
It works..! Multi-asset examples
Supply Chain
– Delivered ahead of high White Paper target
– Introduced additional savings above
original target
Planned saving: £ 2.4m
Actual Saving: £ 3.5m
Organisational Ratinalisation - Efficiency
– Efficiency based organisational changes
Actual Saving: £ 5.7m
Planned FTE reduction 104
Actual FTE reduction 130
Commercial
– Delivered ahead of targets
– Reduced Overheads
– Reduced travel costs and systemic
overtime
Planned saving: £ 2.5m
Actual Saving: £ 6.9m
Organisational Ratinalisation - Demand
– Increased focus on demand management
Actual Saving: £ 5.2m
Planned FTE reduction 126
Actual FTE reduction 126

32
It works..! Single asset examples
Supply Chain & Logistics
– Improved planning of ad-hoc charters
– Flights/ supply boats optimised
Planned saving: £ 900k
Actual Saving: £ 1100k
People/ Organisational Efficiency
– Efficiency based organisational changes
– Resource sharing, FTE reduction
Planned saving: £ 350k
Actual Saving: £ 350k
Modifications
– Change to minimum deliverables
appraoch
Planned saving: £ 200k
Actual Saving: £ 150k
(Scope reduction, less savings available)
Subcontractor Performanace Management
– Increased focus on S/C performance
management
Actual Saving: £ 100k


