
Technical Paper No. 353
Liliana C. Naves
Alaska Migratory Bird Subsistence Harvest Estimates, 2008, Alaska Migratory Bird Co-Management Council
July 2010
Alaska Department of Fish and Game Division of Subsistence
Alaska Migratory Bird Co-Management Council

Symbols and AbbreviationsThe following symbols and abbreviations, and others approved for the Système International d’Unités (SI), are used without definition in the following reports by the Division of Subsistence. All others, including deviations from definitions listed below, are noted in the text at first mention, as well as in the titles or footnotes of tables, and in figure or figure captions.
Weights and measures (metric)centimeter cmdeciliter dLgram ghectare hakilogram kgkilometer kmliter Lmeter mmilliliter mLmillimeter mm
Weights and measures (English)cubic feet per second ft3/sfoot ftgallon galinch inmile minautical mile nmiounce ozpound lbquart qtyard yd
Time and temperature day ddegrees Celsius °Cdegrees Fahrenheit °Fdegrees kelvin Khour hminute minsecond s
Physics and chemistryall atomic symbolsalternating current ACampere Acalorie caldirect current DChertz Hzhorsepower hphydrogen ion activity pH (negative log of)parts per million ppmparts per thousand ppt, ‰volts Vwatts W
GeneralAlaska Department of
Fish and Game ADF&GAlaska Administrative Code AACall commonly accepted abbreviations
e.g., Mr., Mrs., AM, PM, etc.all commonly accepted professional
titles e.g., Dr., Ph.D., R.N., etc.at @compass directions: east E north N south S west Wcopyright ©corporate suffixes: Company Co. Corporation Corp. Incorporated Inc. Limited Ltd.District of Columbia D.C.et alii (and others) et al.et cetera (and so forth) etc.exempli gratia (for example) e.g.Federal Information Code FICid est (that is) i.e.latitude or longitude lat. or long.monetary symbols (U.S.) $, ¢months (tables and figures): first three letters Jan, ... ,Decregistered trademark ®trademark ™United States (adjective) U.S.United States of America (noun) USAUnited States Code U.S.C.U.S. state use two-letter abbreviations
e.g., AK, WA
Measures (fisheries)fork length FLmideye-to-fork MEFmideye-to-tail-fork METFstandard length SLtotal length TL
Mathematics, statisticsall standard mathematical signs,
symbols and abbreviationsalternate hypothesis HAbase of natural logarithm ecatch per unit effort CPUEcoefficient of variation CVcommon test statistics (F, t, χ2, etc.)confidence interval CIcorrelation coefficient (multiple) R correlation coefficient (simple) r covariance covdegree (angular ) °degrees of freedom dfexpected value Egreater than >greater than or equal to ≥harvest per unit effort HPUEless than <less than or equal to ≤logarithm (natural) lnlogarithm (base 10) loglogarithm (specify base) log2, etc.minute (angular) ‘not significant NSnull hypothesis HOpercent %probability Pprobability of a type I error
(rejection of the null hypothesis when true) α
probability of a type II error (acceptance of the null hypothesis when false) β
second (angular) “standard deviation SDstandard error SEvariance: population Var sample var

TECHNICAL PAPER NO. 353
Alaska Department of Fish and Game Division of Subsistence
333 Raspberry Road, Anchorage, Alaska 99518-1599
July 2010
Cover Photograph
Todd Fritze of Dillingham hunts for sandhill cranes and Canada geese in spring. Photograph by Annie Fritze, used with permission.
This report was funded by the U.S. Fish and Wildlife Service under cooperative agreement (number 70181-7-J653 COOP-07-118) between the U.S. Fish and Wildlife Service and the Alaska Department of Fish and Game, Division of Subsistence.
Liliana C. Naves Alaska Department of Fish and Game Division of Subsistence, Anchorage
Alaska Migratory Bird Subsistence Harvest Estimates, 2008,
Alaska Migratory Bird Co-Management Council

Liliana C. NavesAlaska Department of Fish and Game, Division of Subsistence
333 Raspberry Road, Anchorage, AK 99567-1599
This document should be cited as:Naves, L.C. 2010. Alaska Migratory Bird Subsistence Harvest Estimates, 2008, Alaska Migratory Bird Co-
Management Council. Alaska Department of Fish and Game Division of Subsistence, Technical Paper No. 353, Anchorage.
The Alaska Department of Fish and Game (ADF&G) administers all programs and activities free from discrimination based on race, color, national origin, age, sex, religion, marital status, pregnancy, parenthood, or disability. The department administers all programs and activities in compliance with Title VI of the Civil Rights Act of 1964, Section 504 of the Rehabilitation Act of 1973, Title II of the Americans with Disabilities Act (ADA) of 1990, the Age Discrimination Act of 1975, and Title IX of the Education Amendments of 1972.If you believe you have been discriminated against in any program, activity, or facility please write:
ADF&G ADA Coordinator, P.O. Box 115526, Juneau, AK, 99811-5526U.S. Fish and Wildlife Service, 4040 N. Fairfax Drive, MS 2042, Arlington, VA, 22203Office of Equal Opportunity, U.S. Department of the Interior, 1849 C Street NW, MS 5230, Washington DC 20240
The department’s ADA Coordinator can be reached via phone at the following numbers:(VOICE) 907-465-6077, (Statewide Telecommunication Device for the Deaf) 1-800-478-3648, (Juneau TDD) 907-465-3646, or (FAX) 907-465-6078
For information on alternative formats and questions on this publication, please contact:ADF&G Division of Subsistence at www.subsistence.adfg. state.ak.us.
The Division of Subsistence Technical Paper series was established in 1979 and represents the most complete collection of information about customary and traditional uses of fish and wildlife resources in Alaska. The papers cover all regions of the state. Some papers were written in response to specific fish and game management issues. Others provide detailed, basic information on the subsistence uses of particular communities which pertain to a large number of scientific and policy questions. Technical Paper series reports are available through the Alaska State Library and on the Internet: http://www.subsistence.adfg.state.ak.us. This publication has undergone editorial and professional review.
i
TABLE OF CONTENTSLIST OF TABLES ...........................................................................................................................iii
LIST OF FIGURES ........................................................................................................................iv
LIST OF APPENDICES ...............................................................................................................iv
ABSTRACT ........................................................................................................................................ v
INTRODUCTION ............................................................................................................................ 1AMBCC SuBSiStenCe HArveSt ASSeSSMent ProgrAM .......................................................................... 1AMBCC MeMBer orgAnizAtionS ......................................................................................................... 2uSeS of tHe inforMAtion of tHe SuBSiStenCe HArveSt Survey ............................................................. 3
METHODS ......................................................................................................................................... 4DAtA ColleCtion ................................................................................................................................... 4
Regions, Subregions, Villages ................................................................................................................ 4Sampling Methods ................................................................................................................................ 5
“None, Low, High” Stratification ........................................................................................................ 6Census: 100% sampling ..................................................................................................................... 6Simple Random Sampling ................................................................................................................... 6“Harvester, Other” Stratification ........................................................................................................ 6
Survey Year and Survey Seasons ............................................................................................................ 6Village and Household Consent ............................................................................................................. 7Household “No-Contact” and Refusals ................................................................................................... 7Reporting Harvests ............................................................................................................................... 7Species Represented on the Harvest Report Form .................................................................................. 20Data Transfer ..................................................................................................................................... 20Data Management and Program Reporting ............................................................................................ 20
DAtA AnAlySiS ..................................................................................................................................... 21Geographic Scale of Harvest Estimates ................................................................................................ 21Expansion at the Subregional Level ..................................................................................................... 21Expansion at Regional Level ............................................................................................................... 23Conversion of Egg Volume to Numbers of Eggs .................................................................................... 23Reports of Egg Harvest in Fall ............................................................................................................. 23Household Participation Rates ............................................................................................................. 24
RESULTS ..........................................................................................................................................252008 HArveSt eStiMAteS ..................................................................................................................... 28HouSeHolD PArtiCiPAtion rAteS 2004–2008 ....................................................................................... 60
ACKNOWLEDGMENTS ...........................................................................................................61
ii
TABLE OF CONTENTS continued...
REFERENCES CITED ................................................................................................................62
APPENDICES .................................................................................................................................65APPenDix A.–regionS, SuBregionS, AnD villAgeS inCluDeD in tHe 2004–2008 HArveSt eStiMAteS. .... 65APPenDix B.–HArveSt rePort forMS (MAin forM, ~50% of originAl Size). ......................................... 72APPenDix C.–SPeCieS rePreSenteD in tHe 3 verSionS of tHe HArveSt rePort forM AnD
tHeir DiStriBution rAnge in AlASkA. ................................................................................................ 75APPenDix D.–forMulAS to CAlCulAte SuBregion eStiMAteD HArveStS, vAriAnCeS, AnD
ConfiDenCe intervAlS (3-StAge StrAtifieD CluSter SAMPling). ......................................................... 80APPenDix e.–forMulAS to CAlCulAte region eStiMAteD HArveStS, vAriAnCeS, AnD
ConfiDenCe intervAlS (4-StAge StrAtifieD CluSter SAMPling). ......................................................... 82
iii
LIST OF TABLESTable 1.–Regions surveyed from 2004–2008. .............................................................................................................................. 5
Table 2.–Seasonal survey coverage and household visits. ............................................................................................................ 8
Table 3.–Number of villages and households included in data analysis, 2004–2008. ................................................................ 22
Table 4.–Estimated conversion factors, egg volume to number of eggs..................................................................................... 24
Table 5.–Annual harvest estimates total birds at the subregional and regional levels, 2004–2008. ........................................... 26
Table 6.–Annual harvest estimates total bird eggs at the subregional and regional levels, 2004–2008. .................................... 27
Table 7.–Estimated harvest of birds, Aleutian–Pribilof Islands Region, 2008. .......................................................................... 28
Table 8.–Estimated harvest of eggs, Aleutian–Pribilof Islands Region, 2008. ........................................................................... 29
Table 9.–Estimated harvest of birds, Aleutian–Pribilof Islands Region, Aleutian–Pribilof Villages Subregion, 2008. ............. 30
Table 10.–Estimated harvest of eggs, Aleutian–Pribilof Islands Region, Aleutian–Pribilof Villages Subregion, 2008. ............ 31
Table 11.–Estimated harvest of birds, Aleutian–Pribilof Islands Region, Unalaska Subregion, 2008. ...................................... 32
Table 12.–Estimated harvest of eggs, Aleutian–Pribilof Islands Region, Unalaska Subregion, 2008........................................ 33
Table 13.–Estimated harvest of birds, Bristol Bay Region, 2008. .............................................................................................. 34
Table 14.–Estimated harvest of eggs, Bristol Bay Region, 2008. ............................................................................................... 35
Table 15.–Estimated harvest of birds, Bristol Bay Region, South Alaska Peninsula Subregion, 2008. ..................................... 36
Table 16.–Estimated harvest of eggs, Bristol Bay Region, South Alaska Peninsula Subregion, 2008. ..................................... 37
Table 17.–Estimated harvest of birds, Bristol Bay Region, Southwest Bristol Bay Subregion, 2008........................................ 38
Table 18.–Estimated harvest of eggs, Bristol Bay Region, Southwest Bristol Bay Subregion, 2008. ....................................... 39
Table 19.–Estimated harvest of birds, Bristol Bay Region, Dillingham Subregion, 2008. ........................................................ 40
Table 20.–Estimated harvest of eggs, Bristol Bay Region, Dillingham Subregion, 2008. ......................................................... 41
Table 21.–Estimated harvest of birds, Yukon–Kuskokwim Delta Region, 2008. ....................................................................... 42
Table 22.–Estimated harvest of eggs, Yukon–Kuskokwim Delta Region, 2008. ....................................................................... 43
Table 23.–Estimated harvest of birds, Yukon–Kuskokwim Delta Region, South Coast Subregion, 2008. ................................ 44
Table 24.–Estimated harvest of eggs, Yukon–Kuskokwim Delta Region, South Coast Subregion, 2008. ................................. 45
Table 25.–Estimated harvest of birds, Yukon–Kuskokwim Delta Region, Mid Coast Subregion, 2008. ................................... 46
Table 26.–Estimated harvest of eggs, Yukon–Kuskokwim Delta Region, Mid Coast Subregion, 2008. ................................... 47
Table 27.–Estimated harvest of birds, Yukon–Kuskokwim Delta Region, North Coast Subregion, 2008. ................................ 48
Table 28.–Estimated harvest of eggs, Yukon–Kuskokwim Delta Region, North Coast Subregion, 2008. ................................. 49
Table 29.–Estimated harvest of birds, Yukon–Kuskokwim Delta Region, Lower Yukon Subregion, 2008. .............................. 50
Table 30.–Estimated harvest of eggs, Yukon–Kuskokwim Delta Region, Lower Yukon Subregion, 2008. .............................. 51
Table 31.–Estimated harvest of birds, Yukon–Kuskokwim Delta Region, Lower Kuskokwim Subregion, 2008. .................... 52
Table 32.–Estimated harvest of eggs, Yukon–Kuskokwim Delta Region, Lower Kuskokwim Subregion, 2008. ..................... 53
Table 33.–Estimated harvest of birds, Yukon–Kuskokwim Delta Region, Bethel Subregion, 2008. ......................................... 54
Table 34.–Estimated harvest of eggs, Yukon–Kuskokwim Delta Region, Bethel Subregion, 2008. .......................................... 55
Table 35.–Estimated harvest of birds, North Slope Region, 2008. ............................................................................................. 56
Table 36.–Estimated harvest of eggs, North Slope Region, 2008............................................................................................... 57
Table 37.–Estimated harvest of birds, Interior Alaska Region, Yukon–Koyukuk Subregion, 2008. .......................................... 58
Table 38.–Estimated harvest of eggs, Interior Alaska Region, Yukon–Koyukuk Subregion, 2008. .......................................... 59
Table 39.–Household participation rates, 2004–2008. ................................................................................................................ 60
iv
LIST OF FIGURESFigure 1.–Regions and subregions of the AMBCC migratory bird subsistence harvest survey. .................................................. 9
Figure 2.–Gulf of Alaska-Cook Inlet and Upper Copper River regions. .................................................................................... 10
Figure 3.–Kodiak Archipelago region. ........................................................................................................................................ 11
Figure 4.–Aleutian–Pribilof Islands region. ................................................................................................................................ 12
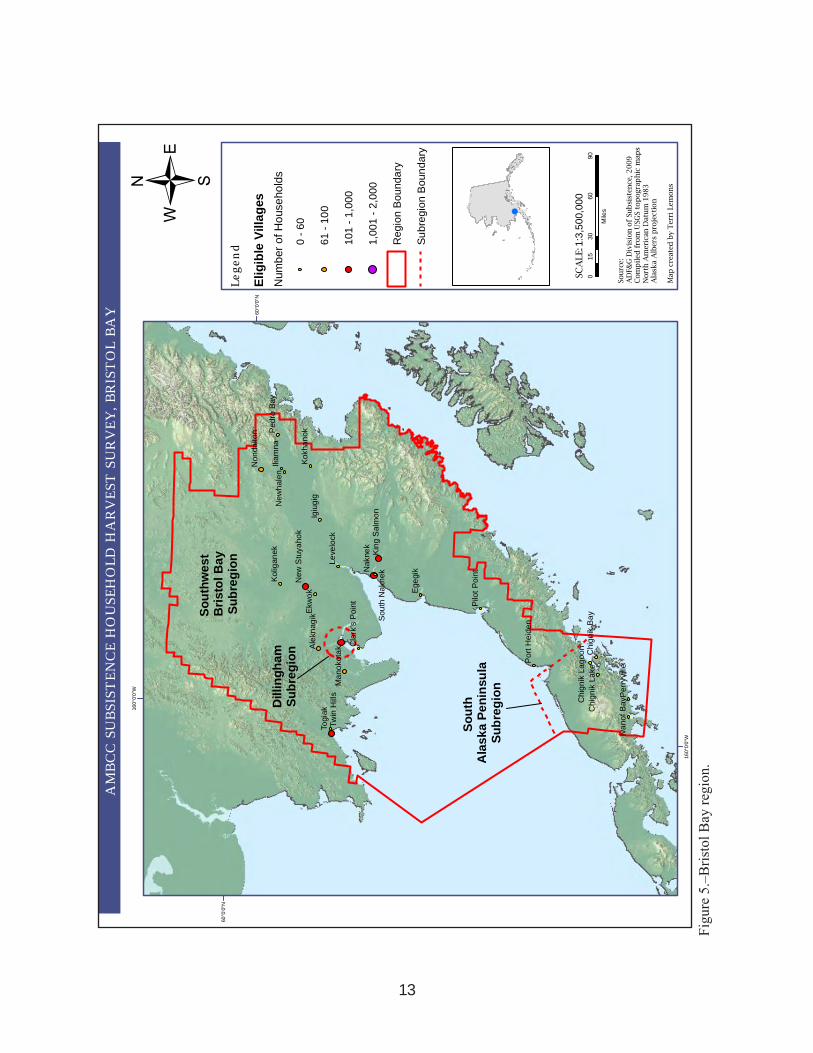
Figure 5.–Bristol Bay region. ...................................................................................................................................................... 13
Figure 6.–Yukon–Kuskokwim Delta region. .............................................................................................................................. 14
Figure 7.–Bering Strait-Norton Sound region. ........................................................................................................................... 15
Figure 8.–Northwest Arctic region. ............................................................................................................................................ 16
Figure 9.–North Slope region. .................................................................................................................................................... 17
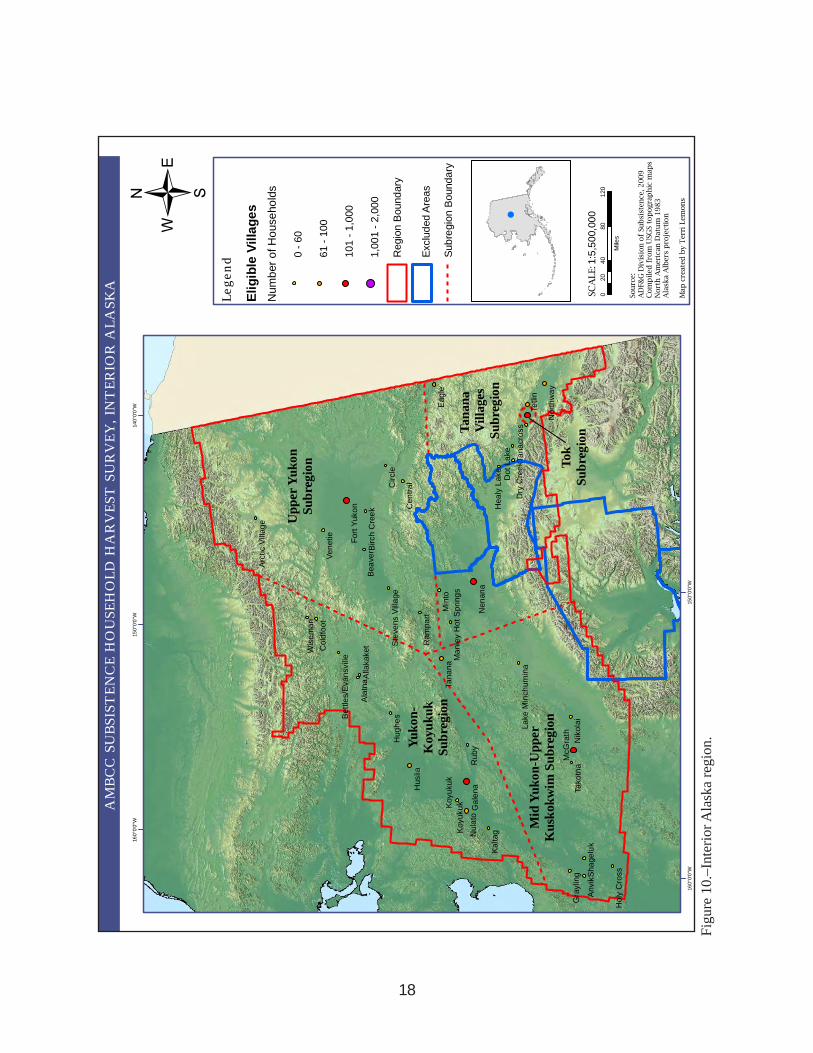
Figure 10.–Interior Alaska region. .............................................................................................................................................. 18
Figure 11.–Southeast Alaska region. ........................................................................................................................................... 19
LIST OF APPENDICESAppendix A.–Regions, subregions, and villages included in the 2004–2008 harvest estimates. ............................................... 65
Appendix B.–Harvest report forms (main form, ~50% of original size). ................................................................................... 72
Appendix C.–Species represented in the 3 versions of the harvest report form and their distribution range in Alaska. ............ 75
Appendix D.–Formulas to calculate subregion estimated harvests, variances, and confidence intervals (3-stage stratified cluster sampling). ............................................................................................. 80
Appendix E.–Formulas to calculate region estimated harvests, variances, and confidence intervals (4-stage stratified cluster sampling). ............................................................................................. 82

v
ABSTRACTThis report presents subsistence harvest estimates of migratory birds and their eggs in Alaska for the data year 2008. Data were gathered through the harvest assessment program of the Alaska Migratory Bird Co-Management Council. This program relies on collaboration among the U.S. Fish and Wildlife Service, the Alaska Department of Fish and Game, and a number of regional Alaska Native organizations. Information obtained by this program is used to evaluate federal subsistence harvest regulations, to document customary and traditional uses of migratory birds in Alaska, and to plan for the continued harvest and conservation of birds. Participation in the harvest survey is voluntary at both the village and household levels. The survey covers spring, summer, and fall harvests in most regions. Some regions also have a winter survey. Harvest estimates are based on a stratified clustered sampling. The sample frame encompasses all households in regions eligible for the subsistence harvest of migratory birds and their eggs in Alaska. Households are the primary sampling unit. Data at the household level are confidential and data at the village level are considered sensitive. Clusters of villages (subregions) with similar harvest patterns allow expansion of reported harvests in surveyed villages to nonsurveyed villages in the same subregion. Subregions are grouped into regions, which approximately correspond to the designated migratory bird management regions. Within villages, households are stratified by harvest level. Villages and regions are surveyed on a rotating schedule, which can be adjusted based on monitoring priorities and budget constraints. In 2008, the harvest survey was conducted in 5 regions: Aleutian–Pribilof Islands, Bristol Bay, Yukon–Kuskokwim Delta, North Slope, and Interior Alaska (although only in the Yukon–Koyukuk subregion).
Key words: Alaska Migratory Bird Co-Management Council, AMBCC, migratory birds, migratory bird eggs, subsistence harvest, subsistence hunting, subsistence harvest estimates, ducks, geese, swans, cranes, grouse, seabirds, shorebirds, grebes, loons.

vi
1
INTRODUCTIONAMBCC SuBSiStenCe HArveSt ASSeSSMent ProgrAM
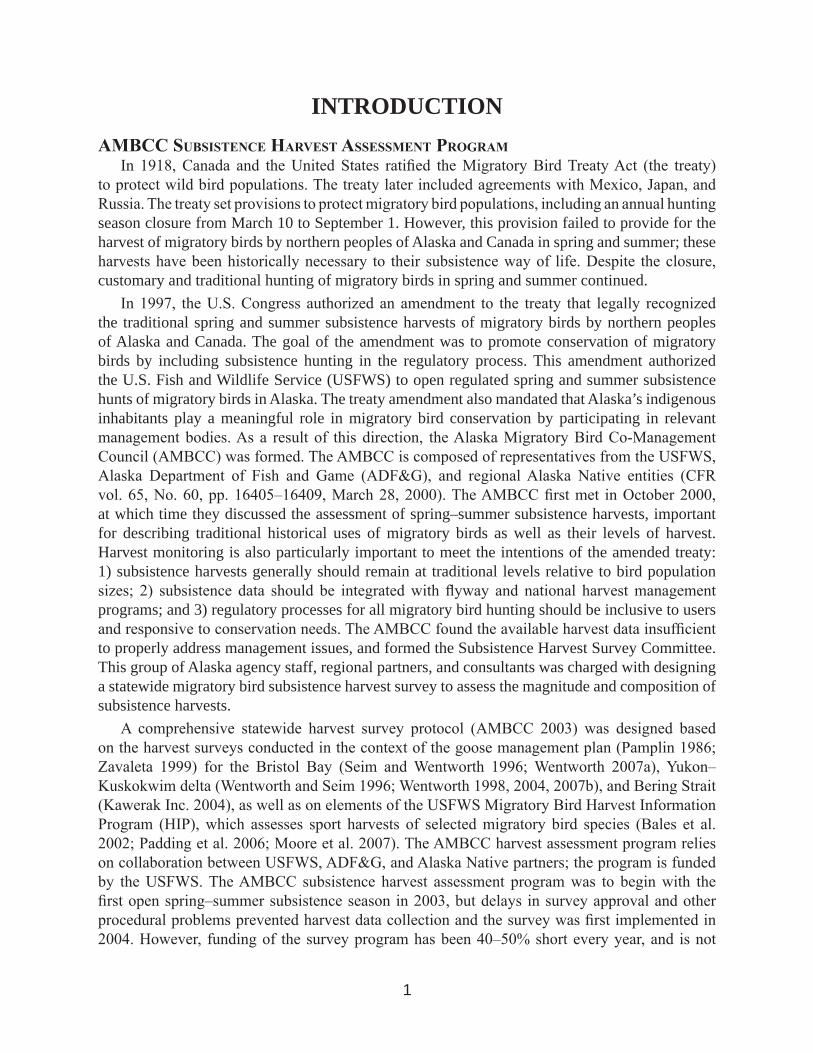
In 1918, Canada and the United States ratified the Migratory Bird Treaty Act (the treaty) to protect wild bird populations. The treaty later included agreements with Mexico, Japan, and Russia. The treaty set provisions to protect migratory bird populations, including an annual hunting season closure from March 10 to September 1. However, this provision failed to provide for the harvest of migratory birds by northern peoples of Alaska and Canada in spring and summer; these harvests have been historically necessary to their subsistence way of life. Despite the closure, customary and traditional hunting of migratory birds in spring and summer continued.
In 1997, the U.S. Congress authorized an amendment to the treaty that legally recognized the traditional spring and summer subsistence harvests of migratory birds by northern peoples of Alaska and Canada. The goal of the amendment was to promote conservation of migratory birds by including subsistence hunting in the regulatory process. This amendment authorized the U.S. Fish and Wildlife Service (USFWS) to open regulated spring and summer subsistence hunts of migratory birds in Alaska. The treaty amendment also mandated that Alaska’s indigenous inhabitants play a meaningful role in migratory bird conservation by participating in relevant management bodies. As a result of this direction, the Alaska Migratory Bird Co-Management Council (AMBCC) was formed. The AMBCC is composed of representatives from the USFWS, Alaska Department of Fish and Game (ADF&G), and regional Alaska Native entities (CFR vol. 65, No. 60, pp. 16405–16409, March 28, 2000). The AMBCC first met in October 2000, at which time they discussed the assessment of spring–summer subsistence harvests, important for describing traditional historical uses of migratory birds as well as their levels of harvest. Harvest monitoring is also particularly important to meet the intentions of the amended treaty: 1) subsistence harvests generally should remain at traditional levels relative to bird population sizes; 2) subsistence data should be integrated with flyway and national harvest management programs; and 3) regulatory processes for all migratory bird hunting should be inclusive to users and responsive to conservation needs. The AMBCC found the available harvest data insufficient to properly address management issues, and formed the Subsistence Harvest Survey Committee. This group of Alaska agency staff, regional partners, and consultants was charged with designing a statewide migratory bird subsistence harvest survey to assess the magnitude and composition of subsistence harvests.
A comprehensive statewide harvest survey protocol (AMBCC 2003) was designed based on the harvest surveys conducted in the context of the goose management plan (Pamplin 1986; Zavaleta 1999) for the Bristol Bay (Seim and Wentworth 1996; Wentworth 2007a), Yukon–Kuskokwim delta (Wentworth and Seim 1996; Wentworth 1998, 2004, 2007b), and Bering Strait (Kawerak Inc. 2004), as well as on elements of the USFWS Migratory Bird Harvest Information Program (HIP), which assesses sport harvests of selected migratory bird species (Bales et al. 2002; Padding et al. 2006; Moore et al. 2007). The AMBCC harvest assessment program relies on collaboration between USFWS, ADF&G, and Alaska Native partners; the program is funded by the USFWS. The AMBCC subsistence harvest assessment program was to begin with the first open spring–summer subsistence season in 2003, but delays in survey approval and other procedural problems prevented harvest data collection and the survey was first implemented in 2004. However, funding of the survey program has been 40–50% short every year, and is not
2
adjusted for inflation. Consequently, cost-cutting measures have resulted in reduced sampling efforts, insufficient village outreach, and insufficient training of survey staff, further compounding intrinsic difficulties of doing the survey in the remote areas of Alaska. In 2005, the Harvest Survey Committee adopted a regional rotation, and since then only the Yukon–Kuskokwim delta region has been surveyed yearly. Other regions are surveyed approximately every other year, depending on monitoring priorities and budget constraints. The necessity of reduced and rotating survey coverage has impaired the accuracy of harvest estimates and greatly extended the time necessary to detect changes in harvest levels.
The AMBCC and its Harvest Survey Committee recognize the need to conduct an effective survey that provides timely and accurate harvest information in order to meet treaty obligations, as well as to sustain migratory bird populations and harvest traditions. In 2007, the AMBCC Harvest Survey Committee asked the ADF&G Division of Subsistence to assess the performance of the original survey design, the effectiveness of the diminished sampling effort, and other operational issues. Based on the survey assessment report (Naves et al. 2008), the AMBCC Subsistence Harvest Survey Committee evaluated problems, considered technical improvements to the survey methods, and collaboratively reformulated an operational plan. The revised survey methods are now being implemented to collect 2010 harvest information. The 2008 harvest information to which this report refers to was collected following the original survey methods (AMBCC 2003; Wentworth 2006).
This report is the second in a series of annual reports with birds and bird eggs harvest estimates at the regional and subregional levels produced with data collected by the AMBCC harvest assessment program. Harvest estimates for 2004 to 2007 were reported in Naves (2010). In 2008, the harvest survey was conducted in 5 regions: Aleutian–Pribilof Islands, Bristol Bay, Yukon–Kuskokwim Delta, North Slope, and Interior Alaska (although only in the Yukon–Koyukuk subregion).
AMBCC MeMBer orgAnizAtionSThe Alaska Migratory Bird Co-Management Council is composed of representatives from:
• U.S. Fish and Wildlife Service;• Alaska Department of Fish and Game;• Chugach Regional Resources Commission;• Sun’aq Tribe of Kodiak;• Aleutian–Pribilof Islands Association;• Bristol Bay Native Association;• Association of Village Council Presidents;• Kawerak Inc.;• Maniilaq Association;• North Slope Borough;• Tanana Chiefs Conference;• Copper River Native Association; and • Southeast Inter-Tribal Fish and Wildlife Commission.

3
uSeS of tHe inforMAtion of tHe SuBSiStenCe HArveSt SurveyHarvest estimates from the subsistence harvest survey are available to the communities
(“villages”), Alaska Native organizations, state and federal resource management and conservation agencies, the Pacific Flyway Council, and the general public. Data at the household level are confidential and data at the village level are sensitive. Preliminary harvest estimates based on survey data are submitted to Alaska Native regional partners for review before being adopted by the AMBCC. Information from the survey is not to be used for punitive enforcement purposes, nor has this been reported to have happened. Survey data are used to:
• Document the importance of customary and traditional uses of migratory birds by Alaska rural villages so that subsistence uses will be protected and conducted in a sustainable manner;
• Document subsistence harvest trends and track major changes in harvests;• Assist the USFWS in the evaluation of spring–summer migratory bird harvest
regulations; and• Assist in the development of management plans by state and federal agencies.

4
METHODSDAtA ColleCtion
Regions, Subregions, VillagesThe harvest survey covers a total of 192 rural villages (Appendix A) within the regions
eligible to participate in the subsistence harvest of migratory birds in Alaska (50 CFR, Part 92, Subpart 92.5). According to the Alaska Department of Labor and Workforce Development’s 2007 population estimates, these villages have a total population of about 87,000 people in 25,000 households (ADLWD 2009). A census survey to evaluate the subsistence harvests of migratory birds within eligible areas would be impractical and cost prohibitive. Thus, appropriate sampling of regions, subregions, villages, and households is the basis for the calculation of harvest estimates. Data collection from the 2004–2008 survey sometimes deviated from the original survey design (AMBCC 2003; Wentworth 2006) by varying degrees, largely as a result of budget constraints and operational difficulties (Naves et al. 2008; Naves 2010).
The sample frame encompasses all households in regions eligible for the subsistence harvest of migratory birds and their eggs in Alaska. The household is the primary sampling unit. Grouping villages with similar harvest patterns into subregions allows for the expansion of reported harvests from surveyed villages to nonsurveyed villages in the same subregion. The subregions are grouped into regions, which approximately correspond to the 12 designated migratory bird management regions (CFR vol. 68, No. 139, pp. 43010–43030, July 21, 2003). The survey, however, covers 10 of these 12 regions—the Gulf of Alaska and Cook Inlet regions were combined because of their small numbers of eligible villages, and the Southeast Alaska region has not been surveyed (Figure 1). The original survey protocol listed 32 subregions within 10 regions (Wentworth 2006). Subregions in the Bristol Bay and Interior Alaska regions were revised by the AMBCC Harvest Survey Committee in 2009, which resulted in a total of 29 subregions (figures 2–11, Appendix A). Data analysis has been based on this revised configuration of subregions, as reported below and in Naves (2010).
Rotation of regions based on monitoring priorities has been implemented as a cost reduction measure (Table 1). Two-thirds of the villages in each surveyed region are to be sampled every year (Reynolds 2007). Regional hub villages (Bethel, Dillingham, Kotzebue, Barrow, Nome, Kodiak, Unalaska, and Tok) are to be surveyed each year that their region is surveyed because these larger villages may have harvest patterns that differ from those of smaller villages (e.g., fewer harvesters and lower harvests per hunter). However, coverage of regions has occasionally been incomplete because of funding limitations and difficulties related to field operations.
In 2008, the harvest survey was conducted in 5 regions: Aleutian–Pribilof Islands, Bristol Bay, Yukon–Kuskokwim Delta, North Slope, and Interior Alaska (only in the Yukon–Koyukuk subregion). The following organizations participated in the 2008 data collection:
• Aleutian–Pribilof Islands region: The Sentinel Program of the Aleut Marine Mammal Commission, the Qawalangin Tribe of Unalaska, and the ADF&G Division of Subsistence;
• Bristol Bay region: Bristol Bay Native Association;• Yukon–Kuskokwim delta region: Yukon-Kuskokwim Delta National Wildlife
Refuge and Togiak National Wildlife Refuge;

5
Table 1.–Regions surveyed from 2004–2008.Region 2004 2005 2006 2007 2008Gulf of Alaska–Cook Inlet ● ● ●Kodiak Archipelago ●Aleutian–Pribilof Islands ● ● ●Bristol Bay ● ● ● ● ●Yukon–Kuskokwim Delta ● ● ● ● ●Bering Strait–Norton Sound ● ● ●Northwest Arctic ●North Slope ● ● ●Interior Alaska ● ● ● ● ●Upper Copper River ● ●Southeast Alaska
Source Survey results for 2004–2007 were reported in Naves (2010).
• North Slope region: North Slope Borough;• Interior Alaska region: Kanuti National Wildlife Refuge.
Sampling MethodsThe original survey design called for a 3-level stratification (“none, low, high”) of households
within a village and the evaluation of this sampling method once sufficient statewide data were accumulated (AMBCC 2003; Wentworth 2006). Villages surveyed across the state vary in size from a few households to about 2,000 households. Variation in village size led to the application of other sampling methods (Naves et al. 2008).
The survey relies on a village household list that includes all “resident” households. A household is considered resident if its members live in the village year-round and have lived in the village for at least the 12 previous months. The list of resident households does not include unoccupied dwellings, commercial buildings, and public buildings.
The precision goal of the subsistence harvest survey was derived from the precision goal of the HIP sport hunting monitoring program—95% confidence intervals within 10–20% of the estimated harvest (Bales et al. 2002:70). However, there are difficulties in comparing confidence intervals from these 2 surveys: 1) HIP currently does not report confidence intervals for harvest estimates of individual species, 2) some species harvested for subsistence uses are not included in the HIP survey, 3) different sport and subsistence hunting patterns may have different effects on the precision of harvest estimates, and 4) subsistence harvest estimates are currently available only at the regional and subregional levels while sport hunting estimates are available only at the state level.
The subsistence harvest survey covers a large geographic area and a large number of species. Some species are abundant and harvested in large numbers. Other species are harvested only occasionally because they have small populations, restricted distribution, or are not used for subsistence purposes. Wide-coverage harvest assessment programs cannot address both commonly- and rarely-harvested species with the same level of precision. After the publication of the first spring–summer subsistence harvest regulations in 2003, the public, biologists, and resource managers expressed strong interest in subsistence takes of non game bird species, which are sometimes harvested (although in relatively low numbers). Dedicated harvest surveys are

6
required to determine the harvests of species that have small populations, low densities, or limited distributions, and that are less likely to be precisely documented in the statewide subsistence harvest survey.
“None, Low, High” StratificationAt the beginning of the survey year, the surveyor classifies the resident households, according
to their general harvest patterns of previous years, into only 1 of 3 harvest level strata: “none” (0 birds), “low” (1–10 birds), and “high” (10+ birds). The surveyor then draws a random sample from each harvest level so that 10% of all households in the “none,” 15% of households in the “low,” and 40% in the “high” stratum are sampled.
Census: 100% samplingIn small villages (up to about 40 households), sampling by census (100% sampling) is usually
attempted because implementing the 3-level stratification and its stratum-specific sampling proportions with a small total number of households usually results in sample sizes that are too small.
Simple Random SamplingRandom selection without harvest level stratification is occasionally used. Also, sampling is
treated as a simple random sampling if a census was attempted but some households could not be contacted.
“Harvester, Other” StratificationIn some cases, expansion of reported harvests is based on a 2-level (“harvester, other”)
stratification where “harvester” includes all harvester households (“low” and “high” strata in 3-level stratification) and “other” includes non harvester households (“none” stratum) as well as non listed households or households with unknown harvest patterns. Three-level stratification of “none, low, high” is difficult to implement in large villages because 1) surveyors frequently do not know the general harvest patterns of all households, 2) large rural villages frequently have large population turnover, and 3) household lists for large villages often do not represent all resident households. It is difficult and costly to keep updated household lists of large villages. In the case of an incomplete household list, it would be inappropriate to assume that sampling of large villages approached a simple random sampling. Most likely, the households included in the household list were harvesters as opposed to non harvesters, because field coordinator and surveyor training emphasized the importance of surveying a higher proportion of high harvesters (Wentworth 2006). Also, locally hired surveyors are more likely to be familiar with Alaska Native households, which may include a higher proportion of harvesters when compared to households of other ethnicities. At the AMBCC 2008 spring meeting, field coordinators adopted the “harvester, other” stratification to sample large villages. Starting in 2009, field coordinator training focused on the need to survey both harvesters and other households, since beforehand stratification based on previous household harvest pattern naturally results in a degree of misclassification of household into these strata (Naves et al. 2008). Survey training emphasizes that both harvester and other households are to be sampled and that the sample includes a higher proportion of harvester households.
Survey Year and Survey SeasonsAs stated earlier, the primary goal of the survey is to document spring–summer subsistence
harvests under subsistence regulations. Although open seasons may vary on an annual basis according to subsistence harvest regulations, for purposes of this survey, the “survey year” is
7
April 1 through October 31 in most regions, except in Southern Coastal Alaska (Aleutian–Pribilof Islands, Kodiak Archipelago, Gulf of Alaska–Cook Inlet, and the South Alaska Peninsula of Bristol Bay), where the survey year ends on March 9. The survey year is divided into 3 “survey seasons”: spring, summer, and fall or fall–winter (Table 2). The fall migratory bird hunts (after September 1) are managed under early season frameworks in federal regulations selected and adopted as state regulations. Harvests from fall hunts should be captured by the HIP survey; however, the HIP survey is most likely ineffective in documenting fall subsistence harvests in rural Alaska because of low hunter participation in the HIP program. For this reason, the AMBCC subsistence harvest survey also covers fall or fall–winter.
The harvest report form is composed of 3 sheets, 1 for each season. In regions that have a winter survey, harvests are noted on the fall–winter page. As in the original survey protocol, surveyors make 4 visits to each participating household during a survey year (Wentworth 2006). In March–April, surveyors distribute survey forms to participating households. After the end of each survey season, surveyors visit the participating households to collect the corresponding sheet of the survey form (Table 2). The intent of using 3 seasonal recall periods is to help respondents more accurately recall the number and species of birds and eggs they harvest, given the large number of species included on the survey. In general, long recall periods may lead to increased recall bias (Westat Inc. 1989). However, difficulties with survey funding and field operations continue to prevent seasonal collection of harvest data as originally scheduled. A large proportion of surveys have been done with a single household visit at the end of the survey year (Naves et al. 2008).
Village and Household ConsentThe survey is conducted only in villages and households that have agreed to participate. Village
consent must be granted in writing, and is often given as a tribal or village council resolution. Individual household consent is documented with permission slips, which also allow calculation of household participation rates. During the first visit to each selected household, the surveyor explains the purpose of the survey to an adult household member, explains how the survey works, and invites the household to participate.
Household “No-Contact” and RefusalsIf after 3 reasonable attempts the surveyor cannot contact a selected household, or if a
selected household declines to participate, then an alternate household is selected to replace it. If stratification is used, the alternate household must be from the same harvest level stratum as the no–contact or no–consent household.
Reporting HarvestsThe harvest report form is used to record the subsistence harvest of migratory birds and their
eggs (Appendix B). The harvest report form has 1 sheet for each survey season (spring, summer, and fall or fall–winter). Each seasonal sheet has color illustrations of bird species in breeding plumage and fields to record the total number of birds harvested and the total number of eggs harvested. Due to variation in the availability and distribution of bird species, there are 3 versions of the harvest report form, each with a different set of species. The versions are for Interior Alaska, Southern Coastal Alaska, and the “main form” for villages in other regions (Appendix B). This helps to prevent erroneously recording bird species as harvested in areas where they do not normally occur.

8
Tabl
e 2.
–Sea
sona
l sur
vey
cove
rage
and
hou
seho
ld v
isits
.Sp
ring
1 A
pr–3
0 Ju
nSu
mm
er1
Jul–
31 A
ugFa
ll1
Sep–
31 O
ctW
inte
r1
Nov
–9 M
arR
egio
nA
prM
ayJu
nJu
lA
ugSe
pO
ctN
ovD
ecJa
nFe
bM
ar
Gul
f of A
lask
a–C
ook
Inle
t●
●●
● 2n
d●
● 3r
d●
●●
● ●
● 1s
t, 4t
h
Kod
iak
Arc
hipe
lago
●●
● ●
2nd
●●
3rd
●●
●●
● ●
1st,
4th
Ale
utia
n–Pr
ibilo
f Isl
ands
●●
● ●
2nd
● ●
3rd
● ●
●●
● ●
1st,
4th
Sout
h A
lask
a Pe
nins
ula
(Bris
tol B
ay)
●●
● ●
2nd
● ●
3rd
● ●
●●
● ●
1st,
4th
Bris
tol B
ay (e
xcep
t Sou
th A
lask
a Pe
nins
ula)
●●
● ●
2nd
● ●
3rd
● 4
th 1
st
Yuko
n–K
usko
kwim
Del
ta●
● ●
● 2n
d●
● 3r
d●
4th
1st
Ber
ing
Stra
it–N
orto
n So
und
● ●
● ●
2nd
● ●
3rd
● 4
th 1
st
Nor
thw
est A
rctic
● ●
● ●
2nd
● ●
3rd
● 4
th 1
st
Nor
th S
lope
● ●
● ●
2nd
● 3
rd
1st
Inte
rior A
lask
a●
● ●
● 2n
d●
● 3r
d●
4th
1st
Upp
er C
oppe
r Riv
er●
● ●
● 2n
d●
● 3r
d●
4th
1st
●
Indi
cate
s a m
onth
in w
hich
a re
gion
was
cov
ered
by
a se
ason
al su
rvey
.
1st
Firs
t hou
seho
ld v
isit,
to in
vite
hou
seho
lds t
o pa
rtici
pate
in th
e su
rvey
.
2nd
Seco
nd h
ouse
hold
vis
it, to
col
lect
sprin
g se
ason
al h
arve
st d
ata.
3r
d Th
ird h
ouse
hold
vis
it, to
col
lect
sum
mer
seas
onal
har
vest
dat
a.
4th
Four
th h
ouse
hold
vis
it, to
col
lect
fall
or fa
ll–w
inte
r sea
sona
l har
vest
dat
a.

9
Figu
re 1
.–R
egio
ns a
nd su
breg
ions
of t
he A
MB
CC
mig
rato
ry b
ird su
bsis
tenc
e ha
rves
t sur
vey.
120°
0'0"
W13
0°0'
0"W
140°
0'0"
W
140°
0'0"
W
150°
0'0"
W
150°
0'0"
W
160°
0'0"
W
160°
0'0"
W
170°
0'0"
W
170°
0'0"
W18
0°0'
0"17
0°0'
0"E
70°0
'0"N
60°0
'0"N
60°0
'0"N
50°0
'0"N
50°0
'0"N
AM
BCC
Subs
iste
nce
Hou
seho
ldH
arve
stSu
rvey
,Reg
ions
and
Subr
egio
ns
Lege
nd
Elig
ible
Vill
ages
Num
ber o
f Hou
seho
lds
0 - 6
0
61 -
100
101
- 1,0
00
1,00
1 - 2
,000
Reg
ion
Boun
dary
Subr
egio
n Bo
unda
ry
Excl
uded
Are
as
010
020
030
050
Mile
s
1:15
,500
,000
Sou
rce:
AD
F&G
Div
isio
n o
f Su
bsi
sten
ce, 2
009
Com
piled
fro
m U
SGS
top
ogr
aph
ic m
aps
Nort
h A
mer
ican
Dat
um
19
83
Ala
ska
Alb
ers
pro
ject
ion
Map
cre
ated
by
Ter
ri L
emon
s
SCA
LE:
(not
elig
ible
for t
he
subs
iste
nce
harv
est
of m
igra
tory
bird
s)
3b
3a
2b
2a4a
4b
4c
1a
1b
10
11
9a9b
9c
9d9e
8a8b
7a7b
6a
6b
6c
5a
5b
5c
5f5d 5e
5g
/
Reg
ion
Subr
egio
n 1
. Gul
f of A
lask
a-C
ook
Inle
t1a
. Chu
gach
1b. C
ook
Inle
t 2
. Kod
iak
Arch
ipel
ago
2a. K
odia
k V
illag
es2b
. Kod
iak
City
and
Roa
d-co
nnec
ted
3. A
leut
ian-
Prib
ilof I
slan
ds3a
. Ale
utia
n-P
ribilo
f Vill
ages
3b. U
nala
ska
4. B
risto
l Bay
4a. S
outh
Ala
ska
Pen
insu
la4b
. Sou
thw
est B
risto
l Bay
4c. D
illin
gham
5. Y
ukon
-Kus
kokw
im D
elta
5a. Y
-K D
elta
Sou
th C
oast
5b. Y
-K D
elta
Mid
Coa
st5c
. Y-K
Del
ta N
orth
Coa
st5d
. Low
er Y
ukon
5e. L
ower
Kus
kokw
im5f
. Cen
tral K
usko
kwim
5g. B
ethe
l 6
. Ber
ing
Stra
it-N
orto
n So
und
6a. S
t. La
wre
nce-
Dio
med
e Is
.6b
. Ber
ing
Stra
it M
ainl
and
Vill
ages
6c. N
ome
7. N
orth
wes
t Arc
tic7a
. NW
Arc
tic V
illag
es7b
. Kot
zebu
e 8
. Nor
th S
lope
8a. N
orth
Slo
pe V
illag
es8b
. Bar
row
9. I
nter
ior
9a. M
id Y
ukon
-Upp
er K
usko
kwim
9b. Y
ukon
-Koy
ukuk
9c. U
pper
Yuk
on9d
. Tan
ana
Vill
ages
9e. T
ok 1
0. U
pper
Cop
per R
iver
11.
Sou
thea
st A
lask
a

10
Figu
re 2
.–G
ulf o
f Ala
ska-
Coo
k In
let a
nd U
pper
Cop
per R
iver
regi
ons.
Tyon
ek
Gak
ona
Chi
tina
Tazl
ina
Tatit
lek
Can
twel
l
Nan
wal
ekP
ort G
raha
m
Chi
stoc
hina
Che
nega
Bay
Cop
per C
ente
r
Men
tast
a La
ke
140°
0'0"
W
150°
0'0"
W
150°
0'0"
W
60°0
'0"N
60°0
'0"N
AM
BCC
SUBS
IST
ENC
EH
OU
SEH
OLD
HA
RV
EST
SUR
VEY
,GU
LFO
FA
LASK
A-C
OO
KIN
LET
AN
DU
PPER
CO
PPER
RIV
ER
Lege
nd
Elig
ible
Vill
ages
Num
ber o
f Hou
seho
lds
0 - 6
0
61 -
100
101
- 1,0
00
1,00
1 - 2
,000
Reg
ion
Bou
ndar
y
Excl
uded
Are
as
030
6090
15
Mile
s
1:4,
250,
000
Sou
rce:
AD
F&G
Div
isio
n o
f Su
bsi
sten
ce,
20
09
Com
piled
fro
m U
SGS
top
ogr
aph
ic m
aps
Nort
h A
mer
ican
Dat
um
19
83
Ala
ska
Alb
ers
pro
ject
ion
Map
cre
ated
by
Ter
ri L
emon
s
SCA
LE:
Upp
er
Cop
per R
iver
Reg
ion
Coo
k In
let
Subr
egio
n
Gul
f of A
lask
aSu
breg
ion
/

11
Figu
re 3
.–K
odia
k A
rchi
pela
go re
gion
.
Akh
iok
Kar
luk
Ale
neva
Chi
niak
Ouz
inki
e
Lars
en B
ay
Old
Har
bor
Port
Lio
ns
Wom
ens
Bay
Kod
iak
City
Kod
iak
Stat
ion
Kod
iak
at L
arge
AM
BCC
SUBS
IST
ENC
EH
OU
SEH
OLD
HA
RV
EST
SUR
VEY
,KO
DIA
KA
RC
HIP
ELA
GO
Lege
nd
Elig
ible
Vill
ages
Num
ber o
f Hou
seho
lds
0 - 6
0
61 -
100
101
- 1,0
00
1,00
1 - 2
,000
Reg
ion
Boun
dary
Subr
egio
n Bo
unda
ry
020
4060
10
Mile
s
1:2,
500,
000
Sou
rce:
AD
F&G
Div
isio
n o
f Su
bsi
sten
ce, 2
009
Com
piled
fro
m U
SGS
top
ogr
aph
ic m
aps
Nort
h A
mer
ican
Dat
um
19
83
Ala
ska
Alb
ers
pro
ject
ion
Map
cre
ated
by
Ter
ri L
emon
s
SCA
LE:
Kod
iak
Villa
ges
Subr
egio
nK
odia
k C
ity a
nd
Roa
d-co
nnec
ted
Subr
egio
n
/

12
Figu
re 4
.–A
leut
ian–
Prib
ilof I
slan
ds re
gion
.
Atk
a
Aku
tan
Col
d B
ay
Nik
olsk
i
Kin
g C
ove
San
d P
oint
Sai
nt P
aul
Fals
e P
ass
Ada
k S
tatio
n
Sai
nt G
eorg
e
Nel
son
Lago
on
160°
0'0"
W
160°
0'0"
W
170°
0'0"
W
170°
0'0"
W18
0°0'
0"
60°0
'0"N
50°0
'0"N
50°0
'0"N
AM
BCC
SUBS
IST
ENC
EH
OU
SEH
OLD
HA
RV
EST
SUR
VEY
,ALE
UT
IAN
/PR
IBIL
OF
ISLA
ND
S
Lege
nd
Elig
ible
Vill
ages
Num
ber o
f Hou
seho
lds
0 - 6
0
61 -
100
101
- 1,0
00
1,00
1 - 2
,000
Reg
ion
Bou
ndar
y
Sub
regi
on B
ound
ary
070
140
210
35
Mile
s
1:8,
000,
000
Sou
rce:
AD
F&G
Div
isio
n o
f Su
bsi
sten
ce, 2
009
Com
piled
fro
m U
SGS
top
ogr
aph
ic m
aps
Nort
h A
mer
ican
Dat
um
19
83
Ala
ska
Alb
ers
pro
ject
ion
Map
cre
ated
by
Ter
ri L
emon
s
SCA
LE:
Una
lask
aSu
breg
ion
Ale
utia
n/Pr
ibilo
f Vill
ages
Subr
egio
n
/
13
Figu
re 5
.–B
risto
l Bay
regi
on.
Ekw
ok Ege
gik
Togi
ak
Nak
nek
Iliam
na
Igiu
gig
Leve
lock
New
hale
n
Kok
hano
k
Kol
igan
ek
Ale
knag
ik
Non
dalto
n Ped
ro B
ay
Man
okot
akTw
in H
ills Per
ryvi
lleIv
anof
Bay
Pilo
t Poi
nt
Chi
gnik
Bay
Kin
g S
alm
on
Por
t Hei
den
New
Stu
yaho
k
Chi
gnik
Lak
e
Cla
rk's
Poi
nt
160°
0'0"
W
160°
0'0"
W
60°0
'0"N
60°0
'0"N
AM
BCC
SUBS
IST
ENC
EH
OU
SEH
OLD
HA
RV
EST
SUR
VEY
,BR
IST
OL
BAY
Lege
nd
Elig
ible
Vill
ages
Num
ber o
f Hou
seho
lds
0 - 6
0
61 -
100
101
- 1,0
00
1,00
1 - 2
,000
Reg
ion
Bou
ndar
y
Subr
egio
n B
ound
ary
030
6090
15
Mile
s
1:3,
500,
000
Sou
rce:
AD
F&G
Div
isio
n o
f Su
bsi
sten
ce, 2
009
Com
piled
fro
m U
SGS
top
ogr
aph
ic m
aps
Nort
h A
mer
ican
Dat
um
19
83
Ala
ska
Alb
ers
pro
ject
ion
Map
cre
ated
by
Ter
ri L
emon
s
SCA
LE:
Sout
hwes
t B
risto
l Bay
Subr
egio
n
Dill
ingh
amSu
breg
ion
Sout
h A
lask
a Pe
nins
ula
Subr
egio
n
/
Sou
th N
akne
k
Chi
gnik
Lag
oon

14
Figu
re 6
.–Yu
kon–
Kus
kokw
im D
elta
regi
on.
Eek
Akia
k
Ania
k
Kipn
uk
New
tok
Che
vak
Kotli
k
Tunu
nak
Emm
onak
Kasi
gluk
Akia
chak Kw
ethl
ukN
apak
iak
Tulu
ksak
Mek
oryu
k
Plat
inum
Mar
shal
l
Alak
anuk
Nap
aski
akN
ight
mut
e
Qui
nhag
ak
Red
Dev
ilSl
eetm
ute
Che
forn
ak
Nun
am Iq
ua
Hoo
per B
ay
Kong
igan
ak
Toks
ook
Bay
Ston
y R
iver
Scam
mon
Bay
Tunt
utul
iak
Chu
athb
aluk
Kwig
illing
ok
Goo
dnew
s B
ay
Lim
e Vi
llage
Pitk
as P
oint
Sain
t Mar
y's
Cro
oked
Cre
ek
Pilo
t Sta
tion
Upp
er K
alsk
ag
Low
er K
alsk
ag
Rus
sian
Mis
sion
Mou
ntai
n Vi
llage
160°
0'0"
W
160°
0'0"
W
60°0
'0"N
60°0
'0"N
AM
BCC
SUBS
IST
ENC
EH
OU
SEH
OLD
HA
RV
EST
SUR
VEY
,YU
KO
N-K
USK
OK
WIM
DEL
TA
Lege
nd
Elig
ible
Vill
ages
Num
ber o
f Hou
seho
lds
0 - 6
0
61 -
100
101
- 1,0
00
1,00
1 - 2
,000
Reg
ion
Bou
ndar
y
Subr
egio
n B
ound
ary
030
6090
15
Mile
s
1:4,
000,
000
Sou
rce:
AD
F&G
Div
isio
n o
f Su
bsi
sten
ce, 2
009
Com
piled
fro
m U
SGS
top
ogr
aph
ic m
aps
Nort
h A
mer
ican
Dat
um
19
83
Ala
ska
Alb
ers
pro
ject
ion
Map
cre
ated
by
Ter
ri L
emon
s
SCA
LE:
Nor
th C
oast
Subr
egio
n
Sout
h C
oast
Subr
egio
n
Low
er Y
ukon
Subr
egio
n
Cen
tral
Kus
kokw
imSu
breg
ion
Low
er K
usko
kwim
Subr
egio
nM
id C
oast
Subr
egio
nB
ethe
l Sub
regi
onN
unap
itchu
kAt
mau
tluak
Osc
arvi
lle
/

15
Figu
re 7
.–B
erin
g St
rait-
Nor
ton
Soun
d re
gion
.
Elim
Wal
es
Koy
uk
Telle
r
Gam
bell
Gol
ovin
Dio
med
e
Ste
bbin
s
Sav
oong
a
Una
lakl
eet
Shi
shm
aref
Sha
ktoo
lik
Sai
nt M
icha
el
Bre
vig
Mis
sion
Whi
te M
ount
ain
160°
0'0"
W
160°
0'0"
W
170°
0'0"
W
170°
0'0"
W
AM
BCC
SUBS
IST
ENC
EH
OU
SEH
OLD
HA
RV
EST
SUR
VEY
,BER
ING
STR
AIT
-NO
RT
ON
SOU
ND
Lege
nd
Elig
ible
Vill
ages
Num
ber o
f Hou
seho
lds
0 - 6
0
61 -
100
101
- 1,0
00
1,00
1 - 2
,000
Reg
ion
Boun
dary
Subr
egio
n B
ound
ary
030
6090
15
Mile
s
1:3,
500,
000
Sou
rce:
AD
F&G
Div
isio
n o
f Su
bsi
sten
ce, 2
009
Com
piled
fro
m U
SGS
top
ogr
aph
ic m
aps
Nort
h A
mer
ican
Dat
um
19
83
Ala
ska
Alb
ers
pro
ject
ion
Map
cre
ated
by
Ter
ri L
emon
s
SCA
LE:
St.
Law
renc
e-D
iom
ede
Isla
ndSu
breg
ion
Beri
ng S
trai
t M
ainl
and
Villa
ges
Subr
egio
n
Nom
eSu
breg
ion
/

16
Figu
re 8
.–N
orth
wes
t Arc
tic re
gion
.
Kia
na
Kob
uk
Noa
tak
Am
bler
Dee
ring
Sel
awik
Noo
rvik
Buc
klan
d
Kiv
alin
a
Shu
ngna
k
160°
0'0"
W
160°
0'0"
W
AM
BCC
SUBS
IST
ENC
EH
OU
SEH
OLD
HA
RV
EST
SUR
VEY
,NO
RT
HW
EST
AR
CT
IC Lege
nd
Elig
ible
Vill
ages
Num
ber o
f Hou
seho
lds
0 - 6
0
61 -
100
101
- 1,0
00
1,00
1 - 2
,000
Reg
ion
Bou
ndar
y
Sub
regi
on B
ound
ary
020
4060
10
Mile
s
1:2,
750,
000
Sou
rce:
AD
F&G
Div
isio
n o
f Su
bsi
sten
ce, 2
009
Com
piled
fro
m U
SGS
top
ogr
aph
ic m
aps
Nort
h A
mer
ican
Dat
um
19
83
Ala
ska
Alb
ers
pro
ject
ion
Map
cre
ated
by
Ter
ri L
emon
s
SCA
LE:
Nor
thw
est A
rctic
Vill
ages
Subr
egio
n
Kot
zebu
eSu
breg
ion
/

17
Figu
re 9
.–N
orth
Slo
pe re
gion
.
Nui
qsut
Atq
asuk
Kak
tovi
k
Poi
nt L
ay
Poi
nt H
ope
Wai
nwrig
ht
Ana
ktuv
uk P
ass
140°
0'0"
W
150°
0'0"
W
150°
0'0"
W
160°
0'0"
W
160°
0'0"
W17
0°0'
0"W
70°0
'0"N
70°0
'0"N
AM
BCC
SUBS
IST
ENC
EH
OU
SEH
OLD
HA
RV
EST
SUR
VEY
,NO
RT
HSL
OPE
Lege
nd
Elig
ible
Vill
ages
Num
ber o
f Hou
seho
lds
0 - 6
0
61 -
100
101
- 1,0
00
1,00
1 - 2
,000
Reg
ion
Bou
ndar
y
Subr
egio
n B
ound
ary
050
100
150
25
Mile
s
1:5,
550,
000
Sou
rce:
AD
F&G
Div
isio
n o
f Su
bsi
sten
ce, 2
009
Com
piled
fro
m U
SGS
top
ogr
aph
ic m
aps
Nort
h A
mer
ican
Dat
um
19
83
Ala
ska
Alb
ers
pro
ject
ion
Map
cre
ated
by
Ter
ri L
emon
s
SCA
LE:
Nor
th S
lope
Vill
ages
Subr
egio
n
Bar
row
Sub
regi
on
/
18
Figu
re 1
0.–I
nter
ior A
lask
a re
gion
.
Rub
y
Anv
ik
Eag
leM
into
Hus
lia
Nul
ato
Kal
tag
Gal
ena
Hug
hes
Bea
ver
Circ
le
Tana
na
Nen
ana
Ala
tna
Tetli
n
Nik
olai
Tako
tna
McG
rath
Koy
ukuk
Wis
eman
Vene
tie
Ram
part
Cen
tral
Col
dfoo
t
Sha
gelu
k
Nor
thw
ay
Dot
Lak
e
Gra
ylin
g
Dry
Cre
ek
Alla
kake
t
Tana
cros
s
Hol
y C
ross
Fort
Yuko
n Hea
ly L
ake
Birc
h C
reek
Arc
tic V
illag
e
Ste
vens
Vill
age
Lake
Min
chum
ina
Bet
tles/
Eva
nsvi
lle Man
ley
Hot
Spr
ings
140°
0'0"
W
150°
0'0"
W
150°
0'0"
W
160°
0'0"
W
160°
0'0"
W
AM
BCC
SUBS
IST
ENC
EH
OU
SEH
OLD
HA
RV
EST
SUR
VEY
,IN
TER
IOR
ALA
SKA
Lege
nd
Elig
ible
Vill
ages
Num
ber o
f Hou
seho
lds
0 - 6
0
61 -
100
101
- 1,0
00
1,00
1 - 2
,000
Reg
ion
Bou
ndar
y
Excl
uded
Are
as
Subr
egio
n B
ound
ary
040
8012
020
Mile
s
1:5,
500,
000
Sou
rce:
AD
F&G
Div
isio
n o
f Su
bsi
sten
ce, 2
009
Com
piled
fro
m U
SGS
top
ogr
aph
ic m
aps
Nort
h A
mer
ican
Dat
um
19
83
Ala
ska
Alb
ers
pro
ject
ion
Map
cre
ated
by
Ter
ri L
emon
s
SCA
LE:
Yuko
n-K
oyuk
ukSu
breg
ion
Mid
Yuk
on-U
pper
Kus
kokw
im S
ubre
gion
Upp
er Y
ukon
Subr
egio
n
Tana
na
Vill
ages
Subr
egio
n
Tok
Subr
egio
n
Koy
ukuk
/

19
Figu
re 1
1.–S
outh
east
Ala
ska
regi
on.
Cra
ig
Hoo
nah
Yaku
tat
Hyd
abur
g
130°
0'0"
W
140°
0'0"
W
140°
0'0"
W
60°0
'0"N
AM
BCC
SUBS
IST
ENC
EH
OU
SEH
OLD
HA
RV
EST
SUR
VEY
,SO
UT
HEA
STA
LASK
A
Lege
nd
Elig
ible
Vill
ages
Num
ber o
f Hou
seho
lds
0 - 6
0
61 -
100
101
- 1,0
00
1,00
1 - 2
,000
Reg
ion
Bou
ndar
y
040
8012
020
Mile
s
1:4,
250,
000
Sou
rce:
Div
isio
n o
f Su
bsi
sten
ce, A
DF&
G, 2
009
Com
piled
fro
m U
SGS
top
ogr
aph
ic m
aps
Nort
h A
mer
ican
Dat
um
19
83
Ala
ska
Alb
ers
pro
ject
ion
Map
cre
ated
by
Ter
ri L
emon
s
SCA
LE:
/
20
If a household harvests birds or eggs and gives them to another household, the harvest is to be recorded by the household that originally harvested the birds–eggs, and not by the household that received them. If a household does not harvest birds–eggs, any birds or eggs they receive are not to be recorded on their survey form.
Species Represented on the Harvest Report FormThe diverse subsistence cultures and economies across Alaska use a wide variety of migratory
bird species, subject to seasonal availability, hunter access, and local traditions. The 2003 federal subsistence regulations allowed spring–summer harvest of about 90 species and subspecies of migratory birds, subject to seasons and restrictions (CFR vol. 68. No. 139, pp. 43010–43030, July 21, 2003). The harvest report form depicts about 50 species. The survey form was designed to record harvests of only those species that are significant to subsistence uses. Harvest of species not represented in the survey form can be reported in the “other bird” field. Identifying birds by subspecies can be difficult and it may be difficult to tell some species from others. The survey form does not differentiate between species and subspecies that are difficult to tell apart. To represent all species open to harvest on the survey forms would also result in an unwieldy, long survey.
Some bird species and eggs that are closed to harvest are depicted on the survey form. The list of birds and eggs closed to subsistence harvest may vary between regions according to the yearly hunting regulations. The inclusion of species closed to harvest on the survey form is not an endorsement of or consent to engage in the harvest of closed species. Rather, it is an attempt to collect accurate harvest data to aid in the sustainable management of all bird species. Management and conservation bodies, such as the AMBCC, the USFWS, and the flyway councils, need to know the numbers of birds and eggs taken to successfully plan for the sustainable management of bird populations. In order to elicit accurate answers to potentially sensitive questions, it is imperative that information from the survey is not used for punitive enforcement. To aid in this effort, identification of households is strictly confidential.
Data TransferThe surveyor is required to check completed survey forms for completeness and correctness
before sending them to the field coordinator. Upon receiving each batch of completed forms from surveyors, the field coordinator organizes and reviews all survey materials before sending them to the statewide survey coordinator. This step allows field coordinators to correct potential inconsistencies in data collection and to manage surveyor payment.
Data Management and Program ReportingData entry and archiving is completed by the Information Management Unit of the ADF&G
Division of Subsistence. The statewide survey coordinator works closely with the unit to produce and report harvest estimates.
Data are entered in Microsoft Office Access 2003 forms that are designed to mimic survey forms. 1 The multiyear raw data are stored in a Microsoft SQL Server 2005 relational database and backups occur on a monthly basis. The structure of the database is documented in appropriate metadata. Double data entry and logical checks help ensure the accuracy of the information stored in the database and of the sampling information provided with completed survey forms (e.g., sampling method used, sample sizes, strata size). Logical checks and data analysis are done with SPSS Statistics 2008.1. Product names are given for scientific completeness or because they are established standards for the State of
Alaska; they do not constitute product endorsement.
21
Original survey forms are scanned and archived as digital files. Archived survey materials do not include household names or other personal information in order to ensure confidentiality of household harvest reports. If household names are inadvertently revealed in the survey forms, the information is redacted prior to archiving.
DAtA AnAlySiS
Geographic Scale of Harvest EstimatesHarvest estimates are presented at the subregional and regional levels. Harvest estimates at the
regional level are produced when at least 75% of the households within the region are represented in the sample (see below). Because of issues related to management of species of conservation concern, the North Slope and the Bering Strait–Norton Sound regions have requested harvest estimates to be presented at the regional level only. Appropriate subregional sampling coverage has allowed calculation of regional harvest estimates in these 2 regions.
Harvest estimates at the subregional level may vary considerably between years (Table 5 and Table 6). Several factors may be involved:
• Yearly variation in the local abundance of birds;• Hunter access to productive hunting grounds;• Yearly variation in hunting effort associated with availability of other subsistence
resources, especially salmon Oncorhynchus spp. and caribou Rangifer tarandus, or with temporary employment in the cash economy;
• Inappropriate subregional sampling coverage; and• Heterogeneity of harvest patterns in villages within a subregion.
To calculate statewide harvest estimates, any large yearly variation in subregional harvest estimates requires analytical approaches that account for variability in harvest between years as well within subregions. Development of accurate statewide estimates may require more years of data as well as appropriate coverage of infrequently surveyed regions (Northwest Arctic, Kodiak Archipelago, Aleutian–Pribilof Islands) and nonsurveyed regions (Southeast Alaska). For a better understanding of yearly variation in subregional estimates, it is important to continue reporting harvest estimates at the subregional level.
Expansion at the Subregional LevelThe subsistence harvest survey generally employs a stratified, clustered sampling approach
(Cochran 1977). Harvest estimates are calculated for each season and the annual estimate is calculated as the sum of seasonal harvests, although there are a few difficulties. For example, one or more seasonal pages of the harvest report form may be missing for individual households. As a consequence, the total number of households or the sets of households surveyed in a village can vary by season within the same survey year. Furthermore, seasonal data may be missing for an entire harvest level stratum or for an entire village. For these reasons, absolute sample sizes are specific to each harvest level stratum, season, and village. Because calculation of annual harvest estimates and confidence intervals requires an annual sample size, the maximum number of households sampled among seasons is used (Table 3).
The reported harvest is first expanded in each harvest level stratum and village: harvests reported by households sampled in each stratum are expanded to all households in that stratum. Considering the sampling methods used, the number of harvest level strata in a village may be 3
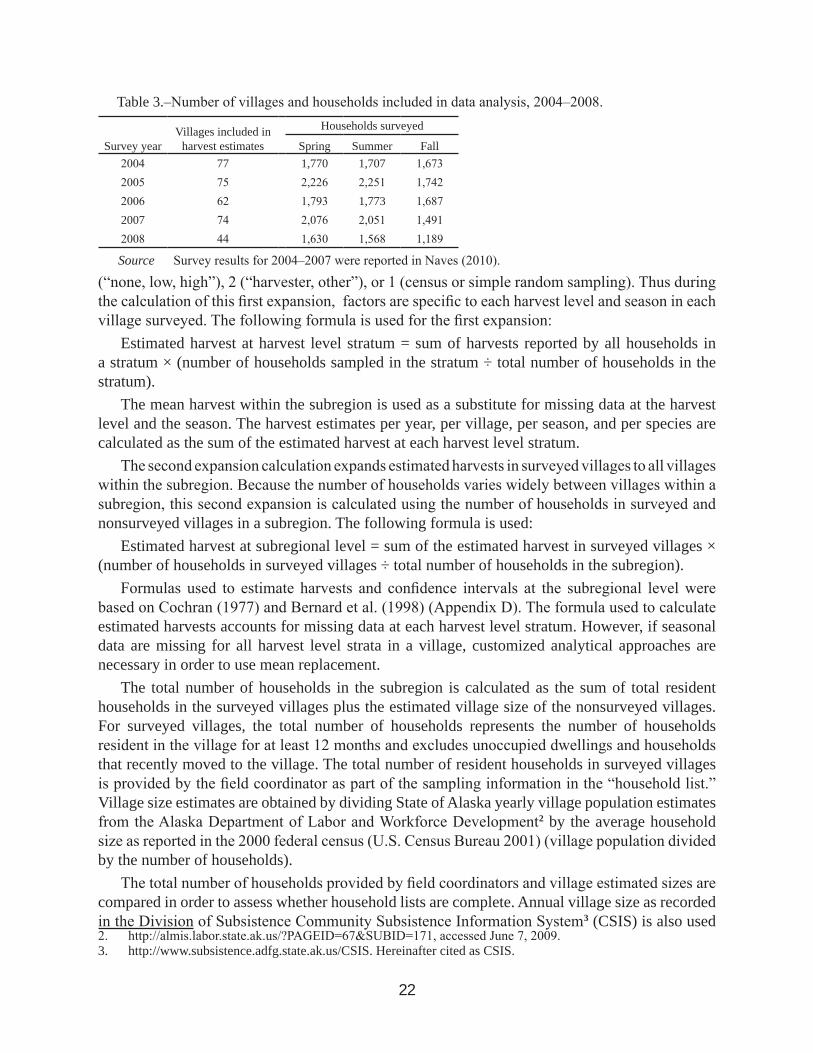
22
Table 3.–Number of villages and households included in data analysis, 2004–2008.
Survey yearVillages included in
harvest estimates
Households surveyed
Spring Summer Fall2004 77 1,770 1,707 1,6732005 75 2,226 2,251 1,7422006 62 1,793 1,773 1,6872007 74 2,076 2,051 1,4912008 44 1,630 1,568 1,189
Source Survey results for 2004–2007 were reported in Naves (2010).
(“none, low, high”), 2 (“harvester, other”), or 1 (census or simple random sampling). Thus during the calculation of this first expansion, factors are specific to each harvest level and season in each village surveyed. The following formula is used for the first expansion:
Estimated harvest at harvest level stratum = sum of harvests reported by all households in a stratum × (number of households sampled in the stratum ÷ total number of households in the stratum).
The mean harvest within the subregion is used as a substitute for missing data at the harvest level and the season. The harvest estimates per year, per village, per season, and per species are calculated as the sum of the estimated harvest at each harvest level stratum.
The second expansion calculation expands estimated harvests in surveyed villages to all villages within the subregion. Because the number of households varies widely between villages within a subregion, this second expansion is calculated using the number of households in surveyed and nonsurveyed villages in a subregion. The following formula is used:
Estimated harvest at subregional level = sum of the estimated harvest in surveyed villages × (number of households in surveyed villages ÷ total number of households in the subregion).
Formulas used to estimate harvests and confidence intervals at the subregional level were based on Cochran (1977) and Bernard et al. (1998) (Appendix D). The formula used to calculate estimated harvests accounts for missing data at each harvest level stratum. However, if seasonal data are missing for all harvest level strata in a village, customized analytical approaches are necessary in order to use mean replacement.
The total number of households in the subregion is calculated as the sum of total resident households in the surveyed villages plus the estimated village size of the nonsurveyed villages. For surveyed villages, the total number of households represents the number of households resident in the village for at least 12 months and excludes unoccupied dwellings and households that recently moved to the village. The total number of resident households in surveyed villages is provided by the field coordinator as part of the sampling information in the “household list.” Village size estimates are obtained by dividing State of Alaska yearly village population estimates from the Alaska Department of Labor and Workforce Development 2 by the average household size as reported in the 2000 federal census (U.S. Census Bureau 2001) (village population divided by the number of households).
The total number of households provided by field coordinators and village estimated sizes are compared in order to assess whether household lists are complete. Annual village size as recorded in the Division of Subsistence Community Subsistence Information System 3 (CSIS) is also used 2. http://almis.labor.state.ak.us/?PAGEID=67&SUBID=171, accessed June 7, 2009.3. http://www.subsistence.adfg.state.ak.us/CSIS. Hereinafter cited as CSIS.

23
to assess the completeness of household lists. If these sources yield a discrepancy greater than 30–40% in the number of households, efforts are made to contact the field coordinator and obtain local information on village size, such as from lists held by tribal councils. If local information on village size cannot be obtained, CSIS information or estimated village sizes are used in harvest expansions.
Villages for which sampling information is missing (the household list, sampling method, or harvest level strata size are not provided) are not included in the analysis. 4
Expansion at Regional LevelThe third expansion expands the estimated harvest in surveyed subregions to all subregions
within a region. Because the number of households in each subregion varies significantly, this third expansion is based on the number of households in both the surveyed and nonsurveyed subregions in a region, and is calculated as follows:
Estimated harvest at regional level = sum of the estimated harvest in surveyed subregions × (number of households in surveyed subregions ÷ total number of households in the region).
Subregional estimates are expanded to the regional level only if at least 75% of the households within the region are represented in the sample (nonsurveyed subregions must not represent more than 25% of the total households in the region). Formulas used to estimate harvest and confidence intervals at the regional level are based on Cochran (1977) and Bernard et al. (1998) (Appendix E). The formula to estimate harvests does account for missing data at the harvest level stratum. However, if seasonal data are missing for a harvest level stratum in a village, customized analytical approaches are necessary in order to use mean replacement.
For annual harvest estimates both at the subregional and regional levels, if the low end of the confidence interval is less than the reported harvest, the calculated low end is replaced by the reported harvest.
Conversion of Egg Volume to Numbers of EggsEgg harvest is sometimes reported on this survey by volume, such as the number of “5-gallon
buckets” or the number of “1-gallon buckets.” Conversion factors for volumes of eggs to numbers of eggs were estimated by comparing the volumes of eggs of wild bird species reported in the Birds of North America Series to the volumes of “large” domestic chicken eggs (personal communication, James Magdanz, ADF&G Subsistence Resource Specialist, Kotzebue, Alaska, June 2009) (Table 4). It is known that a 1-gallon bucket can hold 48 large chicken eggs (24 oz per dozen, U.S. Department of Agriculture standard). This comparison is necessary because eggs of different size and shape arrange differently in a given volume; i.e., the amount of empty space among eggs is related to the size and shape of the eggs. In the future, actual counts of eggs per gallon should be documented on the egg gathering grounds.
Reports of Egg Harvest in FallHarvest reports occasionally include eggs gathered in fall (September 1 through October 31)
or fall–winter (September 1 through March 9). However, the nesting period of birds in Alaska is usually only as late as July and there are no records of customary and traditional uses of eggs that have failed to hatch. For these reasons, reports of eggs harvested in fall or fall–winter are considered to be recording inconsistencies in which the surveyor or the household member records the harvest on the wrong seasonal page or in the field reserved for “birds” rather than in the field 4. In 2008, this was 5 out of 49 villages surveyed.

24
Table 4.–Estimated conversion factors, egg volume to number of eggs.
SpeciesNumber of eggs in
5-gallon bucketNumber of eggs in
1-gallon bucketMallarda 261 52Pintailb 327 65Arctic ternc 716 143Mew gulld 261 52Glaucous gulle 121 24Glaucous-winged gullf 147 29Herring gullg 147 29Murreh 126 25
Sources Personal communication, James Magdanz, ADF&G Subsistence Resource Specialist, Kotzebue, Alaska;
a. Drilling et al. (2002) b. Austin and Miller (1995) c. Hatch (2002) d. Moskoff and Bevier (2002) e. Gilchrist (2001) f. Hayward and Verbeek (2008) g. Pierotti and Good (1994) h. Ainley et al. (2002)
reserved for “eggs.” Each of these cases are individually assessed and assumed to be harvest of birds in fall or harvest of eggs in spring, based on the harvest patterns of the household and of the village.
Household Participation RatesHousehold participation in the survey is voluntary. The original survey method used permission
slips to document household participation in the survey. During the first visit, when the surveyor invited each selected household to participate, he or she completed a permission slip for every visited household and noted whether the household agreed to participate (“yes”) or not (“no”). The following issues in the use of these permission slips were identified:
• Permission slips were not completed for a surveyed village;• Permission slips were not completed for some households in a surveyed village;• Permission slips were completed incorrectly (“no” represented “no harvest” or
“no contact” rather than “no consent to conduct the survey”); and• Completed permission slips were not submitted for data management and
analysis at ADF&G.Household participation rates at the regional and subregional levels are calculated based on
the permission slips available for analysis (see the Results section). Identified instances where “no” could represent “no contact” or “no harvest” rather than “no consent” are not included in the analysis of household participation rate. Household participation rates are calculated as the number of households that agreed to participate in the survey (“yes”) divided by the total number of permission slips available.

25
RESULTSHarvest estimate tables presented in this report include only the bird species represented in
the version of the harvest report form used at each region or subregion (Appendix C). The species categories of “Duck (unidentified)” and “Other/unknown bird” are included in tables only if harvest in these categories is reported.
Information on sampling effort is presented in a footnote to each harvest estimate table. For subregional tables, “sampling effort” refers to the number of villages surveyed and the proportion of subregion households represented in the sample (the number of households in surveyed villages in relation to the total number of households in the subregion). For regional tables, sampling effort refers to the number of villages and of subregions surveyed. Major deviations from survey protocols, such as significantly incomplete geographic coverage or nonstandard village sampling approaches, are also documented in table footnotes.
If not all subregions were surveyed, regional harvest estimates may be larger than the sum of the surveyed subregions because expanded estimates account for nonsurveyed subregions. Regional estimates are not presented if nonsurveyed subregions represent more than 25% of the regional households.
Annual estimates for the total harvests of birds and eggs at the regional and subregional levels are summarized in Table 5 (birds) and Table 6 (eggs). Regional and subregional estimates in these tables indicate that estimates detailed by species are available in the regional and subregional tables that follow (tables 7–38). A regional table precedes the tables for its subregions unless survey coverage was not enough to allow calculation of regional estimates (e.g., Interior Alaska region, 2008). Household participation rates for 2004–2008 are presented in Table 39.

26
Tabl
e 5.
–Ann
ual h
arve
st e
stim
ates
tota
l bird
s at t
he su
breg
iona
l and
regi
onal
leve
ls, 2
004–
2008
.
2004
2005
2006
2007
2008
Reg
ion
Conf
iden
ce In
terv
alCo
nfid
ence
Inte
rval
Conf
iden
ce In
terv
alCo
nfid
ence
Inte
rval
Conf
iden
ce In
terv
alSu
breg
ion
95%
CI
Low
–H
igh
95%
CI
Low
–H
igh
95%
CI
Low
–H
igh
95%
CI
Low
–H
igh
95%
CI
Low
–H
igh
Gul
f of A
lask
a-C
ook
Inle
t2,
995
32%
2,03
9–
3,95
1**
**-
--
--
-Gu
lf of
Ala
ska
2,75
617
%2,
278
–3,
234
--
-59
642
%34
3–
849
--
--
--
Cook
Inle
t23
930
%16
8–
310
1357
%5
–20
--
--
--
--
-
Kod
iak
Arc
hipe
lago
--
--
--
--
--
--
Kod
iak
Villa
ges
--
--
--
5,55
228
%3,
972
–7,
133
--
--
--
Kod
iak
City
& R
oad
Conn
ecte
d-
--
--
-a
--
--
--
Ale
utia
n-Pr
ibilo
f Isl
ands
--
-**
--
-**
8,40
130
%5,
909
–10
,894
Ale
utia
n-Pr
ibilo
f Vill
ages
--
-16
,876
35%
11,0
50–
22,7
02-
--
(7,3
71)
(77%
)(1
,708
–13
,035
)7,
642
21%
6,03
0–
9,25
4U
nala
ska
--
--
--
--
--
--
760
41%
445
–1,
074
Bri
stol
Bay
**47
,336
32%
32,0
26–
62,6
45**
28,2
8520
%22
,538
–34
,031
32,9
9514
%28
,326
–37
,663
Sout
h A
lask
a Pe
nins
ula
801
24%
609
–99
2-
--
--
-96
850
%48
8–
1,44
9(1
15)
(111
%)
(20
–24
2)So
uthw
est B
risto
l Bay
14,9
5510
%13
,494
–16
,416
32,7
6918
%26
,937
–38
,600
(26,
715)
(22%
)(2
0,95
9–
32,4
71)
20,1
6915
%17
,240
–23
,097
(29,
352)
(14%
)(2
5,17
3–
33,5
32)
Dill
ingh
am-
--
11,7
6930
%8,
188
–15
,350
--
-7,
148
25%
5,39
5–
8,90
13,
527
15%
3,01
1–
4,04
3
Yuko
n-K
usko
kwim
Del
ta13
0,34
36%
122,
107
–13
8,57
811
4,51
48%
105,
504
–12
3,52
317
1,85
67%
159,
552
–18
4,16
0b
79,0
889%
71,9
86–
86,1
90Y-
K D
elta
Sou
th C
oast
25,7
6411
%22
,849
–28
,680
35,5
087%
33,1
44–
37,8
7331
,918
8%29
,310
–34
,526
33,9
2711
%30
,229
–37
,625
19,9
9912
%17
,663
–22
,334
Y-K
Del
ta M
id C
oast
34,4
808%
31,8
70–
37,0
9017
,546
11%
15,6
64–
19,4
29(6
1,99
8)(1
2%)
(54,
306
–69
,689
)43
,737
13%
37,8
37–
49,6
3817
,160
15%
14,5
12–
19,8
09Y-
K D
elta
Nor
th C
oast
8,80
617
%7,
320
–10
,292
11,2
0614
%9,
663
–12
,748
4,49
321
%3,
545
–5,
440
1,20
631
%82
9–
1,58
44,
867
22%
3,79
7–
5,93
6Lo
wer
Yuk
on(6
,201
)(1
9%)
(5,0
12–
7,39
0)6,
815
9%6,
206
–7,
424
10,2
6912
%9,
025
–11
,513
3,98
815
%3,
404
–4,
572
4,72
716
%3,
994
–5,
460
Low
er K
usko
kwim
46,0
3315
%39
,095
–52
,971
16,5
5711
%14
,771
–18
,344
48,8
498%
45,0
95–
52,6
0458
,983
7%54
,575
–63
,392
22,8
1314
%19
,721
–25
,906
Cent
ral K
usko
kwim
440
32%
300
–58
1-
--
1,16
735
%75
4–
1,58
021
979
%46
–39
1-
--
Beth
elc
8,61
817
%7,
184
–10
,053
23,9
5424
%18
,246
–29
,662
13,1
6324
%9,
969
–16
,357
b7,
789
16%
6,55
6–
9,02
1B
erin
g St
rait-
Nor
ton
Soun
d53
,576
8%49
,194
–57
,959
74,1
1517
%61
,682
–86
,548
--
-12
3,25
710
%11
0,41
9–
136,
094
--
-St
. Law
renc
e-D
iom
ede
Is.
33,6
007%
31,3
26–
35,8
7430
,481
9%27
,876
–33
,087
--
-88
,362
8%81
,114
–95
,609
--
-Be
ring
Stra
it M
ainl
and
Villa
ges
17,1
959%
15,5
67–
18,8
2237
,482
18%
30,8
29–
44,1
36-
--
31,1
6910
%28
,193
–34
,145
--
-N
ome
2,78
221
%2,
210
–3,
353
6,15
231
%4,
234
–8,
069
--
-3,
726
37%
2,35
9–
5,09
4-
--
Nor
thwe
st A
rctic
--
--
--
**-
--
--
-N
orth
wes
t Arc
tic V
illag
es-
--
--
-9,
676
21%
7,63
1–
11,7
22-
--
--
-K
otze
bue
--
--
--
--
--
--
--
-N
orth
Slo
pe-
--
15,6
1511
%13
,820
–17
,410
--
-44
,270
23%
34,2
18–
54,3
2245
,123
22%
35,4
04–
54,8
42N
orth
Slo
pe V
illag
es-
--
4,67
212
%4,
115
–5,
228
--
-6,
118
24%
4,63
0–
7,60
79,
873
38%
6,08
0–
13,6
65Ba
rrow
--
-10
,943
10%
9,84
8–
12,0
39-
--
38,1
52d
15%
32,3
74–
43,9
3035
,250
17%
29,4
27–
41,0
73In
teri
or A
lask
a50
,995
13%
44,2
16–
57,7
74**
37,0
6817
%30
,792
–43
,343
****
Mid
Yuk
on-U
pper
Kus
kokw
im(3
,086
)(4
3%)
(1,7
55–
4,41
8)2,
744
29%
1,95
6–
3,53
269
736
%44
7–
948
--
--
--
Yuko
n-K
oyuk
uk3,
108
18%
2,55
8–
3,65
8(9
30)
(44%
)(5
25–
1,33
5)(1
,764
)(6
0%)
(712
–2,
816)
(3,0
31)
(72%
)(8
56–
5,20
6)(6
,908
)(8
9%)
(731
–13
,084
)U
pper
Yuk
on(1
4,41
8)(1
6%)
(12,
095
–16
,742
)-
--
10,9
2712
%9,
576
–12
,277
18,4
0214
%15
,800
–21
,004
--
-Ta
nana
Vill
ages
20,3
8816
%17
,197
–23
,579
--
-17
,358
14%
14,9
40–
19,7
76-
--
--
-To
k-
--
--
-6,
321d
31%
4,38
5–
8,25
8-
--
--
-Up
per
Cop
per
Riv
ere
1,12
030
%78
2–
1,45
8-
--
--
-24
730
%17
4–
321
--
-
a Fal
l bird
har
vest
dat
a no
t ava
ilabl
e fo
r Kod
iak
City
& R
oad
Conn
ecte
d su
breg
ion;
ann
ual h
arve
st e
stim
ates
not
ava
ilabl
e.b F
all b
ird h
arve
st d
ata
not a
vaila
ble
for B
ethe
l sub
regi
on; a
nnua
l har
vest
est
imat
es n
ot a
vaila
ble.
c Bet
hel h
arve
st e
xpan
sion
s as
sum
e th
at h
arve
ster
hou
seho
lds
acco
unt f
or 3
0% o
f the
tota
l vill
age
hous
ehol
ds (v
illag
e si
ze e
stim
ates
).d S
ubre
gion
al h
arve
st e
stim
ates
ass
umed
sim
ple
rand
om s
ampl
ing.
e Sam
plin
g an
d ha
rves
t exp
ansi
ons
repr
esen
t Ala
ska
Nat
ive
hous
ehol
ds o
nly.
2004
–200
7 H
arve
st e
stim
ates
from
Nav
es (2
010)
.
Num
ber
Num
ber
Num
ber
Num
ber
Num
ber
-: Re
gion
/sub
regi
on n
ot s
urve
yed.
*: 9
5% C
I 1
00%
(Sta
rting
in 2
008:
if "
Low
" w
as s
mal
ler t
han
repo
rted
harv
est,
"Low
" w
as re
plac
ed b
y re
porte
d ha
rves
t). *
*: L
ess
than
75%
of r
egio
n ho
useh
olds
repr
esen
ted
in s
ampl
e, h
arve
st e
stim
ates
no
t pro
duce
d at
the
regi
onal
leve
l. (In
par
enth
esis
): L
ess
than
30%
of s
ubre
gion
hou
seho
lds
repr
esen
ted
in th
e sa
mpl
e an
d/or
onl
y 1
out o
f sev
eral
sub
regi
on v
illag
es s
urve
yed.
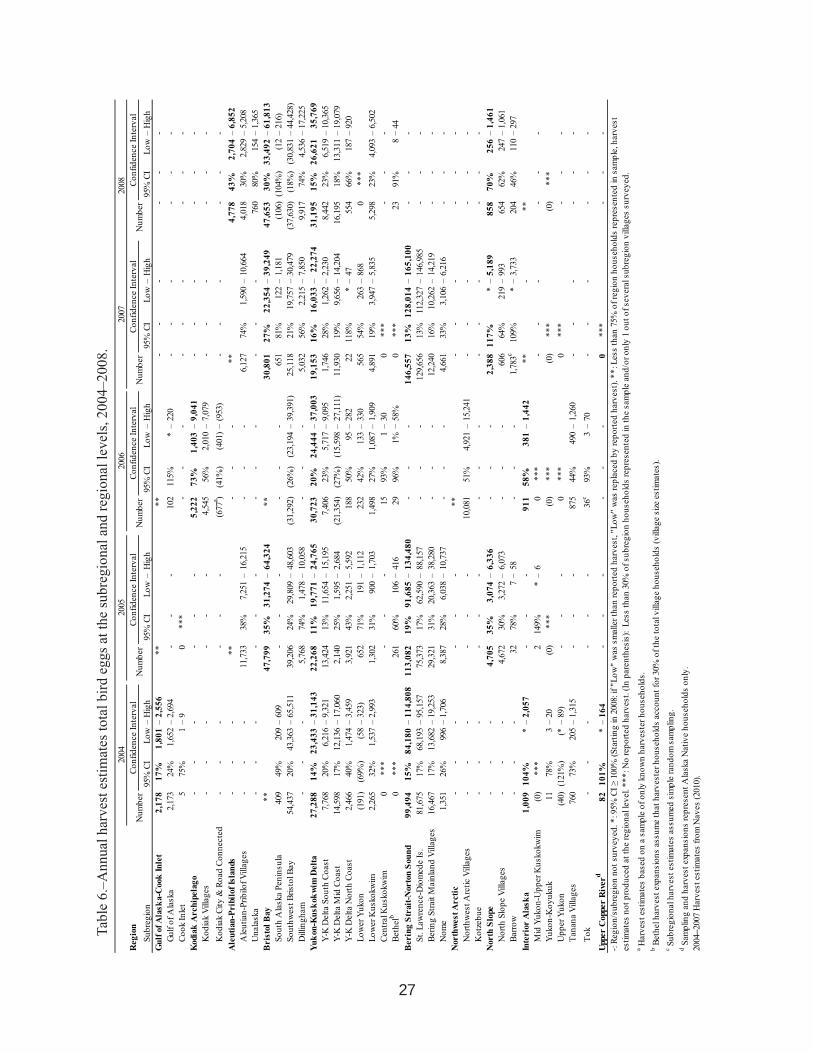
27
Tabl
e 6.
–Ann
ual h
arve
st e
stim
ates
tota
l bird
egg
s at t
he su
breg
iona
l and
regi
onal
leve
ls, 2
004–
2008
.
2004
2005
2006
2007
2008
Reg
ion
Conf
iden
ce In
terv
alCo
nfid
ence
Inte
rval
Conf
iden
ce In
terv
alCo
nfid
ence
Inte
rval
Conf
iden
ce In
terv
alSu
breg
ion
95%
CI
Low
–H
igh
95%
CI
Low
–H
igh
95%
CI
Low
–H
igh
95%
CI
Low
–H
igh
95%
CI
Low
–H
igh
Gul
f of A
lask
a-C
ook
Inle
t2,
178
17%
1,80
1–
2,55
6**
**-
--
--
-Gu
lf of
Ala
ska
2,17
324
%1,
652
–2,
694
--
-10
211
5%*
–22
0-
--
--
-Co
ok In
let
575
%1
–9
0**
*-
--
--
--
--
Kod
iak
Arc
hipe
lago
--
--
--
5,22
273
%1,
403
–9,
041
--
--
--
Kod
iak
Villa
ges
--
--
--
4,54
556
%2,
010
–7,
079
--
--
--
Kod
iak
City
& R
oad
Conn
ecte
d-
--
--
-(6
77a )
(41%
)(4
01)
–(9
53)
--
--
--
Ale
utia
n-Pr
ibilo
f Isl
ands
--
-**
--
-**
4,77
843
%2,
704
–6,
852
Ale
utia
n-Pr
ibilo
f Vill
ages
--
-11
,733
38%
7,25
1–
16,2
15-
--
6,12
774
%1,
590
–10
,664
4,01
830
%2,
829
–5,
208
Una
lask
a-
--
--
--
--
--
-76
080
%15
4–
1,36
5B
rist
ol B
ay**
47,7
9935
%31
,274
–64
,324
**30
,801
27%
22,3
54–
39,2
4947
,653
30%
33,4
92–
61,8
13So
uth
Ala
ska
Peni
nsul
a40
949
%20
9–
609
--
--
--
651
81%
122
–1,
181
(106
)(1
04%
)(1
2–
216)
Sout
hwes
t Bris
tol B
ay54
,437
20%
43,3
63–
65,5
1139
,206
24%
29,8
09–
48,6
03(3
1,29
2)(2
6%)
(23,
194
–39
,391
)25
,118
21%
19,7
57–
30,4
79(3
7,63
0)(1
8%)
(30,
831
–44
,428
)D
illin
gham
--
-5,
768
74%
1,47
8–
10,0
58-
--
5,03
256
%2,
215
–7,
850
9,91
774
%4,
536
–17
,225
Yuko
n-K
usko
kwim
Del
ta27
,288
14%
23,4
33–
31,1
4322
,268
11%
19,7
71–
24,7
6530
,723
20%
24,4
44–
37,0
0319
,153
16%
16,0
33–
22,2
7431
,195
15%
26,6
2135
,769
Y-K
Del
ta S
outh
Coa
st7,
768
20%
6,21
6–
9,32
113
,424
13%
11,6
54–
15,1
957,
406
23%
5,71
7–
9,09
51,
746
28%
1,26
2–
2,23
08,
442
23%
6,51
9–
10,3
65Y-
K D
elta
Mid
Coa
st14
,598
17%
12,1
36–
17,0
602,
140
25%
1,59
5–
2,68
4(2
1,35
4)(2
7%)
(15,
598
–27
,111
)11
,930
19%
9,65
6–
14,2
0416
,195
18%
13,3
11–
19,0
79Y-
K D
elta
Nor
th C
oast
2,46
640
%1,
474
–3,
459
3,92
143
%2,
251
–5,
592
188
50%
95–
282
2211
8%*
–47
554
66%
187
–92
0Lo
wer
Yuk
on(1
91)
(69%
)(5
8–
323)
652
71%
191
–1,
112
232
42%
133
–33
056
554
%26
3–
868
0**
*Lo
wer
Kus
kokw
im2,
265
32%
1,53
7–
2,99
31,
302
31%
900
–1,
703
1,49
827
%1,
087
–1,
909
4,89
119
%3,
947
–5,
835
5,29
823
%4,
093
–6,
502
Cent
ral K
usko
kwim
0**
*-
--
1593
%1
–30
0**
*-
--
Beth
elb
0**
*26
160
%10
6–
416
2996
%1%
–58
%0
***
2391
%8
–44
Ber
ing
Stra
it-N
orto
n So
und
99,4
9415
%84
,180
–11
4,80
811
3,08
219
%91
,685
–13
4,48
0-
--
146,
557
13%
128,
014
–16
5,10
0-
--
St. L
awre
nce-
Dio
med
e Is
.81
,675
17%
68,1
93–
95,1
5775
,373
17%
62,5
90–
88,1
57-
--
129,
656
13%
112,
327
–14
6,98
5-
--
Berin
g St
rait
Mai
nlan
d Vi
llage
s16
,467
17%
13,6
82–
19,2
5329
,321
31%
20,3
63–
38,2
80-
--
12,2
4016
%10
,262
–14
,219
--
-N
ome
1,35
126
%99
6–
1,70
68,
387
28%
6,03
8–
10,7
37-
--
4,66
133
%3,
106
–6,
216
--
-N
orth
west
Arc
tic-
--
--
-**
--
--
--
Nor
thw
est A
rctic
Vill
ages
--
--
--
10,0
8151
%4,
921
–15
,241
--
--
--
Kot
zebu
e-
--
--
--
--
--
--
--
Nor
th S
lope
--
-4,
705
35%
3,07
4–
6,33
6-
--
2,38
811
7%*
–5,
189
858
70%
256
–1,
461
Nor
th S
lope
Vill
ages
--
-4,
672
30%
3,27
2–
6,07
3-
--
606
64%
219
–99
365
462
%24
7–
1,06
1Ba
rrow
--
-32
78%
7–
58-
--
1,78
3c10
9%*
–3,
733
204
46%
110
–29
7In
teri
or A
lask
a1,
009
104%
*–
2,05
7-
--
911
58%
381
–1,
442
**-
**M
id Y
ukon
-Upp
er K
usko
kwim
(0)
***
214
9%*
–6
0**
*-
--
--
-Yu
kon-
Koy
ukuk
1178
%3
–20
(0)
***
(0)
***
(0)
***
(0)
***
Upp
er Y
ukon
(40)
(121
%)
(*–
89)
--
-0
***
0**
*-
--
Tana
na V
illag
es76
073
%20
5–
1,31
5-
--
875
44%
490
–1,
260
--
--
--
Tok
--
--
--
36c
93%
3–
70-
--
--
-
Uppe
r C
oppe
r R
iver
d82
101%
*–
164
--
--
--
0**
*-
--
a Har
vest
est
imat
es b
ased
on
a sa
mpl
e of
onl
y kn
own
harv
este
r hou
seho
lds.
b Bet
hel h
arve
st e
xpan
sion
s as
sum
e th
at h
arve
ster
hou
seho
lds
acco
unt f
or 3
0% o
f the
tota
l vill
age
hous
ehol
ds (v
illag
e si
ze e
stim
ates
).c S
ubre
gion
al h
arve
st e
stim
ates
ass
umed
sim
ple
rand
om s
ampl
ing.
d Sam
plin
g an
d ha
rves
t exp
ansi
ons
repr
esen
t Ala
ska
Nat
ive
hous
ehol
ds o
nly.
2004
–200
7 H
arve
st e
stim
ates
from
Nav
es (2
010)
.
Num
ber
Num
ber
Num
ber
Num
ber
Num
ber
-: Re
gion
/sub
regi
on n
ot s
urve
yed.
*: 9
5% C
I es
timat
es n
ot p
rodu
ced
at th
e re
gion
al le
vel.
***:
No
repo
rted
harv
est.
(In p
aren
thes
is):
Les
s th
an 3
0% o
f sub
regi
on h
ouse
hold
s re
pres
ente
d in
the
sam
ple
and/
or o
nly
1 ou
t of s
ever
al s
ubre
gion
vill
ages
sur
veye
d.
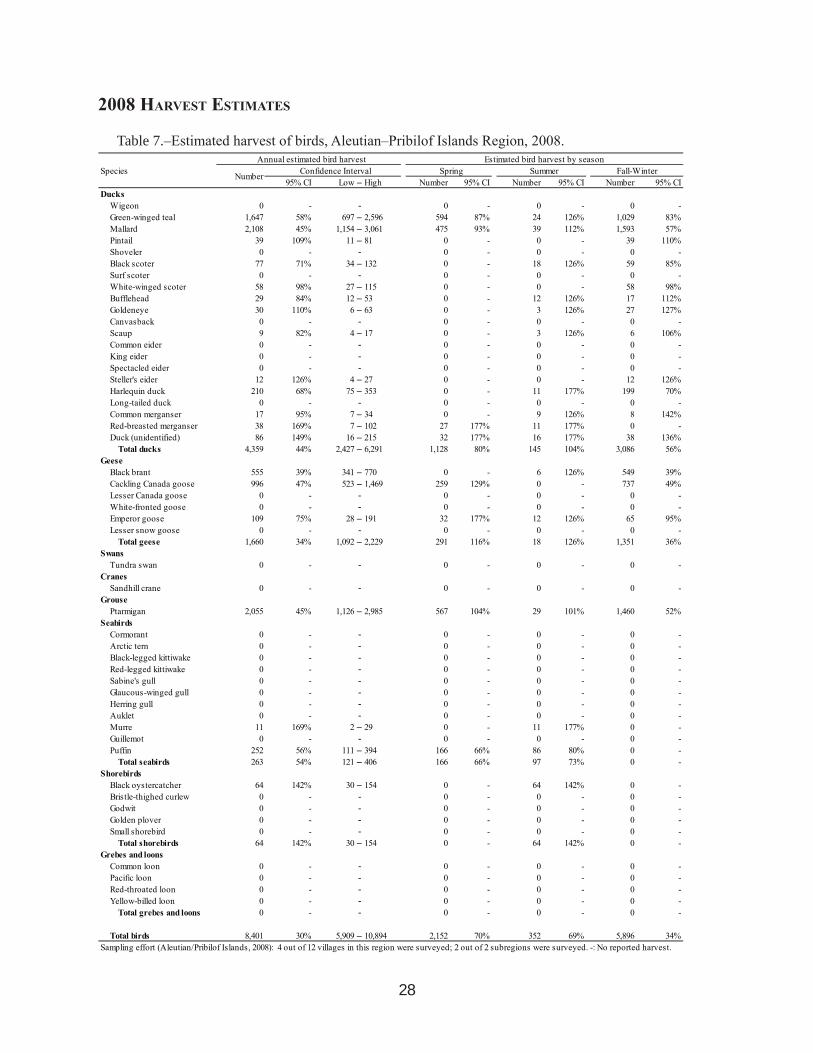
28
2008 HArveSt eStiMAteS
Table 7.–Estimated harvest of birds, Aleutian–Pribilof Islands Region, 2008. Annual estimated bird harvest Estimated bird harvest by seasonSpecies Confidence Interval Spring Summer Fall-Winter
95% CI Low – High Number 95% CI Number 95% CI Number 95% CIDucks
Wigeon 0 - - 0 - 0 - 0 -Green-winged teal 1,647 58% 697 – 2,596 594 87% 24 126% 1,029 83%Mallard 2,108 45% 1,154 – 3,061 475 93% 39 112% 1,593 57%Pintail 39 109% 11 – 81 0 - 0 - 39 110%Shoveler 0 - - 0 - 0 - 0 -Black scoter 77 71% 34 – 132 0 - 18 126% 59 85%Surf scoter 0 - - 0 - 0 - 0 -White-winged scoter 58 98% 27 – 115 0 - 0 - 58 98%Bufflehead 29 84% 12 – 53 0 - 12 126% 17 112%Goldeneye 30 110% 6 – 63 0 - 3 126% 27 127%Canvasback 0 - - 0 - 0 - 0 -Scaup 9 82% 4 – 17 0 - 3 126% 6 106%Common eider 0 - - 0 - 0 - 0 -King eider 0 - - 0 - 0 - 0 -Spectacled eider 0 - - 0 - 0 - 0 -Steller's eider 12 126% 4 – 27 0 - 0 - 12 126%Harlequin duck 210 68% 75 – 353 0 - 11 177% 199 70%Long-tailed duck 0 - - 0 - 0 - 0 -Common merganser 17 95% 7 – 34 0 - 9 126% 8 142%Red-breasted merganser 38 169% 7 – 102 27 177% 11 177% 0 -Duck (unidentified) 86 149% 16 – 215 32 177% 16 177% 38 136%
Total ducks 4,359 44% 2,427 – 6,291 1,128 80% 145 104% 3,086 56%Geese
Black brant 555 39% 341 – 770 0 - 6 126% 549 39%Cackling Canada goose 996 47% 523 – 1,469 259 129% 0 - 737 49%Lesser Canada goose 0 - - 0 - 0 - 0 -White-fronted goose 0 - - 0 - 0 - 0 -Emperor goose 109 75% 28 – 191 32 177% 12 126% 65 95%Lesser snow goose 0 - - 0 - 0 - 0 -
Total geese 1,660 34% 1,092 – 2,229 291 116% 18 126% 1,351 36%Swans
Tundra swan 0 - - 0 - 0 - 0 -Cranes
Sandhill crane 0 - - 0 - 0 - 0 -Grouse
Ptarmigan 2,055 45% 1,126 – 2,985 567 104% 29 101% 1,460 52%Seabirds
Cormorant 0 - - 0 - 0 - 0 -Arctic tern 0 - - 0 - 0 - 0 -Black-legged kittiwake 0 - - 0 - 0 - 0 -Red-legged kittiwake 0 - - 0 - 0 - 0 -Sabine's gull 0 - - 0 - 0 - 0 -Glaucous-winged gull 0 - - 0 - 0 - 0 -Herring gull 0 - - 0 - 0 - 0 -Auklet 0 - - 0 - 0 - 0 -Murre 11 169% 2 – 29 0 - 11 177% 0 -Guillemot 0 - - 0 - 0 - 0 -Puffin 252 56% 111 – 394 166 66% 86 80% 0 -
Total seabirds 263 54% 121 – 406 166 66% 97 73% 0 -Shorebirds
Black oystercatcher 64 142% 30 – 154 0 - 64 142% 0 -Bristle-thighed curlew 0 - - 0 - 0 - 0 -Godwit 0 - - 0 - 0 - 0 -Golden plover 0 - - 0 - 0 - 0 -Small shorebird 0 - - 0 - 0 - 0 -
Total shorebirds 64 142% 30 – 154 0 - 64 142% 0 -Grebes and loons
Common loon 0 - - 0 - 0 - 0 -Pacific loon 0 - - 0 - 0 - 0 -Red-throated loon 0 - - 0 - 0 - 0 -Yellow-billed loon 0 - - 0 - 0 - 0 -
Total grebes and loons 0 - - 0 - 0 - 0 -
Total birds 8,401 30% 5,909 – 10,894 2,152 70% 352 69% 5,896 34%Sampling effort (Aleutian/Pribilof Islands, 2008): 4 out of 12 villages in this region were surveyed; 2 out of 2 subregions were surveyed. -: No reported harvest.
Number

29
Table 8.–Estimated harvest of eggs, Aleutian–Pribilof Islands Region, 2008. Annual estimated egg harvest Estimated egg harvest by seasonSpecies Confidence Interval Spring Summer Fall-Winter
95% CI Low – High Number 95% CI Number 95% CI Number 95% CIDucks
Wigeon 0 - - 0 - 0 - 0 -Green-winged teal 0 - - 0 - 0 - 0 -Mallard 0 - - 0 - 0 - 0 -Pintail 0 - - 0 - 0 - 0 -Shoveler 0 - - 0 - 0 - 0 -Black scoter 0 - - 0 - 0 - 0 -Surf scoter 0 - - 0 - 0 - 0 -White-winged scoter 0 - - 0 - 0 - 0 -Bufflehead 0 - - 0 - 0 - 0 -Goldeneye 0 - - 0 - 0 - 0 -Canvasback 0 - - 0 - 0 - 0 -Scaup 0 - - 0 - 0 - 0 -Common eider 0 - - 0 - 0 - 0 -King eider 0 - - 0 - 0 - 0 -Spectacled eider 0 - - 0 - 0 - 0 -Steller's eider 0 - - 0 - 0 - 0 -Harlequin duck 0 - - 0 - 0 - 0 -Long-tailed duck 0 - - 0 - 0 - 0 -Common merganser 0 - - 0 - 0 - 0 -Red-breasted merganser 32 169% 6 – 87 32 177% 0 - 0 -Duck (unidentified) 194 169% 36 – 522 129 177% 65 177% 0 -
Total ducks 226 169% 42 – 609 162 177% 65 177% 0 -Geese
Black brant 0 - - 0 - 0 - 0 -Cackling Canada goose 0 - - 0 - 0 - 0 -Lesser Canada goose 0 - - 0 - 0 - 0 -White-fronted goose 0 - - 0 - 0 - 0 -Emperor goose 0 - - 0 - 0 - 0 -Lesser snow goose 0 - - 0 - 0 - 0 -
Total geese 0 - - 0 - 0 - 0 -Swans
Tundra swan 0 - - 0 - 0 - 0 -Cranes
Sandhill crane 0 - - 0 - 0 - 0 -Grouse
Ptarmigan 11 169% 2 – 29 11 177% 0 - 0 -Seabirds
Cormorant 0 - - 0 - 0 - 0 -Arctic tern 0 - - 0 - 0 - 0 -Black-legged kittiwake 0 - - 0 - 0 - 0 -Red-legged kittiwake 0 - - 0 - 0 - 0 -Sabine's gull 0 - - 0 - 0 - 0 -Glaucous-winged gull 3,779 42% 2,198 – 5,359 2,783 44% 996 66% 0 -Herring gull 498 102% 136 – 1,008 215 177% 283 126% 0 -Auklet 0 - - 0 - 0 - 0 -Murre 65 169% 12 – 174 0 - 65 177% 0 -Guillemot 0 - - 0 - 0 - 0 -Puffin 0 - - 0 - 0 - 0 -
Total seabirds 4,342 40% 2,585 – 6,098 2,998 43% 1,344 56% 0 -Shorebirds
Black oystercatcher 172 159% 35 – 446 168 170% 4 142% 0 -Bristle-thighed curlew 0 - - 0 - 0 - 0 -Godwit 0 - - 0 - 0 - 0 -Golden plover 0 - - 0 - 0 - 0 -Small shorebird 0 - - 0 - 0 - 0 -
Total shorebirds 172 159% 35 – 446 168 170% 4 142% 0 -Grebes and loons
Common loon 0 - - 0 - 0 - 0 -Pacific loon 0 - - 0 - 0 - 0 -Red-throated loon 0 - - 0 - 0 - 0 -Yellow-billed loon 0 - - 0 - 0 - 0 -
Total grebes and loons 0 - - 0 - 0 - 0 -Other/unknown bird 27 169% 5 – 73 27 177% 0 - 0 -
Total eggs 4,778 43% 2,704 – 6,852 3,365 48% 1,413 55% 0 -Sampling effort (Aleutian/Pribilof Islands, 2008): 4 out of 12 villages in this region were surveyed; 2 out of 2 subregions were surveyed. -: No reported harvest.
Number

30
Table 9.–Estimated harvest of birds, Aleutian–Pribilof Islands Region, Aleutian–Pribilof Villages Subregion, 2008.
Annual estimated bird harvest Estimated bird harvest by seasonSpecies Confidence Interval Spring Summer Fall-Winter
95% CI Low - High Number 95% CI Number 95% CI Number 95% CIDucks
Wigeon 0 - - 0 - 0 - 0 -Green-winged teal 1,566 38% 972 – 2,159 583 89% 24 126% 959 88%Mallard 2,000 31% 1,373 – 2,627 454 97% 18 126% 1,529 59%Pintail 33 105% 10 – 68 0 - 0 - 33 124%Shoveler 0 - - 0 - 0 - 0 -Black scoter 77 70% 34 – 131 0 - 18 126% 59 85%Surf scoter 0 - - 0 - 0 - 0 -White-winged scoter 58 98% 27 – 115 0 - 0 - 58 98%Bufflehead 29 80% 12 – 52 0 - 12 126% 17 112%Goldeneye 3 111% 1 – 6 0 - 3 126% 0 -Canvasback 0 - - 0 - 0 - 0 -Scaup 9 81% 4 – 17 0 - 3 126% 6 106%Common eider 0 - - 0 - 0 - 0 -King eider 0 - - 0 - 0 - 0 -Spectacled eider 0 - - 0 - 0 - 0 -Steller's eider 12 111% 4 – 25 0 - 0 - 12 126%Harlequin duck 129 82% 60 – 235 0 - 0 - 129 82%Long-tailed duck 0 - - 0 - 0 - 0 -Common merganser 17 90% 7 – 33 0 - 9 126% 8 142%Red-breasted merganser 0 - - 0 - 0 - 0 -
Total ducks 3,933 31% 2,732 – 5,135 1,037 85% 85 126% 2,811 61%Geese
Black brant 523 30% 365 – 681 0 - 6 126% 517 40%Cackling Canada goose 996 30% 700 – 1,292 259 129% 0 - 737 49%Lesser Canada goose 0 - - 0 - 0 - 0 -White-fronted goose 0 - - 0 - 0 - 0 -Emperor goose 45 58% 19 – 70 0 - 12 126% 33 73%Lesser snow goose 0 - - 0 - 0 - 0 -
Total geese 1,563 24% 1,194 – 1,932 259 129% 18 126% 1,286 36%Swans
Tundra swan 0 - - 0 - 0 - 0 -Cranes
Sandhill crane 0 - - 0 - 0 - 0 -Grouse
Ptarmigan 1,829 32% 1,238 – 2,421 432 129% 18 123% 1,379 55%Seabirds
Cormorant 0 - - 0 - 0 - 0 -Arctic tern 0 - - 0 - 0 - 0 -Black-legged kittiwake 0 - - 0 - 0 - 0 -Red-legged kittiwake 0 - - 0 - 0 - 0 -Sabine's gull 0 - - 0 - 0 - 0 -Glaucous-winged gull 0 - - 0 - 0 - 0 -Herring gull 0 - - 0 - 0 - 0 -Auklet 0 - - 0 - 0 - 0 -Murre 0 - - 0 - 0 - 0 -Guillemot 0 - - 0 - 0 - 0 -Puffin 252 50% 127 – 378 166 66% 86 80% 0 -
Total seabirds 252 50% 127 – 378 166 66% 86 80% 0 -Shorebirds
Black oystercatcher 64 142% 30 – 154 0 - 64 142% 0 -Bristle-thighed curlew 0 - - 0 - 0 - 0 -Godwit 0 - - 0 - 0 - 0 -Golden plover 0 - - 0 - 0 - 0 -Small shorebird 0 - - 0 - 0 - 0 -
Total shorebirds 64 142% 30 – 154 0 - 64 142% 0 -Grebes and loons
Common loon 0 - - 0 - 0 - 0 -Pacific loon 0 - - 0 - 0 - 0 -Red-throated loon 0 - - 0 - 0 - 0 -Yellow-billed loon 0 - - 0 - 0 - 0 -
Total grebes and loons 0 - - 0 - 0 - 0 -
Total birds 7,642 21% 6,030 – 9,254 1,894 77% 272 73% 5,476 36%Sampling effort (Aleutian/Pribilof Villages, 2008): 4 out of 11 villages in this subregion were surveyed; 47% of subregion households were represented in the sample. -: No reported harvest.
Number

31
Table 10.–Estimated harvest of eggs, Aleutian–Pribilof Islands Region, Aleutian–Pribilof Villages Subregion, 2008.
Annual estimated egg harvest Estimated egg harvest by seasonSpecies Confidence Interval Spring Summer Fall-Winter
95% CI Low – High Number 95% CI Number 95% CI Number 95% CIDucks
Wigeon 0 - - 0 - 0 - 0 -Green-winged teal 0 - - 0 - 0 - 0 -Mallard 0 - - 0 - 0 - 0 -Pintail 0 - - 0 - 0 - 0 -Shoveler 0 - - 0 - 0 - 0 -Black scoter 0 - - 0 - 0 - 0 -Surf scoter 0 - - 0 - 0 - 0 -White-winged scoter 0 - - 0 - 0 - 0 -Bufflehead 0 - - 0 - 0 - 0 -Goldeneye 0 - - 0 - 0 - 0 -Canvasback 0 - - 0 - 0 - 0 -Scaup 0 - - 0 - 0 - 0 -Common eider 0 - - 0 - 0 - 0 -King eider 0 - - 0 - 0 - 0 -Spectacled eider 0 - - 0 - 0 - 0 -Steller's eider 0 - - 0 - 0 - 0 -Harlequin duck 0 - - 0 - 0 - 0 -Long-tailed duck 0 - - 0 - 0 - 0 -Common merganser 0 - - 0 - 0 - 0 -Red-breasted merganser 0 - - 0 - 0 - 0 -
Total ducks 0 - - 0 - 0 - 0 -Geese
Black brant 0 - - 0 - 0 - 0 -Cackling Canada goose 0 - - 0 - 0 - 0 -Lesser Canada goose 0 - - 0 - 0 - 0 -White-fronted goose 0 - - 0 - 0 - 0 -Emperor goose 0 - - 0 - 0 - 0 -Lesser snow goose 0 - - 0 - 0 - 0 -
Total geese 0 - - 0 - 0 - 0 -Swans
Tundra swan 0 - - 0 - 0 - 0 -Cranes
Sandhill crane 0 - - 0 - 0 - 0 -Grouse
Ptarmigan 0 - - 0 - 0 - 0 -Seabirds
Cormorant 0 - - 0 - 0 - 0 -Arctic tern 0 - - 0 - 0 - 0 -Black-legged kittiwake 0 - - 0 - 0 - 0 -Red-legged kittiwake 0 - - 0 - 0 - 0 -Sabine's gull 0 - - 0 - 0 - 0 -Glaucous-winged gull 3,725 31% 2,586 – 4,864 2,729 45% 996 66% 0 -Herring gull 283 111% 96 – 598 0 - 283 126% 0 -Auklet 0 - - 0 - 0 - 0 -Murre 0 - - 0 - 0 - 0 -Guillemot 0 - - 0 - 0 - 0 -Puffin 0 - - 0 - 0 - 0 -
Total seabirds 4,008 30% 2,823 – 5,193 2,729 45% 1,279 58% 0 -Shorebirds
Black oystercatcher 11 103% 5 – 22 6 142% 4 142% 0 -Bristle-thighed curlew 0 - - 0 - 0 - 0 -Godwit 0 - - 0 - 0 - 0 -Golden plover 0 - - 0 - 0 - 0 -Small shorebird 0 - - 0 - 0 - 0 -
Total shorebirds 11 103% 5 – 22 6 142% 4 142% 0 -Grebes and loons
Common loon 0 - - 0 - 0 - 0 -Pacific loon 0 - - 0 - 0 - 0 -Red-throated loon 0 - - 0 - 0 - 0 -Yellow-billed loon 0 - - 0 - 0 - 0 -
Total grebes and loons 0 - - 0 - 0 - 0 -
Total eggs 4,018 30% 2,829 – 5,208 2,735 45% 1,283 58% 0 -Sampling effort (Aleutian/Pribilof Villages, 2008): 4 out of 11 villages in this subregion were surveyed; 47% of subregion households were represented in the sample. -: No reported harvest.
Number
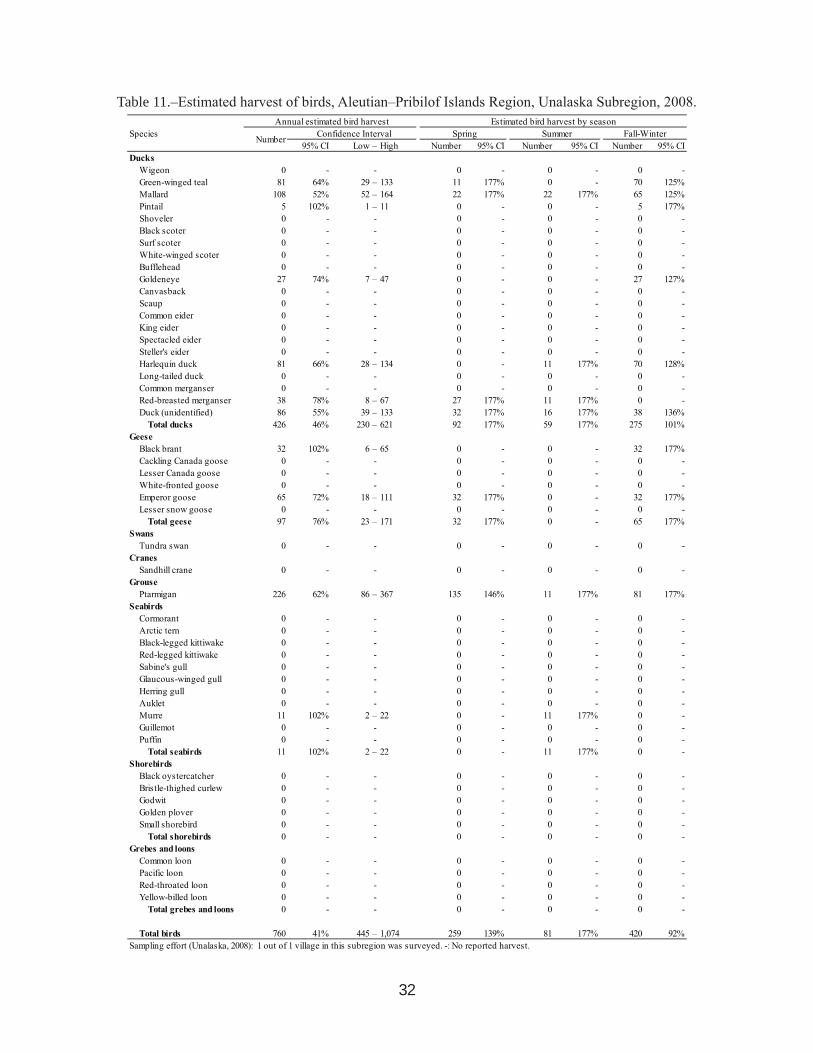
32
Table 11.–Estimated harvest of birds, Aleutian–Pribilof Islands Region, Unalaska Subregion, 2008. Annual estimated bird harvest Estimated bird harvest by seasonSpecies Confidence Interval Spring Summer Fall-Winter
95% CI Low – High Number 95% CI Number 95% CI Number 95% CIDucks
Wigeon 0 - - 0 - 0 - 0 -Green-winged teal 81 64% 29 – 133 11 177% 0 - 70 125%Mallard 108 52% 52 – 164 22 177% 22 177% 65 125%Pintail 5 102% 1 – 11 0 - 0 - 5 177%Shoveler 0 - - 0 - 0 - 0 -Black scoter 0 - - 0 - 0 - 0 -Surf scoter 0 - - 0 - 0 - 0 -White-winged scoter 0 - - 0 - 0 - 0 -Bufflehead 0 - - 0 - 0 - 0 -Goldeneye 27 74% 7 – 47 0 - 0 - 27 127%Canvasback 0 - - 0 - 0 - 0 -Scaup 0 - - 0 - 0 - 0 -Common eider 0 - - 0 - 0 - 0 -King eider 0 - - 0 - 0 - 0 -Spectacled eider 0 - - 0 - 0 - 0 -Steller's eider 0 - - 0 - 0 - 0 -Harlequin duck 81 66% 28 – 134 0 - 11 177% 70 128%Long-tailed duck 0 - - 0 - 0 - 0 -Common merganser 0 - - 0 - 0 - 0 -Red-breasted merganser 38 78% 8 – 67 27 177% 11 177% 0 -Duck (unidentified) 86 55% 39 – 133 32 177% 16 177% 38 136%
Total ducks 426 46% 230 – 621 92 177% 59 177% 275 101%Geese
Black brant 32 102% 6 – 65 0 - 0 - 32 177%Cackling Canada goose 0 - - 0 - 0 - 0 -Lesser Canada goose 0 - - 0 - 0 - 0 -White-fronted goose 0 - - 0 - 0 - 0 -Emperor goose 65 72% 18 – 111 32 177% 0 - 32 177%Lesser snow goose 0 - - 0 - 0 - 0 -
Total geese 97 76% 23 – 171 32 177% 0 - 65 177%Swans
Tundra swan 0 - - 0 - 0 - 0 -Cranes
Sandhill crane 0 - - 0 - 0 - 0 -Grouse
Ptarmigan 226 62% 86 – 367 135 146% 11 177% 81 177%Seabirds
Cormorant 0 - - 0 - 0 - 0 -Arctic tern 0 - - 0 - 0 - 0 -Black-legged kittiwake 0 - - 0 - 0 - 0 -Red-legged kittiwake 0 - - 0 - 0 - 0 -Sabine's gull 0 - - 0 - 0 - 0 -Glaucous-winged gull 0 - - 0 - 0 - 0 -Herring gull 0 - - 0 - 0 - 0 -Auklet 0 - - 0 - 0 - 0 -Murre 11 102% 2 – 22 0 - 11 177% 0 -Guillemot 0 - - 0 - 0 - 0 -Puffin 0 - - 0 - 0 - 0 -
Total seabirds 11 102% 2 – 22 0 - 11 177% 0 -Shorebirds
Black oystercatcher 0 - - 0 - 0 - 0 -Bristle-thighed curlew 0 - - 0 - 0 - 0 -Godwit 0 - - 0 - 0 - 0 -Golden plover 0 - - 0 - 0 - 0 -Small shorebird 0 - - 0 - 0 - 0 -
Total shorebirds 0 - - 0 - 0 - 0 -Grebes and loons
Common loon 0 - - 0 - 0 - 0 -Pacific loon 0 - - 0 - 0 - 0 -Red-throated loon 0 - - 0 - 0 - 0 -Yellow-billed loon 0 - - 0 - 0 - 0 -
Total grebes and loons 0 - - 0 - 0 - 0 -
Total birds 760 41% 445 – 1,074 259 139% 81 177% 420 92%Sampling effort (Unalaska, 2008): 1 out of 1 village in this subregion was surveyed. -: No reported harvest.
Number

33
Table 12.–Estimated harvest of eggs, Aleutian–Pribilof Islands Region, Unalaska Subregion, 2008. Annual estimated egg harvest Estimated egg harvest by seasonSpecies Confidence Interval Spring Summer Fall-Winter
95% CI Low – High Number 95% CI Number 95% CI Number 95% CIDucks
Wigeon 0 - - 0 - 0 - 0 -Green-winged teal 0 - - 0 - 0 - 0 -Mallard 0 - - 0 - 0 - 0 -Pintail 0 - - 0 - 0 - 0 -Shoveler 0 - - 0 - 0 - 0 -Black scoter 0 - - 0 - 0 - 0 -Surf scoter 0 - - 0 - 0 - 0 -White-winged scoter 0 - - 0 - 0 - 0 -Bufflehead 0 - - 0 - 0 - 0 -Goldeneye 0 - - 0 - 0 - 0 -Canvasback 0 - - 0 - 0 - 0 -Scaup 0 - - 0 - 0 - 0 -Common eider 0 - - 0 - 0 - 0 -King eider 0 - - 0 - 0 - 0 -Spectacled eider 0 - - 0 - 0 - 0 -Steller's eider 0 - - 0 - 0 - 0 -Harlequin duck 0 - - 0 - 0 - 0 -Long-tailed duck 0 - - 0 - 0 - 0 -Common merganser 0 - - 0 - 0 - 0 -Red-breasted merganser 32 102% 6 – 65 32 177% 0 - 0 -Duck (unidentified) 194 76% 46 – 341 129 177% 65 177% 0 -
Total ducks 226 78% 49 – 404 162 177% 65 177% 0 -Geese
Black brant 0 - - 0 - 0 - 0 -Cackling Canada goose 0 - - 0 - 0 - 0 -Lesser Canada goose 0 - - 0 - 0 - 0 -White-fronted goose 0 - - 0 - 0 - 0 -Emperor goose 0 - - 0 - 0 - 0 -Lesser snow goose 0 - - 0 - 0 - 0 -
Total geese 0 - - 0 - 0 - 0 -Swans
Tundra swan 0 - - 0 - 0 - 0 -Cranes
Sandhill crane 0 - - 0 - 0 - 0 -Grouse
Ptarmigan 11 102% 2 – 22 11 177% 0 - 0 -Seabirds
Cormorant 0 - - 0 - 0 - 0 -Arctic tern 0 - - 0 - 0 - 0 -Black-legged kittiwake 0 - - 0 - 0 - 0 -Red-legged kittiwake 0 - - 0 - 0 - 0 -Sabine's gull 0 - - 0 - 0 - 0 -Glaucous-winged gull 54 102% 10 – 109 54 177% 0 - 0 -Herring gull 215 102% 40 – 435 215 177% 0 - 0 -Auklet 0 - - 0 - 0 - 0 -Murre 65 102% 12 – 131 0 - 65 177% 0 -Guillemot 0 - - 0 - 0 - 0 -Puffin 0 - - 0 - 0 - 0 -
Total seabirds 334 71% 98 – 570 269 146% 65 177% 0 -Shorebirds
Black oystercatcher 162 102% 30 – 327 162 177% 0 - 0 -Bristle-thighed curlew 0 - - 0 - 0 - 0 -Godwit 0 - - 0 - 0 - 0 -Golden plover 0 - - 0 - 0 - 0 -Small shorebird 0 - - 0 - 0 - 0 -
Total shorebirds 162 102% 30 – 327 162 177% 0 - 0 -Grebes and loons
Common loon 0 - - 0 - 0 - 0 -Pacific loon 0 - - 0 - 0 - 0 -Red-throated loon 0 - - 0 - 0 - 0 -Yellow-billed loon 0 - - 0 - 0 - 0 -
Total grebes and loons 0 - - 0 - 0 - 0 -Other/unknown bird 27 - - 27 - 0 - 0 -
Total eggs 760 80% 154 – 1,365 630 162% 129 177% 0 -Sampling effort (Unalaska, 2008): 1 out of 1 village in this subregion was surveyed. -: No reported harvest.
Number

34
Table 13.–Estimated harvest of birds, Bristol Bay Region, 2008. Annual estimated bird harvest Estimated bird harvest by seasonSpecies Confidence Interval Spring Summer Fall/Fall-Winter
95% CI Low – High Number 95% CI Number 95% CI Number 95% CIDucks
Wigeon 406 44% 227 – 586 217 50% 77 71% 112 49%Green-winged teal 919 39% 562 – 1,276 443 34% 145 74% 330 51%Mallard 3,520 18% 2,897 – 4,142 2,435 17% 543 36% 541 33%Pintail 3,276 22% 2,563 – 3,989 2,332 22% 449 51% 494 36%Shoveler 443 42% 255 – 630 246 53% 76 65% 121 92%Black scoter 125 56% 55 – 195 59 88% 37 102% 29 102%Surf scoter 102 146% 21 – 251 10 88% 0 - 92 161%White-winged scoter 0 - - 0 - 0 - 0 -Bufflehead 0 - - 0 - 0 - 0 -Goldeneye 280 57% 120 – 440 249 64% 26 79% 4 144%Canvasback 0 - - 0 - 0 - 0 -Scaup 2 144% 1 – 5 2 144% 0 - 0 -Common eider 22 144% 10 – 53 22 144% 0 - 0 -King eider 64 85% 9 – 119 64 85% 0 - 0 -Spectacled eider 0 - - 0 - 0 - 0 -Steller's eider 37 98% 4 – 73 37 98% 0 - 0 -Harlequin duck 149 81% 29 – 269 103 107% 0 - 46 105%Long-tailed duck 20 89% 2 – 37 20 88% 0 - 0 -Common merganser 0 - - 0 - 0 - 0 -Red-breasted merganser 28 170% 6 – 76 0 - 0 - 28 170%
Total ducks 9,392 17% 7,752 – 11,032 6,239 17% 1,354 37% 1,798 30%Geese
Black brant 219 62% 84 – 354 150 51% 0 - 69 161%Cackling Canada goose 4,499 23% 3,456 – 5,541 3,451 21% 555 52% 492 52%Lesser Canada goose 1,587 24% 1,199 – 1,975 1,121 21% 228 65% 237 51%White-fronted goose 2,237 23% 1,719 – 2,755 1,548 23% 262 61% 427 45%Emperor goose 0 - - 0 - 0 - 0 -Lesser snow goose 0 - - 0 - 0 - 0 -
Total geese 8,541 20% 6,873 – 10,210 6,270 16% 1,045 54% 1,226 37%Swans
Tundra swan 92 36% 59 – 126 60 41% 32 72% 0 -Cranes
Sandhill crane 325 34% 214 – 437 201 33% 71 51% 53 56%Grouse
Spruce grouse 5,579 21% 4,423 – 6,734 595 40% 170 53% 4,814 23%Ptarmigan 7,893 21% 6,251 – 9,534 6,783 23% 226 56% 883 53%
Total grouse 13,471 17% 11,167 – 15,776 7,378 22% 397 40% 5,697 21%Seabirds
Cormorant 0 - - 0 - 0 - 0 -Arctic tern 0 - - 0 - 0 - 0 -Black-legged kittiwake 0 - - 0 - 0 - 0 -Red-legged kittiwake 0 - - 0 - 0 - 0 -Kittiwake 0 - - 0 - 0 - 0 -Sabine's gull 0 - - 0 - 0 - 0 -Mew gull 203 68% 65 – 342 203 68% 0 - 0 -Glaucous-winged gull 0 - - 0 - 0 - 0 -Glaucous gull 805 66% 271 – 1,339 805 66% 0 - 0 -Herring gull 0 - - 0 - 0 - 0 -Auklet 0 - - 0 - 0 - 0 -Murre 0 - - 0 - 0 - 0 -Guillemot 0 - - 0 - 0 - 0 -Puffin 0 - - 0 - 0 - 0 -
Total seabirds 1,008 55% 458 – 1,558 1,008 54% 0 - 0 -Shorebirds
Black oystercatcher 0 - - 0 - 0 - 0 -Whimbrel 0 - - 0 - 0 - 0 -Bristle-thighed curlew 0 - - 0 - 0 - 0 -Godwit 0 - - 0 - 0 - 0 -Golden plover 0 - - 0 - 0 - 0 -Small shorebird 165 98% 18 – 326 165 98% 0 - 0 -
Total shorebirds 165 98% 18 – 326 165 98% 0 - 0 -Grebes and loons
Common loon 0 - - 0 - 0 - 0 -Pacific loon 0 - - 0 - 0 - 0 -Red-throated loon 0 - - 0 - 0 - 0 -Yellow-billed loon 0 - - 0 - 0 - 0 -
Total grebes and loons 0 - - 0 - 0 - 0 -
Total birds 32,995 14% 28,326 – 37,663 21,321 14% 2,900 35% 8,774 19%Sampling effort (Bristol Bay, 2008): 9 out of 27 villages in this region were surveyed; 3 out of 3 subregions were surveyed. -: No reported harvest.
Number
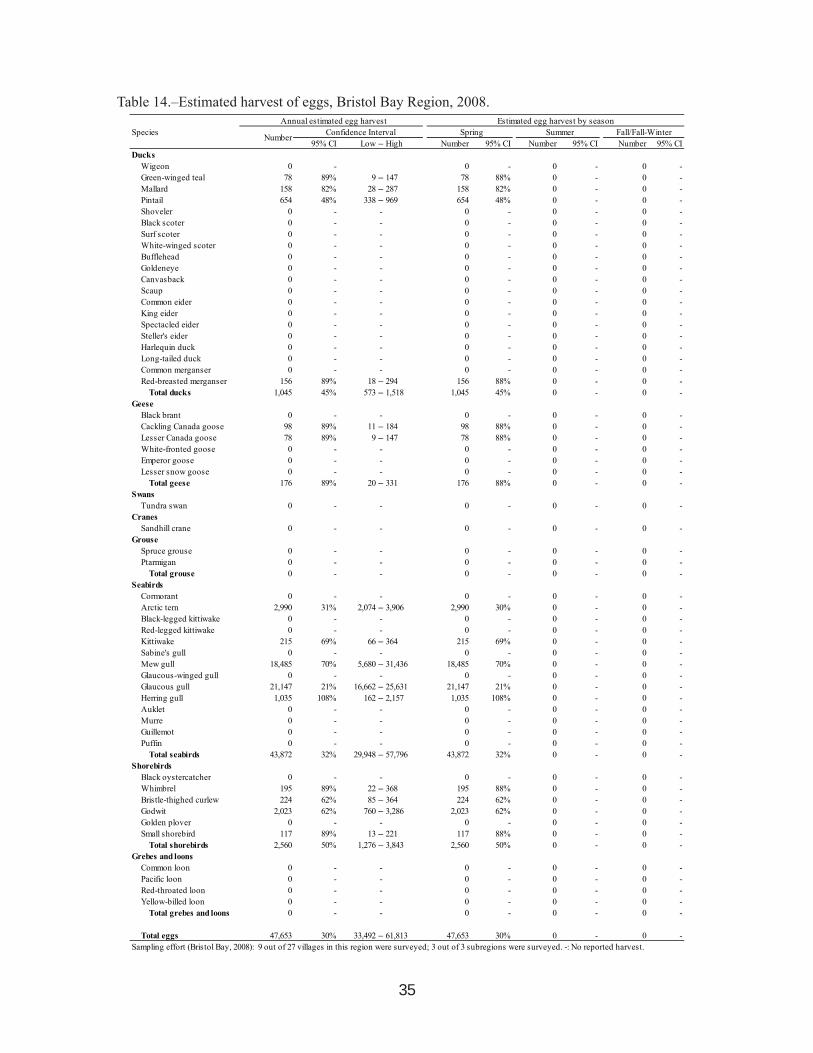
35
Table 14.–Estimated harvest of eggs, Bristol Bay Region, 2008. Annual estimated egg harvest Estimated egg harvest by seasonSpecies Confidence Interval Spring Summer Fall/Fall-Winter
95% CI Low – High Number 95% CI Number 95% CI Number 95% CIDucks
Wigeon 0 - 0 - 0 - 0 -Green-winged teal 78 89% 9 – 147 78 88% 0 - 0 -Mallard 158 82% 28 – 287 158 82% 0 - 0 -Pintail 654 48% 338 – 969 654 48% 0 - 0 -Shoveler 0 - - 0 - 0 - 0 -Black scoter 0 - - 0 - 0 - 0 -Surf scoter 0 - - 0 - 0 - 0 -White-winged scoter 0 - - 0 - 0 - 0 -Bufflehead 0 - - 0 - 0 - 0 -Goldeneye 0 - - 0 - 0 - 0 -Canvasback 0 - - 0 - 0 - 0 -Scaup 0 - - 0 - 0 - 0 -Common eider 0 - - 0 - 0 - 0 -King eider 0 - - 0 - 0 - 0 -Spectacled eider 0 - - 0 - 0 - 0 -Steller's eider 0 - - 0 - 0 - 0 -Harlequin duck 0 - - 0 - 0 - 0 -Long-tailed duck 0 - - 0 - 0 - 0 -Common merganser 0 - - 0 - 0 - 0 -Red-breasted merganser 156 89% 18 – 294 156 88% 0 - 0 -
Total ducks 1,045 45% 573 – 1,518 1,045 45% 0 - 0 -Geese
Black brant 0 - - 0 - 0 - 0 -Cackling Canada goose 98 89% 11 – 184 98 88% 0 - 0 -Lesser Canada goose 78 89% 9 – 147 78 88% 0 - 0 -White-fronted goose 0 - - 0 - 0 - 0 -Emperor goose 0 - - 0 - 0 - 0 -Lesser snow goose 0 - - 0 - 0 - 0 -
Total geese 176 89% 20 – 331 176 88% 0 - 0 -Swans
Tundra swan 0 - - 0 - 0 - 0 -Cranes
Sandhill crane 0 - - 0 - 0 - 0 -Grouse
Spruce grouse 0 - - 0 - 0 - 0 -Ptarmigan 0 - - 0 - 0 - 0 -
Total grouse 0 - - 0 - 0 - 0 -Seabirds
Cormorant 0 - - 0 - 0 - 0 -Arctic tern 2,990 31% 2,074 – 3,906 2,990 30% 0 - 0 -Black-legged kittiwake 0 - - 0 - 0 - 0 -Red-legged kittiwake 0 - - 0 - 0 - 0 -Kittiwake 215 69% 66 – 364 215 69% 0 - 0 -Sabine's gull 0 - - 0 - 0 - 0 -Mew gull 18,485 70% 5,680 – 31,436 18,485 70% 0 - 0 -Glaucous-winged gull 0 - - 0 - 0 - 0 -Glaucous gull 21,147 21% 16,662 – 25,631 21,147 21% 0 - 0 -Herring gull 1,035 108% 162 – 2,157 1,035 108% 0 - 0 -Auklet 0 - - 0 - 0 - 0 -Murre 0 - - 0 - 0 - 0 -Guillemot 0 - - 0 - 0 - 0 -Puffin 0 - - 0 - 0 - 0 -
Total seabirds 43,872 32% 29,948 – 57,796 43,872 32% 0 - 0 -Shorebirds
Black oystercatcher 0 - - 0 - 0 - 0 -Whimbrel 195 89% 22 – 368 195 88% 0 - 0 -Bristle-thighed curlew 224 62% 85 – 364 224 62% 0 - 0 -Godwit 2,023 62% 760 – 3,286 2,023 62% 0 - 0 -Golden plover 0 - - 0 - 0 - 0 -Small shorebird 117 89% 13 – 221 117 88% 0 - 0 -
Total shorebirds 2,560 50% 1,276 – 3,843 2,560 50% 0 - 0 -Grebes and loons
Common loon 0 - - 0 - 0 - 0 -Pacific loon 0 - - 0 - 0 - 0 -Red-throated loon 0 - - 0 - 0 - 0 -Yellow-billed loon 0 - - 0 - 0 - 0 -
Total grebes and loons 0 - - 0 - 0 - 0 -
Total eggs 47,653 30% 33,492 – 61,813 47,653 30% 0 - 0 -Sampling effort (Bristol Bay, 2008): 9 out of 27 villages in this region were surveyed; 3 out of 3 subregions were surveyed. -: No reported harvest.
Number

36
Table 15.–Estimated harvest of birds, Bristol Bay Region, South Alaska Peninsula Subregion, 2008.
Annual estimated bird harvest Estimated bird harvest by seasonSpecies Confidence Interval Spring Summer Fall-Winter
95% CI Low – High Number 95% CI Number 95% CI Number 95% CIDucks
Wigeon 0 - - 0 - 0 - 0 -Green-winged teal 0 - - 0 - 0 - 0 -Mallard 46 114% 8 – 98 18 110% 0 - 28 170%Pintail 0 - - 0 - 0 - 0 -Shoveler 0 - - 0 - 0 - 0 -Black scoter 14 174% 3 – 39 0 - 0 - 14 170%Surf scoter 0 - - 0 - 0 - 0 -White-winged scoter 0 - - 0 - 0 - 0 -Bufflehead 0 - - 0 - 0 - 0 -Goldeneye 0 - - 0 - 0 - 0 -Canvasback 0 - - 0 - 0 - 0 -Scaup 0 - - 0 - 0 - 0 -Common eider 0 - - 0 - 0 - 0 -King eider 0 - - 0 - 0 - 0 -Spectacled eider 0 - - 0 - 0 - 0 -Steller's eider 0 - - 0 - 0 - 0 -Harlequin duck 0 - - 0 - 0 - 0 -Long-tailed duck 0 - - 0 - 0 - 0 -Common merganser 0 - - 0 - 0 - 0 -Red-breasted merganser 28 174% 6 – 77 0 - 0 - 28 170%
Total ducks 88 141% 17 – 213 18 110% 0 - 71 170%Geese
Black brant 0 - - 0 - 0 - 0 -Cackling Canada goose 0 - - 0 - 0 - 0 -Lesser Canada goose 0 - - 0 - 0 - 0 -White-fronted goose 0 - - 0 - 0 - 0 -Emperor goose 0 - - 0 - 0 - 0 -Lesser snow goose 0 - - 0 - 0 - 0 -
Total geese 0 - - 0 - 0 - 0 -Swans
Tundra swan 0 - - 0 - 0 - 0 -Cranes
Sandhill crane 0 - - 0 - 0 - 0 -Grouse
Ptarmigan 27 104% 3 – 54 27 110% 0 - 0 -Seabirds
Cormorant 0 - - 0 - 0 - 0 -Arctic tern 0 - - 0 - 0 - 0 -Black-legged kittiwake 0 - - 0 - 0 - 0 -Red-legged kittiwake 0 - - 0 - 0 - 0 -Sabine's gull 0 - - 0 - 0 - 0 -Glaucous-winged gull 0 - - 0 - 0 - 0 -Herring gull 0 - - 0 - 0 - 0 -Auklet 0 - - 0 - 0 - 0 -Murre 0 - - 0 - 0 - 0 -Guillemot 0 - - 0 - 0 - 0 -Puffin 0 - - 0 - 0 - 0 -
Total seabirds 0 - - 0 - 0 - 0 -Shorebirds
Black oystercatcher 0 - - 0 - 0 - 0 -Bristle-thighed curlew 0 - - 0 - 0 - 0 -Godwit 0 - - 0 - 0 - 0 -Golden plover 0 - - 0 - 0 - 0 -Small shorebird 0 - - 0 - 0 - 0 -
Total shorebirds 0 - - 0 - 0 - 0 -Grebes and loons
Common loon 0 - - 0 - 0 - 0 -Pacific loon 0 - - 0 - 0 - 0 -Red-throated loon 0 - - 0 - 0 - 0 -Yellow-billed loon 0 - - 0 - 0 - 0 -
Total grebes and loons 0 - - 0 - 0 - 0 -
Total birds 115 111% 20 – 242 44 76% 0 - 71 170%Sampling effort (South Alaska Peninsula, 2008): 1 out of 5 villages in this subregion were surveyed; 21% of subregion households were represented in the sample. -: No reported harvest.
Number

37
Table 16.–Estimated harvest of eggs, Bristol Bay Region, South Alaska Peninsula Subregion, 2008. Annual estimated egg harvest Estimated egg harvest by seasonSpecies Confidence Interval Spring Summer Fall-Winter
95% CI Low – High Number 95% CI Number 95% CI Number 95% CIDucks
Wigeon 0 - - 0 - 0 - 0 -Green-winged teal 0 - - 0 - 0 - 0 -Mallard 0 - - 0 - 0 - 0 -Pintail 0 - - 0 - 0 - 0 -Shoveler 0 - - 0 - 0 - 0 -Black scoter 0 - - 0 - 0 - 0 -Surf scoter 0 - - 0 - 0 - 0 -White-winged scoter 0 - - 0 - 0 - 0 -Bufflehead 0 - - 0 - 0 - 0 -Goldeneye 0 - - 0 - 0 - 0 -Canvasback 0 - - 0 - 0 - 0 -Scaup 0 - - 0 - 0 - 0 -Common eider 0 - - 0 - 0 - 0 -King eider 0 - - 0 - 0 - 0 -Spectacled eider 0 - - 0 - 0 - 0 -Steller's eider 0 - - 0 - 0 - 0 -Harlequin duck 0 - - 0 - 0 - 0 -Long-tailed duck 0 - - 0 - 0 - 0 -Common merganser 0 - - 0 - 0 - 0 -Red-breasted merganser 0 - - 0 - 0 - 0 -
Total ducks 0 - - 0 - 0 - 0 -Geese
Black brant 0 - - 0 - 0 - 0 -Cackling Canada goose 0 - - 0 - 0 - 0 -Lesser Canada goose 0 - - 0 - 0 - 0 -White-fronted goose 0 - - 0 - 0 - 0 -Emperor goose 0 - - 0 - 0 - 0 -Lesser snow goose 0 - - 0 - 0 - 0 -
Total geese 0 - - 0 - 0 - 0 -Swans
Tundra swan 0 - - 0 - 0 - 0 -Cranes
Sandhill crane 0 - - 0 - 0 - 0 -Grouse
Ptarmigan 0 - - 0 - 0 - 0 -Seabirds
Cormorant 0 - - 0 - 0 - 0 -Arctic tern 0 - - 0 - 0 - 0 -Black-legged kittiwake 0 - - 0 - 0 - 0 -Red-legged kittiwake 0 - - 0 - 0 - 0 -Sabine's gull 0 - - 0 - 0 - 0 -Glaucous-winged gull 0 - - 0 - 0 - 0 -Herring gull 106 104% 12 – 216 106 110% 0 - 0 -Auklet 0 - - 0 - 0 - 0 -Murre 0 - - 0 - 0 - 0 -Guillemot 0 - - 0 - 0 - 0 -Puffin 0 - - 0 - 0 - 0 -
Total seabirds 106 104% 12 – 216 106 110% 0 - 0 -Shorebirds
Black oystercatcher 0 - - 0 - 0 - 0 -Bristle-thighed curlew 0 - - 0 - 0 - 0 -Godwit 0 - - 0 - 0 - 0 -Golden plover 0 - - 0 - 0 - 0 -Small shorebird 0 - - 0 - 0 - 0 -
Total shorebirds 0 - - 0 - 0 - 0 -Grebes and loons
Common loon 0 - - 0 - 0 - 0 -Pacific loon 0 - - 0 - 0 - 0 -Red-throated loon 0 - - 0 - 0 - 0 -Yellow-billed loon 0 - - 0 - 0 - 0 -
Total grebes and loons 0 - - 0 - 0 - 0 -
Total eggs 106 104% 12 – 216 106 110% 0 - 0 -Sampling effort (South Alaska Peninsula, 2008): 1 out of 5 villages in this subregion were surveyed; 21% of subregion households were represented in the sample. -: No reported harvest.
Number

38
Table 17.–Estimated harvest of birds, Bristol Bay Region, Southwest Bristol Bay Subregion, 2008.Annual estimated bird harvest Estimated bird harvest by season
Species Confidence Interval Spring Summer Fall95% CI Low – High Number 95% CI Number 95% CI Number 95% CI
DucksWigeon 365 35% 238 – 491 207 52% 77 71% 81 54%Green-winged teal 816 30% 575 – 1,058 402 36% 145 74% 269 60%Mallard 3,236 17% 2,692 – 3,781 2,233 18% 543 36% 460 37%Pintail 3,068 21% 2,428 – 3,709 2,188 23% 449 51% 430 40%Shoveler 395 43% 224 – 566 207 59% 76 65% 112 99%Black scoter 111 57% 48 – 174 59 88% 37 102% 15 -Surf scoter 102 145% 21 – 251 10 88% 0 - 92 161%White-winged scoter 0 - - 0 - 0 - 0 -Bufflehead 0 - - 0 - 0 - 0 -Goldeneye 275 58% 115 – 436 249 64% 26 79% 0 -Canvasback 0 - - 0 - 0 - 0 -Scaup 0 - - 0 - 0 - 0 -Common eider 0 - - 0 - 0 - 0 -King eider 64 78% 14 – 114 64 85% 0 - 0 -Spectacled eider 0 - - 0 - 0 - 0 -Steller's eider 37 89% 4 – 69 37 98% 0 - 0 -Harlequin duck 149 81% 29 – 270 103 107% 0 - 46 105%Long-tailed duck 20 81% 4 – 35 20 88% 0 - 0 -Common merganser 0 - - 0 - 0 - 0 -Red-breasted merganser 0 - - 0 - 0 - 0 -
Total ducks 8,638 17% 7,199 – 10,077 5,777 18% 1,354 37% 1,506 34%Geese
Black brant 219 60% 87 – 351 150 51% 0 - 69 161%Cackling Canada goose 4,345 20% 3,460 – 5,231 3,359 21% 551 52% 435 58%Lesser Canada goose 1,374 22% 1,069 – 1,679 976 22% 228 65% 169 64%White-fronted goose 2,123 21% 1,671 – 2,574 1,438 25% 262 61% 423 45%Emperor goose 0 - - 0 - 0 - 0 -Lesser snow goose 0 - - 0 - 0 - 0 -
Total geese 8,061 17% 6,668 – 9,455 5,923 17% 1,041 54% 1,097 41%Swans
Tundra swan 88 36% 56 – 120 56 43% 32 72% 0 -Cranes
Sandhill crane 306 27% 224 – 389 195 34% 61 56% 51 58%Grouse
Spruce grouse 4,029 25% 3,032 – 5,026 595 40% 170 53% 3,264 28%Ptarmigan 7,057 23% 5,420 – 8,695 5,959 25% 226 56% 872 53%
Total grouse 11,086 18% 9,094 – 13,079 6,554 24% 397 40% 4,136 24%Seabirds
Cormorant 0 - - 0 - 0 - 0 -Arctic tern 0 - - 0 - 0 - 0 -Kittiwake 0 - - 0 - 0 - 0 -Sabine's gull 0 - - 0 - 0 - 0 -Mew gull 203 63% 76 – 331 203 68% 0 - 0 -Glaucous gull 805 57% 342 – 1,267 805 66% 0 - 0 -Auklet 0 - - 0 - 0 - 0 -Murre 0 - - 0 - 0 - 0 -Guillemot 0 - - 0 - 0 - 0 -Puffin 0 - - 0 - 0 - 0 -
Total seabirds 1,008 48% 528 – 1,488 1,008 54% 0 - 0 -Shorebirds
Whimbrel 0 - - 0 - 0 - 0 -Bristle-thighed curlew 0 - - 0 - 0 - 0 -Godwit 0 - - 0 - 0 - 0 -Golden plover 0 - - 0 - 0 - 0 -Small shorebird 165 89% 18 – 312 165 98% 0 - 0 -
Total shorebirds 165 89% 18 – 312 165 98% 0 - 0 -Grebes and loons
Common loon 0 - - 0 - 0 - 0 -Pacific loon 0 - - 0 - 0 - 0 -Red-throated loon 0 - - 0 - 0 - 0 -Yellow-billed loon 0 - - 0 - 0 - 0 -
Total grebes and loons 0 - - 0 - 0 - 0 -
Total birds 29,352 14% 25,173 – 33,532 19,677 15% 2,885 35% 6,790 23%Sampling effort (Southwest Bristol Bay, 2008): 7 out of 21 villages in this subregion were surveyed; 23% of subregion households were represented in the sample. -: No reported harvest.
Number

39
Table 18.–Estimated harvest of eggs, Bristol Bay Region, Southwest Bristol Bay Subregion, 2008. Annual estimated egg harvest Estimated egg harvest by seasonSpecies Confidence Interval Spring Summer Fall
95% CI Low – High Number 95% CI Number 95% CI Number 95% CIDucks
Wigeon 0 - - 0 - 0 - 0 -Green-winged teal 78 81% 15 – 142 78 88% 0 - 0 -Mallard 158 81% 30 – 285 158 82% 0 - 0 -Pintail 654 46% 354 – 953 654 48% 0 - 0 -Shoveler 0 - - 0 - 0 - 0 -Black scoter 0 - - 0 - 0 - 0 -Surf scoter 0 - - 0 - 0 - 0 -White-winged scoter 0 - - 0 - 0 - 0 -Bufflehead 0 - - 0 - 0 - 0 -Goldeneye 0 - - 0 - 0 - 0 -Canvasback 0 - - 0 - 0 - 0 -Scaup 0 - - 0 - 0 - 0 -Common eider 0 - - 0 - 0 - 0 -King eider 0 - - 0 - 0 - 0 -Spectacled eider 0 - - 0 - 0 - 0 -Steller's eider 0 - - 0 - 0 - 0 -Harlequin duck 0 - - 0 - 0 - 0 -Long-tailed duck 0 - - 0 - 0 - 0 -Common merganser 0 - - 0 - 0 - 0 -Red-breasted merganser 156 81% 29 – 283 156 88% 0 - 0 -
Total ducks 1,045 43% 595 – 1,496 1,045 45% 0 - 0 -Geese
Black brant 0 - - 0 - 0 - 0 -Cackling Canada goose 98 81% 18 – 177 98 88% 0 - 0 -Lesser Canada goose 78 81% 15 – 142 78 88% 0 - 0 -White-fronted goose 0 - - 0 - 0 - 0 -Emperor goose 0 - - 0 - 0 - 0 -Lesser snow goose 0 - - 0 - 0 - 0 -
Total geese 176 81% 33 – 318 176 88% 0 - 0 -Swans
Tundra swan 0 - - 0 - 0 - 0 -Cranes
Sandhill crane 0 - - 0 - 0 - 0 -Grouse
Spruce grouse 0 - - 0 - 0 - 0 -Ptarmigan 0 - - 0 - 0 - 0 -
Total grouse 0 - - 0 - 0 - 0 -Seabirds
Cormorant 0 - - 0 - 0 - 0 -Arctic tern 2,990 30% 2,091 – 3,889 2,990 30% 0 - 0 -Kittiwake 215 65% 75 – 356 215 69% 0 - 0 -Sabine's gull 0 - - 0 - 0 - 0 -Mew gull 8,568 33% 5,736 – 11,401 8,568 32% 0 - 0 -Glaucous gull 21,147 22% 16,590 – 25,703 21,147 21% 0 - 0 -Herring gull 929 120% 150 – 2,040 929 120% 0 - 0 -Auklet 0 - - 0 - 0 - 0 -Murre 0 - - 0 - 0 - 0 -Guillemot 0 - - 0 - 0 - 0 -Puffin 0 - - 0 - 0 - 0 -
Total seabirds 33,849 18% 27,660 – 40,038 33,849 17% 0 - 0 -Shorebirds
Whimbrel 195 81% 36 – 354 195 88% 0 - 0 -Bristle-thighed curlew 224 58% 95 – 354 224 62% 0 - 0 -Godwit 2,023 57% 875 – 3,171 2,023 62% 0 - 0 -Golden plover 0 - - 0 - 0 - 0 -Small shorebird 117 81% 22 – 212 117 88% 0 - 0 -
Total shorebirds 2,560 46% 1,387 – 3,732 2,560 50% 0 - 0 -Grebes and loons
Common loon 0 - - 0 - 0 - 0 -Pacific loon 0 - - 0 - 0 - 0 -Red-throated loon 0 - - 0 - 0 - 0 -Yellow-billed loon 0 - - 0 - 0 - 0 -
Total grebes and loons 0 - - 0 - 0 - 0 -
Total eggs 37,630 18% 30,831 – 44,428 37,630 16% 0 - 0 -Sampling effort (Southwest Bristol Bay, 2008): 7 out of 21 villages in this subregion were surveyed; 23% of subregion households were represented in the sample. -: No reported harvest.
Number

40
Table 19.–Estimated harvest of birds, Bristol Bay Region, Dillingham Subregion, 2008. Annual estimated bird harvest Estimated bird harvest by seasonSpecies Confidence Interval Spring Summer Fall
95% CI Low – High Number 95% CI Number 95% CI Number 95% CIDucks
Wigeon 42 50% 21 – 62 11 144% 0 - 31 107%Green-winged teal 103 37% 64 – 141 41 99% 0 - 61 86%Mallard 237 23% 184 – 291 185 47% 0 - 52 57%Pintail 207 29% 147 – 268 144 66% 0 - 63 71%Shoveler 48 60% 22 – 77 39 122% 0 - 9 144%Black scoter 0 - - 0 - 0 - 0 -Surf scoter 0 - - 0 - 0 - 0 -White-winged scoter 0 - - 0 - 0 - 0 -Bufflehead 0 - - 0 - 0 - 0 -Goldeneye 4 83% 2 – 8 0 - 0 - 4 144%Canvasback 0 - - 0 - 0 - 0 -Scaup 2 83% 1 – 4 2 144% 0 - 0 -Common eider 22 83% 10 – 40 22 144% 0 - 0 -King eider 0 - - 0 - 0 - 0 -Spectacled eider 0 - - 0 - 0 - 0 -Steller's eider 0 - - 0 - 0 - 0 -Harlequin duck 0 - - 0 - 0 - 0 -Long-tailed duck 0 - - 0 - 0 - 0 -Common merganser 0 - - 0 - 0 - 0 -Red-breasted merganser 0 - - 0 - 0 - 0 -
Total ducks 665 22% 522 – 809 445 48% 0 - 221 56%Geese
Black brant 0 - - 0 - 0 - 0 -Cackling Canada goose 153 38% 95 – 211 92 99% 4 144% 57 77%Lesser Canada goose 213 29% 151 – 275 145 64% 0 - 68 78%White-fronted goose 114 33% 77 – 152 110 58% 0 - 4 144%Emperor goose 0 - - 0 - 0 - 0 -Lesser snow goose 0 - - 0 - 0 - 0 -
Total geese 480 22% 373 – 587 347 49% 4 144% 129 52%Swans
Tundra swan 4 59% 2 – 7 4 102% 0 - 0 -Cranes
Sandhill crane 19 44% 11 – 27 7 107% 10 119% 2 144%Grouse
Spruce grouse 1,550 25% 1,162 – 1,938 0 - 0 - 1,550 43%Ptarmigan 809 24% 617 – 1,000 798 40% 0 - 11 144%
Total grouse 2,358 18% 1,929 – 2,788 798 40% 0 - 1,561 43%Seabirds
Cormorant 0 - - 0 - 0 - 0 -Arctic tern 0 - - 0 - 0 - 0 -Kittiwake 0 - - 0 - 0 - 0 -Sabine's gull 0 - - 0 - 0 - 0 -Mew gull 0 - - 0 - 0 - 0 -Glaucous gull 0 - - 0 - 0 - 0 -Auklet 0 - - 0 - 0 - 0 -Murre 0 - - 0 - 0 - 0 -Guillemot 0 - - 0 - 0 - 0 -Puffin 0 - - 0 - 0 - 0 -
Total seabirds 0 - - 0 - 0 - 0 -Shorebirds
Whimbrel 0 - - 0 - 0 - 0 -Bristle-thighed curlew 0 - - 0 - 0 - 0 -Godwit 0 - - 0 - 0 - 0 -Golden plover 0 - - 0 - 0 - 0 -Small shorebird 0 - - 0 - 0 - 0 -
Total shorebirds 0 - - 0 - 0 - 0 -Grebes and loons
Common loon 0 - - 0 - 0 - 0 -Pacific loon 0 - - 0 - 0 - 0 -Red-throated loon 0 - - 0 - 0 - 0 -Yellow-billed loon 0 - - 0 - 0 - 0 -
Total grebes and loons 0 - - 0 - 0 - 0 -
Total birds 3,527 15% 3,011 – 4,043 1,600 33% 15 112% 1,913 37%Sampling effort (Dillingham, 2008): 1 out of 1 village in this subregion was surveyed. -: No reported harvest.
Number

41
Table 20.–Estimated harvest of eggs, Bristol Bay Region, Dillingham Subregion, 2008. Annual estimated egg harvest Estimated egg harvest by seasonSpecies Confidence Interval Spring Summer Fall
95% CI Low – High Number 95% CI Number 95% CI Number 95% CIDucks
Wigeon 0 - - 0 - 0 - 0 -Green-winged teal 0 - - 0 - 0 - 0 -Mallard 0 - - 0 - 0 - 0 -Pintail 0 - - 0 - 0 - 0 -Shoveler 0 - - 0 - 0 - 0 -Black scoter 0 - - 0 - 0 - 0 -Surf scoter 0 - - 0 - 0 - 0 -White-winged scoter 0 - - 0 - 0 - 0 -Bufflehead 0 - - 0 - 0 - 0 -Goldeneye 0 - - 0 - 0 - 0 -Canvasback 0 - - 0 - 0 - 0 -Scaup 0 - - 0 - 0 - 0 -Common eider 0 - - 0 - 0 - 0 -King eider 0 - - 0 - 0 - 0 -Spectacled eider 0 - - 0 - 0 - 0 -Steller's eider 0 - - 0 - 0 - 0 -Harlequin duck 0 - - 0 - 0 - 0 -Long-tailed duck 0 - - 0 - 0 - 0 -Common merganser 0 - - 0 - 0 - 0 -Red-breasted merganser 0 - - 0 - 0 - 0 -
Total ducks 0 - - 0 - 0 - 0 -Geese
Black brant 0 - - 0 - 0 - 0 -Cackling Canada goose 0 - - 0 - 0 - 0 -Lesser Canada goose 0 - - 0 - 0 - 0 -White-fronted goose 0 - - 0 - 0 - 0 -Emperor goose 0 - - 0 - 0 - 0 -Lesser snow goose 0 - - 0 - 0 - 0 -
Total geese 0 - - 0 - 0 - 0 -Swans
Tundra swan 0 - - 0 - 0 - 0 -Cranes
Sandhill crane 0 - - 0 - 0 - 0 -Grouse
Spruce grouse 0 - - 0 - 0 - 0 -Ptarmigan 0 - - 0 - 0 - 0 -Total grouse 0 - - 0 - 0 - 0 -
SeabirdsCormorant 0 - - 0 - 0 - 0 -Arctic tern 0 - - 0 - 0 - 0 -Kittiwake 0 - - 0 - 0 - 0 -Sabine's gull 0 - - 0 - 0 - 0 -Mew gull 9,917 74% 4,536 – 17,225 9,917 128% 0 - 0 -Glaucous gull 0 - - 0 - 0 - 0 -Auklet 0 - - 0 - 0 - 0 -Murre 0 - - 0 - 0 - 0 -Guillemot 0 - - 0 - 0 - 0 -Puffin 0 - - 0 - 0 - 0 -
Total seabirds 9,917 74% 4,536 – 17,225 9,917 128% 0 - 0 -Shorebirds
Whimbrel 0 - - 0 - 0 - 0 -Bristle-thighed curlew 0 - - 0 - 0 - 0 -Godwit 0 - - 0 - 0 - 0 -Golden plover 0 - - 0 - 0 - 0 -Small shorebird 0 - - 0 - 0 - 0 -
Total shorebirds 0 - - 0 - 0 - 0 -Grebes and loons
Common loon 0 - - 0 - 0 - 0 -Pacific loon 0 - - 0 - 0 - 0 -Red-throated loon 0 - - 0 - 0 - 0 -Yellow-billed loon 0 - - 0 - 0 - 0 -
Total grebes and loons 0 - - 0 - 0 - 0 -
Total eggs 9,917 74% 4,536 – 17,225 9,917 128% 0 - 0 -Sampling effort (Dillingham, 2008): 1 out of 1 village in this subregion was surveyed. -: No reported harvest.
Number

42
Table 21.–Estimated harvest of birds, Yukon–Kuskokwim Delta Region, 2008. Annual estimated bird harvest Estimated bird harvest by seasonSpecies Confidence Interval Spring Summer Fall
95% CI Low – High Number 95% CI Number 95% CI Number 95% CIDucks
Wigeon 2,776 23% 2,127 – 3,424 998 30% 336 70% 1,442 26%Green-winged teal 912 32% 623 – 1,202 484 47% 15 130% 414 45%Mallard 6,476 16% 5,437 – 7,515 2,671 31% 1,449 20% 2,356 20%Pintail 4,262 29% 3,027 – 5,497 2,047 33% 1,122 64% 1,093 44%Shoveler 1,120 29% 796 – 1,444 443 33% 32 66% 646 45%Black scoter 4,523 23% 3,465 – 5,582 3,711 24% 82 121% 730 63%Surf scoter 714 50% 358 – 1,070 645 66% 0 - 68 60%White-winged scoter 2,720 33% 1,823 – 3,617 2,701 35% 0 - 19 94%Bufflehead 201 82% 36 – 366 80 91% 11 147% 110 134%Goldeneye 344 74% 89 – 599 106 69% 90 112% 148 101%Canvasback 230 51% 113 – 347 88 121% 87 91% 56 90%Scaup 3,640 32% 2,476 – 4,803 2,008 37% 613 86% 1,019 48%Common eider 11 121% 2 – 25 11 121% 0 - 0 -King eider 427 57% 183 – 671 380 64% 0 - 47 80%Spectacled eider 11 121% 2 – 25 11 121% 0 - 0 -Steller's eider 0 - - 0 - 0 - 0 -Harlequin duck 75 62% 28 – 122 50 94% 0 - 25 108%Long-tailed duck 378 38% 234 – 521 335 51% 39 81% 4 109%Common merganser 104 67% 35 – 174 50 121% 0 - 54 76%Red-breasted merganser 120 76% 29 – 210 20 69% 0 - 100 90%
Total ducks 29,044 12% 25,465 – 32,622 16,838 17% 3,876 30% 8,329 19%Geese
Black brant 3,980 20% 3,196 – 4,765 3,525 20% 61 63% 394 92%Cackling Canada goose 9,196 15% 7,817 – 10,575 7,242 18% 1,235 23% 719 28%Lesser Canada goose 8,520 15% 7,282 – 9,759 5,404 19% 1,078 31% 2,038 21%White-fronted goose 15,118 13% 13,192 – 17,044 11,631 15% 1,275 31% 2,212 21%Emperor goose 1,490 17% 1,232 – 1,748 1,375 19% 114 43% 0 -Lesser snow goose 282 39% 173 – 390 252 42% 0 - 30 93%
Total geese 38,586 9% 35,095 – 42,077 29,429 11% 3,764 18% 5,393 16%Swans
Tundra swan 3,851 12% 3,401 – 4,301 2,754 13% 227 63% 870 25%Cranes
Sandhill crane 2,199 20% 1,755 – 2,644 2,031 21% 27 57% 142 45%Grouse
Spruce grouse 0 - - 0 - 0 - 0 -Ptarmigan 4,667 36% 3,006 – 6,327 4,355 38% 120 143% 192 92%
Total grouse 4,667 36% 3,006 – 6,327 4,355 38% 120 143% 192 92%Seabirds
Cormorant 0 - - 0 - 0 - 0 -Arctic tern 112 121% 20 – 248 112 121% 0 - 0 -Kittiwake 0 - - 0 - 0 - 0 -Sabine's gull 0 - - 0 - 0 - 0 -Mew gull 38 - - 38 - 0 - 0 -Glaucous gull 0 - - 0 - 0 - 0 -Auklet 0 - - 0 - 0 - 0 -Murre 0 - - 0 - 0 - 0 -Guillemot 0 - - 0 - 0 - 0 -Puffin 0 - - 0 - 0 - 0 -
Total seabirds 150 96% 32 – 294 150 96% 0 - 0 -Shorebirds
Whimbrel 126 61% 49 – 203 0 - 87 75% 39 116%Bristle-thighed curlew 115 62% 44 – 185 0 - 8 93% 107 67%Godwit 0 - - 0 - 0 - 0 -Golden plover 0 - - 0 - 0 - 0 -Small shorebird 0 - - 0 - 0 - 0 -
Total shorebirds 240 46% 129 – 352 0 - 94 69% 146 58%Grebes and loons
Common loon 45 68% 14 – 75 14 97% 21 85% 10 120%Pacific loon 288 18% 236 – 340 288 18% 0 - 0 -Red-throated loon 18 69% 5 – 30 18 69% 0 - 0 -Yellow-billed loon 0 - - 0 - 0 - 0 -
Total grebes and loons 350 17% 289 – 411 319 17% 21 85% 10 120%
Total birds 79,088 9% 71,986 – 86,190 55,878 11% 8,128 20% 15,081 15%Sampling effort (Yukon-Kuskokwim Delta , 2008): 23 out of 47 villages in this region were surveyed; 6 out of 7 subregions were surveyed; 98% of the region households were represented in the sample. -: No reported harvest.
Number

43
Table 22.–Estimated harvest of eggs, Yukon–Kuskokwim Delta Region, 2008.Annual estimated egg harvest Estimated egg harvest by season
Species Confidence Interval Spring Summer Fall95% CI Low – High Number 95% CI Number 95% CI Number 95% CI
DucksWigeon 17 112% 6 – 37 17 124% 0 - 0 -Green-winged teal 660 40% 394 – 927 637 83% 23 93% 0 -Mallard 1,822 39% 1,107 – 2,537 302 68% 1,519 46% 0 -Pintail 2,686 28% 1,934 – 3,437 1,896 47% 789 24% 0 -Shoveler 462 128% 40 – 1,054 462 129% 0 - 0 -Black scoter 14 128% 4 – 33 14 128% 0 - 0 -Surf scoter 0 - - 0 - 0 - 0 -White-winged scoter 37 112% 13 – 79 37 124% 0 - 0 -Bufflehead 398 118% 7 – 867 0 - 398 118% 0 -Goldeneye 0 - - 0 - 0 - 0 -Canvasback 0 - - 0 - 0 - 0 -Scaup 186 107% 67 – 385 186 404% 0 - 0 -Common eider 53 99% 10 – 105 53 98% 0 - 0 -King eider 0 - - 0 - 0 - 0 -Spectacled eider 112 115% 23 – 240 112 115% 0 - 0 -Steller's eider 0 - - 0 - 0 - 0 -Harlequin duck 0 - - 0 - 0 - 0 -Long-tailed duck 0 - - 0 - 0 - 0 -Common merganser 0 - - 0 - 0 - 0 -Red-breasted merganser 0 - - 0 - 0 - 0 -
Total ducks 6,448 22% 5,025 – 7,870 3,718 56% 2,729 32% 0 -Geese
Black brant 2,383 27% 1,743 – 3,022 2,383 27% 0 - 0 -Cackling Canada goose 4,114 19% 3,338 – 4,891 3,076 22% 1,039 41% 0 -Lesser Canada goose 2,572 32% 1,739 – 3,405 2,216 36% 356 71% 0 -White-fronted goose 4,430 21% 3,494 – 5,366 4,430 22% 0 - 0 -Emperor goose 1,505 30% 1,057 – 1,953 1,505 30% 0 - 0 -Lesser snow goose 0 - - 0 - 0 - 0 -
Total geese 15,004 16% 12,576 – 17,432 13,610 18% 1,395 37% 0 -Swans
Tundra swan 1,421 36% 914 – 1,929 1,037 30% 384 104% 0 -Cranes
Sandhill crane 1,228 23% 949 – 1,506 888 32% 340 34% 0 -Grouse
Spruce grouse 0 - - 0 - 0 - 0 -Ptarmigan 455 56% 199 – 712 455 66% 0 - 0 -
Total grouse 455 56% 199 – 712 455 66% 0 - 0 -Seabirds
Cormorant 0 - - 0 - 0 - 0 -Arctic tern 890 81% 170 – 1,610 890 92% 0 - 0 -Kittiwake 0 - - 0 - 0 - 0 -Sabine's gull 57 68% 18 – 95 57 71% 0 - 0 -Mew gull 1,412 42% 824 – 2,001 1,297 47% 115 93% 0 -Glaucous gull 986 69% 309 – 1,663 969 71% 17 143% 0 -Auklet 0 - - 0 - 0 - 0 -Murre 0 - - 0 - 0 - 0 -Guillemot 0 - - 0 - 0 - 0 -Puffin 0 - - 0 - 0 - 0 -
Total seabirds 3,345 39% 2,035 – 4,655 3,213 45% 132 83% 0 -Shorebirds
Whimbrel 0 - - 0 - 0 - 0 -Bristle-thighed curlew 0 - - 0 - 0 - 0 -Godwit 177 70% 53 – 301 177 70% 0 - 0 -Golden plover 390 80% 79 – 701 390 80% 0 - 0 -Small shorebird 2,554 57% 1,106 – 4,002 1,418 42% 1,136 118% 0 -
Total shorebirds 3,121 48% 1,627 – 4,615 1,985 35% 1,136 118% 0 -Grebes and loons -
Common loon 87 76% 21 – 153 87 77% 0 - 0 -Pacific loon 12 88% 3 – 22 12 88% 0 - 0 -Red-throated loon 13 117% 2 – 27 13 117% 0 - 0 -Yellow-billed loon 61 89% 8 – 116 0 - 61 93% 0 -
Total grebes and loons 173 50% 86 – 260 112 62% 61 93% 0 -
Total eggs 31,195 15% 26,621 – 35,769 25,017 20% 6,178 38% 0 -Sampling effort (Yukon-Kuskokwim Delta , 2008): 23 out of 47 villages in this region were surveyed; 6 out of 7 subregions were surveyed; 98% of the region households were represented in the sample. -: No reported harvest.
Number

44
Table 23.–Estimated harvest of birds, Yukon–Kuskokwim Delta Region, South Coast Subregion, 2008. Annual estimated bird harvest Estimated bird harvest by seasonSpecies Number Confidence Interval Spring Summer Fall
95% CI Low – High Number 95% CI Number 95% CI Number 95% CIDucks
Wigeon 560 21% 444 – 675 0 - 77 61% 483 28%Green-winged teal 273 33% 184 – 363 19 74% 0 - 254 56%Mallard 1,263 22% 991 – 1,534 287 52% 0 - 976 38%Pintail 1,409 29% 996 – 1,821 847 63% 0 - 562 83%Shoveler 396 43% 226 – 566 46 - 3 105% 347 79%Black scoter 1,071 29% 764 – 1,378 452 53% 67 145% 551 83%Surf scoter 30 72% 8 – 51 0 - 0 - 30 117%White-winged scoter 34 43% 19 – 48 34 64% 0 - 0 -Bufflehead 107 80% 21 – 193 0 - 0 - 107 136%Goldeneye 197 51% 96 – 298 15 103% 67 145% 114 128%Canvasback 33 86% 5 – 62 0 - 0 - 33 145%Scaup 998 39% 604 – 1,392 32 97% 335 145% 632 70%Common eider 0 - - 0 - 0 - 0 -King eider 108 56% 47 – 168 62 127% 0 - 46 81%Spectacled eider 0 - - 0 - 0 - 0 -Steller's eider 0 - - 0 - 0 - 0 -Harlequin duck 17 86% 2 – 31 0 - 0 - 17 145%Long-tailed duck 17 69% 5 – 29 13 134% 0 - 4 110%Common merganser 32 58% 14 – 50 0 - 0 - 32 81%Red-breasted merganser 98 55% 44 – 152 0 - 0 - 98 91%
Total ducks 6,641 17% 5,514 – 7,769 1,807 36% 548 124% 4,286 32%Geese
Black brant 902 33% 601 – 1,203 517 66% 0 - 385 93%Cackling Canada goose 1,113 21% 878 – 1,348 849 38% 0 - 264 36%Lesser Canada goose 3,210 14% 2,756 – 3,664 1,389 23% 514 59% 1,307 25%White-fronted goose 4,871 13% 4,252 – 5,490 3,061 24% 386 70% 1,424 28%Emperor goose 26 62% 10 – 43 26 101% 0 - 0 -Lesser snow goose 8 56% 3 – 12 4 129% 0 - 4 117%
Total geese 10,130 10% 9,074 – 11,186 5,845 19% 900 49% 3,385 20%Swans
Tundra swan 919 20% 740 – 1,099 421 46% 17 145% 482 40%Cranes
Sandhill crane 558 18% 456 – 660 437 31% 3 105% 117 52%Grouse
Spruce grouse 0 - - 0 - 0 - 0 -Ptarmigan 1,463 47% 777 – 2,148 1,158 96% 117 145% 187 93%
Total grouse 1,463 47% 777 – 2,148 1,158 96% 117 145% 187 93%Seabirds
Cormorant 0 - - 0 - 0 - 0 -Arctic tern 0 - - 0 - 0 - 0 -Kittiwake 0 - - 0 - 0 - 0 -Sabine's gull 0 - - 0 - 0 - 0 -Mew gull 37 88% 12 - 70 37 127% 0 - 0 -Glaucous gull 0 - - 0 - 0 - 0 -Auklet 0 - - 0 - 0 - 0 -Murre 0 - - 0 - 0 - 0 -Guillemot 0 - - 0 - 0 - 0 -Puffin 0 - - 0 - 0 - 0 -
Total seabirds 37 88% 12 - 70 37 127% 0 - 0 -Shorebirds
Whimbrel 123 46% 66 – 180 0 - 85 76% 38 117%Bristle-thighed curlew 105 44% 58 – 151 0 - 0 - 105 68%Godwit 0 - - 0 - 0 - 0 -Golden plover 0 - - 0 - 0 - 0 -Small shorebird 0 - - 0 - 0 - 0 -
Total shorebirds 228 32% 154 – 301 0 - 85 76% 143 59%Grebes and loons
Common loon 23 49% 12 – 35 13 98% 0 - 10 122%Pacific loon 0 - - 0 - 0 - 0 -Red-throated loon 0 - - 0 - 0 - 0 -Yellow-billed loon 0 - - 0 - 0 - 0 -
Total grebes and loons 23 49% 12 – 35 13 98% 0 - 10 122%
Total birds 19,999 12% 17,663 – 22,334 9,719 25% 1,669 71% 8,611 23%Sampling effort (Yukon-Kuskokwim Delta South Coast, 2008): 5 out of 8 villages in this subregion were surveyed; 65% of subregion households were represented in the sample. -: No reported harvest.
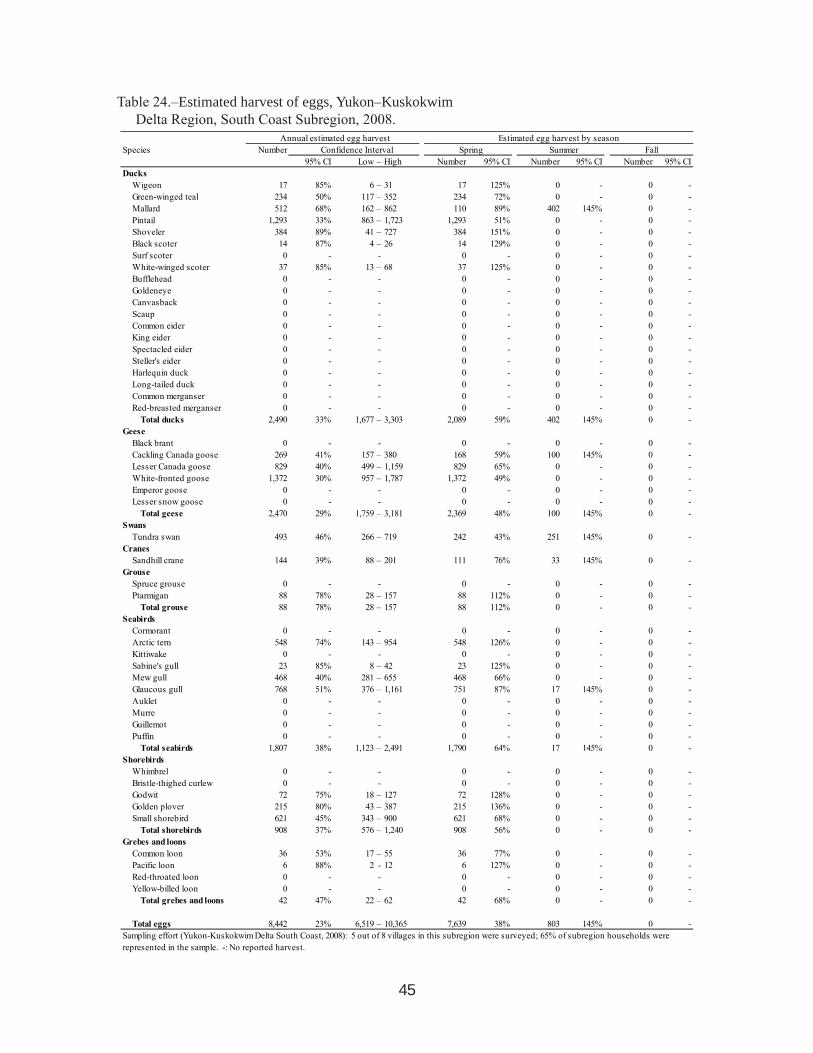
45
Table 24.–Estimated harvest of eggs, Yukon–Kuskokwim Delta Region, South Coast Subregion, 2008.
Annual estimated egg harvest Estimated egg harvest by seasonSpecies Number Confidence Interval Spring Summer Fall
95% CI Low – High Number 95% CI Number 95% CI Number 95% CIDucks
Wigeon 17 85% 6 – 31 17 125% 0 - 0 -Green-winged teal 234 50% 117 – 352 234 72% 0 - 0 -Mallard 512 68% 162 – 862 110 89% 402 145% 0 -Pintail 1,293 33% 863 – 1,723 1,293 51% 0 - 0 -Shoveler 384 89% 41 – 727 384 151% 0 - 0 -Black scoter 14 87% 4 – 26 14 129% 0 - 0 -Surf scoter 0 - - 0 - 0 - 0 -White-winged scoter 37 85% 13 – 68 37 125% 0 - 0 -Bufflehead 0 - - 0 - 0 - 0 -Goldeneye 0 - - 0 - 0 - 0 -Canvasback 0 - - 0 - 0 - 0 -Scaup 0 - - 0 - 0 - 0 -Common eider 0 - - 0 - 0 - 0 -King eider 0 - - 0 - 0 - 0 -Spectacled eider 0 - - 0 - 0 - 0 -Steller's eider 0 - - 0 - 0 - 0 -Harlequin duck 0 - - 0 - 0 - 0 -Long-tailed duck 0 - - 0 - 0 - 0 -Common merganser 0 - - 0 - 0 - 0 -Red-breasted merganser 0 - - 0 - 0 - 0 -
Total ducks 2,490 33% 1,677 – 3,303 2,089 59% 402 145% 0 -Geese
Black brant 0 - - 0 - 0 - 0 -Cackling Canada goose 269 41% 157 – 380 168 59% 100 145% 0 -Lesser Canada goose 829 40% 499 – 1,159 829 65% 0 - 0 -White-fronted goose 1,372 30% 957 – 1,787 1,372 49% 0 - 0 -Emperor goose 0 - - 0 - 0 - 0 -Lesser snow goose 0 - - 0 - 0 - 0 -
Total geese 2,470 29% 1,759 – 3,181 2,369 48% 100 145% 0 -Swans
Tundra swan 493 46% 266 – 719 242 43% 251 145% 0 -Cranes
Sandhill crane 144 39% 88 – 201 111 76% 33 145% 0 -Grouse
Spruce grouse 0 - - 0 - 0 - 0 -Ptarmigan 88 78% 28 – 157 88 112% 0 - 0 -
Total grouse 88 78% 28 – 157 88 112% 0 - 0 -Seabirds
Cormorant 0 - - 0 - 0 - 0 -Arctic tern 548 74% 143 – 954 548 126% 0 - 0 -Kittiwake 0 - - 0 - 0 - 0 -Sabine's gull 23 85% 8 – 42 23 125% 0 - 0 -Mew gull 468 40% 281 – 655 468 66% 0 - 0 -Glaucous gull 768 51% 376 – 1,161 751 87% 17 145% 0 -Auklet 0 - - 0 - 0 - 0 -Murre 0 - - 0 - 0 - 0 -Guillemot 0 - - 0 - 0 - 0 -Puffin 0 - - 0 - 0 - 0 -
Total seabirds 1,807 38% 1,123 – 2,491 1,790 64% 17 145% 0 -Shorebirds
Whimbrel 0 - - 0 - 0 - 0 -Bristle-thighed curlew 0 - - 0 - 0 - 0 -Godwit 72 75% 18 – 127 72 128% 0 - 0 -Golden plover 215 80% 43 – 387 215 136% 0 - 0 -Small shorebird 621 45% 343 – 900 621 68% 0 - 0 -
Total shorebirds 908 37% 576 – 1,240 908 56% 0 - 0 -Grebes and loons
Common loon 36 53% 17 – 55 36 77% 0 - 0 -Pacific loon 6 88% 2 - 12 6 127% 0 - 0 -Red-throated loon 0 - - 0 - 0 - 0 -Yellow-billed loon 0 - - 0 - 0 - 0 -
Total grebes and loons 42 47% 22 – 62 42 68% 0 - 0 -
Total eggs 8,442 23% 6,519 – 10,365 7,639 38% 803 145% 0 -Sampling effort (Yukon-Kuskokwim Delta South Coast, 2008): 5 out of 8 villages in this subregion were surveyed; 65% of subregion households were represented in the sample. -: No reported harvest.

46
Table 25.–Estimated harvest of birds, Yukon–Kuskokwim Delta Region, Mid Coast Subregion, 2008.
Annual estimated bird harvest Estimated bird harvest by seasonSpecies Confidence Interval Spring Summer Fall
95% CI Low – High Number 95% CI Number 95% CI Number 95% CIDucks
Wigeon 204 77% 47 – 361 33 171% 171 119% 0 -Green-winged teal 93 72% 26 – 160 93 96% 0 - 0 -Mallard 487 33% 325 – 650 472 35% 15 66% 0 -Pintail 1,074 50% 537 – 1,611 288 55% 786 87% 0 -Shoveler 259 40% 156 – 362 251 42% 8 94% 0 -Black scoter 20 30% 14 – 25 20 70% 0 - 0 -Surf scoter 0 - - 0 - 0 - 0 -White-winged scoter 0 - - 0 - 0 - 0 -Bufflehead 0 - - 0 - 0 - 0 -Goldeneye 0 - - 0 - 0 - 0 -Canvasback 0 - - 0 - 0 - 0 -Scaup 0 - - 0 - 0 - 0 -Common eider 11 87% 2 – 21 11 122% 0 - 0 -King eider 176 57% 75 – 277 176 74% 0 - 0 -Spectacled eider 11 87% 2 – 21 11 122% 0 - 0 -Steller's eider 0 - - 0 - 0 - 0 -Harlequin duck 0 - - 0 - 0 - 0 -Long-tailed duck 39 52% 19 – 59 16 122% 23 94% 0 -Common merganser 49 87% 9 – 92 49 122% 0 - 0 -Red-breasted merganser 20 30% 14 – 25 20 70% 0 - 0 -
Total ducks 2,442 29% 1,735 – 3,148 1,440 28% 1,001 77% 0 -Geese
Black brant 2,882 19% 2,337 – 3,427 2,822 21% 60 64% 0 -Cackling Canada goose 2,674 15% 2,266 – 3,081 2,333 20% 341 48% 0 -Lesser Canada goose 1,353 28% 974 – 1,733 1,271 32% 83 51% 0 -White-fronted goose 3,209 19% 2,612 – 3,806 2,900 21% 309 68% 0 -Emperor goose 1,396 18% 1,150 – 1,642 1,313 19% 83 51% 0 -Lesser snow goose 5 126% 1 – 11 5 171% 0 - 0 -
Total geese 11,518 15% 9,766 – 13,271 10,643 16% 875 38% 0 -Swans
Tundra swan 783 27% 572 – 994 658 28% 125 106% 0 -Cranes
Sandhill crane 1,170 27% 852 – 1,487 1,162 32% 8 94% 0 -Grouse
Spruce grouse 0 - - 0 - 0 - 0 -Ptarmigan 1,099 36% 700 – 1,498 1,099 49% 0 - 0 -
Total grouse 1,099 36% 700 – 1,498 1,099 49% 0 - 0 -Seabirds
Cormorant 0 - - 0 - 0 - 0 -Arctic tern 110 87% 20 – 205 110 122% 0 - 0 -Kittiwake 0 - - 0 - 0 - 0 -Sabine's gull 0 - - 0 - 0 - 0 -Mew gull 0 - - 0 - 0 - 0 -Glaucous gull 0 - - 0 - 0 - 0 -Auklet 0 - - 0 - 0 - 0 -Murre 0 - - 0 - 0 - 0 -Guillemot 0 - - 0 - 0 - 0 -Puffin 0 - - 0 - 0 - 0 -
Total seabirds 110 87% 20 – 205 110 122% 0 - 0 -Shorebirds
Whimbrel 0 - - 0 - 0 - 0 -Bristle-thighed curlew 8 63% 3 – 12 0 - 8 94% 0 -Godwit 0 - - 0 - 0 - 0 -Golden plover 0 - - 0 - 0 - 0 -Small shorebird 0 - - 0 - 0 - 0 -
Total shorebirds 8 63% 3 – 12 0 - 8 94% 0 -Grebes and loons
Common loon 21 63% 8 – 33 0 - 21 86% 0 -Pacific loon 0 - - 0 - 0 - 0 -Red-throated loon 11 61% 4 – 18 11 86% 0 - 0 -Yellow-billed loon 0 - - 0 - 0 - 0 -
Total grebes and loons 32 46% 17 – 46 11 86% 21 86% 0 -
Total birds 17,160 15% 14,512 – 19,809 15,123 16% 2,038 44% 0 -Sampling effort (Yukon-Kuskokwim Delta Mid-Coast, 2008): 5 out of 9 villages in this subregion were surveyed; 51% of subregion households were represented in the sample. -: No reported harvest.
Number
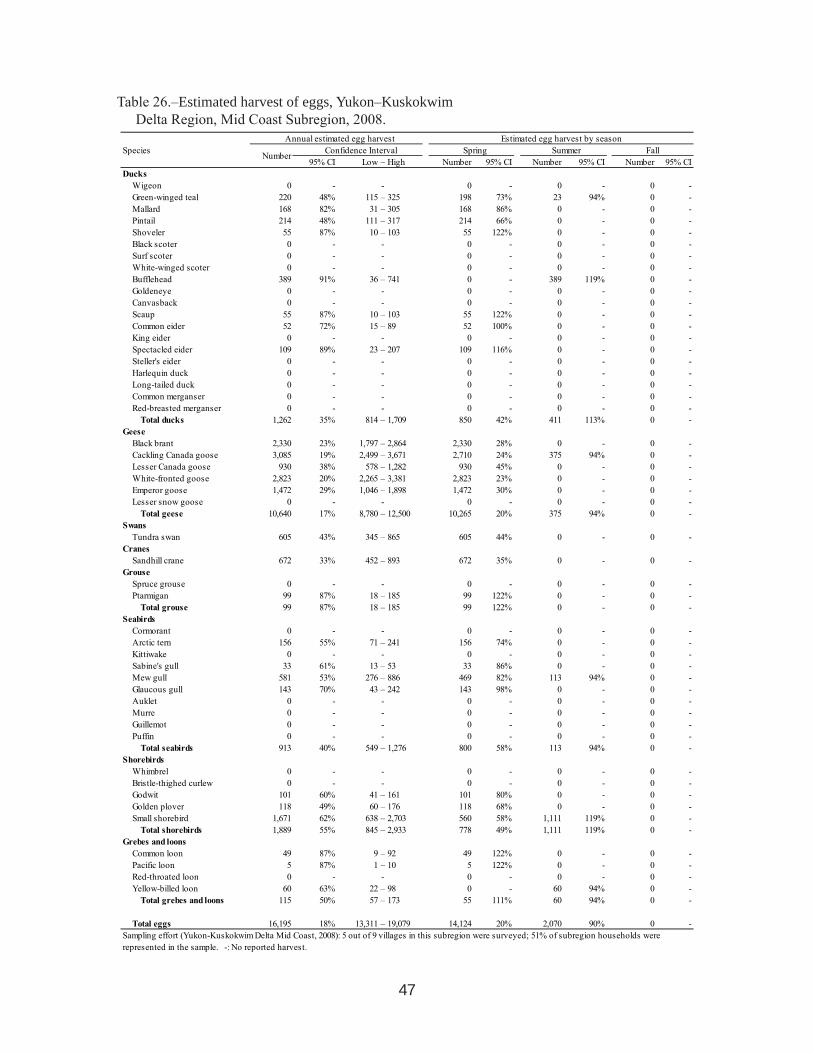
47
Table 26.–Estimated harvest of eggs, Yukon–Kuskokwim Delta Region, Mid Coast Subregion, 2008.
Annual estimated egg harvest Estimated egg harvest by seasonSpecies Confidence Interval Spring Summer Fall
95% CI Low – High Number 95% CI Number 95% CI Number 95% CIDucks
Wigeon 0 - - 0 - 0 - 0 -Green-winged teal 220 48% 115 – 325 198 73% 23 94% 0 -Mallard 168 82% 31 – 305 168 86% 0 - 0 -Pintail 214 48% 111 – 317 214 66% 0 - 0 -Shoveler 55 87% 10 – 103 55 122% 0 - 0 -Black scoter 0 - - 0 - 0 - 0 -Surf scoter 0 - - 0 - 0 - 0 -White-winged scoter 0 - - 0 - 0 - 0 -Bufflehead 389 91% 36 – 741 0 - 389 119% 0 -Goldeneye 0 - - 0 - 0 - 0 -Canvasback 0 - - 0 - 0 - 0 -Scaup 55 87% 10 – 103 55 122% 0 - 0 -Common eider 52 72% 15 – 89 52 100% 0 - 0 -King eider 0 - - 0 - 0 - 0 -Spectacled eider 109 89% 23 – 207 109 116% 0 - 0 -Steller's eider 0 - - 0 - 0 - 0 -Harlequin duck 0 - - 0 - 0 - 0 -Long-tailed duck 0 - - 0 - 0 - 0 -Common merganser 0 - - 0 - 0 - 0 -Red-breasted merganser 0 - - 0 - 0 - 0 -
Total ducks 1,262 35% 814 – 1,709 850 42% 411 113% 0 -Geese
Black brant 2,330 23% 1,797 – 2,864 2,330 28% 0 - 0 -Cackling Canada goose 3,085 19% 2,499 – 3,671 2,710 24% 375 94% 0 -Lesser Canada goose 930 38% 578 – 1,282 930 45% 0 - 0 -White-fronted goose 2,823 20% 2,265 – 3,381 2,823 23% 0 - 0 -Emperor goose 1,472 29% 1,046 – 1,898 1,472 30% 0 - 0 -Lesser snow goose 0 - - 0 - 0 - 0 -
Total geese 10,640 17% 8,780 – 12,500 10,265 20% 375 94% 0 -Swans
Tundra swan 605 43% 345 – 865 605 44% 0 - 0 -Cranes
Sandhill crane 672 33% 452 – 893 672 35% 0 - 0 -Grouse
Spruce grouse 0 - - 0 - 0 - 0 -Ptarmigan 99 87% 18 – 185 99 122% 0 - 0 -
Total grouse 99 87% 18 – 185 99 122% 0 - 0 -Seabirds
Cormorant 0 - - 0 - 0 - 0 -Arctic tern 156 55% 71 – 241 156 74% 0 - 0 -Kittiwake 0 - - 0 - 0 - 0 -Sabine's gull 33 61% 13 – 53 33 86% 0 - 0 -Mew gull 581 53% 276 – 886 469 82% 113 94% 0 -Glaucous gull 143 70% 43 – 242 143 98% 0 - 0 -Auklet 0 - - 0 - 0 - 0 -Murre 0 - - 0 - 0 - 0 -Guillemot 0 - - 0 - 0 - 0 -Puffin 0 - - 0 - 0 - 0 -
Total seabirds 913 40% 549 – 1,276 800 58% 113 94% 0 -Shorebirds
Whimbrel 0 - - 0 - 0 - 0 -Bristle-thighed curlew 0 - - 0 - 0 - 0 -Godwit 101 60% 41 – 161 101 80% 0 - 0 -Golden plover 118 49% 60 – 176 118 68% 0 - 0 -Small shorebird 1,671 62% 638 – 2,703 560 58% 1,111 119% 0 -
Total shorebirds 1,889 55% 845 – 2,933 778 49% 1,111 119% 0 -Grebes and loons
Common loon 49 87% 9 – 92 49 122% 0 - 0 -Pacific loon 5 87% 1 – 10 5 122% 0 - 0 -Red-throated loon 0 - - 0 - 0 - 0 -Yellow-billed loon 60 63% 22 – 98 0 - 60 94% 0 -
Total grebes and loons 115 50% 57 – 173 55 111% 60 94% 0 -
Total eggs 16,195 18% 13,311 – 19,079 14,124 20% 2,070 90% 0 -Sampling effort (Yukon-Kuskokwim Delta Mid Coast, 2008): 5 out of 9 villages in this subregion were surveyed; 51% of subregion households were represented in the sample. -: No reported harvest.
Number

48
Table 27.–Estimated harvest of birds, Yukon–Kuskokwim Delta Region, North Coast Subregion, 2008.
Annual estimated bird harvest Estimated bird harvest by seasonSpecies Confidence Interval Spring Summer Fall
95% CI Low – High Number 95% CI Number 95% CI Number 95% CIDucks
Wigeon 846 28% 608 – 1,085 219 109% 0 - 627 51%Green-winged teal 183 64% 65 – 300 183 109% 0 - 0 -Mallard 638 27% 463 – 813 0 - 0 - 638 42%Pintail 246 79% 52 – 439 246 123% 0 - 0 -Shoveler 0 - - 0 - 0 - 0 -Black scoter 0 - - 0 - 0 - 0 -Surf scoter 0 - - 0 - 0 - 0 -White-winged scoter 0 - - 0 - 0 - 0 -Bufflehead 0 - - 0 - 0 - 0 -Goldeneye 0 - - 0 - 0 - 0 -Canvasback 0 - - 0 - 0 - 0 -Scaup 180 44% 101 – 260 4 150% 0 - 177 66%Common eider 0 - - 0 - 0 - 0 -King eider 0 - - 0 - 0 - 0 -Spectacled eider 0 - - 0 - 0 - 0 -Steller's eider 0 - - 0 - 0 - 0 -Harlequin duck 0 - - 0 - 0 - 0 -Long-tailed duck 0 - - 0 - 0 - 0 -Common merganser 0 - - 0 - 0 - 0 -Red-breasted merganser 0 - - 0 - 0 - 0 -
Total ducks 2,093 24% 1,593 – 2,594 651 81% 0 - 1,442 43%Geese
Black brant 0 - - 0 - 0 - 0 -Cackling Canada goose 46 112% 13 - 98 46 112% 0 - 0 -Lesser Canada goose 1,439 33% 969 – 1,910 1,161 54% 0 - 279 92%White-fronted goose 943 34% 620 – 1,266 841 61% 0 - 102 92%Emperor goose 0 - - 0 - 0 - 0 -Lesser snow goose 7 79% 2 – 13 7 119% 0 - 0 -
Total geese 2,436 27% 1,776 – 3,096 2,055 45% 0 - 381 92%Swans
Tundra swan 215 27% 157 – 272 29 74% 0 - 186 40%Cranes
Sandhill crane 123 79% 26 – 220 123 123% 0 - 0 -Grouse
Spruce grouse 0 - - 0 - 0 - 0 -Ptarmigan 0 - - 0 - 0 - 0 -
Total grouse 0 - - 0 - 0 - 0 -Seabirds
Cormorant 0 - - 0 - 0 - 0 -Arctic tern 0 - - 0 - 0 - 0 -Kittiwake 0 - - 0 - 0 - 0 -Sabine's gull 0 - - 0 - 0 - 0 -Mew gull 0 - - 0 - 0 - 0 -Glaucous gull 0 - - 0 - 0 - 0 -Auklet 0 - - 0 - 0 - 0 -Murre 0 - - 0 - 0 - 0 -Guillemot 0 - - 0 - 0 - 0 -Puffin 0 - - 0 - 0 - 0 -
Total seabirds 0 - - 0 - 0 - 0 -Shorebirds
Whimbrel 0 - - 0 - 0 - 0 -Bristle-thighed curlew 0 - - 0 - 0 - 0 -Godwit 0 - - 0 - 0 - 0 -Golden plover 0 - - 0 - 0 - 0 -Small shorebird 0 - - 0 - 0 - 0 -
Total shorebirds 0 - - 0 - 0 - 0 -Grebes and loons
Common loon 0 - - 0 - 0 - 0 -Pacific loon 0 - - 0 - 0 - 0 -Red-throated loon 0 - - 0 - 0 - 0 -Yellow-billed loon 0 - - 0 - 0 - 0 -
Total grebes and loons 0 - - 0 - 0 - 0 -
Total birds 4,867 22% 3,797 – 5,936 2,857 51% 0 - 2,009 40%Sampling effort (Yukon-Kuskokwim Delta North Coast, 2008): 2 out of 4 villages in this subregion were surveyed; 45% of subregion households were represented in the sample. -: No reported harvest.
Number
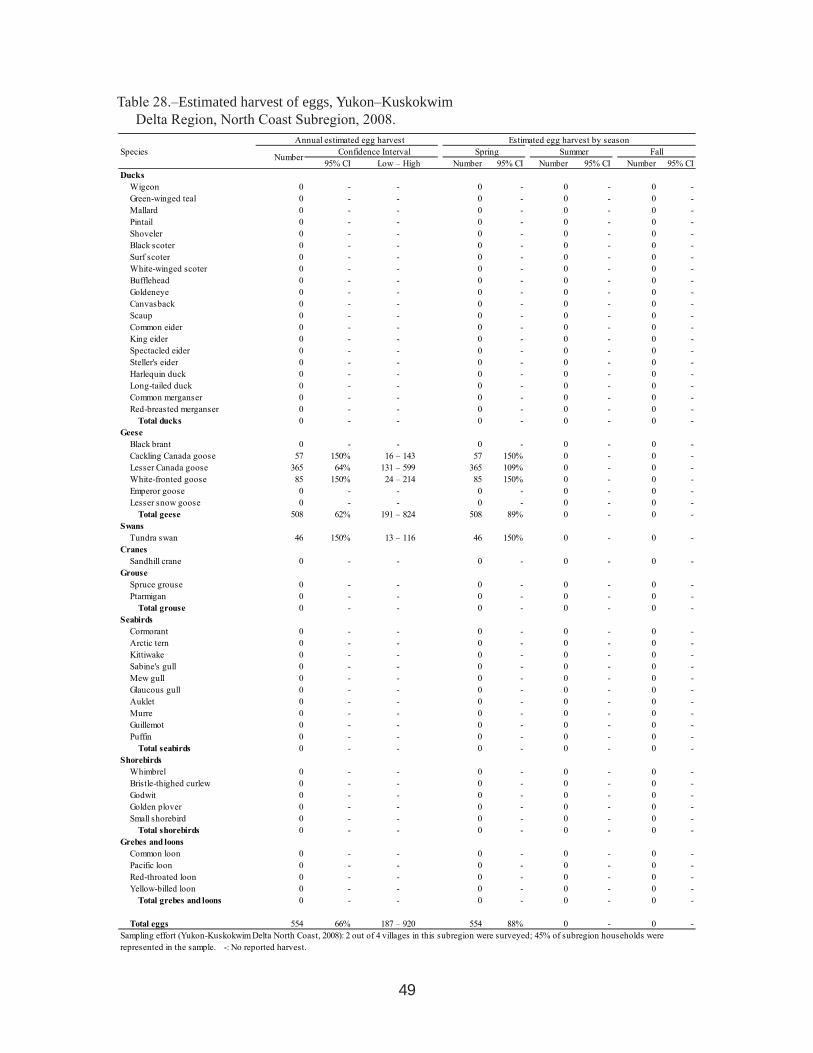
49
Table 28.–Estimated harvest of eggs, Yukon–Kuskokwim Delta Region, North Coast Subregion, 2008.
Annual estimated egg harvest Estimated egg harvest by seasonSpecies Confidence Interval Spring Summer Fall
95% CI Low – High Number 95% CI Number 95% CI Number 95% CIDucks
Wigeon 0 - - 0 - 0 - 0 -Green-winged teal 0 - - 0 - 0 - 0 -Mallard 0 - - 0 - 0 - 0 -Pintail 0 - - 0 - 0 - 0 -Shoveler 0 - - 0 - 0 - 0 -Black scoter 0 - - 0 - 0 - 0 -Surf scoter 0 - - 0 - 0 - 0 -White-winged scoter 0 - - 0 - 0 - 0 -Bufflehead 0 - - 0 - 0 - 0 -Goldeneye 0 - - 0 - 0 - 0 -Canvasback 0 - - 0 - 0 - 0 -Scaup 0 - - 0 - 0 - 0 -Common eider 0 - - 0 - 0 - 0 -King eider 0 - - 0 - 0 - 0 -Spectacled eider 0 - - 0 - 0 - 0 -Steller's eider 0 - - 0 - 0 - 0 -Harlequin duck 0 - - 0 - 0 - 0 -Long-tailed duck 0 - - 0 - 0 - 0 -Common merganser 0 - - 0 - 0 - 0 -Red-breasted merganser 0 - - 0 - 0 - 0 -
Total ducks 0 - - 0 - 0 - 0 -Geese
Black brant 0 - - 0 - 0 - 0 -Cackling Canada goose 57 150% 16 – 143 57 150% 0 - 0 -Lesser Canada goose 365 64% 131 – 599 365 109% 0 - 0 -White-fronted goose 85 150% 24 – 214 85 150% 0 - 0 -Emperor goose 0 - - 0 - 0 - 0 -Lesser snow goose 0 - - 0 - 0 - 0 -
Total geese 508 62% 191 – 824 508 89% 0 - 0 -Swans
Tundra swan 46 150% 13 – 116 46 150% 0 - 0 -Cranes
Sandhill crane 0 - - 0 - 0 - 0 -Grouse
Spruce grouse 0 - - 0 - 0 - 0 -Ptarmigan 0 - - 0 - 0 - 0 -
Total grouse 0 - - 0 - 0 - 0 -Seabirds
Cormorant 0 - - 0 - 0 - 0 -Arctic tern 0 - - 0 - 0 - 0 -Kittiwake 0 - - 0 - 0 - 0 -Sabine's gull 0 - - 0 - 0 - 0 -Mew gull 0 - - 0 - 0 - 0 -Glaucous gull 0 - - 0 - 0 - 0 -Auklet 0 - - 0 - 0 - 0 -Murre 0 - - 0 - 0 - 0 -Guillemot 0 - - 0 - 0 - 0 -Puffin 0 - - 0 - 0 - 0 -
Total seabirds 0 - - 0 - 0 - 0 -Shorebirds
Whimbrel 0 - - 0 - 0 - 0 -Bristle-thighed curlew 0 - - 0 - 0 - 0 -Godwit 0 - - 0 - 0 - 0 -Golden plover 0 - - 0 - 0 - 0 -Small shorebird 0 - - 0 - 0 - 0 -
Total shorebirds 0 - - 0 - 0 - 0 -Grebes and loons
Common loon 0 - - 0 - 0 - 0 -Pacific loon 0 - - 0 - 0 - 0 -Red-throated loon 0 - - 0 - 0 - 0 -Yellow-billed loon 0 - - 0 - 0 - 0 -
Total grebes and loons 0 - - 0 - 0 - 0 -
Total eggs 554 66% 187 – 920 554 88% 0 - 0 -Sampling effort (Yukon-Kuskokwim Delta North Coast, 2008): 2 out of 4 villages in this subregion were surveyed; 45% of subregion households were represented in the sample. -: No reported harvest.
Number

50
Table 29.–Estimated harvest of birds, Yukon–Kuskokwim Delta Region, Lower Yukon Subregion, 2008.
Annual estimated bird harvest Estimated bird harvest by seasonSpecies Confidence Interval Spring Summer Fall
95% CI Low – High Number 95% CI Number 95% CI Number 95% CIDucks
Wigeon 200 24% 152 – 248 81 66% 0 - 119 45%Green-winged teal 0 - - 0 - 0 - 0 -Mallard 670 18% 548 – 793 247 45% 42 105% 381 25%Pintail 306 23% 237 – 375 182 47% 5 124% 119 39%Shoveler 110 31% 76 – 145 27 79% 10 133% 74 64%Black scoter 565 67% 187 – 943 554 111% 0 - 11 138%Surf scoter 28 61% 11 – 44 16 133% 0 - 11 138%White-winged scoter 19 58% 8 – 29 0 - 0 - 19 95%Bufflehead 0 - - 0 - 0 - 0 -Goldeneye 48 45% 26 – 70 33 83% 0 - 15 138%Canvasback 0 - - 0 - 0 - 0 -Scaup 0 - - 0 - 0 - 0 -Common eider 0 - - 0 - 0 - 0 -King eider 0 - - 0 - 0 - 0 -Spectacled eider 0 - - 0 - 0 - 0 -Steller's eider 0 - - 0 - 0 - 0 -Harlequin duck 52 50% 26 – 78 45 86% 0 - 7 138%Long-tailed duck 43 72% 12 – 74 43 109% 0 - 0 -Common merganser 20 68% 7 – 34 0 - 0 - 20 150%Red-breasted merganser 0 - - 0 - 0 - 0 -
Total ducks 2,062 23% 1,587 – 2,537 1,228 56% 57 82% 777 24%Geese
Black brant 0 - - 0 - 0 - 0 -Cackling Canada goose 492 18% 404 – 581 288 34% 43 150% 161 38%Lesser Canada goose 454 20% 364 – 544 129 63% 78 51% 248 27%White-fronted goose 1,170 15% 999 – 1,341 757 27% 133 62% 280 27%Emperor goose 29 57% 13 – 46 0 - 29 86% 0 -Lesser snow goose 219 36% 141 – 296 208 49% 0 - 11 136%
Total geese 2,365 14% 2,032 – 2,697 1,382 27% 283 50% 700 23%Swans
Tundra swan 272 20% 216 – 327 218 37% 22 90% 32 61%Cranes
Sandhill crane 29 36% 18 – 39 10 84% 0 - 18 80%Grouse
Spruce grouse 0 - - 0 - 0 - 0 -Ptarmigan 0 - - 0 - 0 - 0 -
Total grouse 0 - - 0 - 0 - 0 -Seabirds
Cormorant 0 - - 0 - 0 - 0 -Arctic tern 0 - - 0 - 0 - 0 -Kittiwake 0 - - 0 - 0 - 0 -Sabine's gull 0 - - 0 - 0 - 0 -Mew gull 0 - - 0 - 0 - 0 -Glaucous gull 0 - - 0 - 0 - 0 -Auklet 0 - - 0 - 0 - 0 -Murre 0 - - 0 - 0 - 0 -Guillemot 0 - - 0 - 0 - 0 -Puffin 0 - - 0 - 0 - 0 -
Total seabirds 0 - - 0 - 0 - 0 -Shorebirds
Whimbrel 0 - - 0 - 0 - 0 -Bristle-thighed curlew 0 - - 0 - 0 - 0 -Godwit 0 - - 0 - 0 - 0 -Golden plover 0 - - 0 - 0 - 0 -Small shorebird 0 - - 0 - 0 - 0 -
Total shorebirds 0 - - 0 - 0 - 0 -Grebes and loons
Common loon 0 - - 0 - 0 - 0 -Pacific loon 0 - - 0 - 0 - 0 -Red-throated loon 0 - - 0 - 0 - 0 -Yellow-billed loon 0 - - 0 - 0 - 0 -
Total grebes and loons 0 - - 0 - 0 - 0 -
Total birds 4,727 16% 3,994 – 5,460 2,839 33% 361 53% 1,527 22%Sampling effort (Lower Yukon, 2008): 4 out of 6 villages in this subregion were surveyed; 72% of subregion households were represented in the sample. -: No reported harvest.
Number

51
Table 30.–Estimated harvest of eggs, Yukon–Kuskokwim Delta Region, Lower Yukon Subregion, 2008.
Annual estimated egg harvest Estimated egg harvest by seasonSpecies Confidence Interval Spring Summer Fall
95% CI Low – High Number 95% CI Number 95% CI Number 95% CIDucks
Wigeon 0 - - 0 - 0 - 0 -Green-winged teal 0 - - 0 - 0 - 0 -Mallard 0 - - 0 - 0 - 0 -Pintail 0 - - 0 - 0 - 0 -Shoveler 0 - - 0 - 0 - 0 -Black scoter 0 - - 0 - 0 - 0 -Surf scoter 0 - - 0 - 0 - 0 -White-winged scoter 0 - - 0 - 0 - 0 -Bufflehead 0 - - 0 - 0 - 0 -Goldeneye 0 - - 0 - 0 - 0 -Canvasback 0 - - 0 - 0 - 0 -Scaup 0 - - 0 - 0 - 0 -Common eider 0 - - 0 - 0 - 0 -King eider 0 - - 0 - 0 - 0 -Spectacled eider 0 - - 0 - 0 - 0 -Steller's eider 0 - - 0 - 0 - 0 -Harlequin duck 0 - - 0 - 0 - 0 -Long-tailed duck 0 - - 0 - 0 - 0 -Common merganser 0 - - 0 - 0 - 0 -Red-breasted merganser 0 - - 0 - 0 - 0 -
Total ducks 0 - - 0 - 0 - 0 -Geese
Black brant 0 - - 0 - 0 - 0 -Cackling Canada goose 0 - - 0 - 0 - 0 -Lesser Canada goose 0 - - 0 - 0 - 0 -White-fronted goose 0 - - 0 - 0 - 0 -Emperor goose 0 - - 0 - 0 - 0 -Lesser snow goose 0 - - 0 - 0 - 0 -
Total geese 0 - - 0 - 0 - 0 -Swans
Tundra swan 0 - - 0 - 0 - 0 -Cranes
Sandhill crane 0 - - 0 - 0 - 0 -Grouse
Spruce grouse 0 - - 0 - 0 - 0 -Ptarmigan 0 - - 0 - 0 - 0 -
Total grouse 0 - - 0 - 0 - 0 -Seabirds
Cormorant 0 - - 0 - 0 - 0 -Arctic tern 0 - - 0 - 0 - 0 -Kittiwake 0 - - 0 - 0 - 0 -Sabine's gull 0 - - 0 - 0 - 0 -Mew gull 0 - - 0 - 0 - 0 -Glaucous gull 0 - - 0 - 0 - 0 -Auklet 0 - - 0 - 0 - 0 -Murre 0 - - 0 - 0 - 0 -Guillemot 0 - - 0 - 0 - 0 -Puffin 0 - - 0 - 0 - 0 -
Total seabirds 0 - - 0 - 0 - 0 -Shorebirds
Whimbrel 0 - - 0 - 0 - 0 -Bristle-thighed curlew 0 - - 0 - 0 - 0 -Godwit 0 - - 0 - 0 - 0 -Golden plover 0 - - 0 - 0 - 0 -Small shorebird 0 - - 0 - 0 - 0 -
Total shorebirds 0 - - 0 - 0 - 0 -Grebes and loons
Common loon 0 - - 0 - 0 - 0 -Pacific loon 0 - - 0 - 0 - 0 -Red-throated loon 0 - - 0 - 0 - 0 -Yellow-billed loon 0 - - 0 - 0 - 0 -
Total grebes and loons 0 - - 0 - 0 - 0 -
Total eggs 0 - - 0 - 0 - 0 -Sampling effort (Lower Yukon, 2008): 4 out of 6 villages in this subregion were surveyed; 72% of subregion households were represented in the sample. -: No reported harvest.
Number

52
Table 31.–Estimated harvest of birds, Yukon–Kuskokwim Delta Region, Lower Kuskokwim Subregion, 2008.
Annual estimated bird harvest Estimated bird harvest by seasonSpecies Confidence Interval Spring Summer Fall
95% CI Low – High Number 95% CI Number 95% CI Number 95% CIDucks
Wigeon 682 25% 510 – 853 599 23% 67 148% 16 67%Green-winged teal 202 21% 160 – 243 176 25% 0 - 26 37%Mallard 2,985 21% 2,364 – 3,606 1,505 52% 1,278 21% 202 23%Pintail 899 22% 698 – 1,100 322 38% 301 58% 276 19%Shoveler 250 17% 207 – 292 63 67% 2 148% 184 27%Black scoter 2,074 17% 1,714 – 2,434 1,915 27% 13 126% 145 25%Surf scoter 434 45% 241 – 628 409 89% 0 - 26 53%White-winged scoter 2,288 28% 1,649 – 2,927 2,288 40% 0 - 0 -Bufflehead 89 58% 37 – 141 78 92% 11 148% 0 -Goldeneye 71 42% 41 – 101 37 157% 18 117% 16 67%Canvasback 186 46% 101 – 272 86 122% 85 91% 16 67%Scaup 2,031 25% 1,520 – 2,542 1,765 42% 265 72% 0 -Common eider 0 - - 0 - 0 - 0 -King eider 0 - - 0 - 0 - 0 -Spectacled eider 0 - - 0 - 0 - 0 -Steller's eider 0 - - 0 - 0 - 0 -Harlequin duck 4 148% 2 – 11 4 594% 0 - 0 -Long-tailed duck 270 37% 170 – 370 254 63% 16 148% 0 -Common merganser 0 - - 0 - 0 - 0 -Red-breasted merganser 0 - - 0 - 0 - 0 -
Total ducks 12,465 14% 10,698 – 14,232 9,502 25% 2,056 24% 907 -Geese
Black brant 22 81% 4 – 40 22 121% 0 - 0 -Cackling Canada goose 3,836 22% 3,002 – 4,670 3,096 37% 740 27% 0 -Lesser Canada goose 1,344 19% 1,087 – 1,601 960 42% 328 35% 55 33%White-fronted goose 2,154 18% 1,762 – 2,546 1,833 30% 308 34% 13 53%Emperor goose 6 84% 1 – 11 6 120% 0 - 0 -Lesser snow goose 23 81% 7 – 41 23 92% 0 - 0 -
Total geese 7,384 15% 6,281 – 8,488 5,940 25% 1,376 21% 68 29%Swans
Tundra swan 1,474 17% 1,219 – 1,728 1,308 16% 47 65% 119 21%Cranes
Sandhill crane 205 26% 153 – 258 199 41% 7 110% 0 -Grouse
Spruce grouse 0 - - 0 - 0 - 0 -Ptarmigan 997 64% 363 – 1,631 997 94% 0 - 0 -
Total grouse 997 64% 363 – 1,631 997 94% 0 - 0 -Seabirds
Cormorant 0 - - 0 - 0 - 0 -Arctic tern 0 - - 0 - 0 - 0 -Kittiwake 0 - - 0 - 0 - 0 -Sabine's gull 0 - - 0 - 0 - 0 -Mew gull 0 - - 0 - 0 - 0 -Glaucous gull 0 - - 0 - 0 - 0 -Auklet 0 - - 0 - 0 - 0 -Murre 0 - - 0 - 0 - 0 -Guillemot 0 - - 0 - 0 - 0 -Puffin 0 - - 0 - 0 - 0 -
Total seabirds 0 - - 0 - 0 - 0 -Shorebirds
Whimbrel 0 - - 0 - 0 - 0 -Bristle-thighed curlew 0 - - 0 - 0 - 0 -Godwit 0 - - 0 - 0 - 0 -Golden plover 0 - - 0 - 0 - 0 -Small shorebird 0 - - 0 - 0 - 0 -
Total shorebirds 0 - - 0 - 0 - 0 -Grebes and loons
Common loon 0 - - 0 - 0 - 0 -Pacific loon 282 27% 205 – 359 282 18% 0 - 0 -Red-throated loon 6 92% 1 – 12 6 118% 0 - 0 -Yellow-billed loon 0 - - 0 - 0 - 0 -
Total grebes and loons 288 27% 211 – 365 288 18% 0 - 0 -
Total birds 22,813 14% 19,721 – 25,906 18,233 23% 3,486 17% 1,094 15%Sampling effort (Lower Kuskokwim, 2008): 6 out of 13 villages in this subregion were surveyed; 46% of subregion households were represented in the sample. -: No reported harvest.
Number
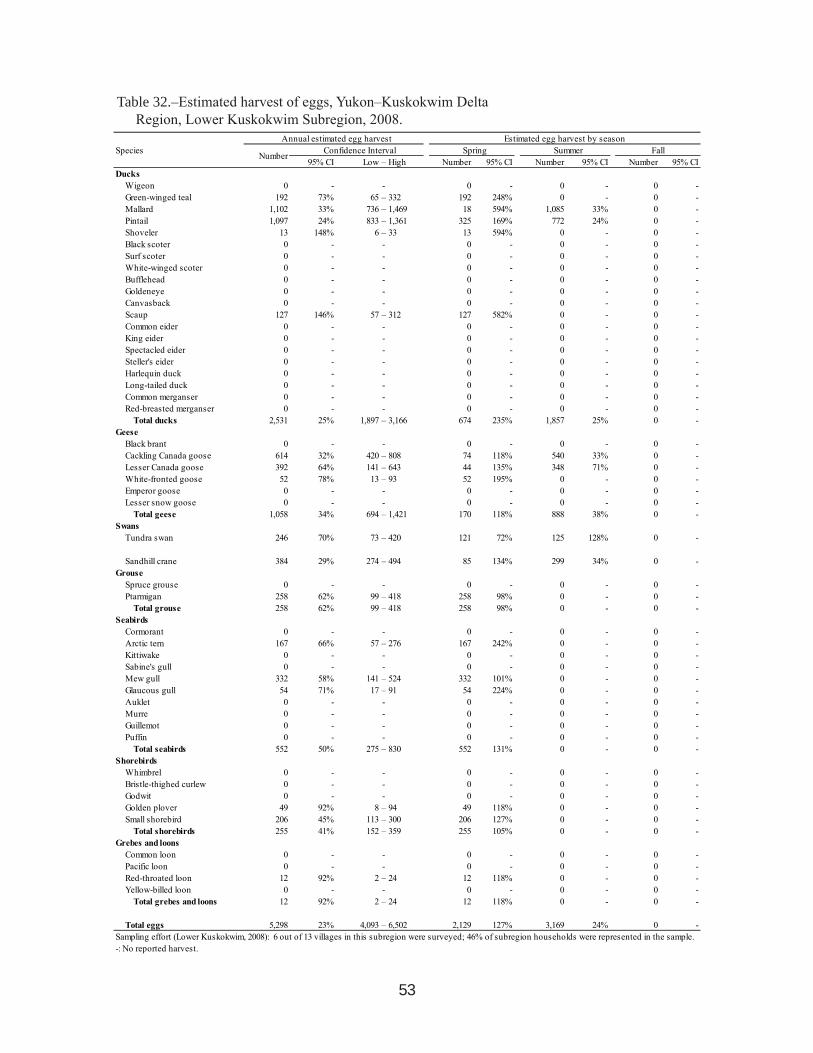
53
Table 32.–Estimated harvest of eggs, Yukon–Kuskokwim Delta Region, Lower Kuskokwim Subregion, 2008.
Annual estimated egg harvest Estimated egg harvest by seasonSpecies Confidence Interval Spring Summer Fall
95% CI Low – High Number 95% CI Number 95% CI Number 95% CIDucks
Wigeon 0 - - 0 - 0 - 0 -Green-winged teal 192 73% 65 – 332 192 248% 0 - 0 -Mallard 1,102 33% 736 – 1,469 18 594% 1,085 33% 0 -Pintail 1,097 24% 833 – 1,361 325 169% 772 24% 0 -Shoveler 13 148% 6 – 33 13 594% 0 - 0 -Black scoter 0 - - 0 - 0 - 0 -Surf scoter 0 - - 0 - 0 - 0 -White-winged scoter 0 - - 0 - 0 - 0 -Bufflehead 0 - - 0 - 0 - 0 -Goldeneye 0 - - 0 - 0 - 0 -Canvasback 0 - - 0 - 0 - 0 -Scaup 127 146% 57 – 312 127 582% 0 - 0 -Common eider 0 - - 0 - 0 - 0 -King eider 0 - - 0 - 0 - 0 -Spectacled eider 0 - - 0 - 0 - 0 -Steller's eider 0 - - 0 - 0 - 0 -Harlequin duck 0 - - 0 - 0 - 0 -Long-tailed duck 0 - - 0 - 0 - 0 -Common merganser 0 - - 0 - 0 - 0 -Red-breasted merganser 0 - - 0 - 0 - 0 -
Total ducks 2,531 25% 1,897 – 3,166 674 235% 1,857 25% 0 -Geese
Black brant 0 - - 0 - 0 - 0 -Cackling Canada goose 614 32% 420 – 808 74 118% 540 33% 0 -Lesser Canada goose 392 64% 141 – 643 44 135% 348 71% 0 -White-fronted goose 52 78% 13 – 93 52 195% 0 - 0 -Emperor goose 0 - - 0 - 0 - 0 -Lesser snow goose 0 - - 0 - 0 - 0 -
Total geese 1,058 34% 694 – 1,421 170 118% 888 38% 0 -Swans
Tundra swan 246 70% 73 – 420 121 72% 125 128% 0 -
Sandhill crane 384 29% 274 – 494 85 134% 299 34% 0 -Grouse
Spruce grouse 0 - - 0 - 0 - 0 -Ptarmigan 258 62% 99 – 418 258 98% 0 - 0 -
Total grouse 258 62% 99 – 418 258 98% 0 - 0 -Seabirds
Cormorant 0 - - 0 - 0 - 0 -Arctic tern 167 66% 57 – 276 167 242% 0 - 0 -Kittiwake 0 - - 0 - 0 - 0 -Sabine's gull 0 - - 0 - 0 - 0 -Mew gull 332 58% 141 – 524 332 101% 0 - 0 -Glaucous gull 54 71% 17 – 91 54 224% 0 - 0 -Auklet 0 - - 0 - 0 - 0 -Murre 0 - - 0 - 0 - 0 -Guillemot 0 - - 0 - 0 - 0 -Puffin 0 - - 0 - 0 - 0 -
Total seabirds 552 50% 275 – 830 552 131% 0 - 0 -Shorebirds
Whimbrel 0 - - 0 - 0 - 0 -Bristle-thighed curlew 0 - - 0 - 0 - 0 -Godwit 0 - - 0 - 0 - 0 -Golden plover 49 92% 8 – 94 49 118% 0 - 0 -Small shorebird 206 45% 113 – 300 206 127% 0 - 0 -
Total shorebirds 255 41% 152 – 359 255 105% 0 - 0 -Grebes and loons
Common loon 0 - - 0 - 0 - 0 -Pacific loon 0 - - 0 - 0 - 0 -Red-throated loon 12 92% 2 – 24 12 118% 0 - 0 -Yellow-billed loon 0 - - 0 - 0 - 0 -
Total grebes and loons 12 92% 2 – 24 12 118% 0 - 0 -
Total eggs 5,298 23% 4,093 – 6,502 2,129 127% 3,169 24% 0 -Sampling effort (Lower Kuskokwim, 2008): 6 out of 13 villages in this subregion were surveyed; 46% of subregion households were represented in the sample. -: No reported harvest.
Number

54
Table 33.–Estimated harvest of birds, Yukon–Kuskokwim Delta Region, Bethel Subregion, 2008.Annual estimated bird harvest Estimated bird harvest by season
Species Confidence Interval Spring Summer Fall95% CI Low – High Number 95% CI Number 95% CI Number 95% CI
DucksWigeon 223 37% 140 – 307 44 149% 15 105% 165 78%Green-winged teal 142 47% 75 – 209 3 159% 15 131% 124 92%Mallard 290 21% 230 – 351 102 41% 81 96% 107 53%Pintail 235 30% 165 – 305 116 84% 6 112% 113 64%Shoveler 81 44% 45 – 117 47 104% 9 159% 26 142%Black scoter 695 25% 521 – 869 689 43% 0 - 6 159%Surf scoter 207 59% 86 – 327 207 102% 0 - 0 -White-winged scoter 320 38% 198 – 442 320 66% 0 - 0 -Bufflehead 0 - - 0 - 0 - 0 -Goldeneye 20 79% 7 – 36 17 159% 3 159% 0 -Canvasback 6 65% 2 – 10 0 - 0 - 6 112%Scaup 351 31% 243 – 459 163 73% 0 - 188 77%Common eider 0 - - 0 - 0 - 0 -King eider 134 80% 46 – 241 134 139% 0 - 0 -Spectacled eider 0 - - 0 - 0 - 0 -Steller's eider 0 - - 0 - 0 - 0 -Harlequin duck 0 - - 0 - 0 - 0 -Long-tailed duck 0 - - 0 - 0 - 0 -Common merganser 0 - - 0 - 0 - 0 -Red-breasted merganser 0 - - 0 - 0 - 0 -
Total ducks 2,704 16% 2,259 – 3,149 1,841 36% 128 69% 735 51%Geese
Black brant 87 91% 30 – 167 87 159% 0 - 0 -Cackling Canada goose 833 17% 695 – 971 471 33% 84 98% 278 58%Lesser Canada goose 533 48% 275 – 791 376 111% 52 117% 104 67%White-fronted goose 2,439 31% 1,671 – 3,207 1,984 62% 111 106% 344 52%Emperor goose 0 - - 0 - 0 - 0 -Lesser snow goose 14 92% 5 – 28 0 - 0 - 14 159%
Total geese 3,907 26% 2,895 – 4,919 2,919 56% 247 64% 741 39%Swans
Tundra swan 105 19% 85 – 124 61 38% 12 112% 32 65%
Sandhill crane 67 26% 50 – 84 55 50% 9 118% 3 159%Grouse
Spruce grouse 0 - - 0 - 0 - 0 -Ptarmigan 1,006 31% 692 – 1,320 1,006 54% 0 - 0 -
Total grouse 1,006 31% 692 – 1,320 1,006 54% 0 - 0 -Seabirds
Cormorant 0 - - 0 - 0 - 0 -Arctic tern 0 - - 0 - 0 - 0 -Kittiwake 0 - - 0 - 0 - 0 -Sabine's gull 0 - - 0 - 0 - 0 -Mew gull 0 - - 0 - 0 - 0 -Glaucous gull 0 - - 0 - 0 - 0 -Auklet 0 - - 0 - 0 - 0 -Murre 0 - - 0 - 0 - 0 -Guillemot 0 - - 0 - 0 - 0 -Puffin 0 - - 0 - 0 - 0 -
Total seabirds 0 - - 0 - 0 - 0 -Shorebirds
Whimbrel 0 - - 0 - 0 - 0 -Bristle-thighed curlew 0 - - 0 - 0 - 0 -Godwit 0 - - 0 - 0 - 0 -Golden plover 0 - - 0 - 0 - 0 -Small shorebird 0 - - 0 - 0 - 0 -
Total shorebirds 0 - - 0 - 0 - 0 -Grebes and loons
Common loon 0 - - 0 - 0 - 0 -Pacific loon 0 - - 0 - 0 - 0 -Red-throated loon 0 - - 0 - 0 - 0 -Yellow-billed loon 0 - - 0 - 0 - 0 -
Total grebes and loons 0 - - 0 - 0 - 0 -
Total birds 7,789 16% 6,556 – 9,021 5,883 33% 396 50% 1,510 37%Sampling effort (Bethel, 2008): 1 out of 1 village in this subregion was surveyed. Harvest expansion assumed that harvesters account for 30% of the total village households (village size estimate). -: No reported harvest.
Number
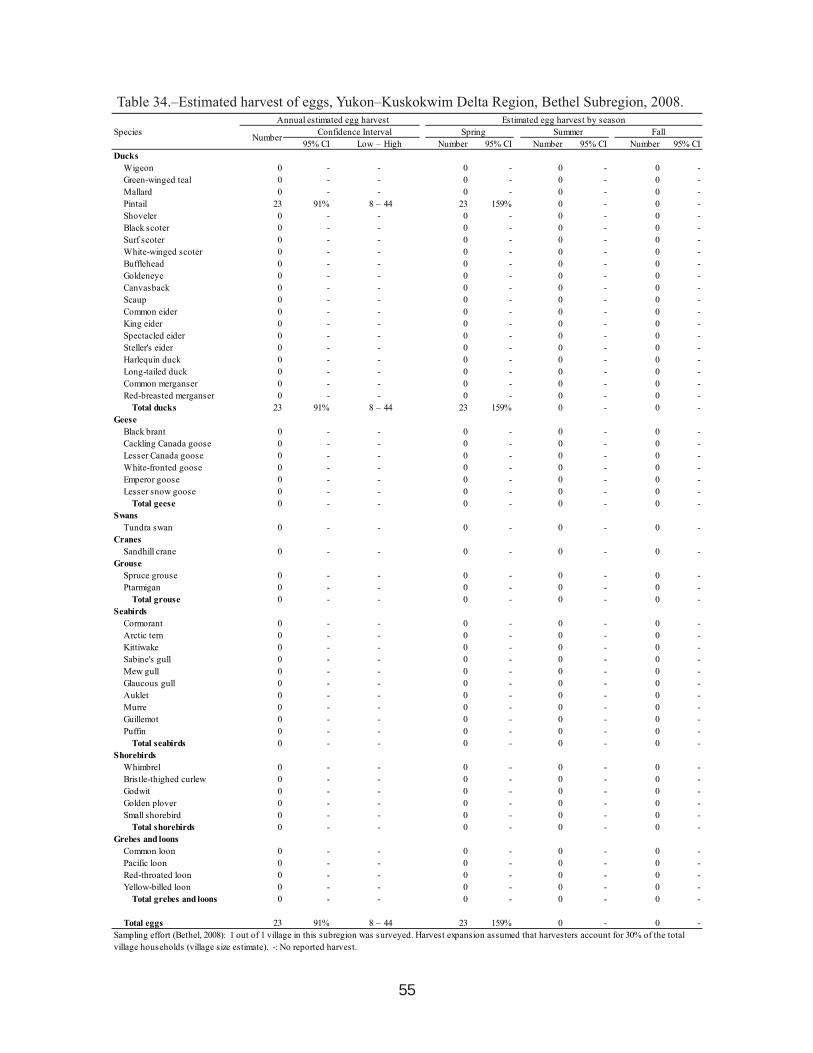
55
Table 34.–Estimated harvest of eggs, Yukon–Kuskokwim Delta Region, Bethel Subregion, 2008. Annual estimated egg harvest Estimated egg harvest by seasonSpecies Confidence Interval Spring Summer Fall
95% CI Low – High Number 95% CI Number 95% CI Number 95% CIDucks
Wigeon 0 - - 0 - 0 - 0 -Green-winged teal 0 - - 0 - 0 - 0 -Mallard 0 - - 0 - 0 - 0 -Pintail 23 91% 8 – 44 23 159% 0 - 0 -Shoveler 0 - - 0 - 0 - 0 -Black scoter 0 - - 0 - 0 - 0 -Surf scoter 0 - - 0 - 0 - 0 -White-winged scoter 0 - - 0 - 0 - 0 -Bufflehead 0 - - 0 - 0 - 0 -Goldeneye 0 - - 0 - 0 - 0 -Canvasback 0 - - 0 - 0 - 0 -Scaup 0 - - 0 - 0 - 0 -Common eider 0 - - 0 - 0 - 0 -King eider 0 - - 0 - 0 - 0 -Spectacled eider 0 - - 0 - 0 - 0 -Steller's eider 0 - - 0 - 0 - 0 -Harlequin duck 0 - - 0 - 0 - 0 -Long-tailed duck 0 - - 0 - 0 - 0 -Common merganser 0 - - 0 - 0 - 0 -Red-breasted merganser 0 - - 0 - 0 - 0 -
Total ducks 23 91% 8 – 44 23 159% 0 - 0 -Geese
Black brant 0 - - 0 - 0 - 0 -Cackling Canada goose 0 - - 0 - 0 - 0 -Lesser Canada goose 0 - - 0 - 0 - 0 -White-fronted goose 0 - - 0 - 0 - 0 -Emperor goose 0 - - 0 - 0 - 0 -Lesser snow goose 0 - - 0 - 0 - 0 -
Total geese 0 - - 0 - 0 - 0 -Swans
Tundra swan 0 - - 0 - 0 - 0 -Cranes
Sandhill crane 0 - - 0 - 0 - 0 -Grouse
Spruce grouse 0 - - 0 - 0 - 0 -Ptarmigan 0 - - 0 - 0 - 0 -
Total grouse 0 - - 0 - 0 - 0 -Seabirds
Cormorant 0 - - 0 - 0 - 0 -Arctic tern 0 - - 0 - 0 - 0 -Kittiwake 0 - - 0 - 0 - 0 -Sabine's gull 0 - - 0 - 0 - 0 -Mew gull 0 - - 0 - 0 - 0 -Glaucous gull 0 - - 0 - 0 - 0 -Auklet 0 - - 0 - 0 - 0 -Murre 0 - - 0 - 0 - 0 -Guillemot 0 - - 0 - 0 - 0 -Puffin 0 - - 0 - 0 - 0 -
Total seabirds 0 - - 0 - 0 - 0 -Shorebirds
Whimbrel 0 - - 0 - 0 - 0 -Bristle-thighed curlew 0 - - 0 - 0 - 0 -Godwit 0 - - 0 - 0 - 0 -Golden plover 0 - - 0 - 0 - 0 -Small shorebird 0 - - 0 - 0 - 0 -
Total shorebirds 0 - - 0 - 0 - 0 -Grebes and loons
Common loon 0 - - 0 - 0 - 0 -Pacific loon 0 - - 0 - 0 - 0 -Red-throated loon 0 - - 0 - 0 - 0 -Yellow-billed loon 0 - - 0 - 0 - 0 -
Total grebes and loons 0 - - 0 - 0 - 0 -
Total eggs 23 91% 8 – 44 23 159% 0 - 0 -Sampling effort (Bethel, 2008): 1 out of 1 village in this subregion was surveyed. Harvest expansion assumed that harvesters account for 30% of the total village households (village size estimate). -: No reported harvest.
Number

56
Table 35.–Estimated harvest of birds, North Slope Region, 2008. Annual estimated bird harvestSpecies Confidence Interval Spring Summer
95% CI Low – High Number 95% CI Number 95% CI Number 95% CIDucks
Wigeon 0 - - 0 - 0 - aGreen-winged teal 0 - - 0 - 0 - aMallard 10 135% 3 – 25 10 135% 0 - aPintail 26 184% 3 – 74 26 184% 0 - aShoveler 0 - - 0 - 0 - aBlack scoter 0 - - 0 - 0 - aSurf scoter 0 - - 0 - 0 - aWhite-winged scoter 0 - - 0 - 0 - aBufflehead 0 - - 0 - 0 - aGoldeneye 0 - - 0 - 0 - aCanvasback 0 - - 0 - 0 - aScaup 0 - - 0 - 0 - aCommon eider 3,166 26% 2,338 – 3,994 1,881 22% 1,285 44% aKing eider 14,157 40% 8,534 – 19,781 5,867 41% 8,290 46% aSpectacled eider 9 184% 1 – 25 0 - 9 184% aSteller's eider 0 - - 0 - 0 - aHarlequin duck 0 - - 0 - 0 - aLong-tailed duck 112 80% 37 – 202 84 105% 28 88% aCommon merganser 0 - - 0 - 0 - aRed-breasted merganser 0 - - 0 - 0 - aDuck (unidentified) 2 145% 1 – 5 0 - 2 145% a
Total ducks 17,482 33% 11,713 – 23,252 7,869 32% 9,614 41% aGeese
Black brant 3,851 18% 3,172 – 4,530 3,344 17% 507 58% aCackling Canada goose 274 76% 105 – 481 255 81% 19 132% aLesser Canada goose 716 41% 423 – 1,008 694 42% 22 100% aWhite-fronted goose 20,187 27% 14,714 – 25,659 19,369 27% 817 61% aEmperor goose 0 - - 0 - 0 - aLesser snow goose 688 40% 412 – 963 679 40% 8 140% a
Total geese 25,714 22% 19,991 – 31,437 24,341 22% 1,373 44% aSwans
Tundra swan 47 64% 17 – 77 47 64% 0 - aCranes
Sandhill crane 35 139% 7 – 83 17 102% 17 184% aGrouse
Spruce grouse 0 - - 0 - 0 - aPtarmigan 1,556 35% 1,006 – 2,106 1,323 39% 233 74% a
Total grouse 1,556 35% 1,006 – 2,106 1,323 39% 233 74% aSeabirds
Cormorant 0 - - 0 - 0 - aArctic tern 0 - - 0 - 0 - aKittiwake 0 - - 0 - 0 - aSabine's gull 0 - - 0 - 0 - aMew gull 0 - - 0 - 0 - aGlaucous gull 120 98% 34 – 238 24 97% 96 120% aAuklet 0 - - 0 - 0 - aMurre 0 - - 0 - 0 - aGuillemot 0 - - 0 - 0 - aPuffin 9 184% 1 – 25 0 - 9 184% a
Total seabirds 129 92% 35 – 247 24 97% 105 111% aShorebirds
Whimbrel 0 - - 0 - 0 - aBristle-thighed curlew 0 - - 0 - 0 - aGodwit 0 - - 0 - 0 - aGolden plover 0 - - 0 - 0 - aSmall shorebird 0 - - 0 - 0 - a
Total shorebirds 0 - - 0 - 0 - aGrebes and loons
Common loon 32 104% 14 – 65 3 132% 29 114% aPacific loon 24 137% 4 – 58 7 135% 17 184% aRed-throated loon 0 - - 0 - 0 - aYellow-billed loonb 102 79% 28 – 182 0 - 102 79% a
Total grebes and loons 158 62% 59 – 256 10 - 148 67% aOther/unknown bird 2 145% 1 – 5 2 - 0 - a
Total birds 45,123 22% 35,404 – 54,842 33,633 - 11,490 36% a
Estimated bird harvest by season
Number Fall
Sampling effort (North Slope, 2008): a. There is no fall survey in the North Slope Region; 5 out of 8 villages in this region were surveyed and both subregions were represented in the sample. Harvest estimates presented only at the regional level by request of regional partners. A dash ("-") indicates no reported harvest.b. In the North Slope Region, loons are occasionally entangled in subsistence fishing nets. Entangled yellow-billed loons salvaged from fishing nets are used for ceremonial purposes and were reported as "harvested" in this survey. Reported numbers of yellow-billed loons for the region were 28 birds in 2008.

57
Table 36.–Estimated harvest of eggs, North Slope Region, 2008. Annual estimated egg harvestSpecies Confidence Interval Spring Summer
95% CI Low – High Number 95% CI Number 95% CI Number 95% CIDucks
Wigeon 25 140% 6 – 61 25 140% 0 - aGreen-winged teal 0 - - 0 - 0 - aMallard 0 - - 0 - 0 - aPintail 0 - - 0 - 0 - aShoveler 0 - - 0 - 0 - aBlack scoter 0 - - 0 - 0 - aSurf scoter 0 - - 0 - 0 - aWhite-winged scoter 31 132% 10 – 72 31 132% 0 - aBufflehead 0 - - 0 - 0 - aGoldeneye 0 - - 0 - 0 - aCanvasback 0 - - 0 - 0 - aScaup 0 - - 0 - 0 - aCommon eider 259 132% 84 – 602 259 132% 0 - aKing eider 0 - - 0 - 0 - aSpectacled eider 0 - - 0 - 0 - aSteller's eider 0 - - 0 - 0 - aHarlequin duck 0 - - 0 - 0 - aLong-tailed duck 65 132% 21 – 151 65 132% 0 - aCommon merganser 0 - - 0 - 0 - aRed-breasted merganser 4 145% 2 – 11 4 145% 0 - a
Total ducks 385 122% 123 – 855 385 122% 0 - aGeese
Black brant 0 - - 0 - 0 - aCackling Canada goose 0 - - 0 - 0 - aLesser Canada goose 0 - - 0 - 0 - aWhite-fronted goose 388 82% 107 – 706 239 72% 149 113% aEmperor goose 0 - - 0 - 0 - aLesser snow goose 25 140% 6 – 61 25 140% 0 - a
Total geese 413 77% 113 – 731 265 65% 149 113% aSwans
Tundra swan 38 104% 10 – 77 25 96% 13 140% aCranes
Sandhill crane 0 - - 0 - 0 - aGrouse
Spruce grouse 0 - - 0 - 0 - aPtarmigan 0 - - 0 - 0 - a
Total grouse 0 - - 0 - 0 - aSeabirds
Cormorant 0 - - 0 - 0 - aArctic tern 0 - - 0 - 0 - aKittiwake 0 - - 0 - 0 - aSabine's gull 0 - - 0 - 0 - aMew gull 0 - - 0 - 0 - aGlaucous gull 22 145% 10 – 54 22 145% 0 - aAuklet 0 - - 0 - 0 - aMurre 0 - - 0 - 0 - aGuillemot 0 - - 0 - 0 - aPuffin 0 - - 0 - 0 - a
Total seabirds 22 145% 10 – 54 22 145% 0 - aShorebirds
Whimbrel 0 - - 0 - 0 - aBristle-thighed curlew 0 - - 0 - 0 - aGodwit 0 - - 0 - 0 - aGolden plover 0 - - 0 - 0 - aSmall shorebird 0 - - 0 - 0 - a
Total shorebirds 0 - - 0 - 0 - aGrebes and loons
Common loon 0 - - 0 - 0 - aPacific loon 0 - - 0 - 0 - aRed-throated loon 0 - - 0 - 0 - aYellow-billed loon 0 - - 0 - 0 - a
Total grebes and loons 0 - - 0 - 0 - aa
Total eggs 858 70% 256 – 1,461 696 76% 161 114% a
Number FallEstimated egg harvest by season
Sampling effort (North Slope, 2008): a. There is no fall survey in the North Slope Region; 5 out of 8 villages in this region were surveyed and both subregions were represented in the sample. Harvest estimates presented only at the regional level by request of regional partners. A dash ("-") indicates no reported harvest.
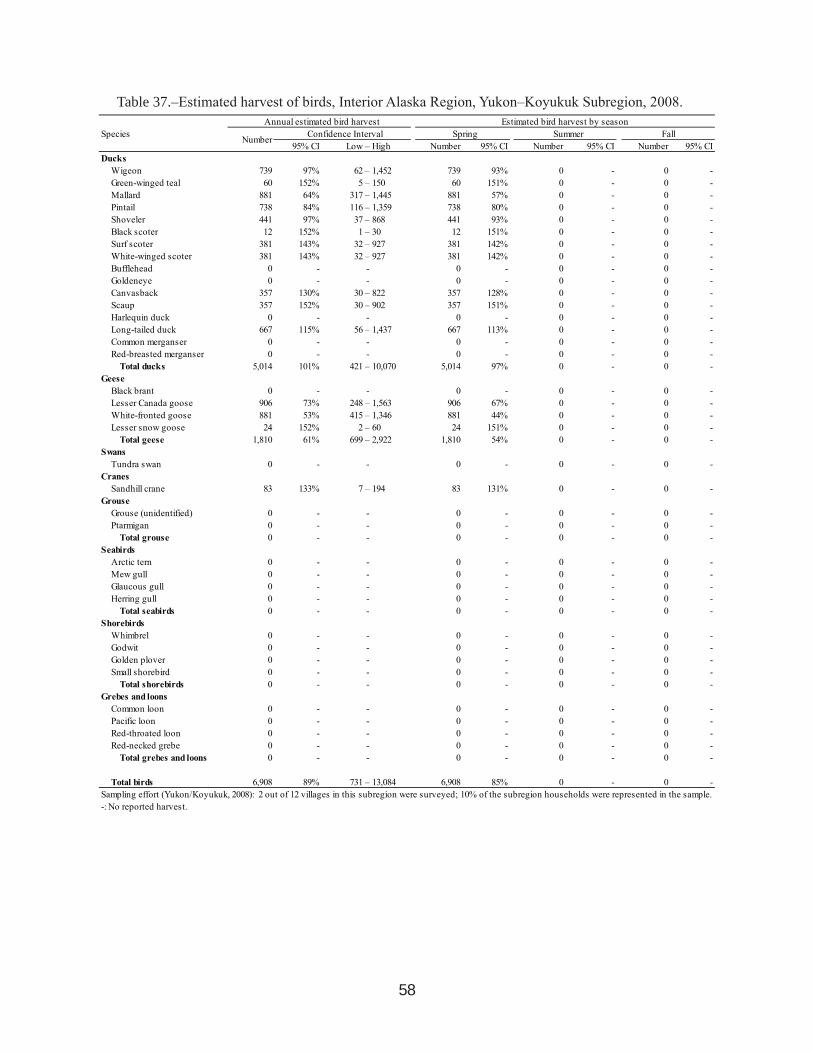
58
Table 37.–Estimated harvest of birds, Interior Alaska Region, Yukon–Koyukuk Subregion, 2008. Annual estimated bird harvest Estimated bird harvest by seasonSpecies Confidence Interval Spring Summer Fall
95% CI Low – High Number 95% CI Number 95% CI Number 95% CIDucks
Wigeon 739 97% 62 – 1,452 739 93% 0 - 0 -Green-winged teal 60 152% 5 – 150 60 151% 0 - 0 -Mallard 881 64% 317 – 1,445 881 57% 0 - 0 -Pintail 738 84% 116 – 1,359 738 80% 0 - 0 -Shoveler 441 97% 37 – 868 441 93% 0 - 0 -Black scoter 12 152% 1 – 30 12 151% 0 - 0 -Surf scoter 381 143% 32 – 927 381 142% 0 - 0 -White-winged scoter 381 143% 32 – 927 381 142% 0 - 0 -Bufflehead 0 - - 0 - 0 - 0 -Goldeneye 0 - - 0 - 0 - 0 -Canvasback 357 130% 30 – 822 357 128% 0 - 0 -Scaup 357 152% 30 – 902 357 151% 0 - 0 -Harlequin duck 0 - - 0 - 0 - 0 -Long-tailed duck 667 115% 56 – 1,437 667 113% 0 - 0 -Common merganser 0 - - 0 - 0 - 0 -Red-breasted merganser 0 - - 0 - 0 - 0 -
Total ducks 5,014 101% 421 – 10,070 5,014 97% 0 - 0 -Geese
Black brant 0 - - 0 - 0 - 0 -Lesser Canada goose 906 73% 248 – 1,563 906 67% 0 - 0 -White-fronted goose 881 53% 415 – 1,346 881 44% 0 - 0 -Lesser snow goose 24 152% 2 – 60 24 151% 0 - 0 -
Total geese 1,810 61% 699 – 2,922 1,810 54% 0 - 0 -Swans
Tundra swan 0 - - 0 - 0 - 0 -Cranes
Sandhill crane 83 133% 7 – 194 83 131% 0 - 0 -Grouse
Grouse (unidentified) 0 - - 0 - 0 - 0 -Ptarmigan 0 - - 0 - 0 - 0 -
Total grouse 0 - - 0 - 0 - 0 -Seabirds
Arctic tern 0 - - 0 - 0 - 0 -Mew gull 0 - - 0 - 0 - 0 -Glaucous gull 0 - - 0 - 0 - 0 -Herring gull 0 - - 0 - 0 - 0 -
Total seabirds 0 - - 0 - 0 - 0 -Shorebirds
Whimbrel 0 - - 0 - 0 - 0 -Godwit 0 - - 0 - 0 - 0 -Golden plover 0 - - 0 - 0 - 0 -Small shorebird 0 - - 0 - 0 - 0 -
Total shorebirds 0 - - 0 - 0 - 0 -Grebes and loons
Common loon 0 - - 0 - 0 - 0 -Pacific loon 0 - - 0 - 0 - 0 -Red-throated loon 0 - - 0 - 0 - 0 -Red-necked grebe 0 - - 0 - 0 - 0 -
Total grebes and loons 0 - - 0 - 0 - 0 -
Total birds 6,908 89% 731 – 13,084 6,908 85% 0 - 0 -Sampling effort (Yukon/Koyukuk, 2008): 2 out of 12 villages in this subregion were surveyed; 10% of the subregion households were represented in the sample. -: No reported harvest.
Number

59
Table 38.–Estimated harvest of eggs, Interior Alaska Region, Yukon–Koyukuk Subregion, 2008. Annual estimated egg harvest Estimated egg harvest by seasonSpecies Confidence Interval Spring Summer Fall
95% CI Low - High Number 95% CI Number 95% CI Number 95% CIDucks
Wigeon 0 - - 0 - 0 - 0 -Green-winged teal 0 - - 0 - 0 - 0 -Mallard 0 - - 0 - 0 - 0 -Pintail 0 - - 0 - 0 - 0 -Shoveler 0 - - 0 - 0 - 0 -Black scoter 0 - - 0 - 0 - 0 -Surf scoter 0 - - 0 - 0 - 0 -White-winged scoter 0 - - 0 - 0 - 0 -Bufflehead 0 - - 0 - 0 - 0 -Goldeneye 0 - - 0 - 0 - 0 -Canvasback 0 - - 0 - 0 - 0 -Scaup 0 - - 0 - 0 - 0 -Harlequin duck 0 - - 0 - 0 - 0 -Long-tailed duck 0 - - 0 - 0 - 0 -Common merganser 0 - - 0 - 0 - 0 -Red-breasted merganser 0 - - 0 - 0 - 0 -
Total ducks 0 - - 0 - 0 - 0 -Geese
Black brant 0 - - 0 - 0 - 0 -Lesser Canada goose 0 - - 0 - 0 - 0 -White-fronted goose 0 - - 0 - 0 - 0 -Lesser snow goose 0 - - 0 - 0 - 0 -
Total geese 0 - - 0 - 0 - 0 -Swans
Tundra swan 0 - - 0 - 0 - 0 -Cranes
Sandhill crane 0 - - 0 - 0 - 0 -Grouse
Grouse (unidentified) 0 - - 0 - 0 - 0 -Ptarmigan 0 - - 0 - 0 - 0 -
Total grouse 0 - - 0 - 0 - 0 -Seabirds
Arctic tern 0 - - 0 - 0 - 0 -Mew gull 0 - - 0 - 0 - 0 -Glaucous gull 0 - - 0 - 0 - 0 -Herring gull 0 - - 0 - 0 - 0 -
Total seabirds 0 - - 0 - 0 - 0 -Shorebirds
Whimbrel 0 - - 0 - 0 - 0 -Godwit 0 - - 0 - 0 - 0 -Golden plover 0 - - 0 - 0 - 0 -Small shorebird 0 - - 0 - 0 - 0 -
Total shorebirds 0 - - 0 - 0 - 0 -Grebes and loons
Common loon 0 - - 0 - 0 - 0 -Pacific loon 0 - - 0 - 0 - 0 -Red-throated loon 0 - - 0 - 0 - 0 -Red-necked grebe 0 - - 0 - 0 - 0 -
Total grebes and loons 0 - - 0 - 0 - 0 -
Total eggs 0 - - 0 - 0 - 0 -Sampling effort (Yukon/Koyukuk, 2008): 2 out of 12 villages in this subregion were surveyed; 10% of the subregion households were represented in the sample. -: No reported harvest.
Number

60
Ho
uSe
Ho
lD
PA
rt
iCiP
Atio
n r
Ate
S 200
4–20
08
Tabl
e 39
.–H
ouse
hold
par
ticip
atio
n ra
tes,
2004
–200
8.
2004
2005
2006
2007
2008
Reg
ion
Subr
egio
nG
ulf o
f Ala
ska-
Coo
k In
let
97%
32-
--
--
--
-Gu
lf of
Ala
ska
100%
18-
-79
%24
--
--
Cook
Inle
t93
%14
71%
17-
--
--
-K
odia
k A
rchi
pela
go-
--
-72
%23
3-
--
-K
odia
k Vi
llage
s10
0%65
--
75%
169
--
--
Kod
iak
City
& R
oad
Conn
ecte
d-
--
-64
%64
--
--
Ale
utia
n-Pr
ibilo
f Isl
ands
--
--
--
--
97%
189
Ale
utia
n-Pr
ibilo
f Vill
ages
--
97%
38-
-10
0%25
95%
73U
nala
ska
--
--
--
--
99%
116
Bri
stol
Bay
--
--
--
89%
354
98%
357
Sout
h A
lask
a Pe
nins
ula
--
--
--
93%
29-
-So
uthw
est B
risto
l Bay
--
--
--
85%
214
96%
155
Dill
ingh
am-
--
--
-97
%11
110
0%20
2Yu
kon-
Kus
kokw
im D
elta
--
--
--
--
62%
1,30
0Y-
K D
elta
Sou
th C
oast
--
--
78%
9086
%28
373
%17
3Y-
K D
elta
Mid
Coa
st-
--
-81
%15
654
%25
750
%40
0Y-
K D
elta
Nor
th C
oast
--
--
56%
107
44%
255
63%
300
Low
er Y
ukon
--
--
84%
5660
%21
198
%94
Low
er K
usko
kwim
--
--
63%
294
60%
602
61%
333
Cent
ral K
usko
kwim
--
--
74%
73-
--
-Be
thel
--
--
--
--
--
Ber
ing
Stra
it-N
orto
n So
und
71%
525
80%
354
--
90%
436
--
St. L
awre
nce-
Dio
med
e Is
.75
%10
987
%75
--
95%
86-
-Be
ring
Stra
it M
ainl
and
Villa
ges
85%
206
78%
143
--
93%
159
--
Nom
e57
%21
077
%13
6-
-86
%19
1-
-N
orth
west
Arc
tic-
--
--
--
--
-N
orth
wes
t Arc
tic V
illag
es-
--
-86
%24
2-
--
-K
otze
bue
--
--
--
--
--
Nor
th S
lope
--
91%
600
--
--
--
Nor
th S
lope
Vill
ages
--
87%
394
--
--
--
Barro
w-
-98
%20
6-
--
--
-In
teri
or-
--
--
--
--
-M
id Y
ukon
-Upp
er K
usko
kwin
--
--
--
--
--
Yuko
n-K
oyuk
uk10
0%18
--
90%
8310
0%50
100%
51U
pper
Yuk
on-
--
-95
%24
610
0%14
7-
-Ta
nana
Vill
ages
99%
100
--
99%
123
--
--
Tok
--
--
100%
60-
--
-Up
per
Cop
per
Riv
er96
%57
--
--
84%
38-
-H
ouse
hold
Par
ticip
atio
n Ra
te =
Num
ber o
f hou
seho
lds
that
agr
eed
to p
artic
ipat
e / T
otal
num
ber o
f hou
seho
lds
for w
hich
per
mis
sion
slip
s ar
e av
aila
ble.
a. N
umbe
r of h
ouse
hold
s fo
r whi
ch p
erm
issi
on s
lips
are
avai
labl
e (m
ay n
ot re
pres
ent t
he to
tal n
umbe
r of h
ouse
hold
s su
rvey
ed).
-: In
form
atio
n no
t ava
ilabl
e (re
gion
/sub
regi
on n
ot s
urve
yed
or p
erm
issi
on s
lips
not a
vaila
ble
for d
ata
man
agem
ent a
nd a
naly
sis)
. 200
4–20
07 P
artic
ipat
ion
rate
s fro
m N
aves
�(201
0).
Hou
seho
ld
Parti
cipa
tion
Rate
Num
ber o
f
Hou
seho
ldsa
Hou
seho
ld
Parti
cipa
tion
Rate
Num
ber o
f
Hou
seho
ldsa
Hou
seho
ld
Parti
cipa
tion
Rate
Num
ber o
f
Hou
seho
ldsa
Hou
seho
ld
Parti
cipa
tion
Rate
Num
ber o
f
Hou
seho
ldsa
Hou
seho
ld
Parti
cipa
tion
Rate
Num
ber o
f
Hou
seho
ldsa

61
ACKNOWLEDGMENTSThis harvest assessment program would not be possible without the strong local support of the
villages where the surveys are conducted. The Alaska Migratory Bird Co-Management Council and the Alaska Department of Fish & Game Division of Subsistence are most grateful to the hundreds of households that volunteer to report their subsistence harvests of migratory birds to locally hired surveyors and to the village and tribal councils that facilitate village participation in the survey. The AMBCC and the ADF&G Division of Subsistence are very thankful for the collaboration of the many Alaska Native organizations and national wildlife refuges that coordinate the survey regionally. We thank Terri Lemons, ADF&G Division of Subsistence, for preparing the maps presented in this report. We thank Dave Koster and the ADF&G Division of Subsistence Information Management Unit for providing continuous support with data entry, management, and analysis. We also thank Lisa Olson and Garrett Zimpelman, ADF&G Division of Subsistence, for their assistance as editors of this report.
62
REFERENCES CITEDADLWD (Alaska Department of Labor and Workforce Development). 2009. Alaska population estimates.
Alaska Department of Labor and Workforce Development, Juneau.
Ainley, D.G., D.N. Nettleship, H.R. Carter, and A.E. Storey. 2002. Common Murre (Uria aalge). in Poole, A., editor. The birds of North America online. Cornell Lab of Ornithology: Ithaca, New York.
AMBCC (Alaska Migratory Bird Co-Management Council). 2003. Recommendations for a statewide Alaska migratory bird subsistence harvest survey. Submitted to the Alaska Migratory Bird Co-Management Council. Subsistence Harvest Survey Ad-hoc Committee, Anchorage.
Austin, J.E., and M.R. Miller. 1995. Northern pintail (Anas acuta). in Poole, A., editor. The birds of North America online. Cornell Lab of Ornithology: Ithaca, NY.
Bales, B.D., S.L. Sheriff, J.H. Schulz, and D.A. Shipes. 2002. The impact of the Harvest Information Program on state-level survey capability and reliability. Pages 69–71 in Ver Steeg, J.M., and R.C. Elden, editors. Harvest information program: evaluation and recommendations. International Association of Fish and Wildlife Agencies, Migratory Shore and Upland Game Bird Working Group, Ad Hoc Committee on HIP: Washington, D.C.
Banks, R.C., C. Cicero, J.L. Dunn, A.W. Kratter, P.C. Rasmussen, J.V. Remsen Jr., J.D. Rising, and D.F. Stotz. 2004. Forty-fifth supplement to the American Ornithologists’ Union check-list of North American birds. The Auk 121 (3):985–995.
Bernard, D.R., A.E. Bingham, and M. Alexandersdottir. 1998. The mechanics of onsite creel surveys in Alaska. Alaska Department of Fish and Game Special Publication No. 98-1, Anchorage.
Cochran, W.G. 1977. Sampling techniques. 3rd edition. John Wiley & Sons: New York, NY.
Drilling, N., R. Titman, and F. Mckinney. 2002. Mallard (Anas platyrhynchos). in Poole, A., editor. The birds of North American online. Cornell Lab of Ornithology: Ithaca, NY.
Gilchrist, H.G. 2001. Glaucous gull (Larus hyperboreus). in Poole, A., editor. The birds of North America online. Cornell Lab of Ornithology: Ithaca, NY.
Hatch, J.J. 2002. Arctic tern (Sterna paradisaea). in Poole, A., editor. The birds of North America online. Cornell Lab of Ornithology: Ithaca, NY.
Hayward, J.L., and N.A. Verbeek. 2008. Glaucous-winged gull (Larus glaucescens). in Poole, A., editor. The birds of North America online. Cornell Lab of Ornithology: Ithaca, NY.
Kawerak Inc. 2004. 2002 migratory bird harvest data collection project; Bering Strait/Norton Sound region. Kawerak Natural Resources Department, Subsistence Resources Division, Nome.
Moore, M.T., K.D. Richkus, P.I. Padding, E.M. Martin, S.S. Williams, and H.L. Spriggs. 2007. Migratory bird hunting activity and harvest during the 2001 and 2002 hunting seasons - final report. U.S. Fish and Wildlife Service, Division of Migratory Bird Management, Branch of Harvest Surveys, and U.S. Department of the Interior, Washington, D.C.
Moskoff, W., and L.R. Bevier. 2002. Mew gull (Larus canus). in Poole, A., editor. The birds of North America online. Cornell Lab of Ornithology: Ithaca, NY.
Naves, L.C., D. Koster, M.G. See, B. Easley, and L. Olson. 2008. Alaska Migratory Bird Co-Management Council migratory bird subsistence harvest survey: assessment of the survey methods and implementation. Alaska Department of Fish and Game Division of Subsistence, Special Publication No. SP2008-005, Anchorage.

63
Naves, L.C. 2010, revised [2009]. Alaska migratory bird subsistence harvest estimates, 2004–2007, Alaska Migratory Bird Co-Management Council. Alaska Department of Fish and Game Division of Subsistence, Technical Paper No. 349, Anchorage.
Pacific Flyway Council. 2010 [1986, revised 1999], unpublished. Pacific Flyway management plan for the cackling Canada goose. Cackling Canada Goose Subcommittee, Pacific Flyway Study Committee through U.S. Fish and Wildlife Service, Portland, OR.
Padding, P.I., M.T. Moore, K.D. Richkus, E.M. Martin, S.S. Williams, and H.L. Spriggs. 2006. Migratory bird hunting activity and harvest during the 1999 and 2000 hunting seasons. U.S. Fish and Wildlife Service, Division of Migratory Bird Management, Branch of Harvest Surveys, and U.S. Department of the Interior, Washington, D.C.
Pamplin, W.L., Jr. 1986. Cooperative efforts to halt population declines of geese nesting on Alaska’s Yukon-Kuskokwim Delta. Transactions of the North American Wildlife & Natural Resources Conference 51:487–506.
Pearce, J.M., B.J. Pierson, S.L. Talbot, D.V. Derksen, D. Kraege, and K.T. Scribner. 2000. A genetic evaluation of morphology used to identify havested Canada geese. Journal of Wildlife Management 64 (3):863–874.
Pierotti, R.J., and T.P. Good. 1994. Herring gull (Larus argentatus). in Poole, A., editor. The birds of North America online. Cornell Lab of Ornithology: Ithaca, NY.
Reynolds, J.H. 2007. Investigating the impact of sampling effort on annual migratory bird subsistence harvest survey estimates. Final report for USFWS MBM Order No. 701812M816. Solutions Statistical Consulting, Anchorage.
Seim, S.G., and C. Wentworth. 1996. Subsistence migratory bird harvest survey: Bristol Bay, 1995. U.S. Fish and Wildlife Service in cooperation with the Bristol Bay Native Association and the Alaska Peninsula-Becharof National Wildlife Refuge, Anchorage.
Sibley Guides. 2004. Distinguishing cackling and Canada goose. Sibley Guides, http://www.sibleyguides.com/2007/07/identification-of-cackling-and-canada-goose/ (accessed 9 June, 2010).
Timm, D., T. Rothe, and B. Ray (illustration). 1994. Canada Geese. Alaska Department of Fish and Game, Wildlife Notebook Series. http://www.adfg.state.ak.us/pubs/notebook/bird/canada.php (accessed 9 June, 2010).
U.S. Census Bureau. 2001. Profiles of general demographic characteristics, Alaska: 2000. U.S. Department of Commerce Washington, D.C.
Warren, K. 2006. Identification field guide to the geese of the Willamette Valley and lower Columbia River. 2nd edition. Wild Spirit Resources LLC, http://www.wildspiritresources.com/servlet/the-208/Goose-Field-Guide/Detail.
Wentworth, C., and S.G. Seim. 1996. Subsistence waterfowl harvest survey: Yukon-Kuskokwim Delta: comprehensive report 1985-1995; results 1995. U.S. Fish and Wildlife Service Migratory Bird Management in cooperation with the Yukon Delta National Wildlife Refuge, Anchorage.
Wentworth, C. 1998. Subsistence waterfowl harvest survey: Yukon-Kuskokwim Delta: comprehensive report 1987-1997. U.S. Fish and Wildlife Service Migratory Bird Management in cooperation with the Yukon Delta National Wildlife Refuge, Anchorage.
Wentworth, C. 2004. Subsistence migratory bird harvest survey: Yukon-Kuskokwim delta, 1995-2000. U. S. Fish and Wildlife Service Migratory Birds and State Programs, in cooperation with the Yukon Delta National Wildlife Refuge, Anchorage.

64
Wentworth, C. 2006. Subsistence migratory bird harvest survey handbook 2007; subsistence migratory bird harvest survey handbook for refuge information technicians and survey contractors. Alaska Migratory Bird Co-Management Council, Anchorage.
Wentworth, C. 2007a. Subsistence migratory bird harvest survey: Bristol Bay: 2001-2005, with 1995-2005 species tables. U.S. Fish and Wildlife Service Migratory Birds and State Programs, in cooperation with Togiak National Wildlife Refuge and Bristol Bay Native Association, Anchorage.
Wentworth, C. 2007b. Subsistence migratory bird harvest survey: Yukon-Kuskokwim Delta: 2001-2005 with 1985-2005 species tables. U.S. Fish and Wildlife Service Migratory Birds and State Programs, in cooperation with Yukon Delta National Wildlife Refuge, Anchorage.
Westat Inc. 1989. Investigation of possible recall/reference period bias in national surveys of fishing, hunting and wildlife-association recreation: final report. U.S. Fish and Wildlife Service and Westat, Inc.: Rockville, MD.
Zavaleta, E. 1999. The emergence of waterfowl conservation among Yup’ik hunters in the Yukon-Kuskokwim Delta, Alaska. Human Ecology 27 (2):231–266.

65
APPENDICES
Appendix A.–Regions, subregions, and villages included in the 2004–2008 harvest estimates.
RegionSubregion
Village 2004 2005 2006 2007 2008Gulf of Alaska–Cook Inlet
Gulf of Alaska Chenega Bay - - x - -Nanwalek x - - - -Port Graham x - x - -Tatitlek x - - - -
Cook Inlet Tyonek x x - - -
Kodiak Archipelago Kodiak Villages
Akhiok - - x - -Karluk - - x - -Larsen Bay - - x - -Old Harbor - - x - -Ouzinkie - - x - -Port Lions - - - - -
Kodiak City and Road-connected Kodiak City - - x - -Kodiak Station - - - - -Chiniak - - - - -Women’s Bay - - - - -Kodiak at large - - - - -Aleneva - - - - -
Aleutian–Pribilof Islands Aleutian–Pribilof Villages
Adak Station - - - - -Akutan - x - x xAtka - x - - -Cold Bay - x - - -False Pass - - - - xKing Cove - x - - xNelson Lagoon - - - - -
-continued-
APPenDix A.–regionS, SuBregionS, AnD villAgeS inCluDeD in tHe 2004–2008 HArveSt eStiMAteS.
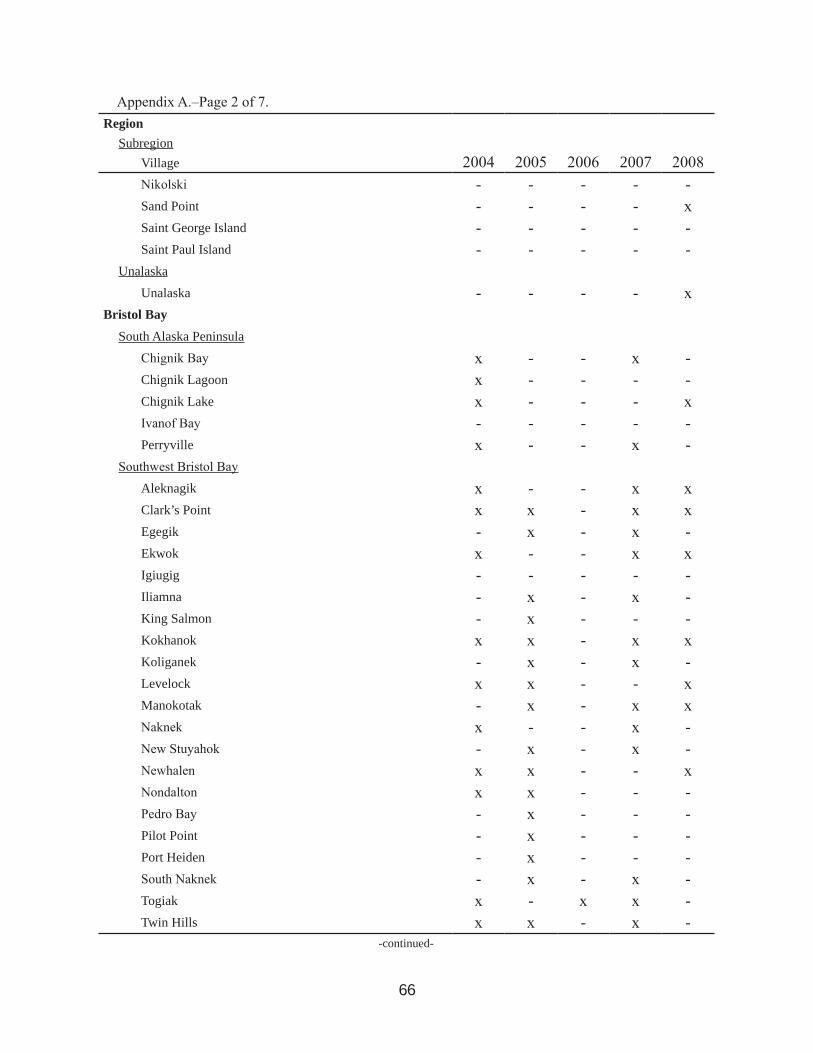
66
RegionSubregion
Village 2004 2005 2006 2007 2008Nikolski - - - - -Sand Point - - - - xSaint George Island - - - - -Saint Paul Island - - - - -
Unalaska Unalaska - - - - x
Bristol Bay South Alaska Peninsula
Chignik Bay x - - x -Chignik Lagoon x - - - -Chignik Lake x - - - xIvanof Bay - - - - -Perryville x - - x -
Southwest Bristol Bay Aleknagik x - - x xClark’s Point x x - x xEgegik - x - x -Ekwok x - - x xIgiugig - - - - -Iliamna - x - x -King Salmon - x - - -Kokhanok x x - x xKoliganek - x - x -Levelock x x - - xManokotak - x - x xNaknek x - - x -New Stuyahok - x - x -Newhalen x x - - xNondalton x x - - -Pedro Bay - x - - -Pilot Point - x - - -Port Heiden - x - - -South Naknek - x - x -Togiak x - x x -Twin Hills x x - x -
-continued-
Appendix A.–Page 2 of 7.

67
RegionSubregion
Village 2004 2005 2006 2007 2008Dillingham
Dillingham - x - x xYukon-Kuskokwim Delta
Y–K Delta South Coast Eek x x - x xGoodnews Bay - - x - xKipnuk - x x x -Kongiganak - x x x xKwigillingok - - - - -Platinum - x x - -Quinhagak x x x x xTuntutuliak x - x - x
Y–K Delta Mid Coast Chefornak x - x x -Chevak x - - - -Hooper Bay x x - - xMekoryuk - x - x xNewtok - x x - xNightmute x - x x -Scammon Bay - - x - xToksook Bay x x - x -Tununak x x - x x
Y–K Delta North Coast Alakanuk x - x - -Emmonak - x x x xKotlik x x - - -Nunam Iqua - x x - x
Lower Yukon Marshall x x - x xMountain Village - x - x xPilot Station - x x - xPitkas Point x - x x -Russian Mission - x x - xSaint Mary’s - x - x -
Lower Kuskokwim -continued-
Appendix A.–Page 3 of 7.

68
RegionSubregion
Village 2004 2005 2006 2007 2008Akiachak - - x - -Akiak - x x x -Aniak x x - - xAtmautluak x - - x xKasigluk x - x x -Kwethluk x x x x -Lower Kalskag x - x x xNapakiak - - - x -Napaskiak - x x x xNunapitchuk x x - x xOscarville - - x x -Tuluksak - x x - xUpper Kalskag - x x - -
Central Kuskokwim Chuathbaluk x - - - -Crooked Creek x - x - -Lime Village - - x - -Red Devil - - - x -Sleetmute - - x x -Stony River x - x - -
Bethel Bethel x x x x x
Bering Strait–Norton Sound St. Lawrence–Diomede Is.
Diomede - x - x -Gambell x x - x -Savoonga x x - x -
Bering Strait Mainland Villages Brevig Mission x - - x -Elim x x - - -Golovin - x - x -Koyuk - x - x -Shaktoolik - - - x -Shishmaref x x - - -Saint Michael x - - x -
-continued-
Appendix A.–Page 4 of 7.
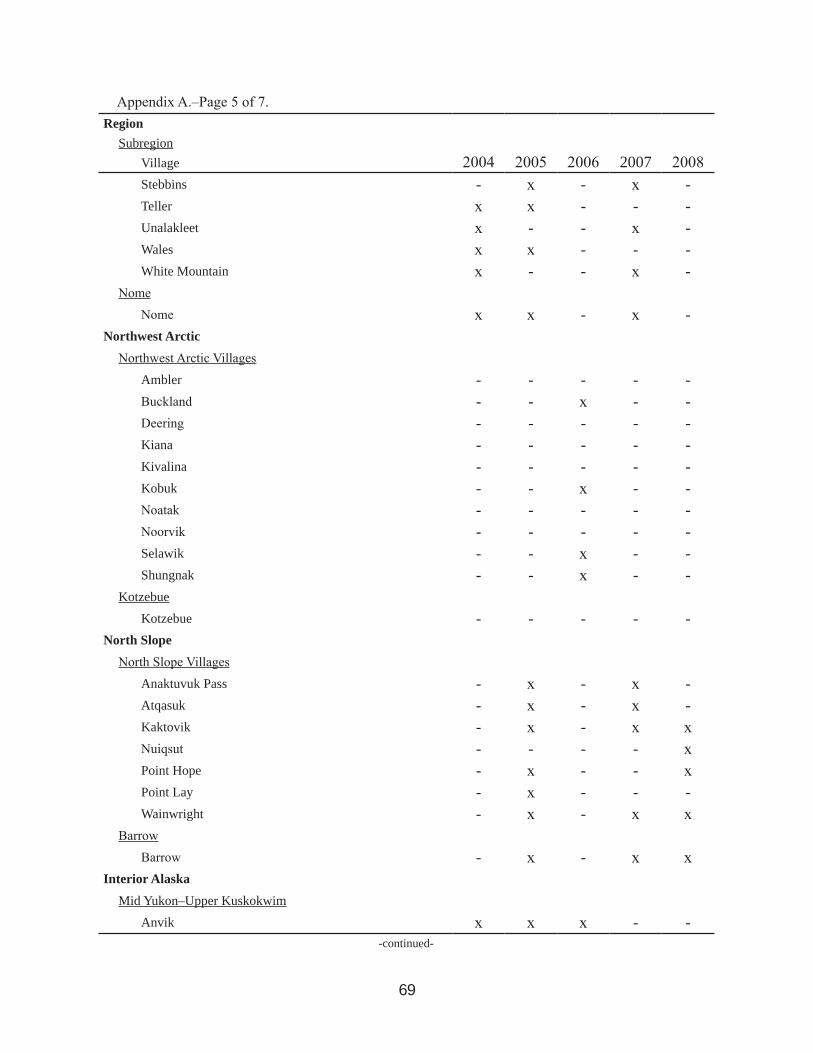
69
RegionSubregion
Village 2004 2005 2006 2007 2008Stebbins - x - x -Teller x x - - -Unalakleet x - - x -Wales x x - - -White Mountain x - - x -
Nome Nome x x - x -
Northwest Arctic Northwest Arctic Villages
Ambler - - - - -Buckland - - x - -Deering - - - - -Kiana - - - - -Kivalina - - - - -Kobuk - - x - -Noatak - - - - -Noorvik - - - - -Selawik - - x - -Shungnak - - x - -
Kotzebue Kotzebue - - - - -
North Slope North Slope Villages
Anaktuvuk Pass - x - x -Atqasuk - x - x -Kaktovik - x - x xNuiqsut - - - - xPoint Hope - x - - xPoint Lay - x - - -Wainwright - x - x x
Barrow Barrow - x - x x
Interior Alaska Mid Yukon–Upper Kuskokwim
Anvik x x x - --continued-
Appendix A.–Page 5 of 7.

70
RegionSubregion
Village 2004 2005 2006 2007 2008Grayling - x x - -Holy Cross x x x - -Lake Minchumina x - x - -McGrath - - - - -Nikolai x x x - -Shageluk - x - - -Takotna - x - - -Tanana - - - - -
Yukon–Koyukuk Alatna x - x x xBettles–Evansville - - x - -Coldfoot - - - - -Galena x - - - -Hughes x - - - -Huslia x - - - -Kaltag x - - - -Koyukuk x x - - -Nulato x x - - -Ruby x x - - -Wiseman - - - - -Allakaket x - x x x
Upper Yukon Arctic Village - - x - -Beaver - - x x -Birch Creek - - - x -Central - - x - -Chalkyitsik - - x x -Circle - - x x -Fort Yukon x - x x -Rampart - - - - -Stevens Village - - - - -Venetie - - x x -
Tanana Villages Dot Lake x - - - -Eagle Village x - - - -
-continued-
Appendix A.–Page 6 of 7.

71
RegionSubregion
Village 2004 2005 2006 2007 2008Eagle City - - - - -Healy Lake - - - - -Manley Hot Springs x - - - -Minto - - x - -Nenana x - x - -Northway x - - - -Tanacross - - x - -Tetlin - - - - -Dry Creek - - - - -
TokTok - - x - -
Upper Copper River Upper Copper River
Cantwell - - - x -Cheesh’na (Chistochina) x - - x -Chitina x - - - -Copper Center x - - x -Gakona x - - x -Gulkana x - - x -Mentasta Lake x - - x -Tazlina - - - - -
Southeast Alaska Southeast Alaska
Craiga - - - - -Hoonaha - - - - -Hydaburga - - - - -Yakutatb - - - - -
Source Survey results for 2004–2007 were reported in Naves (2010). a. Villages eligible to harvest only the eggs of glaucous-winged gulls. b. Village eligible to harvest only the eggs of glaucous-winged gulls, Aleutian terns, and Arctic terns.
Appendix A.–Page 7 of 7.
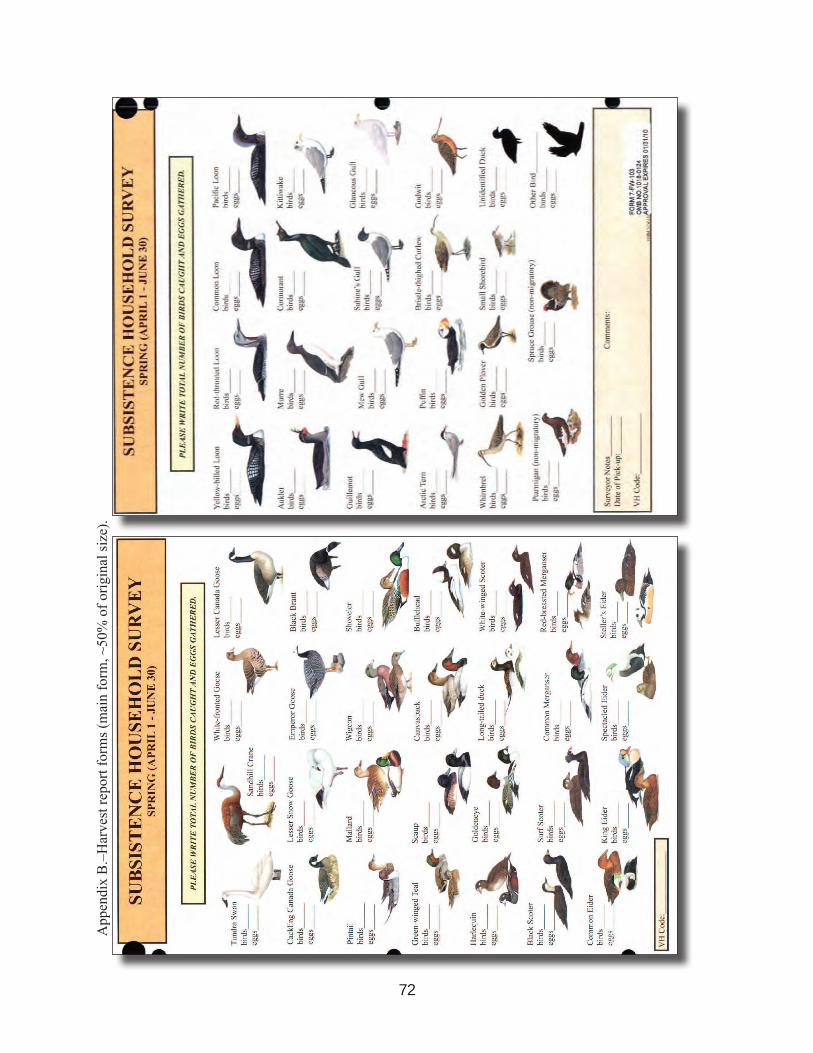
72
App
endi
x B
.–H
arve
st re
port
form
s (m
ain
form
, ~50
% o
f orig
inal
size
).
APPenDix B.–HArveSt rePort forMS (MAin forM, ~50% of originAl Size).

73
App
endi
x B
.–Pa
ge 2
of 3
.

74
App
endi
x B
.–Pa
ge 3
of 3
.

75
App
endi
x C
.–Sp
ecie
s rep
rese
nted
in th
e 3
vers
ions
of t
he h
arve
st re
port
form
and
thei
r dis
tribu
tion
rang
e in
Ala
ska.
Sout
hern
Coa
stal
Ala
ska
form
Mai
n fo
rmIn
terio
r Ala
ska
form
Spec
ies c
ateg
ory
Spec
iesa
Gul
f of
Ala
ska–
Coo
k In
let
Kod
iak
Arc
hipe
lago
Ale
utia
n–Pr
ibilo
f Is
land
s
Sout
h A
lask
a Pe
nins
ulab
Bris
tol
Bay
Yuko
n–K
usko
kwim
D
elta
Ber
ing
Stra
it–N
orto
n So
und
Nor
th-
wes
t A
rctic
Nor
th
Slop
eIn
terio
r
Upp
er
Cop
per
Riv
erD
ucks
Am
eric
an w
igeo
n An
as a
mer
ican
ax
xx
xx
xx
xx
xx
Gre
en-w
inge
d te
al A
. cre
cca
(1),
Blu
e-w
inge
d te
al A
. dis
cors
(2)
x(1
, 2)
x(1
, 2)
x (1)
x (1)
x (1)
x (1)
x (1)
x (1)
x (1)
x(1
, 2)
x(1
, 2)
Mal
lard
A. p
laty
rhyn
chos
xx
xx
xx
xx
xx
xN
orth
ern
pint
ail A
. acu
tax
xx
xx
xx
xx
xx
Nor
ther
n sh
ovel
er A
. cly
peat
ax
xx
xx
xx
xx
xx
Bla
ck sc
oter
Mel
anitt
a ni
gra
xx
xx
xx
xx
xx
xSu
rf sc
oter
M. p
ersp
icill
ata
xx
xx
xx
xx
xx
xW
hite
-win
ged
scot
er M
. fus
cax
xx
xx
xx
xx
xx
Buf
flehe
ad B
ucep
hala
alb
eola
xx
xx
xx
xx
x (-
)x
xG
olde
neye
C
omm
on g
olde
neye
B. c
lang
ula
(1),
Bar
row
’s g
onde
neye
B. i
slan
dica
(2)
x(1
, 2)
x(1
, 2)
x(1
, 2)
x(1
, 2)
x(1
, 2)
x(1
, 2)
x (1)
x (1)
x (-
)x
(1, 2
)x
(1, 2
)
Can
vasb
ack
Ayth
ya v
alis
iner
iax
xx
xx
xx
xx
(-)
xx
Scau
p G
reat
er sc
aup
A. m
arila
(1),
Less
er sc
aup
A. a
ffini
s (2)
x(1
, 2)
x(1
, 2)
x(1
, 2)
x(1
, 2)
x(1
, 2)
x(1
, 2)
x(1
, 2)
x(1
, 2)
x (1)
x(1
, 2)
x(1
, 2)
Com
mon
eid
er S
omat
eria
mol
lissi
ma
xx
xx
xx
xx
x-
-K
ing
eide
r S. s
pect
abili
sx
xx
xx
xx
xx
--
Spec
tacl
ed e
ider
S. fi
sche
ri*
x (-
)x
(-)
x (-
)x
(-)
xx
xx
x-
-St
elle
r’s e
ider
Pol
ystic
ta st
elle
ri*
xx
xx
xx
xx
x-
-H
arle
quin
duc
k H
istr
ioni
cus h
istr
ioni
cus
xx
xx
xx
xx
x (-
)x
xLo
ng-ta
iled
duck
Cla
ngul
a hy
emal
isx
xx
xx
xx
xx
xx
Com
mon
mer
gans
er M
ergu
s mer
gans
erx
xx
xx
xx
xx
(-)
xx
Red
-bre
aste
d m
erga
nser
M. s
erra
tor
xx
xx
xx
xx
xx
xD
uck
(uni
dent
ified
)x
xx
xx
xx
xx
xx
Gee
seB
lack
bra
nt B
rant
a be
rnic
lax
xx
xx
xx
xx
x (-
)x
(-)
Cac
klin
g C
anad
a go
ose
Cac
klin
g go
ose
Bran
ta h
utch
insi
i min
ima
(1),
Ale
utia
n ca
cklin
g go
ose
B. h
. leu
copa
reia
(2),
Tave
rner
’s c
ackl
ing
goos
e B.
h. t
aver
neri
(3)
x (1
, 2, 3
)x (2)
x (2)
x(1
?, 3
)x
(1, 2
)x
(1, 3
)x (3)
x (3)
x (3)
- (3)
-
-con
tinue
d-
APPenDix C.–SPeCieS rePreSenteD in tHe 3 verSionS of tHe HArveSt rePort forM AnD tHeir DiStriBution rAnge in AlASkA.

76
Sout
hern
Coa
stal
Ala
ska
form
Mai
n fo
rmIn
terio
r Ala
ska
form
Spec
ies c
ateg
ory
Spec
iesa
Gul
f of
Ala
ska–
Coo
k In
let
Kod
iak
Arc
hipe
lago
Ale
utia
n–Pr
ibilo
f Is
land
s
Sout
h A
lask
a Pe
nins
ulab
Bris
tol
Bay
Yuko
n–K
usko
kwim
D
elta
Ber
ing
Stra
it–N
orto
n So
und
Nor
th-
wes
t A
rctic
Nor
th
Slop
eIn
terio
r
Upp
er
Cop
per
Riv
erLe
sser
Can
ada
goos
e Br
anta
can
aden
sis p
arvi
pes
(1),
Dus
ky C
anad
a go
ose
B. c
. occ
iden
talis
(2)
x(1
, 2)
x (-
)x
(-)
x (1?)
x (-
)x (1)
x (-
)x
(-)
x (-
)x (1)
x (1)
Whi
te-f
ront
ed g
oose
Ans
er a
lbifr
ons
xx
xx
xx
xx
xx
xEm
pero
r goo
se C
hen
cana
gica
*x
xx
xx
xx
xx
(-)
--
Less
er sn
ow g
oose
C. c
aeru
lesc
ens
xx
xx
xx
xx
xx
xSw
ans
Tund
ra sw
an C
ygnu
s col
umbi
anus
(1),
Trum
pete
r sw
an C
. buc
cina
tor*
(2)
x(1
, 2)
x (1)
x (1)
x (1)
x (1)
x (1)
x (1)
x (1)
x (1)
x(1
, 2)
x(1
, 2)
Cra
nes
Sand
hill
cran
e G
rus c
anad
ensi
sx
xx
xx
xx
xx
xx
Gro
use
Spru
ce g
rous
e Fa
lcip
enni
s can
aden
sis
--
--
xx
xx
x-
-G
rous
e (u
nide
ntifi
ed)
Spru
ce g
rous
e F.
can
aden
sis (
1),
Ruf
fed
grou
se B
onas
a um
bellu
s (2)
, Sh
arp-
taile
d gr
ouse
Tym
panu
chus
pha
sian
ellu
s (3
)
-(1
, 2)
--
--
--
--
x(1
, 2, 3
)x
(1, 2
, 3)
Ptar
mig
an
Will
ow p
tarm
igan
Lag
opus
lago
pus (
1),
Roc
k pt
arm
igan
L. m
uta
(2),
Whi
te-ta
iled
ptar
mig
an L
. leu
cura
(3)
x(1
, 2, 3
)x
(1, 2
)x
(1, 2
)x
(1, 2
)x
(1, 2
)x
(1, 2
)x
(1, 2
)x
(1, 2
)x
(1, 2
)x
(1, 2
, 3)
x(1
, 2, 3
)
Seab
irds
Cor
mor
ant
Pela
gic
corm
oran
t Pha
lacr
ocor
ax p
elag
icus
(1),
Dou
ble-
cres
ted
corm
orna
t P. a
uritu
s (2)
, R
ed-f
aced
cor
mor
ant P
. uri
le*
(3)
x(1
, 2, 3
)x
(1, 2
, 3)
x(1
, 2, 3
)x
(1, 2
, 3)
x(1
, 2, 3
)x
(1, 3
)x (1
)x (1
)x (-)
--
Arc
tic te
rn S
tern
a pa
radi
sea
(1),
Ale
utia
n te
rn S
. ale
utic
a (2
)x (1
)x
(1, 2
)x
(1, 2
)x
(1, 2
)x
(1, 2
)x
(1, 2
)x
(1, 2
)x
(1, 2
)x (1
)x (1
)x (1
)B
lack
-legg
ed k
ittiw
ake
Riss
a tr
idac
tyla
xx
xx
--
--
--
-R
ed-le
gged
kitt
iwak
e R.
bre
viro
stri
sx
xx
x-
--
--
--
Kitt
iwak
e R.
trid
acty
la
--
--
xx
xx
x (-
)-
-Sa
bine
’s g
ull X
ema
sabi
ni (1
), B
onap
arte
’s g
ull L
arus
phi
lade
lphi
a (2
)x
(1, 2
)x
(1, 2
)x
(1, 2
)x
(1, 2
)x
(1, 2
)x
(1, 2
)x (1
)x (1
)x (1
)- (
2)- (
2)
-con
tinue
d-
App
endi
x C
.–Pa
ge 2
of 5
.

77
Sout
hern
Coa
stal
Ala
ska
form
Mai
n fo
rmIn
terio
r Ala
ska
form
Spec
ies c
ateg
ory
Spec
iesa
Gul
f of
Ala
ska–
Coo
k In
let
Kod
iak
Arc
hipe
lago
Ale
utia
n–Pr
ibilo
f Is
land
s
Sout
h A
lask
a Pe
nins
ulab
Bris
tol
Bay
Yuko
n–K
usko
kwim
D
elta
Ber
ing
Stra
it–N
orto
n So
und
Nor
th-
wes
t A
rctic
Nor
th
Slop
eIn
terio
r
Upp
er
Cop
per
Riv
erM
ew g
ull L
arus
can
us- (
x)- (
x)-
-x
xx
xx
(-)
xx
Gla
ucou
s-w
inge
d gu
ll L.
gla
uces
cens
xx
xx
- (x)
--
--
--
Gla
ucou
s gul
l L. h
yper
bore
us-
--
-x
xx
xx
x (-
)x
(-)
Her
ring
gull
L. a
rgen
tatu
sx
xx
x-
-- (
x)-
-x
xA
ukle
t C
assi
n’s a
ukle
t Pty
chor
amph
us a
leut
icus
(1),
Cres
ted
aukl
et A
ethi
a cr
istat
ella
(2),
Leas
t auk
let A
. pus
illa
(3),
Para
keet
aukl
et A
. psit
tacu
la (4
), W
hisk
ered
aukl
et A
. pyg
mae
a (5
), Rh
inoc
eros
aukl
et C
eror
hinc
a m
onoc
erat
a (6
)
x(1
, 2, 3
, 4,
6)
x(1
, 2, 3
, 4, 6
)x
(1, 2
, 3, 4
, 5,
6)
x(1
, 2, 3
, 4,
5, 6
)
x(1
, 2, 3
, 4,
6)
x(2
, 3, 4
, 6)
x(2
, 3, 4
, 6)
x(2
, 3,
4, 6
)
x (-
)-
-
Mur
re
Com
mon
mur
re U
ria
aalg
e (1
), Th
ick-
bille
d m
urre
U. l
omvi
a (2
)
x(1
, 2)
x(1
, 2)
x(1
, 2)
x(1
, 2)
x(1
, 2)
x(1
, 2)
x(1
, 2)
x(1
, 2)
x(1
, 2)
--
Gui
llem
ot
Pige
on g
uille
mot
Cep
hus C
olum
ba (1
), B
lack
gui
llem
ot C
. gri
lle (2
)
x (1)
x (1)
x (1)
x (1)
x (1)
x (1)
x (1)
x(1
, 2)
x (2)
--
Puffi
n Tu
fted
puffi
n F.
cir
rhat
a (1
), H
orne
d pu
ffin
Frat
ercu
la c
orni
cula
ta (2
)
x(1
, 2)
x(1
, 2)
x(1
, 2)
x(1
, 2)
x(1
, 2)
x(1
, 2)
x(1
, 2)
x(1
, 2)
x (-
)-
-
Shor
ebir
dsB
lack
oys
terc
atch
er H
aem
atop
us b
achm
ani
xx
xx
--
--
--
-W
him
brel
Num
eniu
s pha
eopu
s*- (
x)-
-- (
x)x
xx
xx
xx
Bris
tle-th
ighe
d cu
rlew
N. t
ahiti
ensi
s*x
(-)
xx
(-)
x (-
)x
(-)
xx
x (-
)x
(-)
--
God
wit
Bar
-taile
d go
dwit
Lim
osa
lapp
onic
a (1
), H
udso
nian
god
wit
L. h
aem
astic
a* (2
), M
arbl
ed g
odw
it L.
fedo
a* (3
)
x (2)
x (-
)x
(-)
x (1)
x(1
, 2, 3
)x
(1, 2
)x
(1, 2
)x
(1, 2
)x (1
)x (2
)x (-)
Gol
den
plov
er
Am
eric
an g
olde
n pl
over
Plu
vial
is d
omin
ica*
(1
), Pa
cific
gol
den
plov
er P
. squ
atar
ola*
(2),
Bla
ck-b
ellie
d pl
over
P. f
ulva
(3)
x(1
, 2, 3
)x
(1, 2
, 3)
x(1
, 2, 3
)x
(1, 2
, 3)
x(1
, 2, 3
)x
(1, 2
, 3)
x(1
, 2, 3
)x
(1, 2
, 3)
x(1
, 3)
x(1
, 2, 3
)x
(1, 2
, 3)
-con
tinue
d-
App
endi
x C
.–Pa
ge 3
of 5
.

78
Sout
hern
Coa
stal
Ala
ska
form
Mai
n fo
rmIn
terio
r Ala
ska
form
Spec
ies c
ateg
ory
Spec
iesa
Gul
f of
Ala
ska–
Coo
k In
let
Kod
iak
Arc
hipe
lago
Ale
utia
n–Pr
ibilo
f Is
land
s
Sout
h A
lask
a Pe
nins
ulab
Bris
tol
Bay
Yuko
n–K
usko
kwim
D
elta
Ber
ing
Stra
it–N
orto
n So
und
Nor
th-
wes
t A
rctic
Nor
th
Slop
eIn
terio
r
Upp
er
Cop
per
Riv
erSm
all s
hore
bird
D
unlin
Cal
idri
s alp
ina
(1),
Pect
oral
San
dpip
er C
. mel
anot
os*
(2),
Roc
k Sa
ndpi
per C
. ptil
ocne
mis
* (3
), W
este
rn S
andp
iper
C. m
auri
(4),
Sem
ipal
mat
ed S
andp
iper
C. p
usill
a (5
), Le
ast S
andp
iper
C. m
inut
illa
(6),
Bai
rd’s
San
dpip
er C
. bai
rdii
(7),
Whi
te-r
umpe
d Sa
ndpi
per C
. fus
cico
llis*
(8),
Stilt
San
dpip
er C
. him
anto
pus*
(9),
Red
-nec
ked
Stin
t C. r
ufico
llis*
(10)
, Sa
nder
ling
C. a
lba*
(12)
, Sh
arp-
taile
d Sa
ndpi
per C
. acu
min
ata
(13)
, Se
mip
alm
ated
Plo
ver C
hara
driu
s se
mip
alm
atus
* (1
4),
Less
er Y
ello
wle
gs T
ring
a fla
vipe
s (15
), G
reat
er Y
ello
wle
gs T
. mel
anol
euca
(16)
, So
litar
y Sa
ndpi
per T
. sol
itari
a* (1
7),
Spot
ted
Sand
pipe
r Act
itis m
acul
aria
(18)
, R
uddy
Tur
nsto
ne A
rena
ria
inte
rpre
s (19
), B
lack
Tur
nsto
ne A
. mel
anoc
epha
la*
(20)
, Su
rfbi
rd A
phir
za v
irgat
a* (2
1),
Wan
derin
g Ta
tler H
eter
osce
lus i
ncan
us*
(22)
, U
plan
d Sa
ndpi
per B
artr
amia
long
icau
da*
(23)
, B
uff-
brea
sted
San
dpip
er
Tr
yngi
tes s
ubru
ficol
is*
(24)
, Sh
ort-b
illed
Dow
itche
r
Lim
nodr
omus
dri
seus
* (2
5),
Long
-bill
ed D
owitc
her L
. sco
lopa
ceus
(26)
, W
ilson
’s S
nipe
Gal
linag
o de
licat
a (2
7),
Red
-nec
ked
Phal
arop
e Ph
alar
opus
loba
tus (
28),
Red
Pha
laro
pe P
. ful
icar
ia (2
9)
x(1
, 2, 3
, 4,
5, 6
, 7,
12, 1
4,
15, 1
6,
17, 1
8,
20, 2
1,
22, 2
5,
26, 2
7,
28)
x(1
, 2, 3
, 4, 5
, 6,
7, 1
2, 1
4,
15, 1
6, 1
7, 1
8,
19, 2
0, 2
1, 2
2,
25, 2
6, 2
7, 2
8,
29)
x(1
, 3, 4
, 6,
7, 1
2, 1
4,
18, 1
9,
22, 2
6,
27, 2
8,
29)
x(1
, 2, 3
, 4,
5, 6
, 7, 1
2,
14, 1
5, 1
6,
17, 1
8, 1
9,
20, 2
1, 2
2,
25, 2
6, 2
7,
28, 2
9)
x(1
, 2, 3
, 4,
5, 6
, 7,
12,
14
, 15,
16
, 17,
18
, 19,
20
, 21,
22
, 25,
26
, 27,
28
, 29)
x(1
, 2, 3
, 4, 5
, 6,
7, 1
2, 1
3,
14, 1
5, 1
6, 1
7,
18, 1
9, 2
0, 2
1,
22, 2
5, 2
6, 2
7,
28, 2
9)
x(1
, 2, 3
, 4,
5, 6
, 7, 1
2,
13, 1
4, 1
5,
16, 1
7, 1
8,
19, 2
0, 2
1,
22, 2
5, 2
6,
27, 2
8, 2
9)
x(1
, 2, 3
, 4,
5, 6
, 7,
12,
13
, 14,
15
, 16,
17
, 18,
19
, 20,
21
, 22,
25
, 26,
27
, 28,
29
)
x(1
, 2, 4
, 5,
6, 7
, 8,
9, 1
0, 1
2,
13, 1
4,
15, 1
8,
19, 2
0,
21, 2
2,
23, 2
4,
26, 2
7,
28, 2
9)
x(1
, 2, 3
, 4,
5, 6
, 7, 1
2,
14, 1
5, 1
6,
17, 1
8, 2
1,
22, 2
3, 2
5,
26, 2
7, 2
8,
19)
x(1
, 2, 3
, 4,
5, 6
, 7, 1
2,
14, 1
5, 1
6,
17, 1
8, 2
1,
22, 2
3, 2
5,
26, 2
7, 2
8,
19)
Gre
bes a
nd L
oons
Com
mon
loon
Gav
ia im
mer
xx
xx
xx
xx
x (-
)x
xPa
cific
loon
G. p
acifi
ca (1
), A
rctic
loon
G. a
rctic
a (2
)x (1
)x (1
)x (1
)x (1
)x (1
)x
(1, 2
)x
(1, 2
)x
(1, 2
)x
(1, 2
)x (1
)x (1
)R
ed-th
roat
ed lo
on G
. ste
llata
xx
xx
xx
xx
xx
xYe
llow
-bill
ed lo
on G
. ada
msi
i*x
xx
xx
xx
xx
--
-con
tinue
d-
App
endi
x C
.–Pa
ge 4
of 5
.

79
Sout
hern
Coa
stal
Ala
ska
form
Mai
n fo
rmIn
terio
r Ala
ska
form
Spec
ies c
ateg
ory
Spec
iesa
Gul
f of
Ala
ska–
Coo
k In
let
Kod
iak
Arc
hipe
lago
Ale
utia
n–Pr
ibilo
f Is
land
s
Sout
h A
lask
a Pe
nins
ulab
Bris
tol
Bay
Yuko
n–K
usko
kwim
D
elta
Ber
ing
Stra
it–N
orto
n So
und
Nor
th-
wes
t A
rctic
Nor
th
Slop
eIn
terio
r
Upp
er
Cop
per
Riv
erR
ed-n
ecke
d gr
ebe
Podi
ceps
gri
sean
a (1
), H
orne
d gr
ebe
P. a
uritu
s (2)
-(1
, 2)
-(1
, 2)
-(1
, 2)
-(1
, 2)
-(1
, 2)
-(1
, 2)
-(1
, 2)
-(1
, 2)
-x
(1, 2
)x
(1, 2
)O
ther
–Unk
now
n B
ird
xx
xx
xx
xx
xx
x
So
urce
s Fo
r inf
orm
atio
n on
dis
tribu
tion
rang
e of
spec
ies:
Ban
ks e
t al.
(200
4), J
ohns
on a
nd H
erte
r (19
89),
Nat
iona
l Geo
grap
hic
Soci
ety
(199
9), T
he B
irds o
f Nor
th A
mer
ica
Serie
s, Se
a D
uck
Join
t Ven
ture
(200
3–20
05),
Den
linge
r (20
06),
John
son
et a
l. (2
007)
, Ala
ska
Shor
ebird
Gro
up (2
008)
, Bow
man
(200
8), P
earc
e et
al.
(200
0), S
ible
y G
uide
s (20
04),
Tim
m e
t al.
(’’19
94),
War
ren
(200
6), P
acifi
c Fl
yway
Cou
ncil
(201
0 un
publ
ishe
d), R
icha
rd L
anct
ot (U
SFW
S, P
ers.
Com
mun
icat
ion)
, Eric
Ta
ylor
(USF
WS,
Per
s. C
omm
unic
atio
n), D
onna
Dew
hurs
t (U
SFW
S, P
ers.
Com
mun
icat
ion)
, Dav
is Ir
ons (
USF
WS,
Per
s. C
omm
unic
atio
n), C
hris
Dau
(USF
WS,
Per
s. C
omm
unic
atio
n), D
anie
l Ros
enbe
rg (A
DF&
G, P
ers.
Com
mun
icat
ion)
.
a.
If m
ore
than
one
spec
ies i
s lis
ted,
the
first
spec
ies i
s the
one
nam
ed o
n th
e ha
rves
t sur
vey
form
.
b.
Sout
h A
lask
a Pe
nins
ula
is a
subr
egio
n of
the
Bris
tol B
ay re
gion
; mos
t of t
he B
risto
l Bay
regi
on is
surv
eyed
with
th
e M
ain
Form
, but
the
Sout
h A
lask
a Pe
nins
ula
is su
rvey
ed w
ith th
e So
uthe
rn C
oast
al A
lask
a fo
rm.
x
The
spec
ies i
s rep
rese
nted
in th
e ha
rves
t rep
ort f
orm
use
d in
the
regi
on. N
umbe
rs in
par
enth
esis
in
dica
te th
e sp
ecie
s or t
he c
ompo
sitio
n of
spec
ies l
ikel
y to
occ
ur in
eac
h re
gion
.
- Th
e sp
ecie
s is n
ot re
pres
ente
d in
the
harv
est r
epor
t for
m u
sed
in th
e re
gion
.
x (-
) Th
e sp
ecie
s is r
epre
sent
ed in
the
harv
est r
epor
t for
m b
ut it
is u
nlik
e to
occ
ur in
the
regi
on.
- (
x)
The
spec
ies i
s not
repr
esen
ted
in th
e ha
rves
t rep
ort f
orm
but
like
ly o
ccur
s in
the
regi
on.
*
Spec
ies c
lose
d to
har
vest
of b
irds o
r egg
s, at
leas
t in
certa
in m
anag
emen
t uni
ts.
App
endi
x C
.–Pa
ge 5
of 5
.
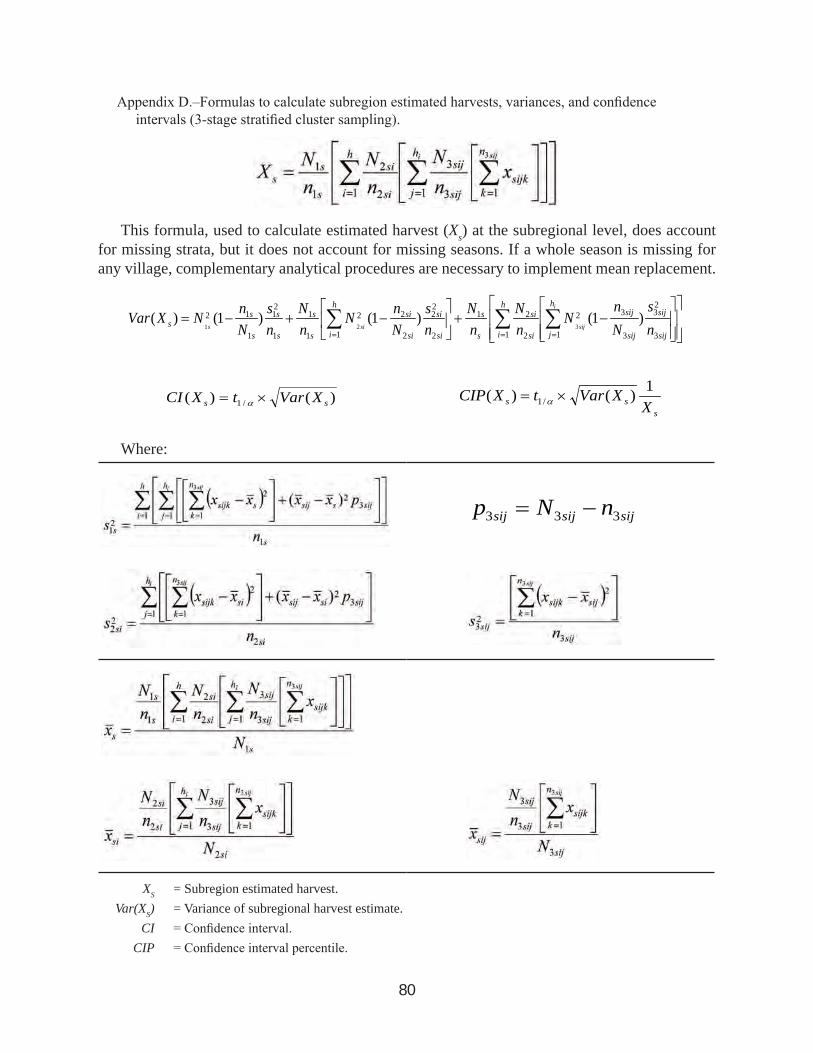
80
Appendix D.–Formulas to calculate subregion estimated harvests, variances, and confidence intervals (3-stage stratified cluster sampling).
This formula, used to calculate estimated harvest (Xs) at the subregional level, does account for missing strata, but it does not account for missing seasons. If a whole season is missing for any village, complementary analytical procedures are necessary to implement mean replacement.
−+
−+−= ∑∑∑
===
i
sijsis
h
j sij
sij
sij
sijh
i si
si
s
sh
i si
si
si
si
s
s
s
s
s
ss n
sNn
NnN
nN
ns
NnN
nN
ns
NnNXVar
1 3
23
3
32
1 2
21
1 2
22
2
22
1
1
1
21
1
12 )1()1()1()(321
)()( /1 ss XVartXCI ×= αs
ss XXVartXCIP 1)()( /1 ×= α
Where:
sijsijsij nNp 333 −=
XS = Subregion estimated harvest. Var(XS) = Variance of subregional harvest estimate. CI = Confidence interval. CIP = Confidence interval percentile.
APPenDix D.–forMulAS to CAlCulAte SuBregion eStiMAteD HArveStS, vAriAnCeS, AnD ConfiDenCe intervAlS (3-StAge StrAtifieD CluSter SAMPling).

81
s = Subscript that denotes first-stage units (subregion). i = Subscript that denotes second-stage units (sampled strata, or harvest level). j = Subscript that denotes third-stage unit (sampled strata). k = Subscript that denotes households. h = Total number of villages sampled in a subregion. hi = Total number of strata sampled in the village. N1s = Total number of households in subregion s. n1s = Total number of households in sampled villages in subregion s. N2s = Total number of households in all strata of a village in subregion s. n2s = Total number of households in sampled strata of a village in subregion s. N3s = Total number of households in each stratum of a village in subregion s. n3s = Number of households sampled in each stratum of a village in subregion s. xsijk = Individual household reported harvest. s1
2 = First-stage sample variance. s2
2 = Second-stage sample variance. s3
2 = Third-stage sample variance. = Weighted household harvest mean.
= mean household harvest at subregional level.
= mean household harvest at village level.
= mean household harvest at harvest level. P3sij = Factor to account for variance of non-sampled households
for which a mean harvest was applied. = Student’s t distribution value with tail area probability α. Note The term “N2si/n2s” accounts for missing stratum at the village level; this term
equals 1 if all strata in the village have been surveyed. For instance:
None Low High
Total households 20 40 20 N2si = 80
Sampled households 0 20 20 n2si = 60
Appendix D.–Page 2 of 2.

82
Appendix E.–Formulas to calculate region estimated harvests, variances, and confidence intervals (4-stage stratified cluster sampling).
Note: This formula, used to calculate estimated harvest (Xr) at the regional level, does account for missing strata, but it does not account for missing seasons. If a whole season is missing for any village, complementary analytical procedures are necessary to implement mean replacement.
Where:
rsijrsijrsij nNp 444 −=
APPenDix e.–forMulAS to CAlCulAte region eStiMAteD HArveStS, vAriAnCeS, AnD ConfiDenCe intervAlS (4-StAge StrAtifieD CluSter SAMPling).
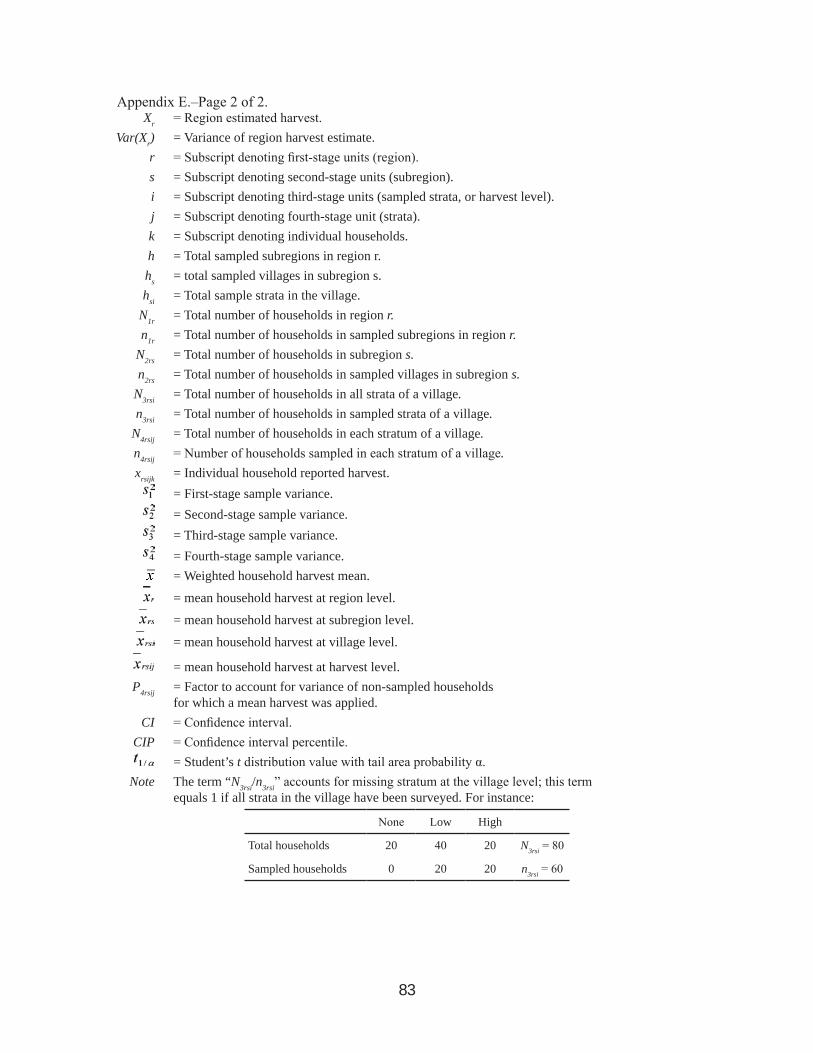
83
Xr = Region estimated harvest. Var(Xr) = Variance of region harvest estimate. r = Subscript denoting first-stage units (region). s = Subscript denoting second-stage units (subregion). i = Subscript denoting third-stage units (sampled strata, or harvest level). j = Subscript denoting fourth-stage unit (strata). k = Subscript denoting individual households. h = Total sampled subregions in region r. hs = total sampled villages in subregion s. hsi = Total sample strata in the village. N1r = Total number of households in region r. n1r = Total number of households in sampled subregions in region r. N2rs = Total number of households in subregion s. n2rs = Total number of households in sampled villages in subregion s. N3rsi = Total number of households in all strata of a village. n3rsi = Total number of households in sampled strata of a village. N4rsij = Total number of households in each stratum of a village. n4rsij = Number of households sampled in each stratum of a village. xrsijk = Individual household reported harvest. = First-stage sample variance. = Second-stage sample variance. = Third-stage sample variance. = Fourth-stage sample variance. = Weighted household harvest mean.
= mean household harvest at region level.
= mean household harvest at subregion level.
= mean household harvest at village level.
= mean household harvest at harvest level. P4rsij = Factor to account for variance of non-sampled households
for which a mean harvest was applied. CI = Confidence interval. CIP = Confidence interval percentile. = Student’s t distribution value with tail area probability α. Note The term “N3rsi/n3rsi” accounts for missing stratum at the village level; this term
equals 1 if all strata in the village have been surveyed. For instance:
None Low High
Total households 20 40 20 N3rsi = 80
Sampled households 0 20 20 n3rsi = 60
Appendix E.–Page 2 of 2.


