
1
Air-Sea Fluxes Over the Gulf Stream Region: Atmospheric Controls and Trends
Jeffrey Shaman, R. M. Samelson, Eric Skyllingstad
College of Oceanic and Atmospheric Sciences, Oregon State University
2
Abstract
The intraseasonal variability of turbulent surface heat fluxes over the Gulf Stream
Extension and Subtropical Mode Water regions of the North Atlantic, and long-term
trends in these fluxes, are explored using NCEP-NCAR reanalysis. Wintertime sensible
and latent heat fluxes from these surface waters are characterized by episodic high flux
events due to cold air outbreaks from North America. Up to 60% of the November-March
(NDJFM) total sensible heat flux and 45% of latent heat flux occurs on these high flux
days. On average 41% (34%) of the total NDJFM sensible (latent) heat flux takes place
during just 17% (20%) of the days. Over the last 60 years, seasonal NDJFM sensible and
latent heat fluxes over the CLIMODE region have increased, due to an increased number
of high flux event days. The increased storm frequency has altered average wintertime
temperature conditions in the region producing colder surface air conditions over the
North American eastern seaboard and Labrador Sea and warmer temperatures over the
Sargasso Sea. These temperature changes have increased low-level vertical wind shear
and baroclinicity along the North Atlantic storm track over the last 60 years and may
further favor the trend of increasing storm frequency over the Gulf Stream Extension and
adjacent region.
3
1. Introduction
The largest wintertime heat fluxes from the ocean to the atmosphere in the North
Atlantic occur in the region of the Gulf Stream extension and the adjacent waters of the
northwestern portion of the subtropical gyre (Esbensen and Kushnir, 1981; Josey et al.,
1999). These heat fluxes are supported in the ocean by advective heat convergence in the
Gulf Stream and by seasonal heat storage in the surrounding waters, especially the
subtropical mode water to the south and east of the Gulf Stream. The subtropical mode
water (STMW), or 18°C water, which dominates the upper water column in the
northwestern Sargasso Sea, is defined by its relatively homogeneous temperature and
salinity, and may extend to depths of 500 m or more (Worthington, 1959; Marshall et al.,
2009). Its vertical homogeneity and consequent weak static stability, which arise from
large-scale constraints on the gyre circulation (Dewar et al., 2005), allow the deep
penetration of convective vertical exchange in response to wintertime surface cooling
events, effectively coupling lower-atmosphere thermodynamic processes to an unusually
deep column of ocean water.
The STMW column outcrops in boreal winter along the southern edge of the Gulf
Stream in response to these cooling events, which remove a seasonal warm water cap.
The temperature and salinity characteristics of STMW are set during this winter season,
when air-sea heat fluxes in the STMW region and the adjacent Gulf Stream are large.
The re-emergence of mode water along the Gulf Stream outcrop each winter is a
potentially important source of seasonal-to-interannual memory within the climate
system. Mode waters possessing temperature and salinity characteristics set during one
4
winter may interact with and influence atmospheric conditions during the next, or a later,
winter (Alexander and Deser, 1995).
The ocean-atmosphere interactions associated with the wintertime mode-water
outcrop in the North Atlantic have been examined at a range of times scales. Studies
include examinations of STMW decadal variability and its relation to the North Atlantic
Oscillation (NAO) (Talley, 1996; Joyce et al., 2000), the influences of the atmospheric
circulation on turbulent heat fluxes at monthly (Cayan 1992) and weekly time scales
(Deser and Timlin, 1997), and more recent investigation of the effect of synoptic scale
variability on these heat fluxes (Zolina and Gulev, 2003).
Interannual variations in heat advection by the Gulf Stream, and the large
wintertime air-sea fluxes that the heat advection supports, provide a second potentially
important regional influence on the mid-latitude atmosphere, as well as on the properties
of North Atlantic mode water; this is true also of other western boundary currents in other
ocean basins (Kelly et al. 2009). Not only does North Atlantic mode water outcrop and
form along the southern edge of the Gulf Stream, but the strong SST gradient across the
Gulf Stream creates low-level baroclinicity in the troposphere that anchors storm activity
along the SST front (Inatsu et al., 2003; Nakamura et al., 2004, 2008; Brayshaw et al.,
2008). These wintertime storms along the Gulf Stream bring cold air across the SST
front and elevate surface heat fluxes, contributing to mode water formation.
In general, colder average winter air temperatures produce higher wintertime heat
fluxes from the ocean to atmosphere that in part drive mode water formation; however,
previous studies indicate that synoptic variability creates large changes in air-sea heat
fluxes over Western Boundary Currents (Alexander and Scott, 1997; Zolina and Gulev,
5
2003; Bond and Cronin, 2008), including the Gulf Stream. Consequently, wintertime
synoptic variability should be associated with extreme heat flux levels. In essence, the
high wintertime heat fluxes in the vicinity of the Gulf Stream extension are generated by
the interaction of the more temporally uniform yet spatially heterogeneous ocean surface
with the more spatially uniform yet temporally variable atmosphere.
One question we seek to determine in this study is the proportion of total seasonal
sensible and latent heat fluxes in the Gulf Stream extension and STMW outcrop region
that is due to synoptic events, in particular cold air outbreaks. We hypothesize that
synoptic storms are responsible for a large fraction of total seasonal heat fluxes in the
Gulf Stream region and that these storms produce synoptic-scale variations of surface
turbulent fluxes. We Similar synoptic-scale air-sea interactions have been demonstrated
for the Southern Ocean (Patoux et al., 2009; Yuan et al. 2009). If discrete events are
indeed associated with a large share of the seasonal heat flux in the Gulf Stream region
then further understanding of the weather systems associated with these events, their
frequency and any trends in their occurrence is needed.
Here we quantify the synoptic contribution to total November-March surface
sensible and latent heat fluxes in the North Atlantic Gulf Stream extension and STMW
outcrop region. We examine the tropospheric structure associated with high daily
wintertime heat fluxes in this region. Trends in the 1948-2007 NCEP-NCAR reanalysis
record are then described. Changes in storm activity and low-level baroclinicity in the
region are examined as well.
Section 2 describes the data used for this analysis. Section 3 categorizes the daily
reanalysis record based on surface turbulent flux levels and quantifies the fraction of total

6
seasonal air-sea heat exchange over Gulf Stream extension and STMW outcrop region
associated with high heat flux days. Section 4 then examines the tropospheric structure
and synoptic characteristics associated with these high heat flux days. Trends in the
reanalysis record of synoptic activity for the study region are then described in Section 5.
Discussion is provided in Section 6.
2. Data
This study is part of the CLIMODE project (Marshall et al., 2009) for studying
ocean-atmosphere interaction in the Gulf Stream and North Atlantic STMW region. The
associated region of interest (the “CLIMODE region”) is here defined as 30-42°N and
70-50°W. Analyses were performed using 1948-2008 daily and 1949-2008 monthly
2.5°x2.5° NCEP-NCAR reanalysis (Kalnay et al., 1996). Measures include surface
sensible and latent heat fluxes, surface and tropospheric temperatures, vertical and
horizontal velocities, specific humidity and geopotential.
For additional comparison, we used the Objectively Analyzed air-sea Fluxes
(OAFlux) project daily estimates of surface sensible and latent heat fluxes (Yu et al.,
2008). These data are derived from satellite retrievals, ship reports and surface
meteorology. Daily data at 1° resolution are available from 1985-2006. The time series
of November-March (NDJFM) seasonal averages of the NCEP-NCAR reanalysis and
OAFlux estimates of CLIMODE region sensible and latent heat fluxes showed high
interannual correlation (r = 0.99 and r = 0.98, respectively) and moderate bias of the
reanalysis (+9% or +5.4W/m2 for the sensible heat flux and -3% or -4.7W/m2 for the
latent heat flux).
7
For this study, we use a threshold daily flux rate (e.g. 100 W/m2) to categorize
days as high or low flux events over the CLIMODE region. The slight biases between
the NCEP-NCAR reanalysis and OAFlux heat flux estimates might corrupt this
categorization; however, our results were found to be insensitive to the precise threshold
used (e.g. 100 W/m2, 125 W/m2, etc.). The NCEP-NCAR reanalysis fluxes were used for
most of the calculations reported below, because of the greater length of the available
time series. Additional analyses using voluntary observing ship (VOS) data were also
made and are discussed in the appendix.
Previous studies have compared NAO variability with SMTW surface
transformation (Talley, 1996; Joyce et al., 2000), as well as North Atlantic storm activity
(Benedict et al., 2004; Jin et al., 2006; Vallis and Gerber, 2008; Gerber and Vallis, 2009).
We therefore also examined whether turbulent surface fluxes and associated synoptic
activity indicators over the Gulf Stream extension and STMW outcrop region, which lie
at the western edge of the North Atlantic storm track, are correlated with NAO variability
at seasonal and longer time scales. A monthly index of the NAO (CPC, 2008), averaged
seasonally for November-March 1948-2007, was used for this analysis. The NAO index
values are derived using a rotated principal component analysis of 500hPa geopotential
height anomalies.
3. Heat Flux Events
Statistical properties of the intraseasonal variability of air-sea fluxes in the
CLIMODE region from the NCEP-NCAR reanalysis were examined. These properties
include (Figures 1 and 2) the average daily sensible (latent) heat flux for the CLIMODE
region; histograms of the number of “event days” per NDJFM season; histograms of the
8
fraction of total NDJFM sensible (latent) heat flux each season due to event days;
histograms of the duration in days of sensible (latent) heat flux events; and daily sensible
(latent) heat fluxes for the CLIMODE region during 2003 and 2004. Here, “event days”
are defined as those during which sensible (latent) heat fluxes exceed 100W/m2
(250W/m2) for the CLIMODE region. These thresholds are somewhat arbitrary; however,
their magnitude corresponds to the 83rd (80th) percentile of the 60-year NDJFM reanalysis
record. Using the Coupled Ocean-Atmosphere Response Experiment (COARE) 3.0 bulk
algorithm (Fairall et al., 2003), 100 W/m2 sensible (250 W/m2 latent) heat flux is roughly
equivalent to a 6K (4K) air-sea temperature difference in the presence of a 10 m/s wind
and 77% relative humidity. Results, including those presented in Sections 4 and 5, were
found to be insensitive to the precise event day threshold used (e.g. 100 W/m2, 125 W/m2,
etc.). Results were also insensitive to the use of a daily anomaly threshold that accounted
for the variation of average daily heat fluxes within the NDJFM season (Figures 1a and
2a).
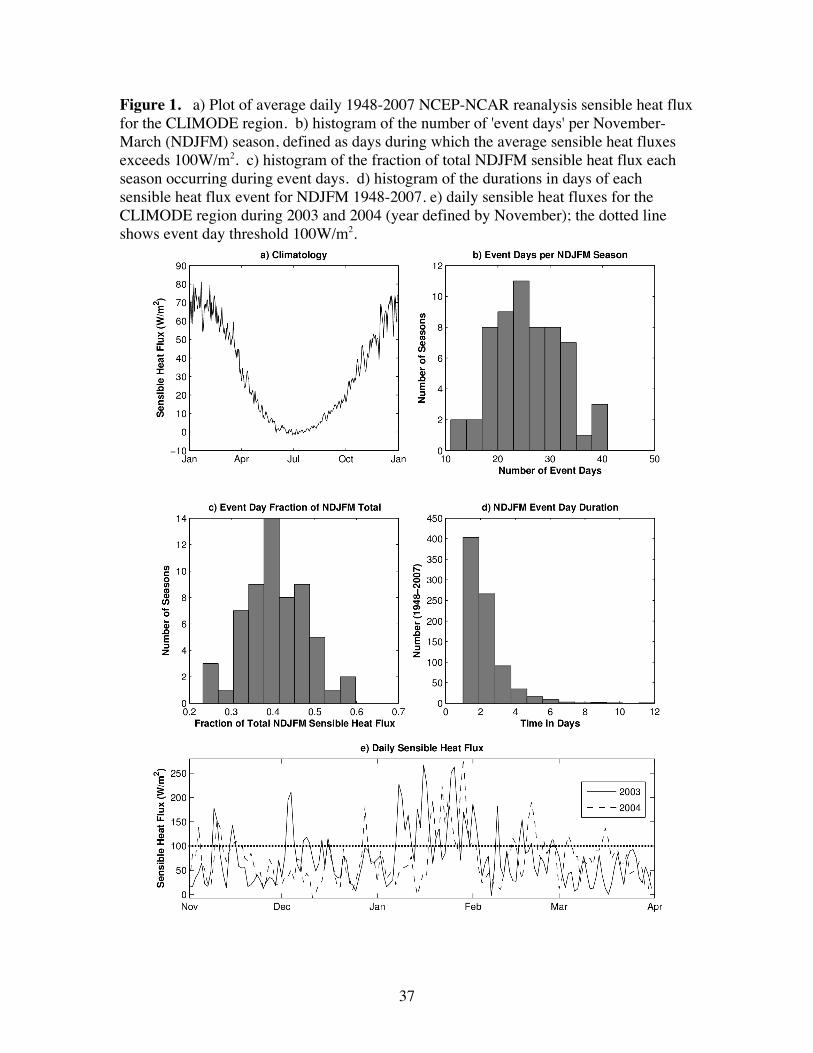
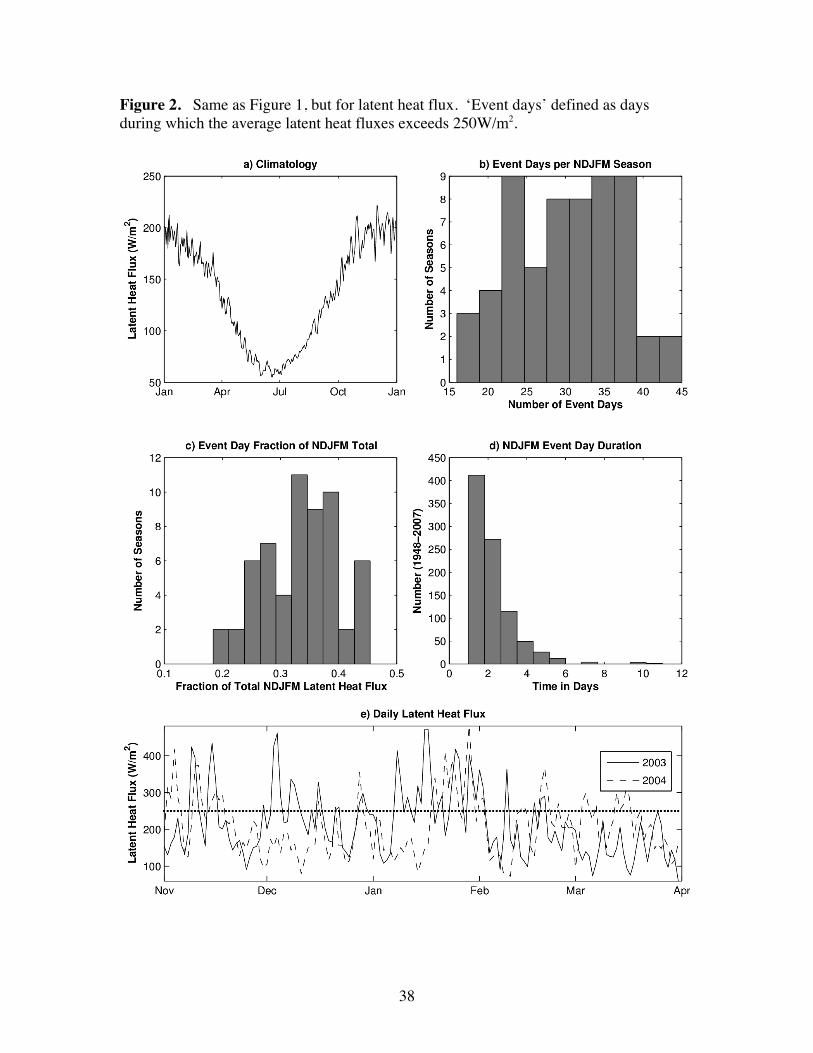
The presented distributions have several noteworthy features. The daily averages
are remarkably variable from day-to-day given the 60-year average. The highest heat
fluxes are of course during winter months (Figures 1a and 2a), in particular from
November through the end of March sensible (latent) heat fluxes are >40Wm2
(>150W/m2). Based on this climatology we adopt the NDJFM season for the remaining
analyses. There is considerable year-to-year variability of the number of event days and
the fractional amount of total heat flux accounted for by the event days (Figures 1b, 1c,
2b, 2c). On average, 41% (34%) of total NDJFM sensible (latent) heat flux occurs during
only 17% (20%) of NDJFM days. The duration of event histograms (Figures 1d and 2d)
9
and the 2003 and 2004 time series heat flux plots (Figures 1e and 2e), which are
representative of other individual years, show that event days are typically isolated 1-2
day occurrences. In fact, 81% (77%) of the high sensible (latent) heat events last for less
than 3 days.
These findings indicate that a large amount of the wintertime surface fluxes of
heat and moisture occur during a relatively small number of days. In addition, these high
flux days are often 1-2 day events and thus are likely associated with synoptic weather
variability.
4. Event Day Composites
We next use composite analysis to examine the meteorological conditions
associated with CLIMODE region event days. Daily NCEP-NCAR reanalysis fields
were composited by averaging all 1948-2007 NDJFM days during which sensible heat
fluxes did not exceed 100W/m2 (i.e. ‘non-event’ days) and subtracting this average from
the average for all event days, to obtain mean event-day anomaly fields. Changing the
classification of an event day from 100W/m2 sensible heat flux to 125W/m2 or 150/m2
produced little change in the composite results. A similar insensitivity is evident when
event day classification is based on latent heat flux rates. In addition, we expanded and
contracted the CLIMODE domain, as well as translated the domain up to 5 degrees in all
directions (north, south, east and west); in each instance, composite results were found to
be insensitive to these changes.
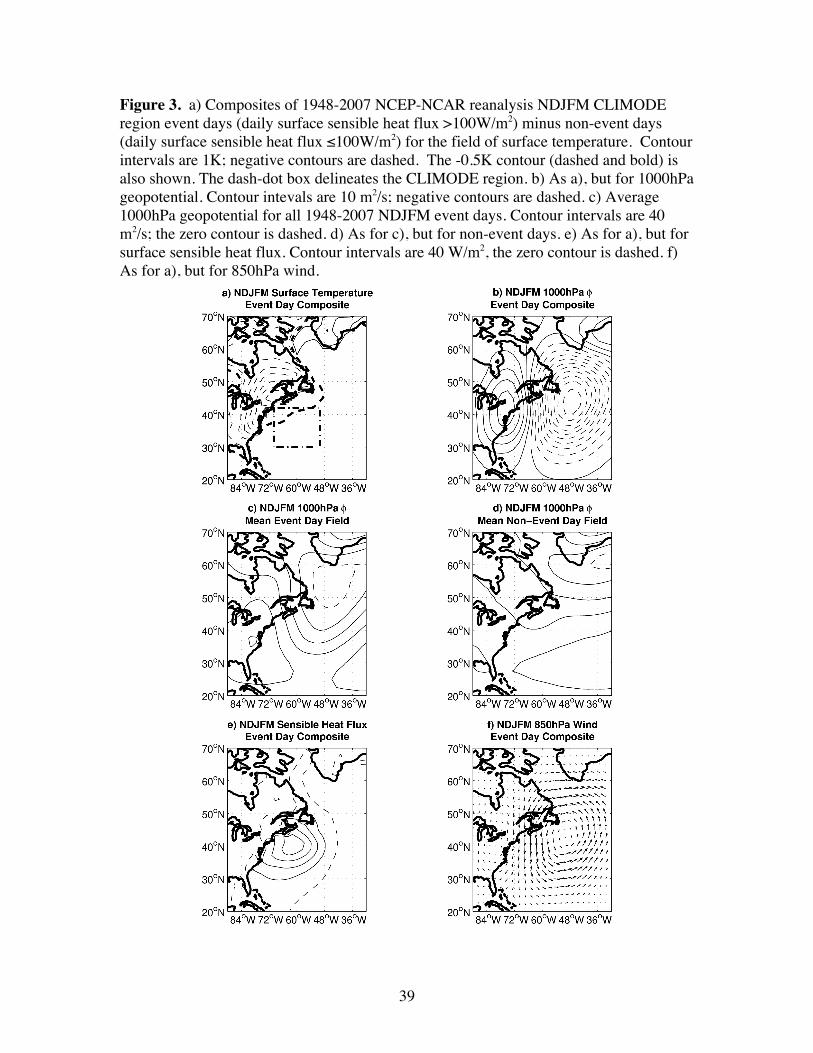
The composite of surface temperature reveals a marked cold anomaly over eastern
North America and little temperature anomaly (<1K) over the ocean, including the Gulf
Stream extension and Sargasso Sea (Figure 3a). The mean event-day 1000hPa
10
geopotential anomaly shows a very specific, strong circulation pattern (Figure 3b). A
steep west-east geopotential gradient lies centered at 66°W, which is consistent with
strong northerly winds. This composite indicates that high heat flux days are associated
with a characteristic circulation anomaly. This circulation is consistent with the intense
cold air outbreak and explosive cyclogenesis that has been documented over the north
and west flanks of the Gulf Stream (Colucci, 1976; Sanders and Gyakum, 1980; Sanders,
1986). Indeed, together, the surface temperature and 1000hPa geopotential composites
indicate that high heat flux days are associated with cold air advected off the continent.
Average 1000 hPa geopotential fields for event and non-event days (Figures 3c and d)
show the pronounced circulation change, as well; in particular, the pronounced ridging
and northerly flow that is present along the North American coast during event days
(Figure 3c).
Unlike explicit storm tracking algorithms (e.g. Patoux et al. 2009) or the
examination of high-pass-filtered fields (e.g Alexander and Scott, 1997), the composite
analysis used here is not a conventional means of identifying storm activity and structure.
We did not a priori assume a storm structure, but rather used the composite analysis to
isolate the anomalous atmospheric conditions over the CLIMODE region when turbulent
fluxes are high. The clear cyclone structure and strong geopotential gradient that
emerges from this analysis indicates that a characteristic storm structure is typically
present during high flux events.
The composite of sensible heat flux, as is to be expected, shows strong positive
heat flux anomalies over the CLIMODE region with a maximum at the Gulf Stream
extension (Figure 3e). The 850 hPa wind vector composite shows a circulation consistent
11
with the 1000 hPa geopotential composite; in particular, northerly flow between 70°W
and 60°W and a strong cyclonic circulation centered to the east of the CLIMODE region
(Figure 3f).
These results are consistent with previous findings for the Gulf Stream (Bane and
Osgood, 1989; Alexander and Scott, 1997; Zolina and Gulev, 2003) and Kuroshio
extensions (Bond and Cronin, 2008), which have shown that synoptic storm activity
controls surface turbulent fluxes on synoptic time scales. The combination of the Gulf
Stream extension within and jet stream position over the CLIMODE region helps produce
the high synoptic variability and these large air-sea flux events (Nakamura et al. 2004).
The surface turbulent fluxes destabilize the near-surface troposphere, which increases
local baroclinicity, supports storm intensification, and helps maintain the storm track
(Hoskins and Valdes, 1990; Mak, 1998; Inatsu et al., 2003). The storms themselves, i.e.
the cold air outbreaks, then destroy this baroclinicity through synoptic-scale mixing.
Tropospheric Structure and Time Evolution
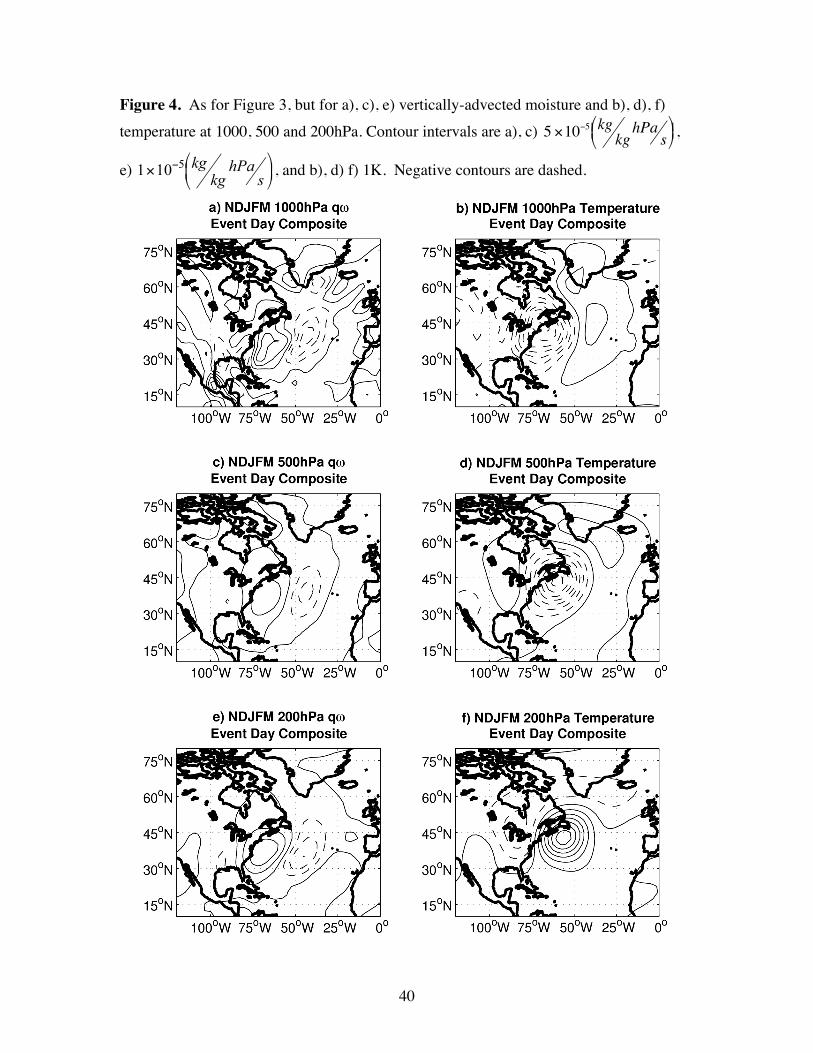
The atmospheric circulation anomaly associated with event days extends through
the troposphere (Figure 4). Temperatures warm in the upper troposphere above the near-
surface geopotential low. These are indicative of a pronounced dipping of the tropopause
and the intrusion of warmer stratospheric air at the 200 hPa level (Hoskins et al. 1985).
Composites of vertically-advected specific humidity reveal an anomalous
downward flow of dry air over the CLIMODE region in the area of strong anomalous
northerly flow (Figure 4). These anomalies extend throughout the troposphere. To the
east is an area of strong moisture ascent, which also extends throughout the troposphere.
The northerly flow of these event day storms (~70°W) thus brings cold, dry, descending

12
continental air over the CLIMODE region. This air picks up heat and moisture from the
Gulf Stream extension and STMW outcrop, which facilitates mode water formation.
Ascending air, along the advancing cold front, carries warmer, moister marine air to the
upper troposphere, and possibly lower stratosphere.
Thus, event days produce an exchange of continental and marine air masses, high
sensible and latent heat fluxes and a ventilation of the marine boundary layer. The upper
ocean and entire troposphere are coupled. These results are consistent with the model
findings of Alexander and Scott (1997) and the observational analysis of Zolina and
Gulev (2003). The northerly advection of cold air by synoptic storms across the Gulf
Stream front produces the high heat fluxes in the descending cold air wedge that help
facilitate mode water formation.
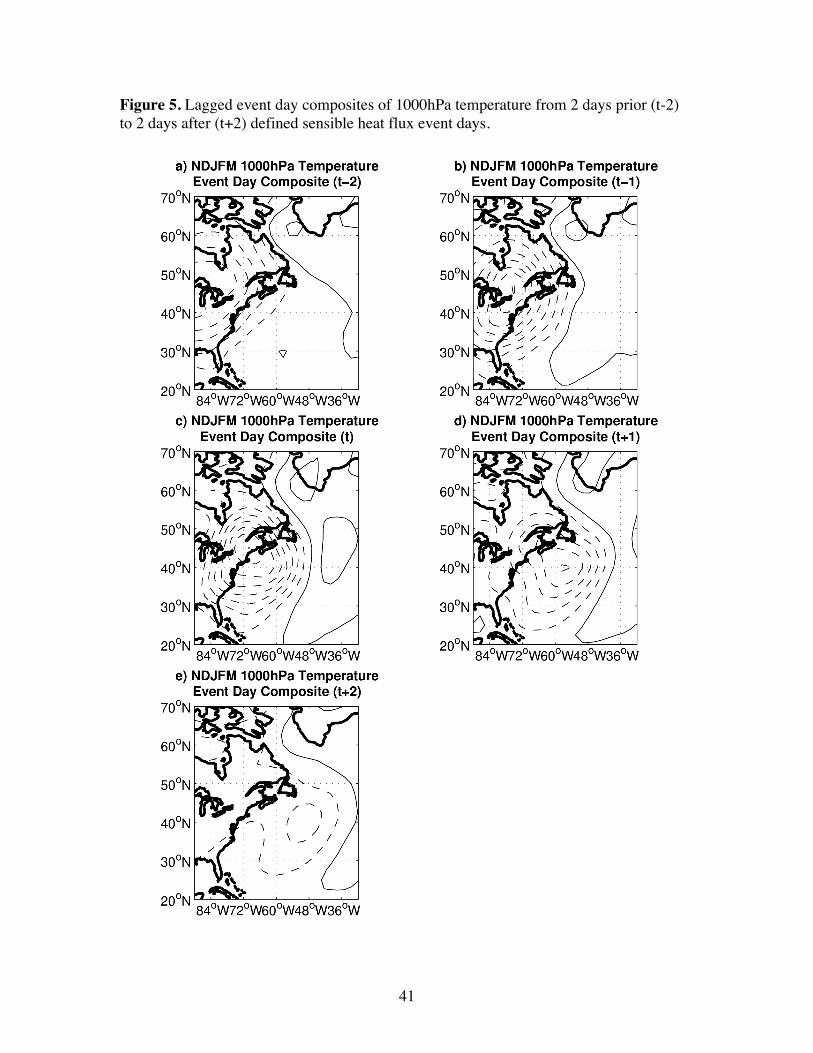
The translation and evolution of event day storm system anomalies can be seen in
lagged composites of the reanalysis fields. These lagged composites show the
development of anomalies leading up to and following event days. For example, the 2-
day prior composite is the average of all days 2-days prior to a NDJFM high flux event
day minus the average of all days 2-days prior a NDJFM non-event day. Figure 5 shows
such lagged composites of the 1000hPa temperature field from 2-days prior to 2-days
after sensible heat flux event days. The eastward and slightly southward translation of
storm system temperature anomalies is clearly evident. These temperature anomalies are
strongest the day of and the day prior to the event. Upon crossing the continental margin,
Gulf Stream extension and STMW outcrop, the anomalies weaken rapidly due to strong
surface sensible heat fluxes from these ocean waters (Figure 3e).
13
5. Linear Trends
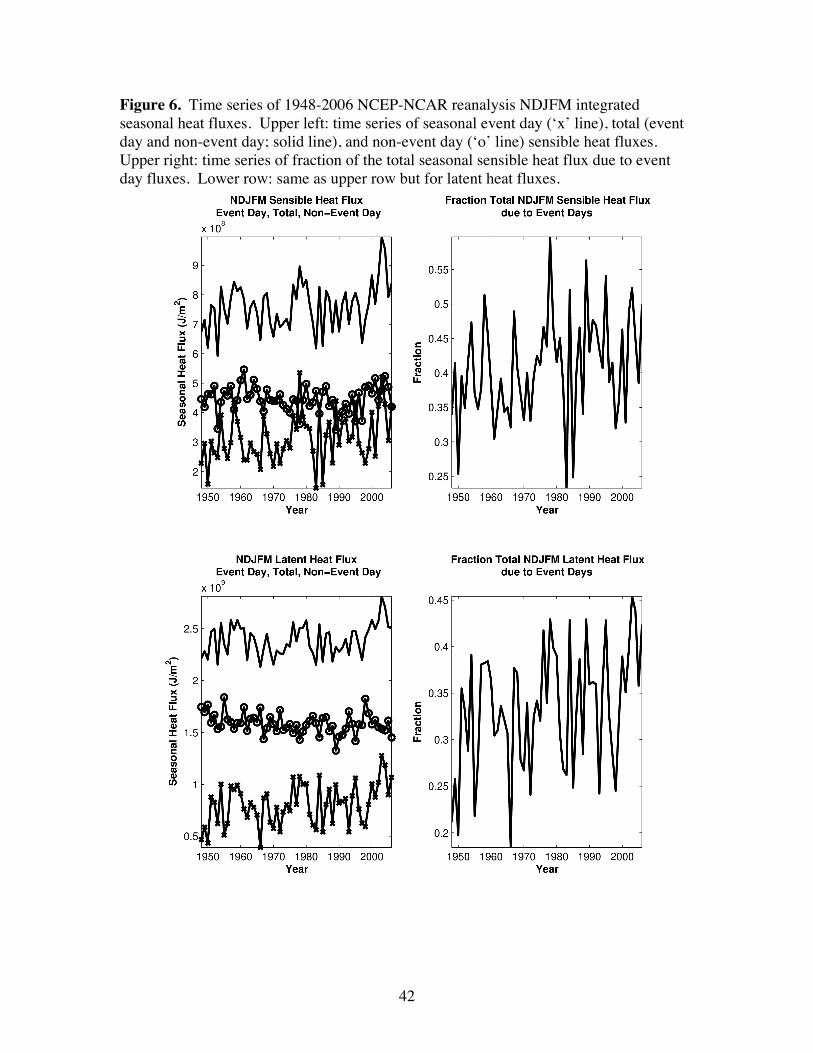
Over the course of the 60-year NCEP-NCAR reanalysis record (Figure 6) and the
shorter OA flux record (Figure 7), systematic changes in CLIMODE region NDJFM heat
fluxes are manifest. There are statistically significant increasing trends of total and event
day NDJFM sensible and latent heat fluxes but no significant trend for non-event day
sensible heat fluxes and a statistically significant decreasing trend for non-event day
latent heat fluxes (Table 1). The fraction of total seasonal heat flux due to event days has
also increased with time.
These findings indicate that over the last 60 years the change in surface turbulent
fluxes is due to increased synoptic activity, specifically cold air outbreaks, over the
CLIMODE region. In addition, the year-to-year variability of the total NDJFM heat flux
is most closely linked to event day variability (Figures 6 and 7). Thus, the NDJFM
seasonal heat flux anomalies for the CLIMODE region correspond to anomalies of
aggregate seasonal synoptic activity.
Upgrades of the NCEP-NCAR reanalysis model, introduction and assimilation of
satellite observations (Yuan et al., 2009), as well as changes in the encoding and
assimilation of radiosonde data (Harnik and Chang, 2003), can all lead to shifts in
reanalysis biases that might exaggerate or diminish the apparent linear trends shown here.
Many of these changes occurred in the 1970s and some of the flux trends do appear to
shift during this period (Figure 6), so some caution is required in interpreting these
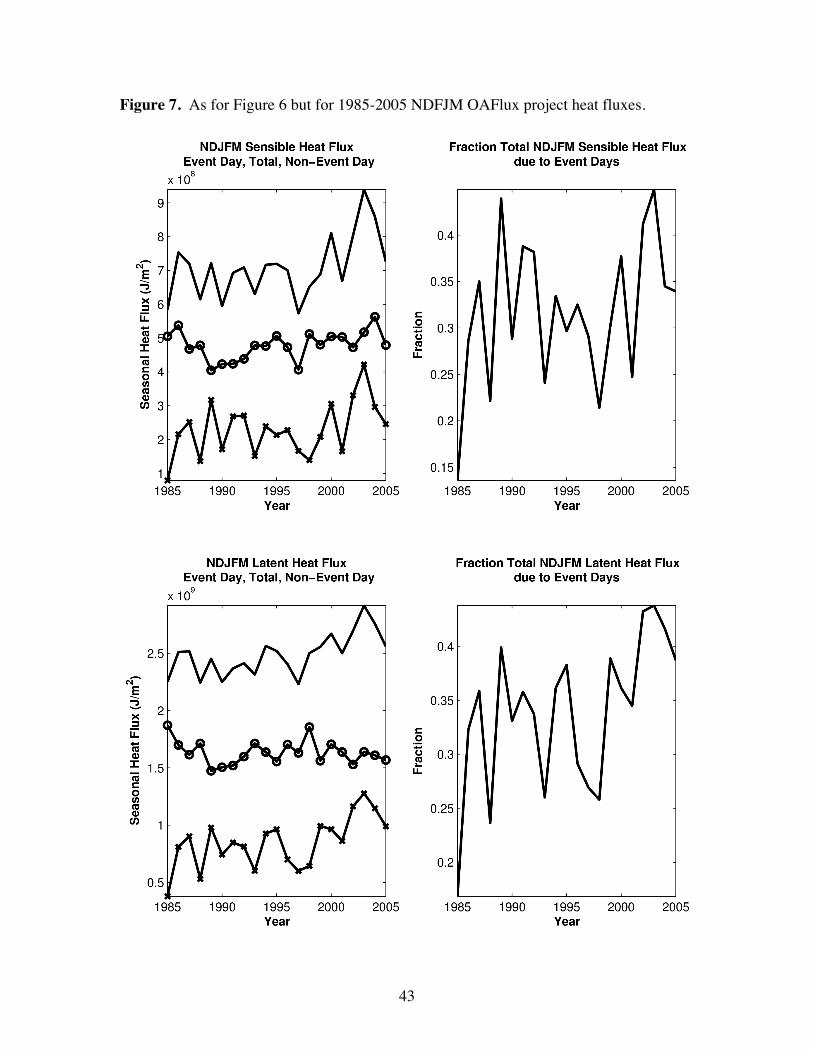
results. However, similar trends are also evident for 1985-2005 in the shorter OAFlux
record (Figure 7). For their period of overlap, the NCEP-NCAR reanalysis and OAFlux
time series of heat fluxes (Figures 6 and 7) are highly correlated (0.72 < r < 0.99). None
14
of these times series were correlated with the NDJFM NAO index at statistically
significant levels (Table 2), which indicates that the seasonal variability of these turbulent
fluxes is not linked to the NAO.
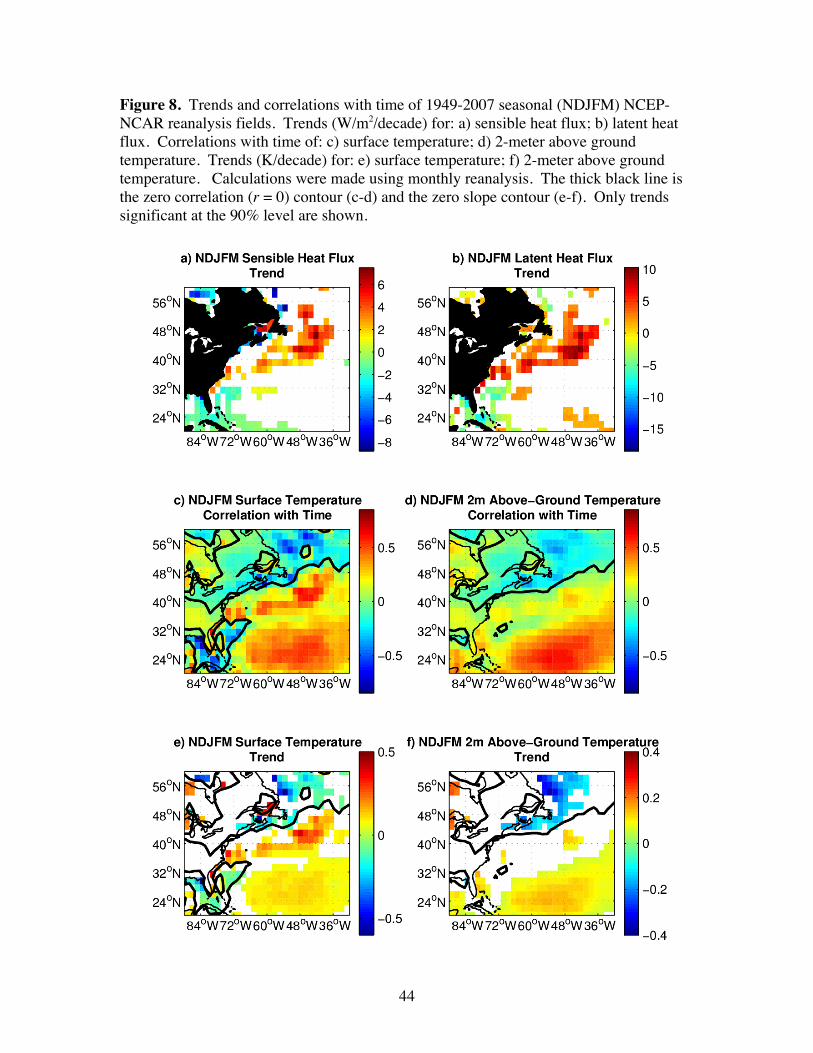
The distribution of the heat flux trends in and around the CLIMODE region can
be seen in Figure 8. Sensible and latent heat fluxes have increased with time off the
eastern seaboard of North America. Previous work has identified a significant negative
trend in 1948-2002 NCEP-NCAR reanalysis combined JFM sensible and latent heat
fluxes over waters centered around 35°N, 48°W (Gulev et al., 2007b). This location lies
to the southeast of the positive trend shown in Figures 8a and b. A negative trend is
evident for this region in our analysis, too, however, it fails to reach statistical
significance at p < 0.10 and is therefore not shown in Figures 8a and b. The longer
season examined (NDJFM) and longer record length (1949-2007) may explain this
difference.
Over the last 60 years NDJFM surface and above-ground air temperatures have
decreased over the northeastern United States, eastern Canada and the Labrador Sea,
while to the south over the ocean and CLIMODE region they have increased (Figure 8c-
f). These opposing trends favor the observed seasonal increase of sensible and latent heat
fluxes. That is, these trends indicate that at present on average colder surface air is
advected off the continent and encounters warmer sea surface temperatures.
The cooling temperature trends north of roughly 40°N and the increases of
CLIMODE region heat fluxes are due primarily to an increasing number of event days
per NDJFM season, not an increasing intensity of heat fluxes during individual storm
events (Table 1). This trend is indicative of changes in the frequency with which cold
15
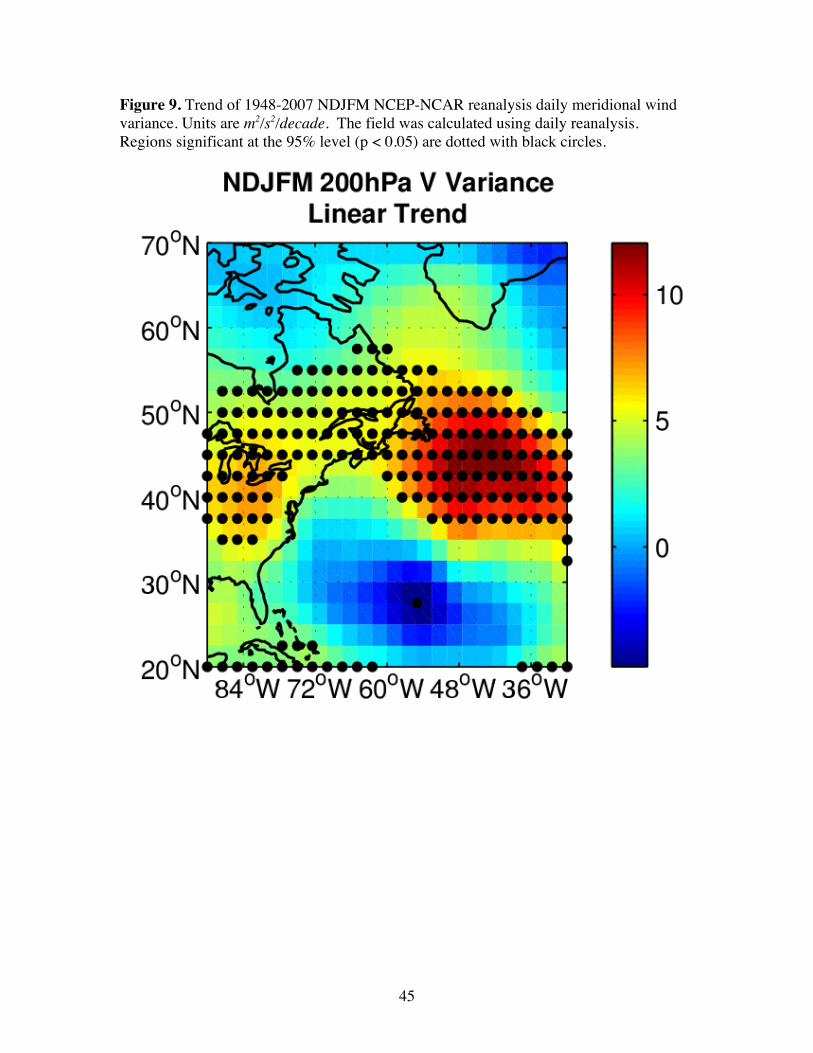
arctic air is exchanged with lower latitude air masses. Such changes are seen in the trend
of upper tropospheric meridional wind variance (Figure 9). During boreal winter, cold
air masses develop over Canada and deepen from the surface upward. More frequent
wintertime southward excursions of these cold air masses, indicated by the increasing
trend of upper level wind variance (Figure 9), are consistent with an increased frequency
of cold air outbreaks, as well as the decreasing surface and 2-meter temperature trend
over the northeastern U.S. and eastern Canada (Figures 8c-f).
In essence, for the larger region, lower tropospheric flow has shifted to a more
northerly course, due to more frequent NDJFM synoptic storm activity over the last 60
years. At the same time, the Gulf Stream has advected increasingly warm subtropical
waters poleward. These two trends have increased the surface and lower tropospheric
temperature gradients in the vicinity of the Gulf Stream extension (Figure 8c-f). In fact,
the zero contour of the temperature shift runs parallel to and slightly north of the Gulf
Stream extension. Over the last 60 years, the surface temperature difference spanning the
10 degrees of latitude across this contour has increased by over 1K (Figure 8c).
We also examined monthly voluntary observing ship (VOS) data within the
CLIMODE region for consistency with the results obtained from the reanalysis. As
described in the appendix, there is disagreement between the total NDJFM flux trends
presented here (Figures 6 and 7) and those derived from the monthly VOS data. The
source of this discrepancy is uncertain, but as increasing event day heat fluxes associated
with strong synoptic disturbances are the basis of the increasing total heat flux trend, it is
possible and perhaps likely that the discrepancy between monthly VOS-derived estimates
and those of reanalysis and the OA Flux data stems from a fair-weather bias in which
16
ships avoid the region during stormy weather (i.e. event days). These findings and issues
are discussed at length in the appendix.
a. Storm Activity Indicators
We next explore storm activity trends over the North Atlantic through more direct
measures. Two diagnostics were used. The first, 850hPa eddy heat flux (
€
′ v ′ T ), is used to
identify atmospheric fluctuations associated with local storm activity. A Butterworth
filter with a half-power cutoff period of 8 days was used to high-pass filter the reanalysis
record and select for variability at synoptic time scales.
€
′ v ′ T is also proportional to the
vertical component of the Eliassen-Palm (E-P) flux vector (Hoskins et al., 1983).
Positive values (upward E-P flux) imply strong downward transport of mean flow
momentum, which reduces vertical shear and baroclinicity. The second diagnostic is a
measure of low-level baroclinicity, specifically, the near-surface Eady growth rate
maximum (Lindzen and Farrell, 1980; Hoskins and Valdes, 1990):
€
σBI = 0.31 f ∂v∂z
N −1
where f is the Coriolis parameter,
€
v = u,v( ) is the horizontal wind velocity and N is the
Brunt Väisälä frequency. This metric was evaluated at 700hPa.
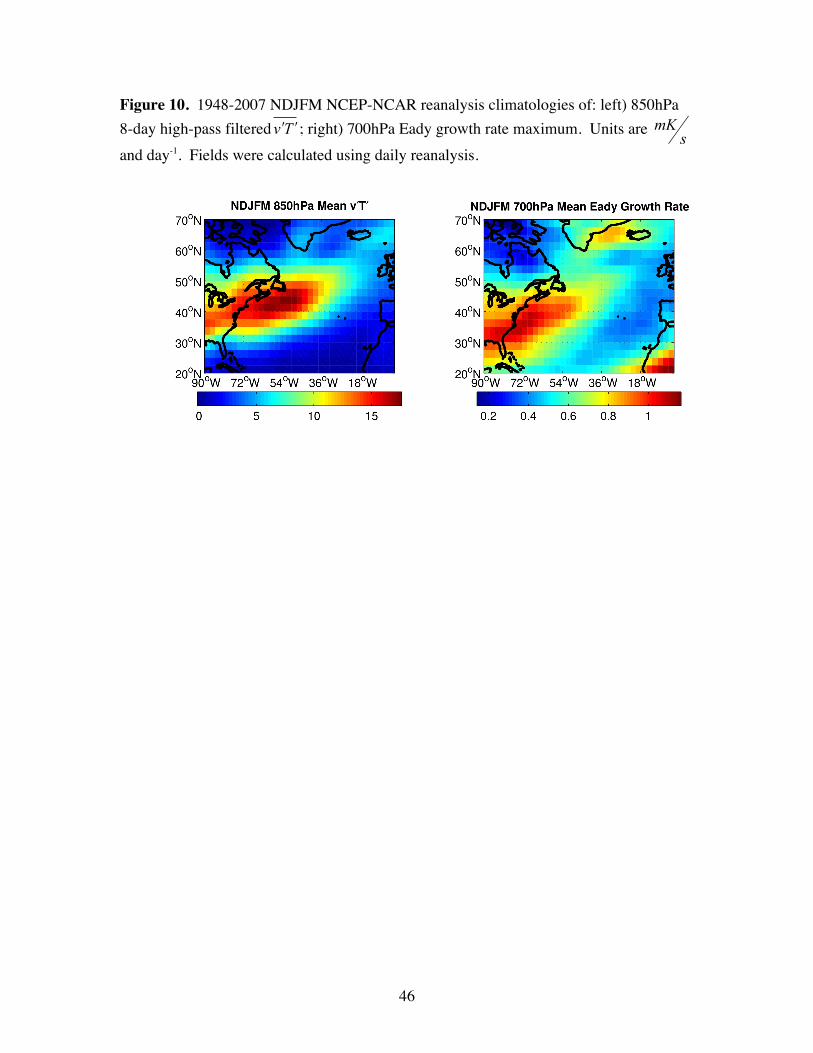
Figure 10 shows the 60-year mean
€
′ v ′ T and
€
σBI for the North Atlantic. A region
of high eddy heat flux is centered at 45ºN, 54ºW and has a slight southwest to northeast
orientation. The mean
€
σBI has a similar orientation, but is shifted to the west and south
off Cape Hatteras with a maximum at 36ºN and 72ºW. The Eady growth rate maximum
is a metric of cyclone intensification potential; extratropical storms that develop and
intensify in response to regions of high
€
σBI grow as they propagate downstream in
17
midlatitude westerlies. Thus, it is expected that zones of maximum baroclinicity lie
upstream from regions of maximum eddy heat flux. This offset is consistent with
previous analyses (Hoskins and Valdes, 1990; Paciorek et al. 2002).
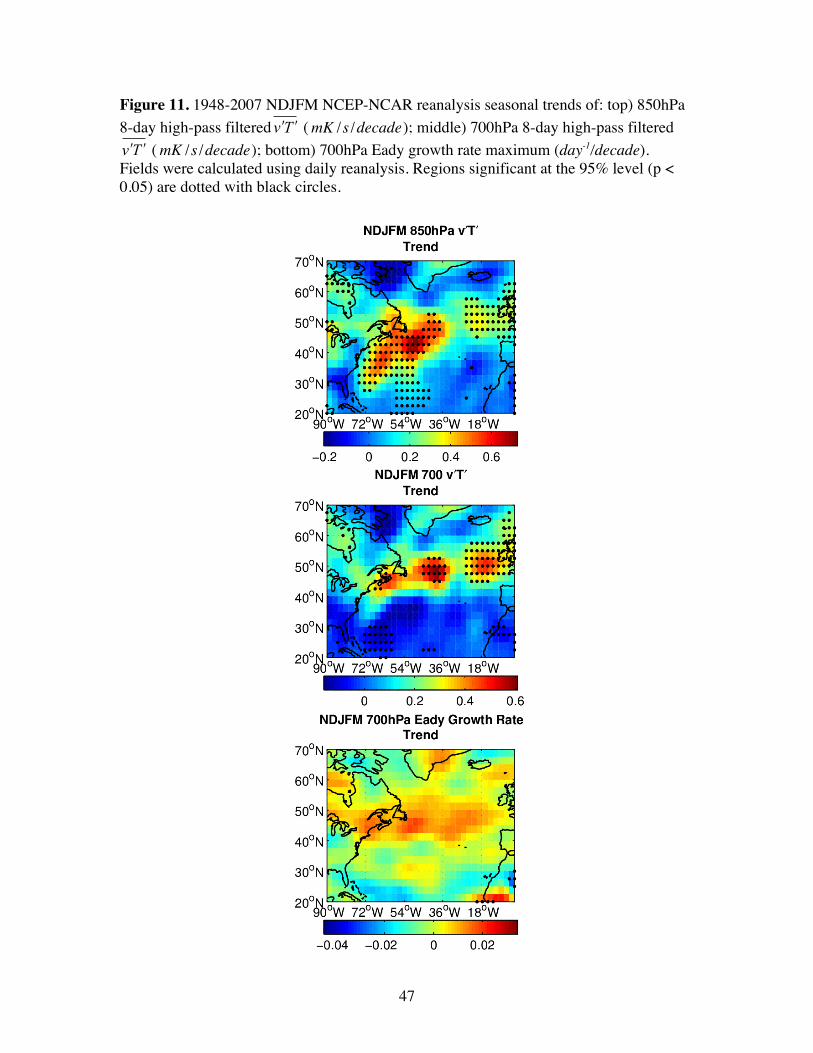
Trends of increasing
€
′ v ′ T and
€
σBI are observed across the North Atlantic north of
40ºN (Figure 11). At 700hPa, the increase in eddy heat flux over the 60-year reanalysis
record extends from North America to the British Isles, though there is a minimum
around 33ºW. At 850hPa, the region with a positive trend of eddy heat flux extends
south of 40ºN along the North American coast over the western North Atlantic (Figure
11a). These trends in storm activity are broadly consistent with previous findings for this
region, which show increasing wintertime storm activity between 40-50ºN over the North
Atlantic (Geng and Sugi, 2001; Gulev et al., 2001; 2002; Chang and Fu, 2002; Paciorek
et al., 2002; Harnik and Chang, 2003; Chang, 2007). The 700hPa
€
σBI trend pattern
corresponds most closely to the 700hPa
€
′ v ′ T , and demonstrates an increase in mean
wintertime low-level baroclinicity along the North Atlantic storm track (Figure 11c).
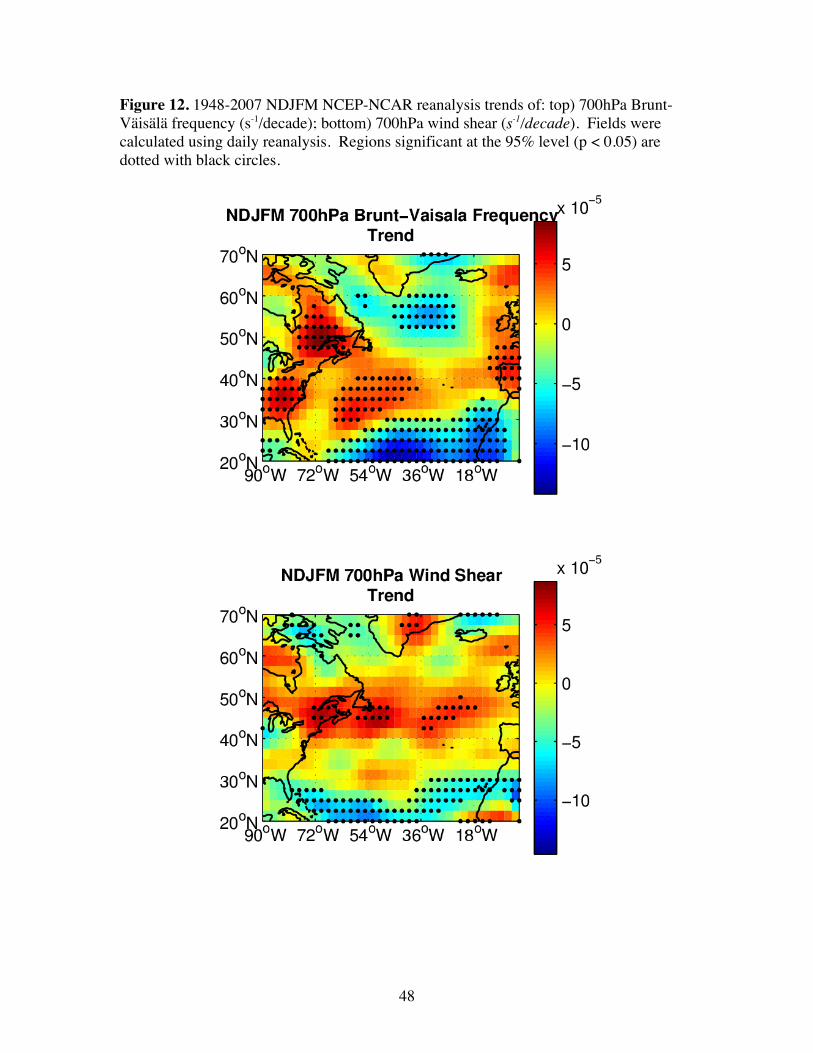
The changes to 700hPa
€
σBI north of 40ºN are principally the result of increasing
low-level vertical wind shear along the storm track (Figure 12). The pattern of increasing
700hPa wind shear also matches the trend pattern for 700hPa
€
′ v ′ T . Changes to the Brunt
Väisälä frequency over the open ocean also increase the growth rate diagnostic north of
45ºN but appear to be of secondary importance; along the North American coast and near
the British Isles north of 40ºN, where
€
σBI increases, N also increases with time north of
40ºN, which should instead reduce
€
σBI in this region.
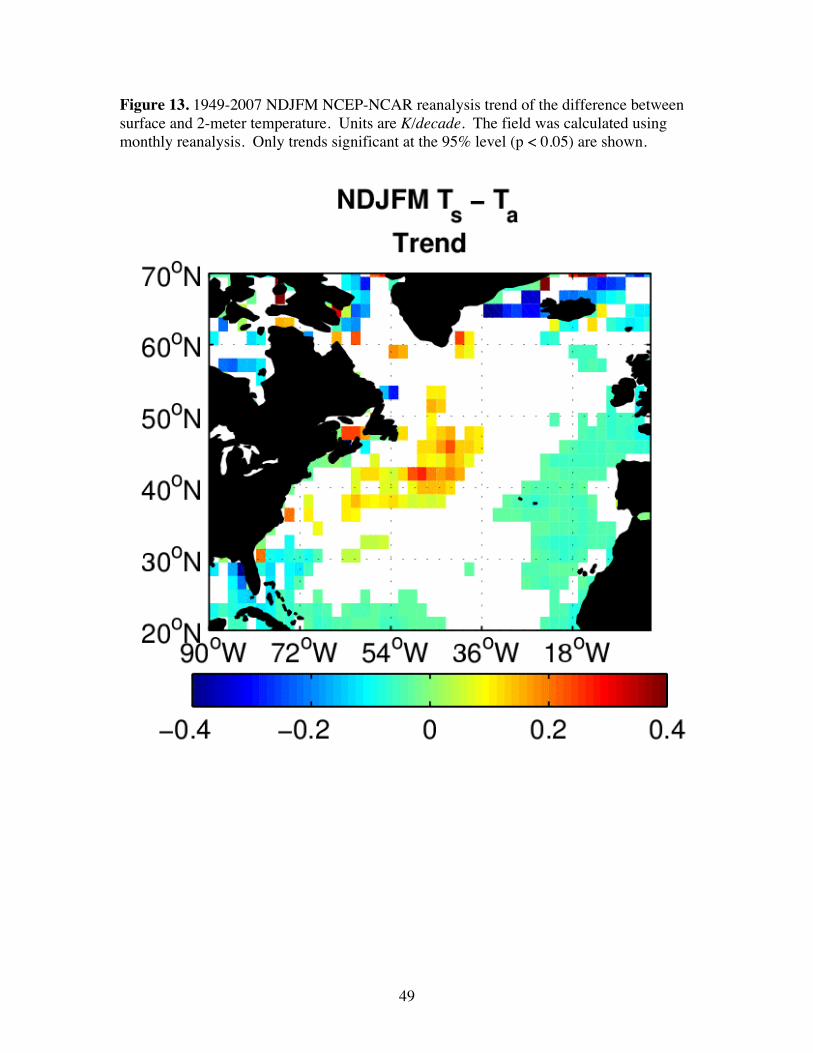
The 700hPa wind shear trend reflects changes in the horizontal temperature
gradient. Such temperature changes can be seen in the surface (
€
Ts ) and 2-meter
18
temperature (
€
Ta) trend plots (Figures 8-f), which show an increasing temperature gradient
just north of the Gulf Stream extension. These same temperature changes, which alter
the horizontal temperature gradient, and consequently low-level wind shear, baroclinicity
and storm activity, also produce the change in the near-surface vertical temperature
gradient (
€
Ts −Ta) that drives the trends in surface sensible and latent heat fluxes over the
CLIMODE region. In fact, the trend of
€
Ts −Ta (Figure 13) corresponds well with these
turbulent flux trends (Figures 8a, b), suggesting that the changes in the large-scale fields
are also affecting the flux trends, and not merely responding to them.
6. Discussion
Synoptic storm activity over the CLIMODE region during winter brings cold air
from the north off the North American continent and over warm Gulf Stream waters.
During these synoptic events surface sensible and latent heat fluxes are greatly elevated
and mode water formation is enhanced. Due to these storm events, around 41% (34%) of
the 1948-2007 total NDJFM sensible (latent) heat flux occurs during just 17% (20%) of
NDJFM days. Thus, much of the seasonal heat loss from CLIMODE region surface
waters occurs episodically.
In addition, the number of storm event days and the proportion of total NDJFM
sensible and latent ocean-to-atmosphere heat flux that occurs during event days have
increased over the last 60 years. This increased storm frequency (i.e. more cold air
outbreaks) has produced changes to the mean state in the vicinity of the Gulf Stream
extension and STMW outcrop, including decreased surface and 2-meter air temperature
over the northeastern U.S., eastern Canada and the Labrador Sea, and has possibly
19
contributed to the increased surface and 2-meter air temperature to the south-southeast
over the Sargasso Sea.
The cooling trend north of 40ºN (Figure 8c and d) appears to be the consequence
of factors specific to the region. Consistent with quasigeostrophic theory, westerly flow
over the Rocky Mountains produces a downstream north-south standing wave that directs
mean northwesterly flow offshore and over the Gulf Stream (Figure 3c and d). Thus,
orography and the North Atlantic western boundary current create a strong baroclinic
zone where cold wintertime Canadian air is advected over warm ocean waters. A recent
modeling study shows that the combined effects of Rocky Mountain-like orography and
land-sea temperature contrast synergistically concentrate synoptic activity around the
latitude of the continental margin (Gerber and Vallis, 2009). In response to greenhouse
gas forcing, many climate models project increasing extra-tropical storm activity. Over
North America, the increased storm activity will likely organize in this region of mean
northwesterly flow and strong low-level temperature gradients. While the synoptic
storms act to reduce the temperature gradient by transporting heat poleward, the
increased mean northerly flow off the continent acts to cool the ocean surface north of
40ºN. This effect, coupled with the warming ocean water temperatures south of 40ºN,
appears to have strengthened the low-level temperature gradient (Figure 8c-f).
Through the thermal wind response, the increased low-level temperature gradient
at 40ºN has produced concomitant increases of low-level wind shear and baroclinicity
along the North Atlantic storm track. The 700hPa
€
σBI trend is greatest north of the
climatological maximum of low-level
€
σBI off the Carolinas (Figure 10) and indicates that
the region of optimal storm intensification may be shifting northward. The wind shear
20
and
€
σBI changes are accompanied by increased storm activity across the North Atlantic
north of 40ºN, and may in fact favor this increased storm activity. Thus, these trends
suggest a positive feedback in which the increased storm activity, through intensification
of the horizontal temperature gradient along the Gulf Stream at the upstream end of the
storm track, creates conditions favorable for more cyclogenesis in this region.
Increased diabatic heating of the lower troposphere due to increased surface heat
fluxes can itself fuel synoptic storm events (Mak, 1998); however, a decreasing trend of
N over the CLIMODE region is not observed. Thus, the increased surface heat fluxes
over the CLIMODE region appear to be a response to the changes in storm activity, and
do not themselves appear to feed back positively on the trend of increasing storm activity.
The trends described here, particularly for the surface turbulent fluxes, may be
corrupted by changes in the assimilation of observations or upgrades to the NCEP-NCAR
reanalysis model (Yuan et al., 2009), changes in the frequency of shipboard and mooring
measurements (Gulev et al., 2007b), changes to measurement methods (Kent et al., 2007)
or observational errors (Chang, 2007). However, the legitimacy of the surface flux trends
described here is supported by the concurrent trends of other large-scale atmospheric
fields captured by the reanalysis model and constrained by more voluminous terrestrial
surface, radiosonde, dropsonde and satellite observations. Ongoing evaluation of these
trends in the coming years and further study of the proposed feedback mechanism are
needed to validate these findings.
Previous studies have shown that the NAO is associated with storm activity over
the North Atlantic and may in fact be a manifestation of this storm track (Vallis and
Gerber, 2008; Gerber and Vallis, 2009). Our results here, however, indicate that

21
CLIMODE region turbulent fluxes, including those associated with cold air outbreaks,
are independent of the NAO at seasonal and longer time scales. This circumstance may
result from geography, as the CLIMODE region resides at the westernmost portion of the
North Atlantic storm track.
The overall increase of NDJFM sensible and latent heat fluxes in the CLIMODE
region over the last 60 years indicates that the synoptic-scale atmospheric processes
facilitating seasonal North Atlantic mode water formation have themselves changed.
Long-term changes in STMW properties may occur on multi-decadal time scales, and it
has been argued that such changes may reflect shifts in storm track position, which alter
regions of high air-sea fluxes, freshwater input and oceanic convection (Dickson et al.,
1996). The changes to eddy heat flux and low-level baroclinicity in the North Atlantic
(Figure 11) may indicate such a shift has been and is occurring.
Acknowledgements
We thank Nicholas Bond, Jimmy Booth, Steve Esbensen, Justin Small and Robert
Weller for helpful discussions. This work was funded by NSF grant OCE-0424516.
22
Appendix
We additionally looked for trends in CLIMODE region monthly estimates of
sensible and latent heat fluxes based on voluntary observing ship (VOS) data.
Specifically, we used 1948-1993 flux estimates derived from the Comprehensive Ocean-
Atmosphere Data Set (COADS) (Da Silva et al., 1994) and the 1973-2005 National
Oceanography Center, Southampton (NOCS) Surface Flux Dataset v2.0 version (Berry
and Kent, 2009), which optimally interpolates the International Comprehensive Ocean-
Atmosphere Data Set (ICOADS) Release 2.4 ship data. These data are monthly and can
only be used for assessment of total seasonal NDJFM turbulent flux trends, i.e. no event
day trend analyses can be performed.
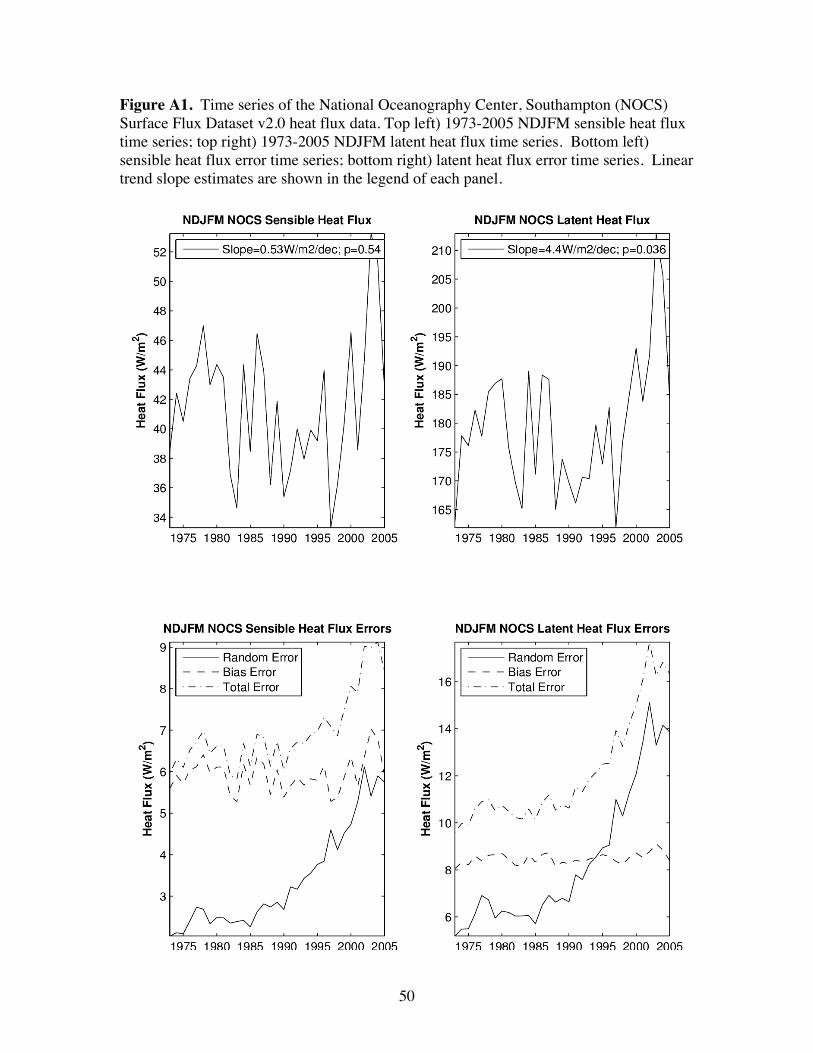
Only the NOCS NDJFM latent heat fluxes displayed a statistically significant
increasing trend (Figure A1). NOCS NDJFM sensible heat fluxes and the COADS-
derived (Da Silva et al., 1994) NDJFM sensible and latent heat fluxes show no trend.
These results are at odds with the total NDJFM trend findings of NCEP-NCAR reanalysis
and OAFlux data (Figures 6 and 7). The NOCS dataset does provide a number of error
estimates. For the CLIMODE region, there are significant positive trends in the random
and total error of the flux estimates for this region (Figure A1). For the sensible heat
fluxes, the magnitudes of some of these error trends are larger than the non-significant
sensible heat flux trend.
Correlations of total seasonal (NDJFM) sensible and latent heat fluxes averaged
for the CLIMODE region are shown in Tables A1 and A2. For the NDJFM season, the
interannual variability of the NCEP-NCAR reanalysis and OAFlux estimates are most
closely matched. The NOCS estimates are also well-correlated (r=0.88-0.93) with the
23
NCEP-NCAR reanalysis and OAFlux estimates; however, the COADS-derived estimates
are less well matched (r=0.67-0.73).
Gulev et al. (2007a,b) have shown there are considerable biases in ICOADS
observations and that linear trends of turbulent fluxes can vary considerably between
reanalysis and ICOADS derived data. Over the CLIMODE region these include random
sampling uncertainties, interpolation uncertainties and fair weather bias. These appear to
lead to biases of 10-20W/m2 over the Gulf Stream extension and SMTW outcrop region
(Gulev et al., 2007a). Whether changes in these biases through time for the CLIMODE
region would lead to spurious trend features (or the absence of a trend, in this instance) is
difficult to ascertain; however, Gulev et al. (2007b) found patches of significant
differences between the linear trends of JFM NCEP-NCAR reanalysis and ICOADS
within our study region. Chang (2007) also found large observational errors of shipboard
pressure within the ICOADS record during the late 1960s and early 1970s. These errors
were found to reduce the increasing storm activity trend over the Atlantic.
For this study, the fair-weather bias is of particular concern. This work focuses
on high-flux (storm) events, and these are the very events that ships avoid. If ships avoid
the CLIMODE region during bad weather, VOS-based estimates of turbulent fluxes will
underestimate or miss entirely the storm contribution to the overall trend. Indeed, it is the
increasing frequency of high flux (storm) events that forms the basis of the increasing
trend of total NDJFM sensible and latent heat fluxes within the NCEP-NCAR reanalysis
and OAFlux records (Figures 6 and 7). For data sets based primarily on ship-board
measurements, such as the NOCS and COADS-derived, the potential sampling bias
24
against high-flux events data sets within the CLIMODE region is large, given that,
coming off the continent as they do, many of these storms are well forecast.
Indeed, we examined the raw 6-hourly ICOADS data for differences in the
number of observations per day within the CLIMODE region during NDJFM event and
non-event days. Based on a simple two-way ANOVA test we found significantly fewer
observations per event day than per non-event day (p = 0.013). This finding supports the
notion that a fair weather bias exists within the CLIMODE region.
In addition to the likelihood of a fair-weather bias, which leads us to discount the
results of the COADS and NOCS trend analyses, a complementary factor that supports
the reality of the turbulent flux trends depicted by NCEP-NCAR reanalysis and OAFlux
estimates (Figures 6 and 7), is the concomitant trends of other large-scale atmospheric
fields captured by the reanalysis model and constrained by more voluminous terrestrial
surface, radiosonde, dropsonde and satellite observations. For the CLIMODE region,
these include land surface temperatures, upper level wind variance, and lower
tropospheric eddy heat fluxes and Eady growth rates. The tendencies of these trends are
consistent with increasing heat flux trends. Gulev et al. (2007b) also suggest that
reanalysis provides a better platform for studying climatological trends, as these estimates
are better constrained by the various assimilated terrestrial and atmospheric observations,
and the models used to make these estimates have demonstrated skill making medium-
range forecasts.
25
References
Alexander, M. A., and C. Deser, 1995. A mechanism for the recurrence of wintertime
midlatitude SST anomalies. J. Phys. Oceanogr., 25, 122-137.
Alexander, M. A. and J. D. Scott, 1997. Surface flux variability over the North Pacific
and North Atlantic oceans. J. Climate, 10, 2963-2978.
Bane, J. M. and K. E. Osgood, 1989. Wintertime air-sea interaction processes across the
Gulf Stream. J. Geophys. Res., 94, 10755-10772.
Benedict, J. J., S. Lee, and S. B. Feldstein, 2004. Synoptic view of the North Atlantic
Oscillation. J. Atmos. Sci., 61, 121-144.
Berry, D.I. and E.C. Kent, 2009. A New Air-Sea Interaction Gridded Dataset from
ICOADS with Uncertainty Estimates. BAMS, 90: 645-656.
Bond, N. A. and M. F. Cronin, 2008. Regional weather patterns during anomalous air-
sea fluxes at the Kuroshio Extension Observatory KEO. J. Climate, 21, 1680-1697.
Brayshaw, D. J., B. Hoskins and M. Blackburn, 2008. The storm-track response to
idealized SST perturbations in an aquaplanet GCM. J. Atmos. Sci., 65, 2842-2860.
Cayan, D. R., 1992. Latent and sensible heat-flux anomalies over the northern oceans:
The connection to monthly atmospheric circulation. J. Climate, 5, 354-369.
Chang, E. K. M., 2007. Assessing the increasing trend in northern hemisphere winter
storm track activity using surface ship observations and a statistical storm track model.
J. Climate, 20, 5607-5628.
Chang, E. K. M. and Y. Fu, 2002. Interdecadal variations in northern hemisphere winter
storm track intensity. J. Climate, 15, 642-658.
26
Colucci, S. J., 1976. winter cyclone frequencies over the eastern United States and
adjacent western Atlantic 1964-1973. Bull. Amer. Met. Soc., 57, 548-553.
CPC, (NOAA Climate Prediction Center), 2008. North Atlantic Oscillation, Digital
Media (http://www.cdc.noaa.gov/ClimateIndices/List/), accessed October, 2008.
Deser, C. and M. S. Timlin, 1997. Atmosphere-ocean interaction on weekly timescales in
the North Atlantic and Pacific. J. Climate, 10, 393-408.
Dewar, W. K., R. M. Samelson, and G. K. Vallis, 2005. The ventilated pool: A model of
subtropical mode water. Journal of Physical Oceanography, 35, 137-150.
Dickson, R., R., J. Lazier, J. Meincke, P. Rhines and J. Swift, 1996. Long-term
coordinated changes in the convective activity of the North Atlantic. Prog.
Oceanography, 38, 241-295.
Esbensen, S.K., and Y. Kushnir, 1981. Heat budget of the global ocean: Estimates from
surface marine observations. Report No. 29, Climate Research Institute, Oregon State
University, Corvallis, Oregon, 271 pp.
Fairall, C. W., E. F. Bradley, J. E. Hare, A. A. Grachev and J. B. Edson, 2003. Bulk
parameterization of air-sea fluxes: updates and verification for the COARE algorithm.
J. Climate, 16, 571-591.
Geng, Q., and M. Sugi, 2001. Variability of the North Atlantic cyclone activity in winter
analyzed from NCEP-NCAR reanalysis data. J. Climate, 14, 3863-3873.
Gerber, E. P. and G. K. Vallis, 2009. On the zonal structure of the North Atlantic
Oscillation and annular modes. J. Atmos. Sci., 66, 332-352.
27
Gulev, S. K., O. Zolina and S. Grigoriev, 2001. Extratropical cyclone variability in the
northern hemisphere winter from the NCEP/NCAR reanalysis data. Clim. Dyn. 17, 795-
809.
Gulev S. K., T. Jung and E. Ruprecht, 2002. Climatology and interannual variability in
the intensity of synoptic-scale processes in the north Atlantic from the NCEP-NCAR
reanalysis data. J. Climate, 15, 809-828.
Gulev S., T. Jung and E. Ruprecht, 2007a. Estimation of the Impact of Sampling Errors
in the VOS Observations on Air-Sea Fluxes. Part I: Uncertainties in Climate Means. J.
Climate 20:279-301.
Gulev S., T. Jung and E. Ruprecht, 2007b. Estimation of the Impact of Sampling Errors
in the VOS Observations on Air-Sea Fluxes. Part II: Impact on Trends and Interannual
Variability. J. Climate 20, 303-315.
Harnik, N. and E. K. M. Chang, 2003. Storm track variations as seen in radisonde
observations and reanalysis data. J. Climate, 16, 480-495.
Hoskins, B. J., I. N. James and G. H. White, 1983. The shape, propagation and mean-
flow interaction of large-scale weather systems. J. Atmos. Sci. 40, 1595-1612.
Hoskins, B. J., M. E. McIntyre, and A. W. Robertson, 1985: On the use and significance
of isentropic potential vorticity maps. Quart. J. R. Met. Soc., 111, 877-947.
Hoskins, B. J. and P. J. Valdes, 1990. On the existence of storm-tracks. J. Atmos. Sci. 47,
1854-1864.
Inatsu, M., H Mukougawa, and S.-P. Xie, 2003. Atmospheric response to zonal variations
in midlatitude SST: Transient and stationary eddies and their feedback. J. Climate, 16,
3314-3329.
28
Jin, F. F., L. L. Pan, and M. Watanabe, 2006. Dynamics of synoptic eddy and low-
frequency flow interaction. Part II: A theory for low-frequency modes. J. Atmos. Sci.,
63, 1695-1708.
Josey, S. A., E. C. Kent, and P. K. Taylor, 1999. New insights into the ocean heat budget
closure problem from analysis of the SOC air-sea flux climatology. J. Climate, 12,
2856-2880.
Joyce, T. M., C. Deser, and M. A. Spall, 2000. The relation between decadal variability
of subtropical mode water and the North Atlantic oscillation. J. Climate, 13, 2550-
2569.
Kalnay, E., M. Kanamitsu, R. Kistler, W. Collins, D. Deaven, L. Gandin, M. Iredell, S.
Saha, G. White, J. Woollen, Y. Zhu, M. Chelliah, W. Ebisuzaki, W. Higgins, J.
Janowiak, K. C. Mo, C. Ropelewski, J. Wang, A. Leetmaa, R. Reynolds, R. Jenne, and
D. Joseph, 1996: NCEP/NCAR 40-year reanalysis project. Bull. Amer. Met. Soc., 77,
437-471.
Kelly, K. A., R. J. Small, R. M. Samelson, B. Qiu, T. Joyce, and M. Cronin, 2009.
Western boundary currents and frontal air-sea interaction: Gulf Stream and Kuroshio
Extension. Manuscript in preparation.
Kent E. C., S. D. Woodruff and D. I. Berry, 2007. Metadata from WMO publication no.
47 and an assessment of voluntary observing ship observation heights in ICOADS. J.
Atmos. Ocean. Tech. 24, 214-234.
Lindzen, R. S. and B. Farrell, 1980. A simple approximate result for the maximum
growth rate of baroclinic instabilities. J. Atmos. Sci. 37, 1648-1654.
29
Mak, M., 1998. Influence of surface sensible heat flux on incipient marine cyclogeneis.
J. Atmos. Sci. 55, 820-834.
Marshall, J., A. Andersson, N. Bates, W. Dewar, S. Doney, J. Edson, R. Ferrari, G.
Forget, D. Fratantoni, M. Gregg, T. Joyce, K. Kelly, S. Lozier, R. Lumpkin, G. Maze, J.
Palter, R. Samelson, K. Silverthorne, E. Skyllingstad, F. Straneo, L. Talley, L. Thomas,
J. Toole and R. Weller, 2009. Observing the cycle of convection and restratification
over the Gulf Stream and the subtropical gyre of the North Atlantic Ocean: preliminary
results from the CLIMODE field campaign. Bull. Amer. Met. Soc. 90, 1337-1350.
Nakamura, H., T. Sampe, Y. Tanimoto, and A. Shimpo, 2004. Observed associations
among storm tracks, jet streams and midlatitude oceanic fronts. In Earth’s Climate:
The Ocean-Atmosphere Interaction, vol. 147 of AGU Geophysical Monograph Series.
pp. 329-345.
Nakamura, H., T. Sampe, A. Goto, W. Ohfuchi and S.-P. Xie, 2008. On the importance
of midlatitude oceanic frontal zones for the mean state and dominant variability in the
tropospheric circulation. Geophys. Res. Lett., 35, L15709, doi:10.1029/2008GL034010.
Paciorek, C. J., J. S. Risbey, V. Ventura, and R. D. Rosen, 2002. Multiple indices of
northern hemisphere cyclone activity, winters 1949-99. J. Climate, 15, 1573-1590.
Patoux, J., X. Yuan, and C. Li, 2009. Satellite-based midlatitude cyclone statistics over
the Southern Ocean: 1. Scatterometer-derived pressure fields and storm tracking. J.
Geophys. Res., 114, D04105, doi:10.1029/2008JD010873.
Sanders, F., 1986. Explosive cyclogenesis in the west-central North Atlantic ocean,
1981-84. Part I: composite structure and mean behavior. Mon. Weath. Rev., 114, 1791-
1794.
30
Sanders, F. and J. R. Gyakum, 1980. Synoptic-dynamic climatology of the ‘bomb’. Mon.
Weath. Rev., 108, 1589-1606.
Talley, L. D., 1996. North Atlantic circulation and variability, reviewed for the CNLS
conference. Physica D, 98, 625-646.
Vallis, G. K. and E. P. Gerber, 2008. Local and hemispheric dynamics of the North
Atlantic Oscillation, annular patterns and the zonal index. Dyn. Atmos. Oc. 44, 184-212.
Worthington, L. V., 1959. The 18 °C water in the Sargasso Sea. Deep Sea Research, 5,
297–305.
Yu, L., X. Jin and R. A. Weller, 2008. Multidecade global flux datasets from the
Objectively Analyzed air-sea Fluxes (OAFlux) project: latent and sensible heat fluxes,
ocean evaporation, and related surface meteorological variables. Technical report,
Woods Hole Oceanographic Institution, OAFlux Project Technical Report, OA-2008-
01, Woods Hole, MA.
Yuan, X, J. Patoux, and C. Li, 2009. Satellite-based midlatitude cyclone statistics over
the Southern Ocean: 2. Tracks and surface fluxes. J. Geophys. Res., 114, D04106,
doi:10.1029/2008JD010874.
Zolina, O. and S. K. Gulev, 2003. Synoptic variability of ocean-atmosphere turbulent
fluxes associated with atmospheric cyclones. J. Climate, 16, 2717-2734.
31
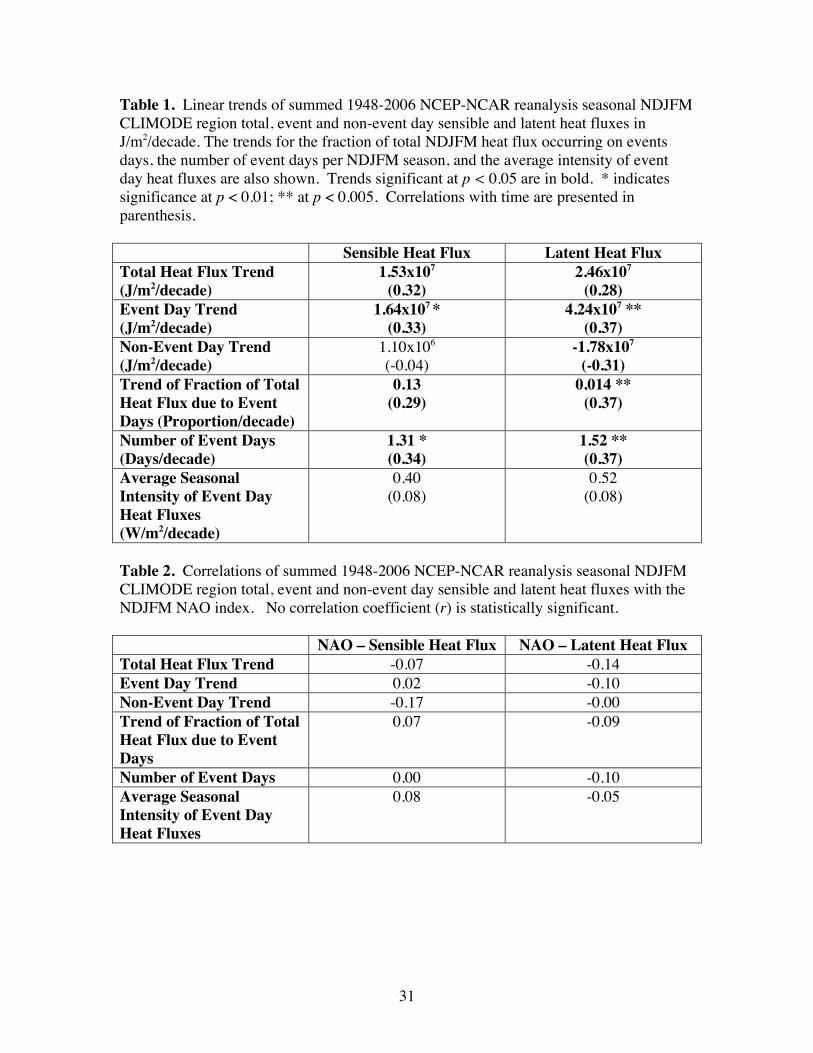
Table 1. Linear trends of summed 1948-2006 NCEP-NCAR reanalysis seasonal NDJFM CLIMODE region total, event and non-event day sensible and latent heat fluxes in J/m2/decade. The trends for the fraction of total NDJFM heat flux occurring on events days, the number of event days per NDJFM season, and the average intensity of event day heat fluxes are also shown. Trends significant at p < 0.05 are in bold. * indicates significance at p < 0.01; ** at p < 0.005. Correlations with time are presented in parenthesis. Sensible Heat Flux Latent Heat Flux Total Heat Flux Trend (J/m2/decade)
1.53x10⁷ (0.32)
2.46x10⁷ (0.28)
Event Day Trend (J/m2/decade)
1.64x107 * (0.33)
4.24x10⁷ ** (0.37)
Non-Event Day Trend (J/m2/decade)
1.10x10⁶ (-0.04)
-1.78x10⁷ (-0.31)
Trend of Fraction of Total Heat Flux due to Event Days (Proportion/decade)
0.13 (0.29)
0.014 ** (0.37)
Number of Event Days (Days/decade)
1.31 * (0.34)
1.52 ** (0.37)
Average Seasonal Intensity of Event Day Heat Fluxes (W/m2/decade)
0.40 (0.08)
0.52 (0.08)
Table 2. Correlations of summed 1948-2006 NCEP-NCAR reanalysis seasonal NDJFM CLIMODE region total, event and non-event day sensible and latent heat fluxes with the NDJFM NAO index. No correlation coefficient (r) is statistically significant. NAO – Sensible Heat Flux NAO – Latent Heat Flux Total Heat Flux Trend -0.07 -0.14 Event Day Trend 0.02 -0.10 Non-Event Day Trend -0.17 -0.00 Trend of Fraction of Total Heat Flux due to Event Days
0.07 -0.09
Number of Event Days 0.00 -0.10 Average Seasonal Intensity of Event Day Heat Fluxes
0.08 -0.05
32
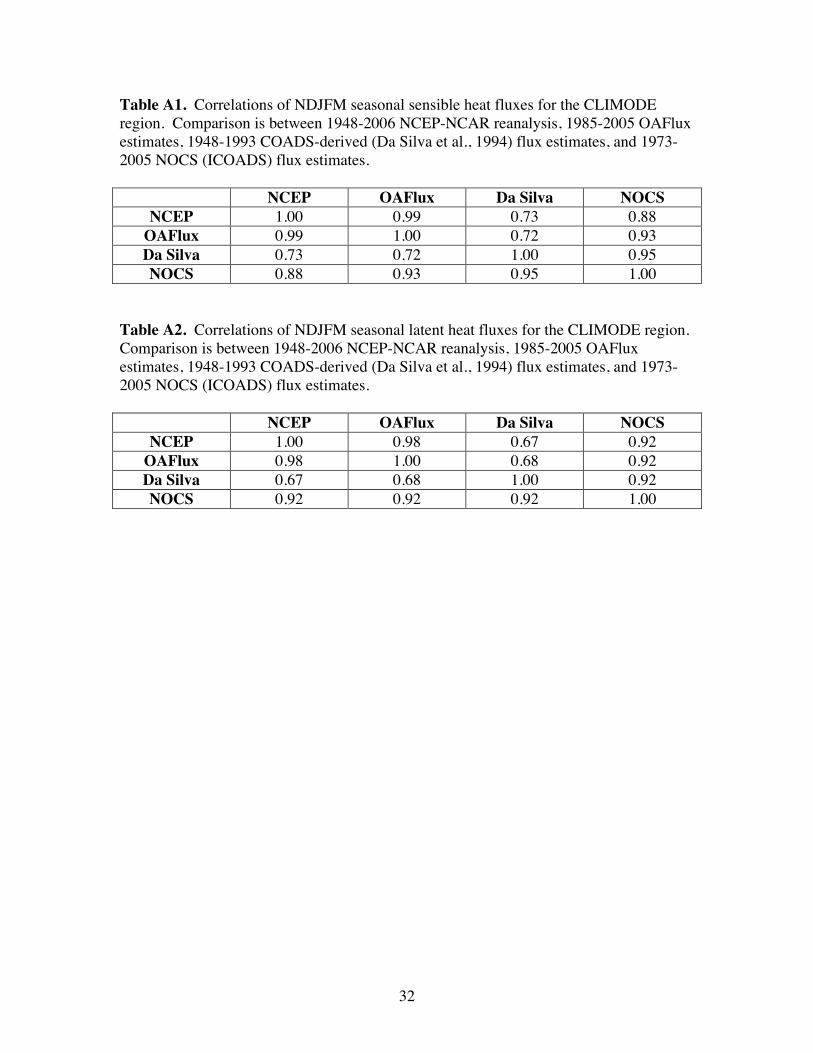
Table A1. Correlations of NDJFM seasonal sensible heat fluxes for the CLIMODE region. Comparison is between 1948-2006 NCEP-NCAR reanalysis, 1985-2005 OAFlux estimates, 1948-1993 COADS-derived (Da Silva et al., 1994) flux estimates, and 1973-2005 NOCS (ICOADS) flux estimates. NCEP OAFlux Da Silva NOCS
NCEP 1.00 0.99 0.73 0.88 OAFlux 0.99 1.00 0.72 0.93 Da Silva 0.73 0.72 1.00 0.95 NOCS 0.88 0.93 0.95 1.00
Table A2. Correlations of NDJFM seasonal latent heat fluxes for the CLIMODE region. Comparison is between 1948-2006 NCEP-NCAR reanalysis, 1985-2005 OAFlux estimates, 1948-1993 COADS-derived (Da Silva et al., 1994) flux estimates, and 1973-2005 NOCS (ICOADS) flux estimates. NCEP OAFlux Da Silva NOCS
NCEP 1.00 0.98 0.67 0.92 OAFlux 0.98 1.00 0.68 0.92 Da Silva 0.67 0.68 1.00 0.92 NOCS 0.92 0.92 0.92 1.00
33
Figure Captions
Figure 1. a) Plot of average daily 1948-2007 NCEP-NCAR reanalysis sensible heat flux
for the CLIMODE region. b) histogram of the number of 'event days' per November-
March (NDJFM) season, defined as days during which the average sensible heat fluxes
exceeds 100W/m2. b) histogram of the fraction of total NDJFM sensible heat flux each
season occurring during event days. d) histogram of the duration in days of each sensible
heat flux event for NDJFM 1948-2007. e) daily sensible heat fluxes for the CLIMODE
region during 2003 and 2004 (year defined by November); the dotted line shows event
day threshold 100W/m2.
Figure 2. Same as Figure 1, but for latent heat flux. ‘Event days’ defined as days
during which the average latent heat fluxes exceeds 250W/m2.
Figure 3. a) Composites of 1948-2007 NCEP-NCAR reanalysis NDJFM CLIMODE
region event days (daily surface sensible heat flux >100W/m2) minus non-event days
(daily surface sensible heat flux ≤100W/m2) for the field of surface temperature. Contour
intervals are 1K; negative contours are dashed. The -0.5K contour (dashed and bold) is
also shown. The dash-dot box delineates the CLIMODE region. b) As a), but for
1000hPa geopotential. Contour intevals are 10 m2/s; negative contours are dashed. c)
Average 1000hPa geopotential for all 1948-2007 NDJFM event days. Contour intervals
are 40 m2/s; the zero contour is dashed. d) As for c), but for non-event days. e) As for a),
but for surface sensible heat flux. Contour intervals are 40 W/m2, the zero contour is
dashed. f) As for a), but for 850hPa wind.
34
Figure 4. As for Figure 3, but for a), c), e) vertically-advected moisture and b), d), f)
temperature at 1000, 500 and 200hPa. Contour intervals are a), c)
€
5 ×10⁻⁵ kg kghPa
s
,
e)
€
1×10⁻⁵ kgkg
hPas
, and b), d) f) 1K. Negative contours are dashed.
Figure 5. Lagged event day composites of 1000hPa temperature from 2 days prior (t-2)
to 2 days after (t+2) defined sensible heat flux event days.
Figure 6. Time series of 1948-2006 NCEP-NCAR reanalysis NDJFM integrated
seasonal heat fluxes. Upper left: time series of seasonal event day (‘x’ line), total (event
day and non-event day; solid line), and non-event day (‘o’ line) sensible heat fluxes.
Upper right: time series of fraction of the total seasonal sensible heat flux due to event
day fluxes. Lower row: same as upper row but for latent heat fluxes. Calculations were
made using daily reanalysis.
Figure 7. As for Figure 6 but for 1985-2005 NDFJM OAFlux project heat fluxes.
Figure 8. Trends and correlations with time of 1949-2007 seasonal (NDJFM) NCEP-
NCAR reanalysis fields. Trends (in W/m2/decade) for: a) sensible heat flux; b) latent
heat flux. Correlations with time of: c) surface temperature; d) 2-meter above ground
temperature. Trends (K/decade) for: e) surface temperature; f) 2-meter above ground
temperature. Calculations were made using monthly reanalysis. The thick black line is
35
the zero correlation (r = 0) contour (c-d) and the zero slope contour (e-f). Only trends
significant at the 90% level are shown.
Figure 9. Trend of 1948-2007 NDJFM NCEP-NCAR reanalysis daily meridional wind
variance. Units are m2/s2/decade. The field was calculated using daily reanalysis.
Regions significant at the 95% level (p < 0.05) are dotted with black circles.
Figure 10. 1948-2007 NDJFM NCEP-NCAR reanalysis climatologies of: left) 850hPa
8-day high-pass filtered
€
′ v ′ T ; right) 700hPa Eady growth rate maximum. Units are
€
mKs
and day-1. Fields were calculated using daily reanalysis.
Figure 11. 1948-2007 NDJFM NCEP-NCAR reanalysis seasonal trends of: top) 850hPa
8-day high-pass filtered
€
′ v ′ T (
€
mK /s /decade); middle) 700hPa 8-day high-pass filtered
€
′ v ′ T (
€
mK /s /decade); bottom) 700hPa Eady growth rate maximum (day-1/decade). Fields
were calculated using daily reanalysis. Regions significant at the 95% level (p < 0.05)
are dotted with black circles.
Figure 12. 1948-2007 NDJFM NCEP-NCAR reanalysis trends of: top) 700hPa Brunt-
Väisälä frequency (s-1/decade); bottom) 700hPa wind shear (s-1/decade). Fields were
calculated using daily reanalysis. Regions significant at the 95% level (p < 0.05) are
dotted with black circles.
36
Figure 13. 1949-2007 NDJFM NCEP-NCAR reanalysis trend of the difference between
surface and 2-meter temperature. Units are K/decade. The field was calculated using
monthly reanalysis. Only trends significant at the 95% level (p < 0.05) are shown.
Figure A1. Time series of the National Oceanography Center, Southampton (NOCS)
Surface Flux Dataset v2.0 heat flux data. Top left) 1973-2005 NDJFM sensible heat flux
time series; top right) 1973-2005 NDJFM latent heat flux time series. Bottom left)
sensible heat flux error time series; bottom right) latent heat flux error time series. Linear
trend slope estimates are shown in the legend of each panel.
37
Figure 1. a) Plot of average daily 1948-2007 NCEP-NCAR reanalysis sensible heat flux for the CLIMODE region. b) histogram of the number of 'event days' per November-March (NDJFM) season, defined as days during which the average sensible heat fluxes exceeds 100W/m2. c) histogram of the fraction of total NDJFM sensible heat flux each season occurring during event days. d) histogram of the durations in days of each sensible heat flux event for NDJFM 1948-2007. e) daily sensible heat fluxes for the CLIMODE region during 2003 and 2004 (year defined by November); the dotted line shows event day threshold 100W/m2.
38
Figure 2. Same as Figure 1, but for latent heat flux. ‘Event days’ defined as days during which the average latent heat fluxes exceeds 250W/m2.
39
Figure 3. a) Composites of 1948-2007 NCEP-NCAR reanalysis NDJFM CLIMODE region event days (daily surface sensible heat flux >100W/m2) minus non-event days (daily surface sensible heat flux ≤100W/m2) for the field of surface temperature. Contour intervals are 1K; negative contours are dashed. The -0.5K contour (dashed and bold) is also shown. The dash-dot box delineates the CLIMODE region. b) As a), but for 1000hPa geopotential. Contour intevals are 10 m2/s; negative contours are dashed. c) Average 1000hPa geopotential for all 1948-2007 NDJFM event days. Contour intervals are 40 m2/s; the zero contour is dashed. d) As for c), but for non-event days. e) As for a), but for surface sensible heat flux. Contour intervals are 40 W/m2, the zero contour is dashed. f) As for a), but for 850hPa wind.
40
Figure 4. As for Figure 3, but for a), c), e) vertically-advected moisture and b), d), f)
temperature at 1000, 500 and 200hPa. Contour intervals are a), c)
€
5 ×10⁻⁵ kg kghPa
s
,
e)
€
1×10⁻⁵ kgkg
hPas
, and b), d) f) 1K. Negative contours are dashed.
41
Figure 5. Lagged event day composites of 1000hPa temperature from 2 days prior (t-2) to 2 days after (t+2) defined sensible heat flux event days.
42
Figure 6. Time series of 1948-2006 NCEP-NCAR reanalysis NDJFM integrated seasonal heat fluxes. Upper left: time series of seasonal event day (‘x’ line), total (event day and non-event day; solid line), and non-event day (‘o’ line) sensible heat fluxes. Upper right: time series of fraction of the total seasonal sensible heat flux due to event day fluxes. Lower row: same as upper row but for latent heat fluxes.
43
Figure 7. As for Figure 6 but for 1985-2005 NDFJM OAFlux project heat fluxes.
44
Figure 8. Trends and correlations with time of 1949-2007 seasonal (NDJFM) NCEP-NCAR reanalysis fields. Trends (W/m2/decade) for: a) sensible heat flux; b) latent heat flux. Correlations with time of: c) surface temperature; d) 2-meter above ground temperature. Trends (K/decade) for: e) surface temperature; f) 2-meter above ground temperature. Calculations were made using monthly reanalysis. The thick black line is the zero correlation (r = 0) contour (c-d) and the zero slope contour (e-f). Only trends significant at the 90% level are shown.
45
Figure 9. Trend of 1948-2007 NDJFM NCEP-NCAR reanalysis daily meridional wind variance. Units are m2/s2/decade. The field was calculated using daily reanalysis. Regions significant at the 95% level (p < 0.05) are dotted with black circles.
46
Figure 10. 1948-2007 NDJFM NCEP-NCAR reanalysis climatologies of: left) 850hPa 8-day high-pass filtered
€
′ v ′ T ; right) 700hPa Eady growth rate maximum. Units are
€
mKs
and day-1. Fields were calculated using daily reanalysis.
47
Figure 11. 1948-2007 NDJFM NCEP-NCAR reanalysis seasonal trends of: top) 850hPa 8-day high-pass filtered
€
′ v ′ T (
€
mK /s /decade); middle) 700hPa 8-day high-pass filtered
€
′ v ′ T (
€
mK /s /decade); bottom) 700hPa Eady growth rate maximum (day-1/decade). Fields were calculated using daily reanalysis. Regions significant at the 95% level (p < 0.05) are dotted with black circles.
48
Figure 12. 1948-2007 NDJFM NCEP-NCAR reanalysis trends of: top) 700hPa Brunt-Väisälä frequency (s-1/decade); bottom) 700hPa wind shear (s-1/decade). Fields were calculated using daily reanalysis. Regions significant at the 95% level (p < 0.05) are dotted with black circles.
49
Figure 13. 1949-2007 NDJFM NCEP-NCAR reanalysis trend of the difference between surface and 2-meter temperature. Units are K/decade. The field was calculated using monthly reanalysis. Only trends significant at the 95% level (p < 0.05) are shown.
50
Figure A1. Time series of the National Oceanography Center, Southampton (NOCS) Surface Flux Dataset v2.0 heat flux data. Top left) 1973-2005 NDJFM sensible heat flux time series; top right) 1973-2005 NDJFM latent heat flux time series. Bottom left) sensible heat flux error time series; bottom right) latent heat flux error time series. Linear trend slope estimates are shown in the legend of each panel.


