July 2018
Air Quality and Dust Monitoring Monthly Report – June 2018
City of Westminster
© HS2 Ltd. gov.uk/hs2
High Speed Two (HS2) Limited, Two Snowhill Snow Hill Queensway Birmingham B4 6GA
Telephone: 08081 434 434
General email enquiries: [email protected]
Website: www.gov.uk/hs2
A report prepared by Costain Skanska on behalf of HS2 Ltd.
High Speed Two (HS2) Limited has been tasked by the Department for Transport (DfT) with managing the delivery of a new national high speed rail network. It is a non-departmental public body wholly owned by the DfT.
High Speed Two (HS2) Limited has actively considered the needs of blind and partially sighted people in accessing this document. The text will be made available in full on the HS2 website. The text may be freely downloaded and translated by individuals or organisations for conversion into other accessible formats. If you have other needs in this regard please contact High Speed Two (HS2) Limited.
© High Speed Two (HS2) Limited, 2018, except where otherwise stated.
Copyright in the typographical arrangement rests with High Speed Two (HS2) Limited.
This information is licensed under the Open Government Licence v2.0. To view this licence, visit www.nationalarchives.gov.uk/doc/open-government-licence/ version/2 or write to the Information Policy Team, The National Archives, Kew, London TW9 4DU, or e-mail: [email protected]. Where we have identified any third-party copyright information you will need to obtain permission from the copyright holders concerned.
Printed in Great Britain on paper containing at least 75% recycled fibre.
Air Quality and Dust Monitoring Summary Report, June 2018
City of Westminster
Page 1
Monthly Summary 1.1.1 This Summary Report is published in fulfilment of commitments detailed in the High Speed
Rail (London-West Midlands) Environmental Minimum Requirements, Annex 1: Code of
Construction Practice, for the nominated undertaker to present the results of air quality
monitoring undertaken in the City of Westminster (CoW) during May 2018.
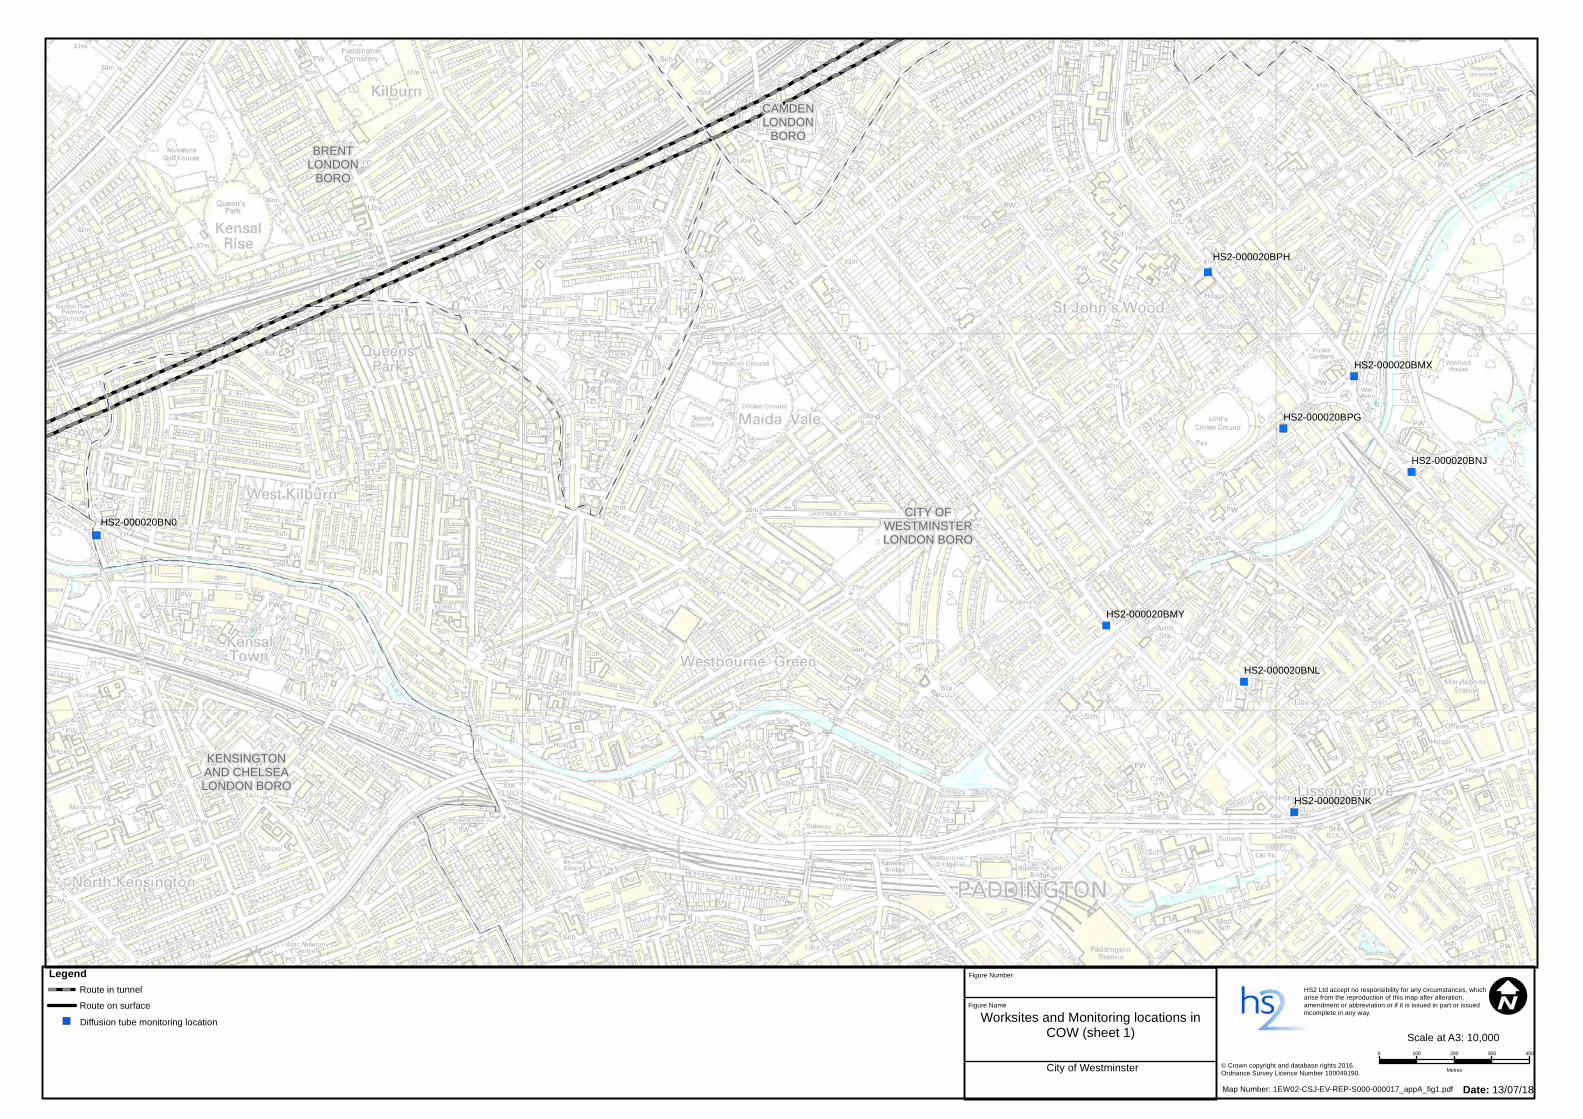
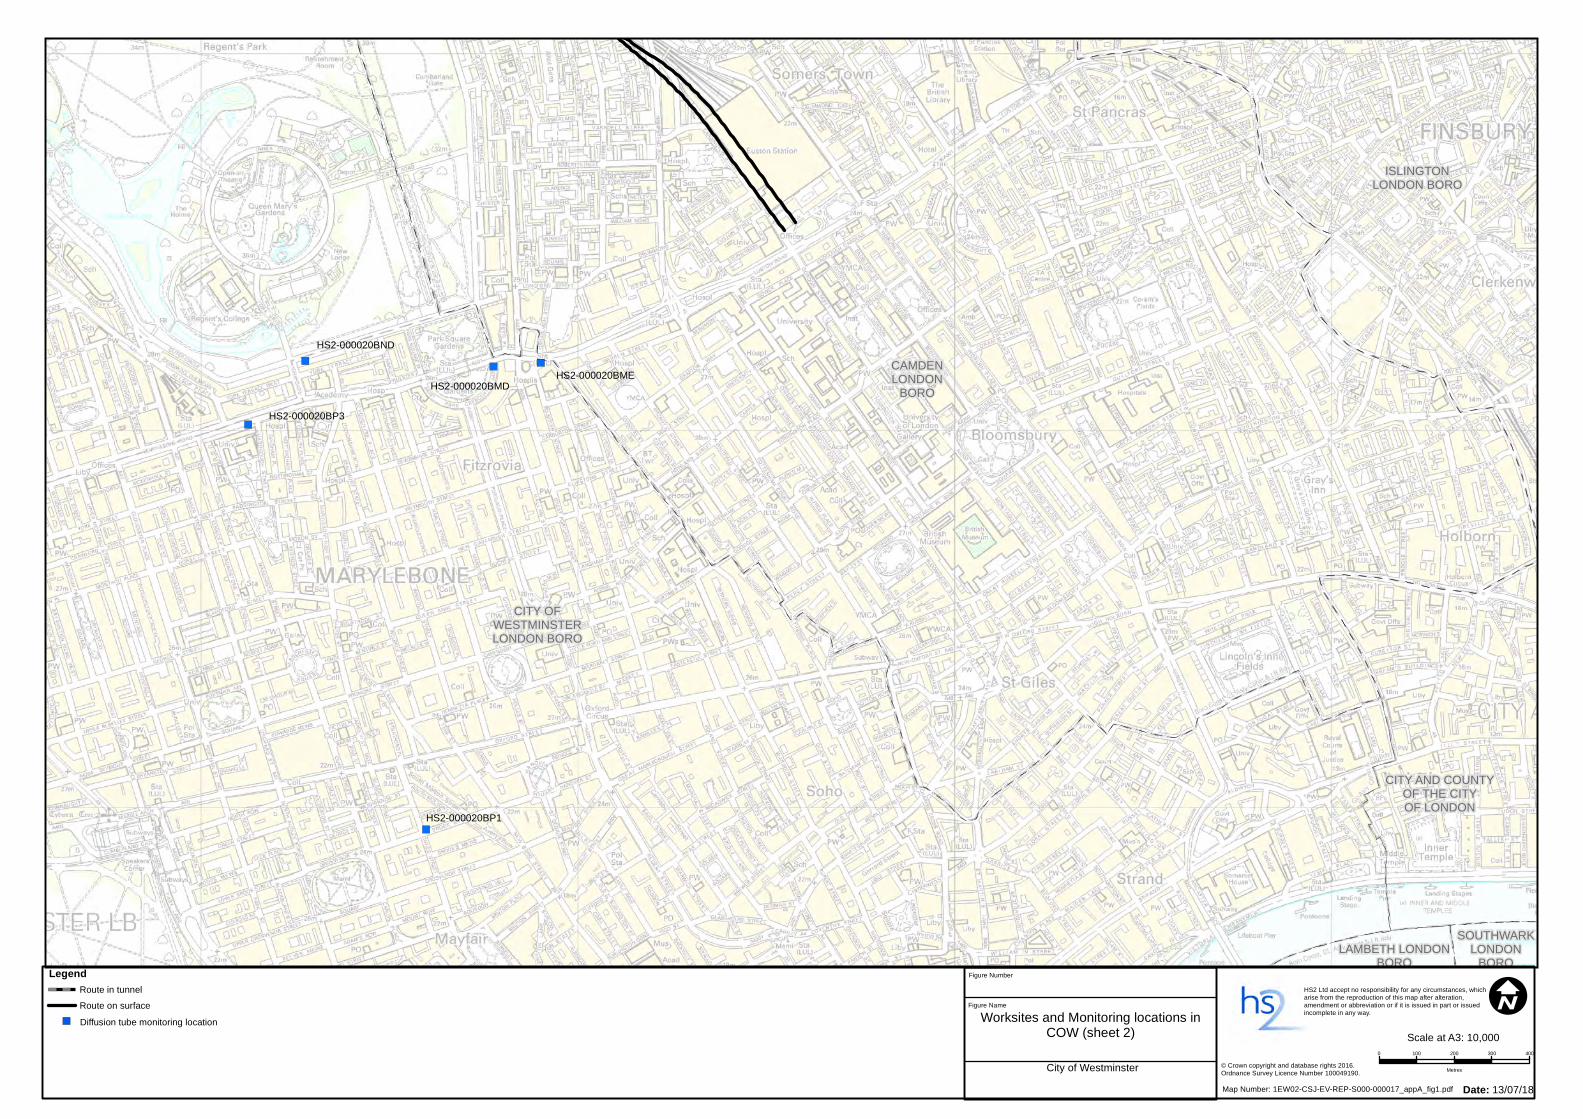
1.1.2 Figure 1 and Figure 2 in Appendix A indicate the current air quality monitoring locations.
1.1.3 This summary should be read in conjunction with the overview monitoring report available
from www.gov.uk/government/collections/monitoring-the-environmental-effects-of-hs2,
which highlights: the applicable standards and guidance, as well as the air quality and dust
monitoring methodologies to be implemented by nominated undertakers throughout
construction.
1.1.4 There are no current worksites located within the CoW. Therefore, no dust monitoring has
been carried out.
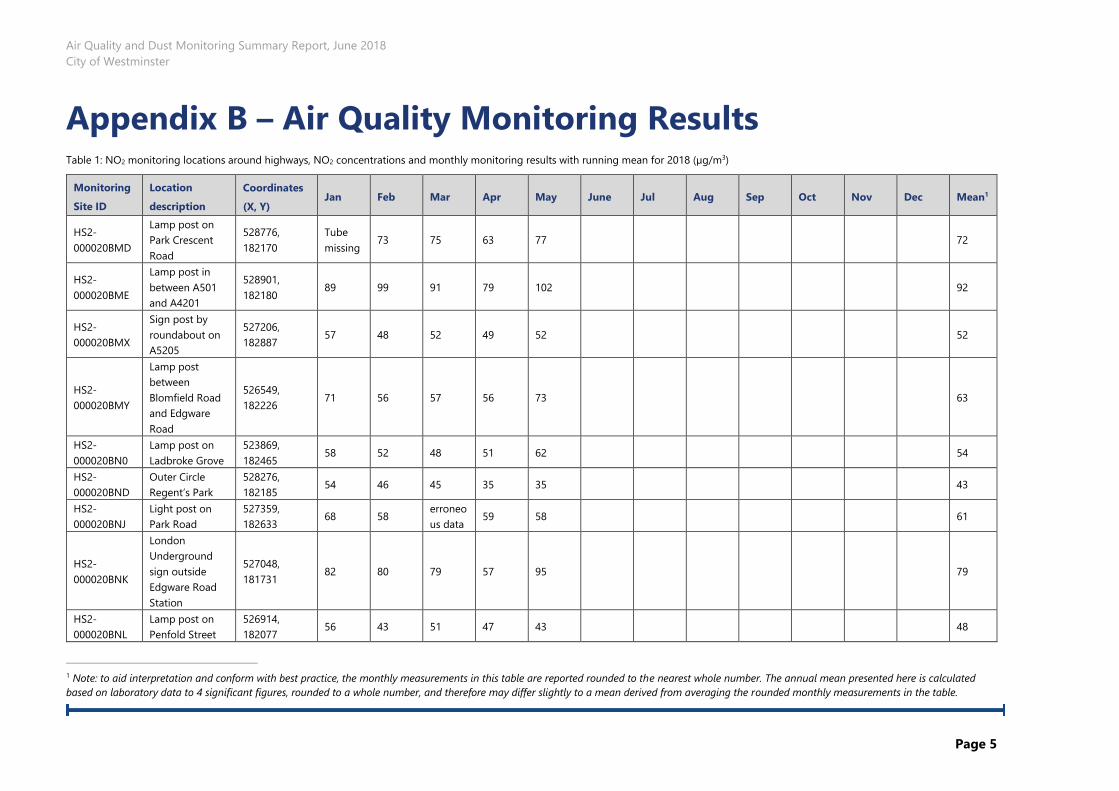
1.1.5 Diffusion tube monitoring of Nitrogen Dioxide (NO2) was undertaken at thirteen (13) locations
in May 2018, around highways within the CoW as part of the management of air quality where
significant effects may occur as a result of the scheme.
1.1.6 Diffusion tube monitoring results are provided from the laboratory analysis, and therefore still
require various analysis and adjustments to be undertaken. Final corrected results will be
presented and described in the annual report. However, based on the results to date, no
unexpected values were recorded during the monitoring period.
1.1.7 NO2 monitoring locations and results are presented in Appendix B, Table 1, together with the
2018 running mean.
1.1.8 There were no complaints received, relating to air quality, during this monitoring period.
Air Quality and Dust Monitoring Summary Report, June 2018
City of Westminster
Page 2
Appendix A –Monitoring Locations
") ")
")
")
")
")
")
")
")
")
")
")
")
HS2-000020BMX
HS2-000020BMY
HS2-000020BN0
HS2-000020BNJ
HS2-000020BNK
HS2-000020BNL
HS2-000020BPG
HS2-000020BPH
BRENTLONDON
BORO
KENSINGTONAND CHELSEALONDON BORO
CITY OFWESTMINSTERLONDON BORO
CAMDENLONDON
BORO
0 100 200 300 400
Metres
I
Map Number: 1EW02-CSJ-EV-REP-S000-000017_appA_fig1.pdf
© Crown copyright and database rights 2016.Ordnance Survey Licence Number 100049190.
Date: 13/07/18
Figure Name
Figure Number
Worksites and Monitoring locations inCOW (sheet 1) Scale at A3: 10,000
City of Westminster
LegendRoute in tunnelRoute on surface
HS2 Ltd accept no responsibility for any circumstances, whicharise from the reproduction of this map after alteration,amendment or abbreviation or if it is issued in part or issuedincomplete in any way.
Diffusion tube monitoring location")
") ")
")
")
")
")
")
")
")
")
")
")
")
HS2-000020BMDHS2-000020BME
HS2-000020BND
HS2-000020BP1
HS2-000020BP3
LAMBETH LONDONBORO
SOUTHWARKLONDON
BORO
CITY OFWESTMINSTERLONDON BORO
CAMDENLONDON
BORO
ISLINGTONLONDON BORO
CITY AND COUNTYOF THE CITYOF LONDON
0 100 200 300 400
Metres
I
Map Number: 1EW02-CSJ-EV-REP-S000-000017_appA_fig1.pdf
© Crown copyright and database rights 2016.Ordnance Survey Licence Number 100049190.
Date: 13/07/18
Figure Name
Figure Number
Worksites and Monitoring locations inCOW (sheet 2) Scale at A3: 10,000
City of Westminster
LegendRoute in tunnelRoute on surface
HS2 Ltd accept no responsibility for any circumstances, whicharise from the reproduction of this map after alteration,amendment or abbreviation or if it is issued in part or issuedincomplete in any way.
Diffusion tube monitoring location")
Air Quality and Dust Monitoring Summary Report, June 2018
City of Westminster
Page 5
Appendix B – Air Quality Monitoring Results Table 1: NO2 monitoring locations around highways, NO2 concentrations and monthly monitoring results with running mean for 2018 (µg/m3)
Monitoring
Site ID
Location
description
Coordinates
(X, Y) Jan Feb Mar Apr May June Jul Aug Sep Oct Nov Dec Mean1
HS2-
000020BMD
Lamp post on
Park Crescent
Road
528776,
182170
Tube
missing 73 75 63 77 72
HS2-
000020BME
Lamp post in
between A501
and A4201
528901,
182180 89 99 91 79 102 92
HS2-
000020BMX
Sign post by
roundabout on
A5205
527206,
182887 57 48 52 49 52 52
HS2-
000020BMY
Lamp post
between
Blomfield Road
and Edgware
Road
526549,
182226 71 56 57 56 73 63
HS2-
000020BN0
Lamp post on
Ladbroke Grove
523869,
182465 58 52 48 51 62 54
HS2-
000020BND
Outer Circle
Regent’s Park
528276,
182185 54 46 45 35 35 43
HS2-
000020BNJ
Light post on
Park Road
527359,
182633 68 58
erroneo
us data 59 58 61
HS2-
000020BNK
London
Underground
sign outside
Edgware Road
Station
527048,
181731 82 80 79 57 95 79
HS2-
000020BNL
Lamp post on
Penfold Street
526914,
182077 56 43 51 47 43 48
1 Note: to aid interpretation and conform with best practice, the monthly measurements in this table are reported rounded to the nearest whole number. The annual mean presented here is calculated
based on laboratory data to 4 significant figures, rounded to a whole number, and therefore may differ slightly to a mean derived from averaging the rounded monthly measurements in the table.
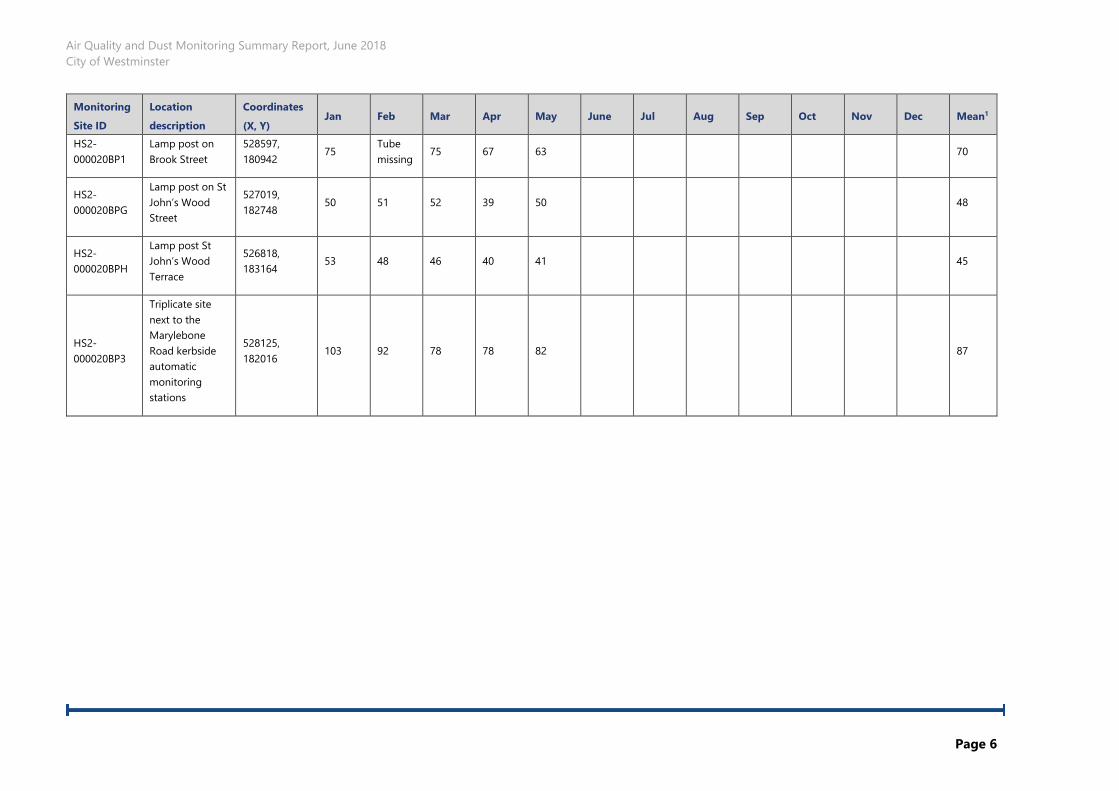
Air Quality and Dust Monitoring Summary Report, June 2018
City of Westminster
Page 6
Monitoring
Site ID
Location
description
Coordinates
(X, Y) Jan Feb Mar Apr May June Jul Aug Sep Oct Nov Dec Mean1
HS2-
000020BP1
Lamp post on
Brook Street
528597,
180942 75
Tube
missing 75 67 63 70
HS2-
000020BPG
Lamp post on St
John’s Wood
Street
527019,
182748 50 51 52 39 50 48
HS2-
000020BPH
Lamp post St
John’s Wood
Terrace
526818,
183164 53 48 46 40 41 45
HS2-
000020BP3
Triplicate site
next to the
Marylebone
Road kerbside
automatic
monitoring
stations
528125,
182016 103 92 78 78 82 87


