Financial Literacy, Financial Education and Pension Investments in the U.S.
Julie Agnew Director of the Boehly Center for Excellence in Finance
Associate Professor of Finance and Economics The Mason School of Business
The College of William and Mary
Prepared for the 2015 OECD/Japan High Level Symposium Promoting Better Lifetime Planning Through Financial Education
January 22, 2015
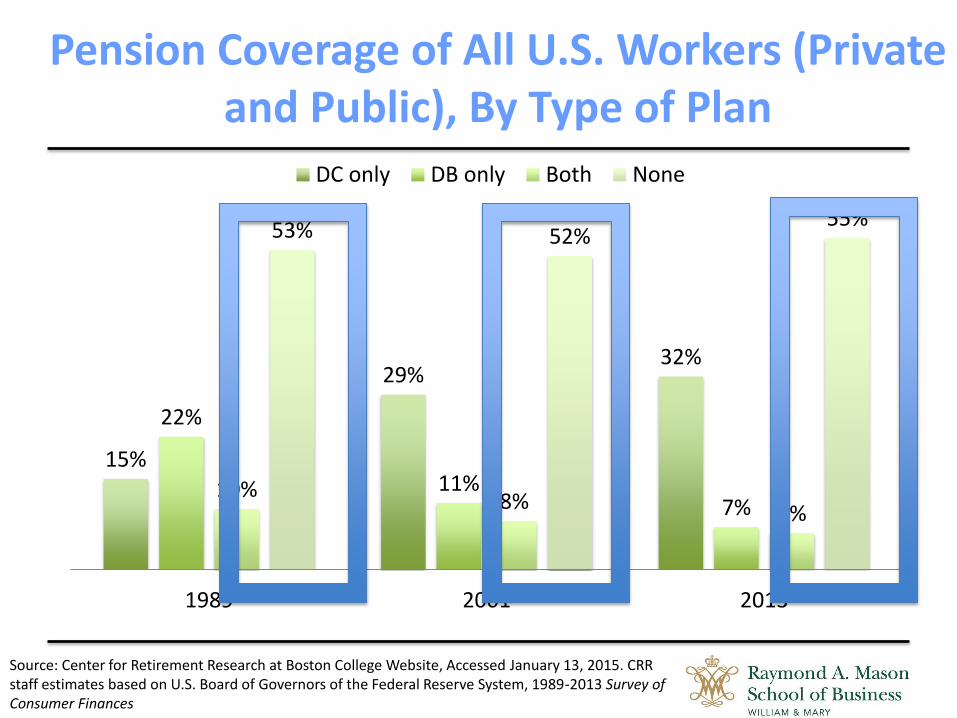
Pension Coverage of All U.S. Workers (Private and Public), By Type of Plan
15%
29% 32%
22%
11% 7%
10% 8%
6%
53% 52% 55%
1989 2001 2013
DC only DB only Both None
Source: Center for Retirement Research at Boston College Website, Accessed January 13, 2015. CRR staff estimates based on U.S. Board of Governors of the Federal Reserve System, 1989-2013 Survey of Consumer Finances

Percentage in DC Plans Increasing
15%
29% 32%
22%
11% 7%
10% 8%
6%
53% 52% 55%
1989 2001 2013
DC only DB only Both None
Source: Center for Retirement Research at Boston College Website, Accessed January 13, 2015. CRR staff estimates based on U.S. Board of Governors of the Federal Reserve System, 1989-2013 Survey of Consumer Finances

Consequence of U.S. Shift in Pensions
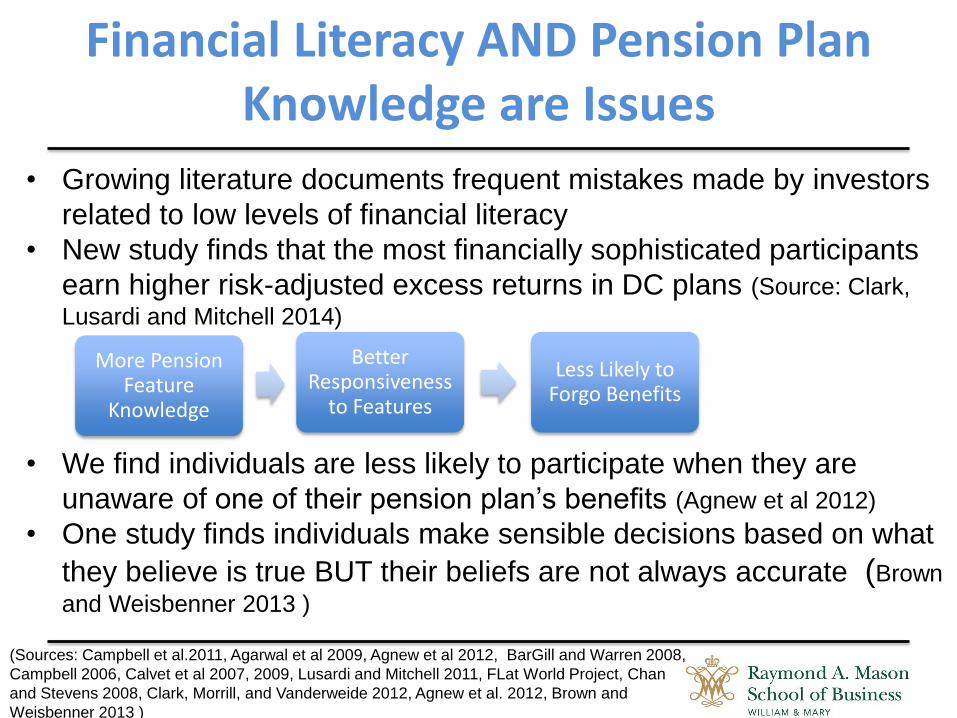
Financial Literacy AND Pension Plan Knowledge are Issues
• Growing literature documents frequent mistakes made by investors
related to low levels of financial literacy
• New study finds that the most financially sophisticated participants
earn higher risk-adjusted excess returns in DC plans (Source: Clark,
Lusardi and Mitchell 2014)
• We find individuals are less likely to participate when they are
unaware of one of their pension plan’s benefits (Agnew et al 2012)
• One study finds individuals make sensible decisions based on what
they believe is true BUT their beliefs are not always accurate (Brown
and Weisbenner 2013 )
(Sources: Campbell et al.2011, Agarwal et al 2009, Agnew et al 2012, BarGill and Warren 2008,
Campbell 2006, Calvet et al 2007, 2009, Lusardi and Mitchell 2011, FLat World Project, Chan
and Stevens 2008, Clark, Morrill, and Vanderweide 2012, Agnew et al. 2012, Brown and
Weisbenner 2013 )
More Pension Feature
Knowledge
Better Responsiveness
to Features
Less Likely to Forgo Benefits

“This is how I felt when the market started to crash. I felt like I had a knife to my throat. I was in the hands of other people and I felt totally powerless.” (Male, Unaware)
“I feel like him – if I make the wrong choice, I’m going to be hurting myself, cutting myself, losing a lot. But I can’t tell which choices are right and which are wrong. It’s very scary. I’d like to be able to understand what’s going on but I just don’t.” (Female, Unaware)
“I think the barber represents the managers who are doing your mutual funds. You are the guy in the seat and that blade is kind of like them managing your money: if he’s good at it, then you will get a good shave. But if he’s not so good, you might have some nicks there. And that makes me feel uneasy – how that shave turns out is completely out of my control.” (Male, Unaware)
Another Issue: Feelings about Retirement Decisions
Source: Agnew, Szykman, Utkus and Young (2013)

Possible Ways to Improve Pension Decisions
Choice Architecture: Retirement Plan Design
Regulation
Communication Methods
Behavioral Interventions
Financial Education
Financial Advisers

Example of Choice Architecture
Company Hire Date Before Automatic Enrollment
Hire Date After Automatic Enrollment
B 26.4% 93.4%
C 35.7% 85.9%
D 42.5% 96.0%
Participation Rates for Three Companies: 6 Months Tenure
Source: Table 3, Choi, Laibson, Madrian and Metrick (2006)

Is There a Downside?
“401(k) Law Suppresses Saving for Retirement” by Anne Tergesen July 7, 2011 Wall Street Journal
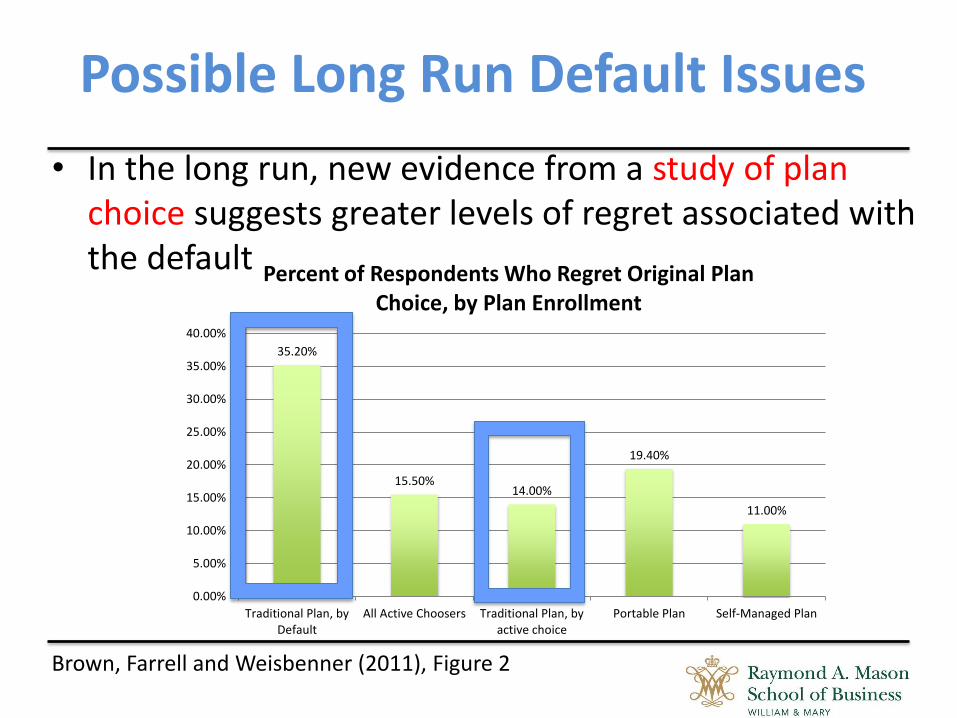
Possible Long Run Default Issues
• In the long run, new evidence from a study of plan choice suggests greater levels of regret associated with the default
35.20%
15.50% 14.00%
19.40%
11.00%
0.00%
5.00%
10.00%
15.00%
20.00%
25.00%
30.00%
35.00%
40.00%
Traditional Plan, byDefault
All Active Choosers Traditional Plan, byactive choice
Portable Plan Self-Managed Plan
Percent of Respondents Who Regret Original Plan Choice, by Plan Enrollment
Brown, Farrell and Weisbenner (2011), Figure 2

• Experimental study found that those with lower financial
literacy were more likely to invest in the default asset
allocation option than others
20%
2%
0%
5%
10%
15%
20%
25%
Low Financial Literacy High Financial Literacy
% Defaulted
Who Defaults?
Source: Agnew and Szykman (2005)

Additional Evidence
Returning to the study of plan choice (DB, DC, or Hybrid), the likelihood of defaulting into the DB plan is related to basic financial literacy, plan knowledge and information problems.
Source: Brown, Farrell and Weisbenner (2011)
16.06%
14.90%
-2.40%
-6.40%
-3.40%
-10.00% -5.00% 0.00% 5.00% 10.00% 15.00% 20.00%
Found system information unhelpful
Lack of awareness of plan default…
Have basic plan knowledge
Have advanced plan knowledge
Have basic financial knowledge
Probability of Defaulting

• In a large scale experiment, we examined the choice between
an annuity and a lump sum
• We found that individuals that experienced information
overload were 30 percent less likely to feel confident about
their choice
What about Communicating More Information?
Source: Agnew and Szykman (2011)

• Controlling for final payouts, those with more information
overload were also less likely to be satisfied with their decision
when the game was complete
• Those with low financial literacy are more likely to be
overwhelmed by the information presented to them
Long-Run Satisfaction
Source: Agnew and Szykman (2011)

• In a new experimental study conducted in Australia, we found that
individuals were more likely to follow advice from advisers with
credentials
• Individuals could be easily manipulated to follow bad advice on
complicated topics
• While credentials might be useful signals, many participants could not
accurately tell real credentials from fake ones
– 2 of the top 3 chosen from a list were fake
• Outstanding question: Can financial literacy/education make
individuals less susceptible to manipulation and more aware of false
credentials?
What about Financial Advice?
Source: Agnew et al. 2014

Bottom Line: Financial Education Essential
Choice Architecture: Retirement Plan Design
Regulation
Communication Methods
Behavioral Interventions
Financial Education
Financial Advisers

Most Common Primary Reason
for Providing Plan Education
① Increase Participation (25.5%)
② Retirement Planning (20.2%)
③ Increase Deferrals (16.1%)
④ Increase Appreciation for the
Plan (14.8%)
Financial Education in Sample of US DC Private Plans
Most Common Type of
Education Approaches
①Enrollment Kit (63.6 %)
②E-mail (60.3%)
③Internet/Intranet Sites
(57.4%)
④Fund Performance
Sheets (43.4%)
⑤Seminars/Workshops
(41.2%)
PCSA’s 57th Annual Survey of Profit Sharing and 401(k) Plans Released, December 2014 Surveyed 613 plans (8 million participants, $832 Billion in Assets)
54% of plans evaluate the success of education programs

How Should Success Be Measured? Intentions vs Actions
14% 15%10%
36%
47%
100%
0%
25%
50%
75%
100%
Plan to
Join
Join Plan to
Change
Fund
Change
Fund
Plan to
Change
Allocation
Change
Allocation
Source: Choi, Laibson, Madrian and Shea [2001]
Source : Choi, Laibson, Madrian and Metrick (2002)

19
Some Methods for Measuring Success in US Government Plans
Source: Agnew and Hurwitz 2014 Survey, 21 DC and Hybrid plans representing 80% of the 25 possible. These figures based on 17 plans that measure success
National Public Pension Plan Financial Education Survey 2012
0% 10% 20% 30% 40% 50% 60% 70% 80% 90%
Receive assessment from independent…
Perform experimental field studies
Follow participant investment behavior…
Track default rate
Collect ratings from participants
Count unique visits to website or online…
Track attendance
Administer surveys to participants
12%
12%
35%
41%
47%
59%
88%
88%
Tips for Pension Education from the U.S. Experience
• Tip 1: Broadly define financial literacy to include knowledge of pension features
• Tip 2: Recognize that financial literacy and education are needed even in carefully designed pension plans
– Studies show potential issues related to the use of defaults, communication and financial advisers alone
– Information overload and financial literacy are related
• Tip 3: Carefully evaluate education programs
– Examine participant actions not intentions
– Learn from medical research and use randomized controlled experiments to test financial education efficacy


