
Agenda
I. Club Mission & History
II. Structure & Operations
III. Performance
IV. Membership
V. Contact Information

Club Mission & History
Section I
Origins • Established in order to supplement undergraduate
investment education and to achieve consistent annual returns
• Founded in September 2009
• Club meetings held concurrently with Finance 365: Advanced Investment Management • Professor Mark Fedenia acts as faculty advisor
Clu
b M
issi
on
& H
isto
ry

Formation • Many possibilities were explored
• Institutional investment accounts • Separate individual brokerage accounts
• AUM entirely funded by club members
• Voting allows for equal say from all members
• Two-tier voting procedure mimics top investment firms
• Ideas filter through collective analyst opinions to elected portfolio managers
Clu
b M
issi
on
& H
isto
ry

Operations & Structure
Section II
Club Structure: Administrative • The Capital Management Club is an LLC registered in the
state of Wisconsin
• Scottrade is our online brokerage firm • $7.00 a trade + 50 free trades from the outset
• Bivio is our accounting software
• Provides daily reconciliations with Scottrade including dividends and short interest
• Keeps track of membership units and allows for easy distributions of capital
• One click tax form preparation
Op
era
tio
ns
& S
tru
ctu
re

Club Structure: Process • Adobe Connect Pro is our online meeting software
• Allows for participation and voting from all current and alumni members wherever they may be
• [email protected] is our information repository and communication platform • Posting materials, discussion forums, club elections,
speaker materials, etc.
• http://tinyurl.com/uwcmc is our public web address
• Investment research tools: FactSet, Wisconsin School of Business resources (Bloomberg, OneSource, etc.)
Op
era
tio
ns
& S
tru
ctu
re

Club Structure: Information Flow O
pe
rati
on
s &
Str
uc
ture
Day-to-day portfolio operations
Co-Presidents (2)
Portfolio Managers (3) Risk Manager Relations Manager
Events & External Communications
Ideas Feedback
Analysts
(Materials, Consumer Discretionary, etc.)
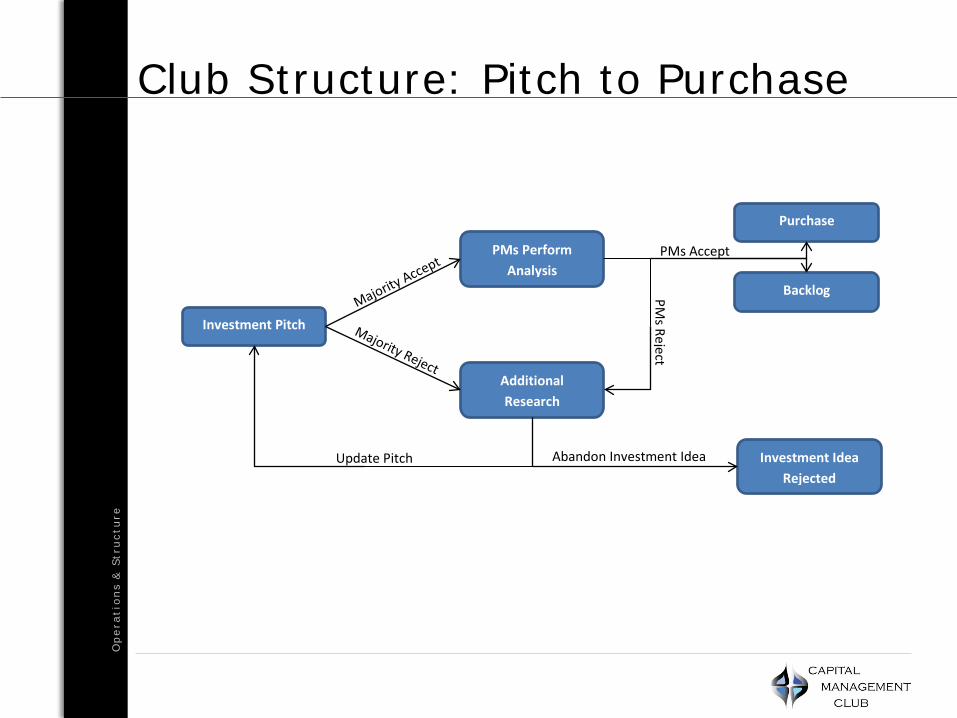
Club Structure: Pitch to Purchase O
pe
rati
on
s &
Str
uc
ture
Investment Pitch
PMs Perform Analysis
Additional Research
Purchase
Backlog
Investment Idea Rejected
PMs Accept
Update Pitch
PMs Reject
Abandon Investment Idea

Performance
Section III

CMC vs. S&P 500 P
erf
orm
an
ce
$880
$920
$960
$1,000
$1,040
$1,080
$1,120
$1,160
$1,200
2010 Performance
CMC (19.42%)
S&P 500 (12.48%)

Sharpe Ratio during 2010 P
erf
orm
an
ce
-2.50
-2.00
-1.50
-1.00
-0.50
0.00
0.50
1.00
1.50
2.00
2.502010 Sharpe Ratio
CMCS&P 500Long-Run Ave (0.40)

Sector Weightings as of 12/31/10 P
erf
orm
an
ce
Consumer Discretionary
8%
Consumer Staples
4%
Energy4%
Financials8%Health Care
23%
Industrials10%
Information Technology
14%
Materials20%
Telecom Services
3%
Utilities 6%
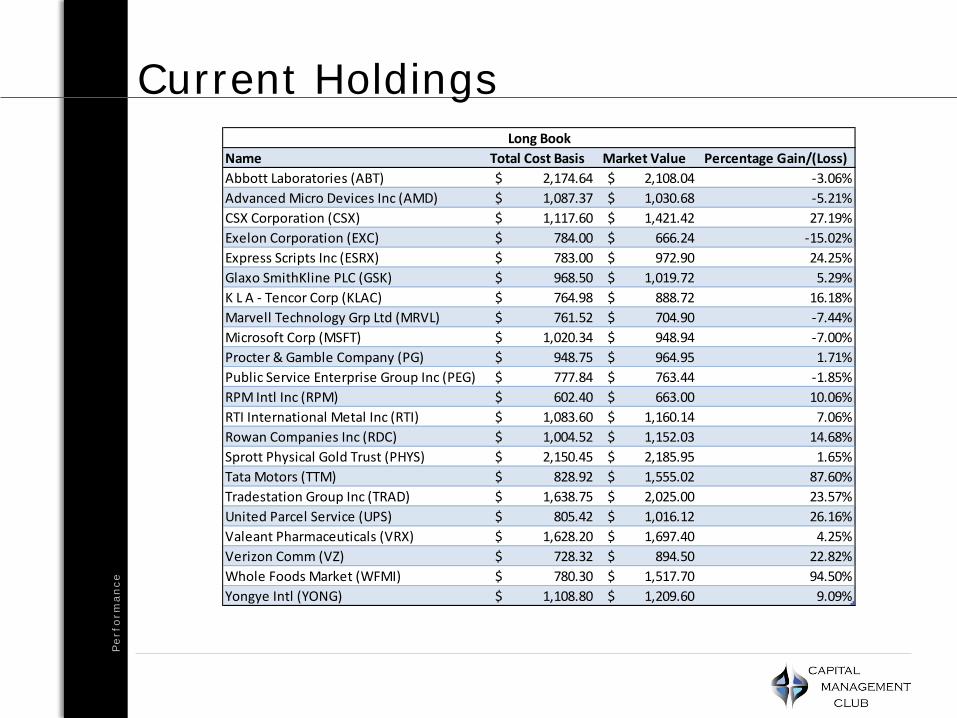
Current Holdings P
erf
orm
an
ce
Name Total Cost Basis Market Value Percentage Gain/(Loss)Abbott Laboratories (ABT) 2,174.64$ 2,108.04$ -3.06%Advanced Micro Devices Inc (AMD) 1,087.37$ 1,030.68$ -5.21%CSX Corporation (CSX) 1,117.60$ 1,421.42$ 27.19%Exelon Corporation (EXC) 784.00$ 666.24$ -15.02%Express Scripts Inc (ESRX) 783.00$ 972.90$ 24.25%Glaxo SmithKline PLC (GSK) 968.50$ 1,019.72$ 5.29%K L A - Tencor Corp (KLAC) 764.98$ 888.72$ 16.18%Marvell Technology Grp Ltd (MRVL) 761.52$ 704.90$ -7.44%Microsoft Corp (MSFT) 1,020.34$ 948.94$ -7.00%Procter & Gamble Company (PG) 948.75$ 964.95$ 1.71%Public Service Enterprise Group Inc (PEG) 777.84$ 763.44$ -1.85%RPM Intl Inc (RPM) 602.40$ 663.00$ 10.06%RTI International Metal Inc (RTI) 1,083.60$ 1,160.14$ 7.06%Rowan Companies Inc (RDC) 1,004.52$ 1,152.03$ 14.68%Sprott Physical Gold Trust (PHYS) 2,150.45$ 2,185.95$ 1.65%Tata Motors (TTM) 828.92$ 1,555.02$ 87.60%Tradestation Group Inc (TRAD) 1,638.75$ 2,025.00$ 23.57%United Parcel Service (UPS) 805.42$ 1,016.12$ 26.16%Valeant Pharmaceuticals (VRX) 1,628.20$ 1,697.40$ 4.25%Verizon Comm (VZ) 728.32$ 894.50$ 22.82%Whole Foods Market (WFMI) 780.30$ 1,517.70$ 94.50%Yongye Intl (YONG) 1,108.80$ 1,209.60$ 9.09%
Long Book

Current Holdings P
erf
orm
an
ce
Name Total Cost Basis Market Value Percentage Gain/(Loss)Garmin Ltd. (GRMN) (1,045.78)$ (1,084.65)$ -3.72%
Name Total Cost Basis Market Value Percentage Gain/(Loss)Cash 17,490.85$ 17,490.85$
Short Book
Cash Holdings
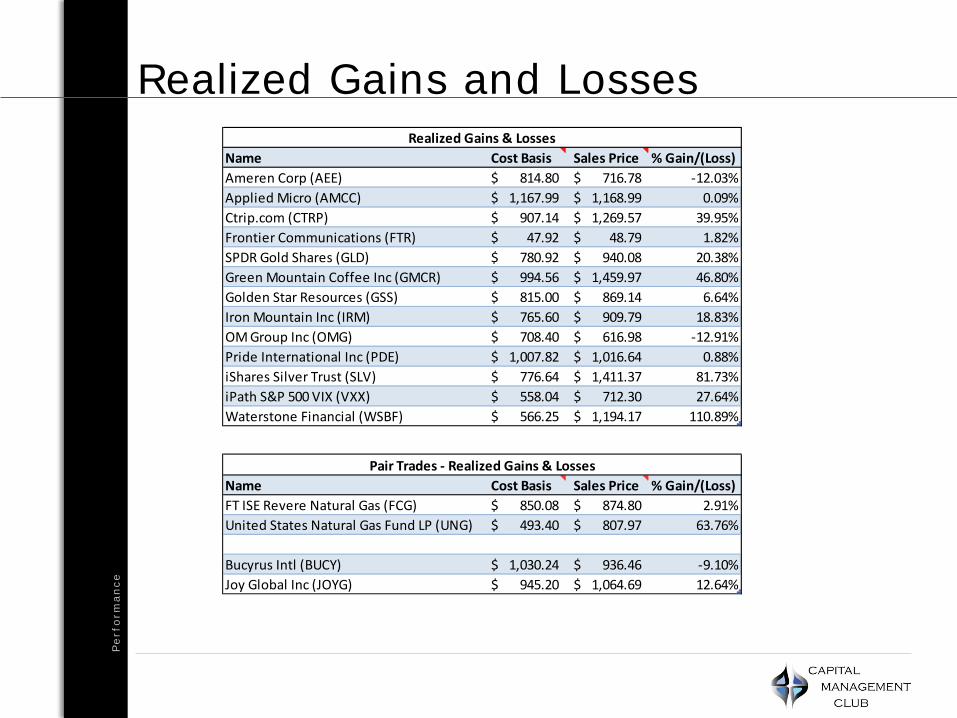
Realized Gains and Losses P
erf
orm
an
ce
Name Cost Basis Sales Price % Gain/(Loss)Ameren Corp (AEE) 814.80$ 716.78$ -12.03%Applied Micro (AMCC) 1,167.99$ 1,168.99$ 0.09%Ctrip.com (CTRP) 907.14$ 1,269.57$ 39.95%Frontier Communications (FTR) 47.92$ 48.79$ 1.82%SPDR Gold Shares (GLD) 780.92$ 940.08$ 20.38%Green Mountain Coffee Inc (GMCR) 994.56$ 1,459.97$ 46.80%Golden Star Resources (GSS) 815.00$ 869.14$ 6.64%Iron Mountain Inc (IRM) 765.60$ 909.79$ 18.83%OM Group Inc (OMG) 708.40$ 616.98$ -12.91%Pride International Inc (PDE) 1,007.82$ 1,016.64$ 0.88%iShares Silver Trust (SLV) 776.64$ 1,411.37$ 81.73%iPath S&P 500 VIX (VXX) 558.04$ 712.30$ 27.64%Waterstone Financial (WSBF) 566.25$ 1,194.17$ 110.89%
Realized Gains & Losses
Name Cost Basis Sales Price % Gain/(Loss)FT ISE Revere Natural Gas (FCG) 850.08$ 874.80$ 2.91%United States Natural Gas Fund LP (UNG) 493.40$ 807.97$ 63.76%
Bucyrus Intl (BUCY) 1,030.24$ 936.46$ -9.10%Joy Global Inc (JOYG) 945.20$ 1,064.69$ 12.64%
Pair Trades - Realized Gains & Losses

Top 10 Performers of 2010 P
erf
orm
an
ce
Name Total Cost Basis Market Value Percentage Gain/(Loss)Waterstone Financial (WSBF) 566.25$ 1,194.17$ 110.89%Whole Foods Market (WFMI) 780.30$ 1,517.70$ 94.50%Tata Motors (TTM) 828.92$ 1,555.02$ 87.60%iShares Silver Trust (SLV) 776.64$ 1,411.37$ 81.73%United States Natural Gas Fund (UNG) 493.40$ 807.97$ 63.76%Green Mountain Coffee (GMCR) 994.56$ 1,459.97$ 46.80%Ctrip.com (CTRP) 907.14$ 1,269.57$ 39.95%CSX Corporation (CSX) 1,117.60$ 1,421.42$ 27.19%United Parcel Service (UPS) 805.42$ 1,016.12$ 26.16%Tradestation Group Inc (TRAD) 1,638.75$ 2,025.00$ 23.57%
Best Performers of 2010
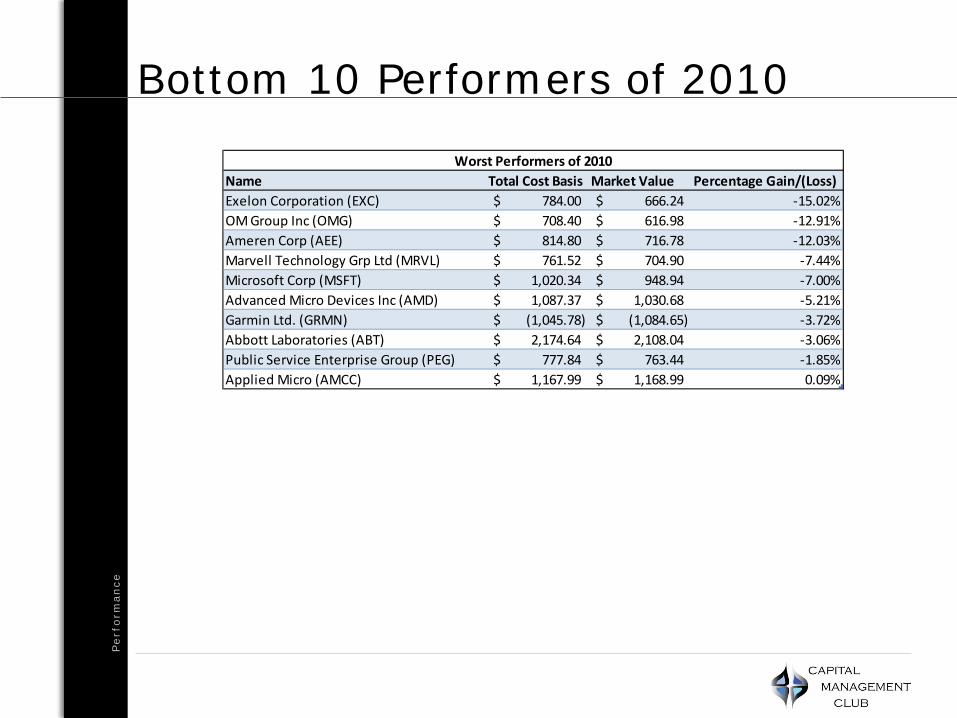
Bottom 10 Performers of 2010 P
erf
orm
an
ce
Name Total Cost Basis Market Value Percentage Gain/(Loss)Exelon Corporation (EXC) 784.00$ 666.24$ -15.02%OM Group Inc (OMG) 708.40$ 616.98$ -12.91%Ameren Corp (AEE) 814.80$ 716.78$ -12.03%Marvell Technology Grp Ltd (MRVL) 761.52$ 704.90$ -7.44%Microsoft Corp (MSFT) 1,020.34$ 948.94$ -7.00%Advanced Micro Devices Inc (AMD) 1,087.37$ 1,030.68$ -5.21%Garmin Ltd. (GRMN) (1,045.78)$ (1,084.65)$ -3.72%Abbott Laboratories (ABT) 2,174.64$ 2,108.04$ -3.06%Public Service Enterprise Group (PEG) 777.84$ 763.44$ -1.85%Applied Micro (AMCC) 1,167.99$ 1,168.99$ 0.09%
Worst Performers of 2010

Membership
Section IV
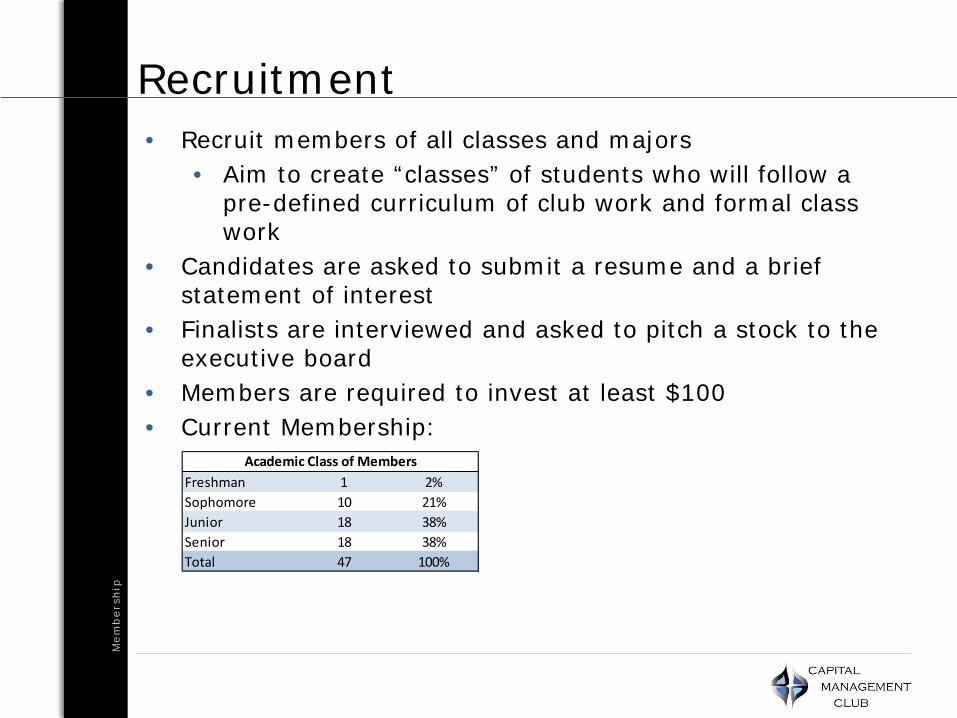
Recruitment • Recruit members of all classes and majors
• Aim to create “classes” of students who will follow a pre-defined curriculum of club work and formal class work
• Candidates are asked to submit a resume and a brief statement of interest
• Finalists are interviewed and asked to pitch a stock to the executive board
• Members are required to invest at least $100 • Current Membership:
Me
mb
ers
hip
Freshman 1 2%Sophomore 10 21%Junior 18 38%Senior 18 38%Total 47 100%
Academic Class of Members
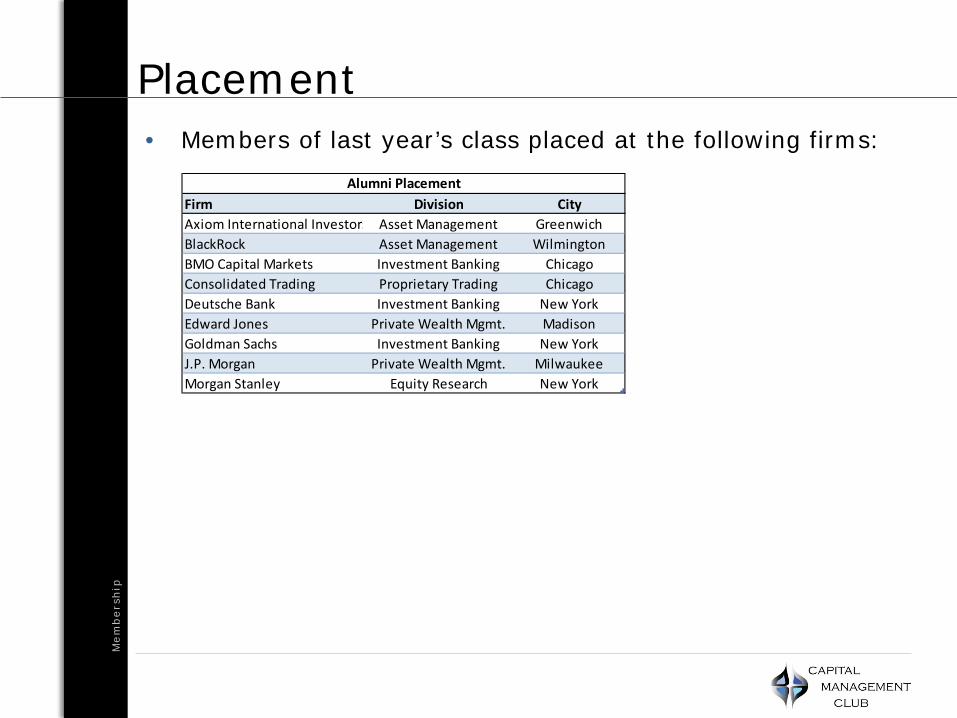
Placement • Members of last year’s class placed at the following firms:
Me
mb
ers
hip
Firm Division CityAxiom International Investors Asset Management GreenwichBlackRock Asset Management WilmingtonBMO Capital Markets Investment Banking ChicagoConsolidated Trading Proprietary Trading ChicagoDeutsche Bank Investment Banking New YorkEdward Jones Private Wealth Mgmt. MadisonGoldman Sachs Investment Banking New YorkJ.P. Morgan Private Wealth Mgmt. MilwaukeeMorgan Stanley Equity Research New York
Alumni Placement

Contact Information
Section V
Contact Information C
on
tac
t In
form
ati
on
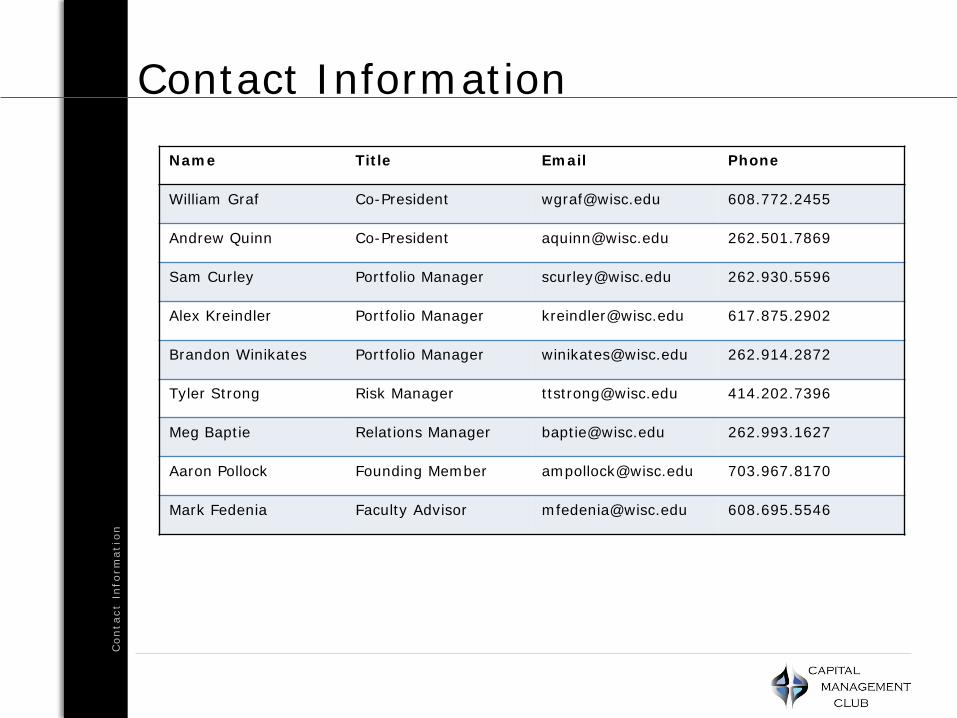
Name Title Email Phone
William Graf Co-President [email protected] 608.772.2455
Andrew Quinn Co-President [email protected] 262.501.7869
Sam Curley Portfolio Manager [email protected] 262.930.5596
Alex Kreindler Portfolio Manager [email protected] 617.875.2902
Brandon Winikates Portfolio Manager [email protected] 262.914.2872
Tyler Strong Risk Manager [email protected] 414.202.7396
Meg Baptie Relations Manager [email protected] 262.993.1627
Aaron Pollock Founding Member [email protected] 703.967.8170
Mark Fedenia Faculty Advisor [email protected] 608.695.5546


