
1
Against the tide: Currency use among Latin American immigrants in Chicago
Carrie Jankowski, Richard D. Porter and Tara Rice
Federal Reserve Bank of Chicago
March 20, 2008
Carrie Jankowski is a business economist; Richard D. Porter is a vice president, senior policy advisor, and the director of the payments studies group; and Tara Rice is a financial economist in the Economic Research Department at the Federal Reserve Bank of Chicago. The views expressed here are those of the authors and do not necessarily reflect the views of the Federal Reserve Bank of Chicago or the Fed-eral Reserve System. The authors thank Luis Alberro for his contributions to an earlier version of this article and Katy Jacob, Ruth Judson and Stephen LeRoy for their comments, suggestions, and assistance.

2
Against the tide—Currency use among Latin American immigrants in Chicago Carrie Jankowski, Richard D. Porter, and Tara Rice
Introduction and summary
Like many other industrialized countries, the United States continues to transition from paper-based
payments (cash and checks) to electronic payments. For society as a whole, the benefits of this shift may
be substantial, since the marginal cost of an additional transaction on an electronic payment network is
almost always considerably less than it would be on a paper-based network. For most households in the
U.S. today, currency (cash) still represents a transactions vehicle, but one that is increasingly being up-
staged by a variety of substitutes, such as debit cards. However, as we detail in this article, for many Latin
American immigrants, currency represents not only their primary transactions vehicle, but may also repre-
sent their only savings vehicle. Indeed, in our study of Latin American immigrants in Chicago, we find
evidence that the dramatic increase in the number of immigrants is supporting a growing demand for cur-
rency, notably in the $100 denomination. We argue that this trend has quite possibly contributed to the in-
crease in domestic demand for currency since the late 1990s—an increase that is at odds with the gener-
ally accepted view that cash is on the way out.
For some time, underlying economic forces have suggested to a number of observers that electronic
money was poised to replace cash. James Gleick, the author of Chaos: Making a New Science, declared
over a decade ago:
Cash is quaint, technologically speaking—unless you’re impressed by intaglio-steel-plate-printed
paper with embedded polyester strips (meant to inconvenience counterfeiters). Cash is expen-
sive—tens of billions of dollars drain from the economy each year merely to pay for the printing,
trucking, safekeeping, vending, collecting, counting, armored-guarding, and general care and
feeding of our currency. Cash is obsolete.1
As the Economist magazine put it recently, “The economics of handling cash … is suddenly subsumed
by Moore’s law,” which speaks to the ongoing technological advances in computing capability that can
be expected over time.2 In some fashion, these technological improvements will be echoed in lower ef-
fective costs of creating and operating digital networks, including digital payment networks. These devel-

3
opments, in turn, will make cash substitutes more attractive to payment providers and users. As the digi-
tal networks garner greater shares of payments, cash usage will decline. This development will then
raise the cost of handling cash (as the current scale economies in cash-handling networks diminish),
leading to a further decline in cash usage.3
Against the tide of this trend toward replacing cash with electronic payment instruments is the fact that,
over the past decade, the amount of U.S. currency held domestically has increased, particularly notes in
the largest denomination in circulation, $100 bills. Since 1995, the aggregate value of $100 bills in cir-
culation has more than doubled, yet the share of $100 bills held abroad has decreased from its peak of 70
percent, and, more recently, held steady at about 65 percent. How does the rising Latin American immi-
grant population in the United States factor into recent trends in currency use? Our research suggests that
barriers to participation in the mainstream financial system and other factors continue to make cash
more attractive than alternative payment instruments among this growing immigrant population. For ex-
ample, a 2002 survey of 302 Latin American immigrants found that about 59 percent of payments were
made using cash. The second most popular method was check, used for about 20 percent of payments. 4
In the next section, we examine recent trends in the use of cash, particularly the recent upswing in domes-
tic currency use. Next, we analyze factors underlying currency demand. We discuss the financial par-
ticipation of immigrants and the reasons why a large number of immigrants do not make use of main-
stream financial institutions. Then, we use the 2000 U.S. Census and Federal Reserve data to analyze cur-
rency use among the Latin American population in Chicago, and assess the economic implications of
these developments. Though limited to a relatively small geographic area, metropolitan Chicago provides
an initial testing ground for our hypotheses, helping us to assess whether they warrant examination on a
broader scale.
We find that the demand for $100 bills is greater in Chicago neighborhoods with higher concentrations
of foreign-born Latin Americans than in other immigrant neighborhoods or other Chicago neighbor-
hoods in general. Our results suggest that Latin American immigrants hold these bills as a store of value,
since the convenience of this denomination in most day-to-day transactions is quite limited. Although
the timing is suggestive, additional research is needed to determine whether this immigrant group (and, in
particular, the growing number of undocumented workers from Mexico and Central America) represents
the source of the recent upward trend in real per capita domestic currency holdings.

4
Trends in domestic currency use
The economic tide now running against currency is many-sided. In most circumstances, the competitors
to currency, for example, credit cards, offer more: Some have higher yields, better record-keeping mecha-
nisms, points/benefits (such as airline miles or “cash back” offers), and/or resolution mechanisms for
transactions that turn sour. And while using currency at the checkout used to be more convenient than
using checks, credit cards, or debit cards (mainly because currency transactions were quicker), electronic
networks have reversed that in many venues. Today, drivers with transponders pay tolls electronically as
their vehicles speed through Illinois Tollway plazas, while drivers without transponders wait in lines to
hand over cash to toll collectors or to throw coins into 1950s-era coin hoppers. Radio frequency identifi-
cation (RFID) technology similar to that embedded in the Illinois Tollway transponders is now also
available on contactless cards marketed by the major card networks. Contactless cards allow time-
constrained customers to pay more quickly at the retail checkout or the automated gas pump with a
quick swipe of the hand. Finally, the storage technology embedded in currency has shrunk drastically.
Fifty years ago, the highest denomination note in real terms was approximately equal to one full year of
disposable income for the average household, whereas now it is closer to only 1.3 days of salary.5
A recent survey by the American Bankers Association and Dove Consulting bears out many of these
suppositions about the emergence of cash substitutes in the retail marketplace. This survey of consumer
payment preferences found that over the last two years respondents reported using cash less often (versus
more often) by a margin of nearly three to one.6 Moreover, the growing use of cash substitutes was
widely dispersed over a variety of retail outlets: grocery stores (94.5 percent reported using cash less fre-
quently), gas stations or convenience stores (90.9 percent), department stores (96.0 percent), discount
stores (88.3 percent), drug stores (88.5 percent), and restaurants (83.9 percent).7 A variety of reasons were
offered for this change in behavior: Respondents were more comfortable using noncash payment meth-
ods; they gained access to other payment methods besides cash; they found noncash payment methods
faster to use; they noted that more merchants accepted noncash payments; they enjoyed the rewards for
making noncash payments; and they found noncash payment methods easier to use.8
So it appears that in many venues the rewards for using electronic payment methods outweigh those for
using cash. But is cash truly becoming outmoded? Not necessarily. Some categories of transactions, in-
cluding many illegal or “off-the-books” ones, are likely to remain “cash and carry.” Another area of
growth in demand for U.S. currency has been overseas markets, such as Argentina and Russia. Residents
5
of such countries have become accustomed to holding U.S. bank notes as a hedge against banking sector
instability and/or hyperinflation in their home currencies. Indeed, as a result of strong growth in overseas
demand for U.S. currency in the 1990s, Federal Reserve Board Governor Lawrence Lindsey called the
dollar America’s most ignored export.9
Although these general observations offer direction on the recent trends in currency, we also examine
broad aggregate indicators of currency usage. If the ratio of currency to gross domestic product (GDP)
was declining, it might suggest a transition to the hypothesized decline-of-currency scenario. To explore
this possibility, figure 1 displays the time series of the ratio of total currency in circulation outside of
banks to nominal GDP from 1965 through 2005. This ratio declined as other payment media such as
credit cards displace some cash payment over the early part of the period shown. Beginning in the late
1980s and continuing well into the 1990s, however, cash shipments to foreign destinations, particularly
to Argentina and subsequently to Russia, dominated movements in overall currency and reversed the
initial downtrend (see Porter and Judson (1996)). 10
If we subtract the estimate of currency held abroad from the numerator, the pattern changes dramati-
cally, as shown in figure 2.11 We now see a more uniform downward trend in this ratio, as we would
expect if domestic currency usage was declining relative to other payment means. Near the end of the
period shown, however, we see a reversal in the downward trend. Figure 3 reorders the information in
figure 2 by highlighting per capita domestic currency balances. For most of the period shown, these bal-
ances fluctuate in real terms between $800 and $900, but they rise sharply (by nearly 40 percent) near
the end. Moreover, both the ratio of aggregate domestic currency to GDP (figure 2) and domestic cur-
rency per capita (figure 3) show this sharp increase starting around 1997 and continuing through the last
observable year shown, 2005.
One denomination in particular—the $100 bill—is producing this trend. Table 1 lists the U.S. bank notes
in circulation, including $100 bills in circulation and the estimated portion held abroad. Since 1995, the
aggregate value of $100 bills in circulation has more than doubled, yet the share of $100 bills held
abroad has decreased from its peak of 70 percent, and, more recently, held steady at about 65 percent.
This reverses a trend of growing foreign demand for U.S. currency.12

6
Table 2 shows the shipments of three denominations of U.S. currency—$5 bills, $20 bills, and $100
bills—by Federal Reserve District for 2005. The first column under each denomination, labeled “re-
ceived,” lists the values of that particular denomination received by each of the Federal Reserve Banks
from its customers, that is, the financial institutions located within that Federal Reserve District. The
“paid” column contains dollar values shipped out by the individual Federal Reserve Banks to their cus-
tomers, and the “net” column is the net flow that may be held either abroad or domestically. Net ship-
ments of $5 bills are negligible compared with the shipments in and out; the net is under 4 percent of the
total paid out. Similarly, for the $20 bills, the net makes up less than 3 percent of shipments out. Net
shipments of $100 bills, in contrast, are a little over 11 percent of the total paid out. The relatively large
net figures for New York, San Francisco, and Atlanta are not necessarily surprising, since these Federal
Reserve Districts have traditionally processed substantial amounts of currency from, or to, foreign end-
points. The larger positive flows for Richmond and Chicago, however, are more surprising. This increase
may reflect the surge in Latin American immigration (which is described in detail later) in these two Federal
Reserve Districts. Together, tables 1 and 2 suggest that $100 bills are being held, and increasingly so at
home rather than abroad.
Explaining currency demand
What reasons could help to explain the increase in domestic demand for currency? Traditionally, an in-
dividual’s demand for currency is viewed along inventory theoretic lines, in which money demand de-
pends positively on income received in a period and a brokerage (or transaction) fee for getting into and
out of an interest-bearing instrument and negatively on a short-term nominal interest rate.13 The tradi-
tional transaction demand for money depicts money holdings as following a saw-tooth pattern over in-
come periods; that is, money holdings (whether in currency or in a bank account) rise rapidly with re-
ceipt of income or other source of payment, and then fall slowly as the money is spent continuously over
time.14 When nominal interest rates are low or the brokerage fee is high relative to income, it may not
pay to have an interest-bearing account at all. In this case, the individual only holds one financial in-
strument, currency.
In addition to interest rates and brokerage fees, Cagan’s classic analysis of the demand for currency,
considers three additional candidates that could explain this trend: crime, tax evasion, and travel.15 A
downward movement in nominal interest rates will lower the opportunity cost of holding currency and
raise desired currency balances. Interest rates have been very low over the past several years; the federal

7
funds rate averaged only 3.2 percent in 2005, while interest-bearing checking accounts paid depositors
about 0.31 percent in interest per year over this period. Thus, it is conceivable that the low level of inter-
est rates generally prevailing after the events of September 11, 2001, might account for the recent in-
crease in domestic currency demand. However, figure 3 (p. 5) shows that nominal interest rates do not ap-
pear to have had a powerful enough influence on real domestic currency per capita to explain the changes
in levels. This result is in line with estimates that suggest that currency demand is not that elastic with
respect to nominal interest rates.
What about crime and tax evasion? Our earlier work has cast doubt on the crime explanation for cur-
rency demand, and current crime statistics support our prior assessment.16 Evidence using either the
overall variation in crime or in drug arrests (figure 4) suggests that crime is not the missing link in cur-
rency demand.17 Moreover, the movements of average marginal tax rates in the United States do not in-
dicate that there has been an increase in the incentive to evade federal taxes (and therefore hold more
cash), as displayed by the tax rate series compiled by the National Bureau of Economic Research in fig-
ure 5.
Finally, Cagan argues that the volume of currency used to transact a given volume of retail trade may
vary with the volume of travel per capita. Writing near the end of the 1950s, he reasoned that payments
by check or credit require that the parties making the exchange know each other. When travel increases,
currency is likely to supplant checks. Why? Simply because the traveler will be buying where he or she is
not known or has not had an opportunity to establish a line of credit.
Consider, in particular, workers who move from Mexico and other Latin American countries to Chicago.18
Like other immigrants, they are travelers and make relatively frequent return visits to their hometowns
where they maintain family ties.19 Even if they have been settled in Chicago for some time, they remain
less likely to participate in the formal banking sector here. For a variety of reasons, such as language barri-
ers, lack of documentation, and distrust of banks, these immigrants tend to use checks, credit cards, and
debit cards much less often than the general population does. Using Cagan’s framework, one might clas-
sify them as being perpetual travelers.
Unlike the other explanations we have considered—interest rates, crime, and tax evasion—travel (spe-
cifically, immigration) provides the most viable explanation. Immigration from Mexico and other Latin

8
American countries has grown at astonishing rates in recent years. Moreover, the brokerage fees (dis-
cussed earlier) may not be similar for all residents. If an individual is familiar with banking and can
readily open and use a checking account or other bank account, then the brokerage fee in getting to a
bank or automatic teller machine (ATM) to deposit or withdraw funds may represent only the classic
“shoe leather” costs.20 On the other hand, for immigrants there are often other impediments that stand in
the way of their establishing a banking relationship. As a result, they may choose not to bank with deposi-
tory institutions and instead hold their wealth entirely in cash. Because of these impediments (leading to
higher transaction costs),21 the optimal deposit holdings for many of these immigrants might be negligi-
ble.
Immigration to the United States
While the deposit holdings of a small group of residents might not affect domestic demand for currency
on a larger scale, Latin American immigrants make up a rapidly growing proportion of U.S. residents.
Since 1980, immigration to the United States from Latin American countries has increased considerably.
In 1980, foreign-born Latin Americans represented 1.9 percent of the total U.S. population. By 2005,
that share grew to 6.6 percent, of whom 56.8 percent were from Mexico.22 Mexican immigrants alone rep-
resented a greater share of the U.S. foreign-born population (29.5 percent) at the end of the twentieth
century than German and Italian immigrants (23.7 percent) collectively did at the end of the first great
immigration wave to the United States in 1920.23 Table 3 summarizes immigration to the United States
from 1850 through 2000. The rise in immigration from Latin America from the 1980s onward is dra-
matic, with Mexican immigrants making up a growing proportion of the total amount of Latin American
immigrants. In 1980, immigrants from Mexico made up 74 percent of total Latin American immigrants;
by 2000 that proportion had grown to 84 percent. Figure 6 shows the cumulative influx from Mexico to
the United States over the past 150 years, and table 4 highlights recent patterns of Mexican immigra-
tion.24
Immigration from Mexico gained traction as the Mexican debt crisis of the early 1980s unfolded. It accel-
erated sharply in the latter part of the 1990s, partly spurred by the economic boom (and higher employ-
ment rates) in the United States. Importantly, too, the estimated number of undocumented immigrants
entering this country now exceeds that of legal immigrants. This has implications for financial participa-
tion because, as we discuss in more detail in the next section, undocumented immigrants often face higher
barriers to participation in the financial system than do legal residents.

9
By and large, immigrants tend to migrate to areas in the United States where other residents from their
hometowns or countries now live. Chicago is among the oldest and most established Latino immigrant
gateways in the country (Singer, 2004), and Chicago’s Latin American population has swelled along with
the national trend. Between 1990 and 2000, the Latino population (both native-born and foreign-born
members) in the Chicago metropolitan area increased by 73 percent.25 Over half of that increase (56 per-
cent) was due to immigration; the rest was due to population growth among existing Latin American
residents. An estimated 421,000 thousand immigrants arrived in the Chicago area directly from Mexico
between 1980 and 2000,26 and as of 2000, more than 586,000 Mexicans were living in the Chicago metro-
politan area.27
Financial participation of immigrants
While an estimated 8 percent to 9 percent of all U.S. households do not have a transaction account, a
much higher proportion of the immigrant population has no banking relationship (or is unbanked) com-
pared with their native-born counterparts.28 The U.S. Census Bureau’s Survey of Income Participation
(SIPP) puts the number of unbanked Mexican immigrants at 53 percent and other Latin American immi-
grants at 37 percent over the period 1996–2000 (see table 5).29
The most commonly reported reasons given by U.S. households for not having a transaction account are
they write too few checks to make it worthwhile (28 percent), do not like dealing with banks (23 percent),
have insufficient funds (14 percent), or find service charges too high (12 percent).30
Immigrants have additional reasons for not opening a transaction account. In many cases, undocumented
immigrants are unable to open savings or checking accounts at banks because they lack the required of-
ficial identification (such as a Social Security number, driver’s license, or tax identification number).
Moreover, undocumented immigrants may feel they risk their livelihood in the United States by reveal-
ing their immigrant status to a bank. To close these gaps, the U.S. Department of the Treasury now al-
lows banks to decide what forms of identification they will accept from individuals who want to open a
bank account. As a result, Mexican immigrants with Matricula cards (identification cards issued by
Mexican consular offices in the United States) are now permitted to open bank accounts in some states,
including Illinois.

10
Many Latin American immigrants may have had little financial education or direct experience in dealing
with financial institutions. In addition, many Latin American immigrants also have historical reasons to
view banks as risky institutions. Many have experienced banking crises in their home countries with out-
right banking failures and liquidity disruptions that have often harmed depositors. As a result, they may
view banks with suspicion.
Language barriers present further obstacles for immigrants. In most cases, it is necessary for bank cus-
tomers to learn how to manage their accounts in English; for example, they need to learn how to fill out
the proper dollar amount in English on a check. Though some banks now offer services to cater to cus-
tomers who speak Spanish, language barriers can still remain an obstacle at these venues. Since as many
as 10 percent of Mexicans speak a language other than Spanish, this customization may not be valuable
to all Mexican immigrants.31
Several other factors push immigrants into cash. Some workers are paid in cash for work that is not
documented, and must pay bills and other expenses (such as rent) in cash. Also, some immigrants do not
expect to stay very long in the United States and, therefore, may feel they would not benefit from learning
how to open and operate a bank account.32 Furthermore, newly arriving immigrants tend to locate in ar-
eas inhabited by other immigrants from the same countries or regions. Once settled, new immigrants of-
ten learn about U.S. customs and procedures from their local social network. If their neighbors or cowork-
ers do not tend to make use of banks, the new immigrants will not either.33
Many Mexicans living in Mexico choose to hold some U.S. dollars. Mexicans living in Mexico are esti-
mated to have average dollar holdings of U.S. bank notes about equal to half of the average bank note
holdings for U.S. residents living in the United States.34 For undocumented immigrants, payments to so-
called coyotes, who help them to enter or reenter the United States undetected, may require substantial
amounts of dollars—often several thousand dollars per person.35 Finally, many immigrants send remittances
to their families living in their home country. Because the role of remittances in the demand for cash is
significant, we discuss this topic in detail next.
Role of remittances
Workers in the United States transferred more than $40 billion to Latin America and the Caribbean in
2005.36 This represents about 75 percent of the total remittances sent to Latin America and the Caribbean
in 2005 from all countries. About half of the total remittances (approximately $27 billion) went directly
11
to Mexico—an amount greater than Mexico’s revenues from tourism and about equal to Mexico’s annual
income from oil exports in recent years.
Remittance transfers are primarily a cash-to-cash process: Remitters pay cash to a money transmitter or
financial institution, and the recipient of the remittance in the home country picks up the funds in cash. In
recent years, banks have begun to offer cash checking or money transfer services as a way to capture a
larger share of this growing market, although they have not made large inroads to date.37 As of 2004,
less than 5 percent of transfers were done via direct deposit into bank accounts.38
A large portion of these remittances are paid in cash to money transmitting institutions (wire transfer ser-
vices), such as Western Union and MoneyGram, that primarily accept cash. What is not captured in this
estimate of total remittances is the amount that immigrants remit to their home countries by carrying
cash in their (often annual) return visits or by entrusting money to family members or friends who are travel-
ing home.
The average size of recorded remittances to Latin America was between $200 and $300 per transaction
in 2005, with 20 percent of participants sending less than $100, 36 percent sending between $100 and
$200, 26 percent sending between $200 and $300, and 18 percent sending more than $300. The average
size of remittances increased significantly in 2006 to approximately $315 per month.39 On average,
Mexican immigrants remit more than their counterparts from other Latin American countries—about $450
a month in 2002. They also bring a considerable sum of cash back to Mexico when they visit—almost
$3,000 per visit.40
Linking immigration and currency demand
To establish a link between the surge in immigration and the increased demand for currency in the U.S.,
we correlate currency disbursements with the proportion of immigrants (both from Latin America and
from all other regions) by five-digit zip code, using U.S. Census data for metropolitan Chicago, where
Latin Americans are the largest immigrant group. Table 6 shows that metropolitan Chicago neighborhoods
(measured at the zip code level) with larger proportions of Latin American immigrants are positively cor-
related with the number of $100 bills per capita. For immigrants from regions other than Latin America,
this correlation becomes negative.

12
This difference suggests that Latin American immigrants’ currency demand may be larger than that
of other immigrant groups simply because they will be more likely to be unbanked, as shown in table 5
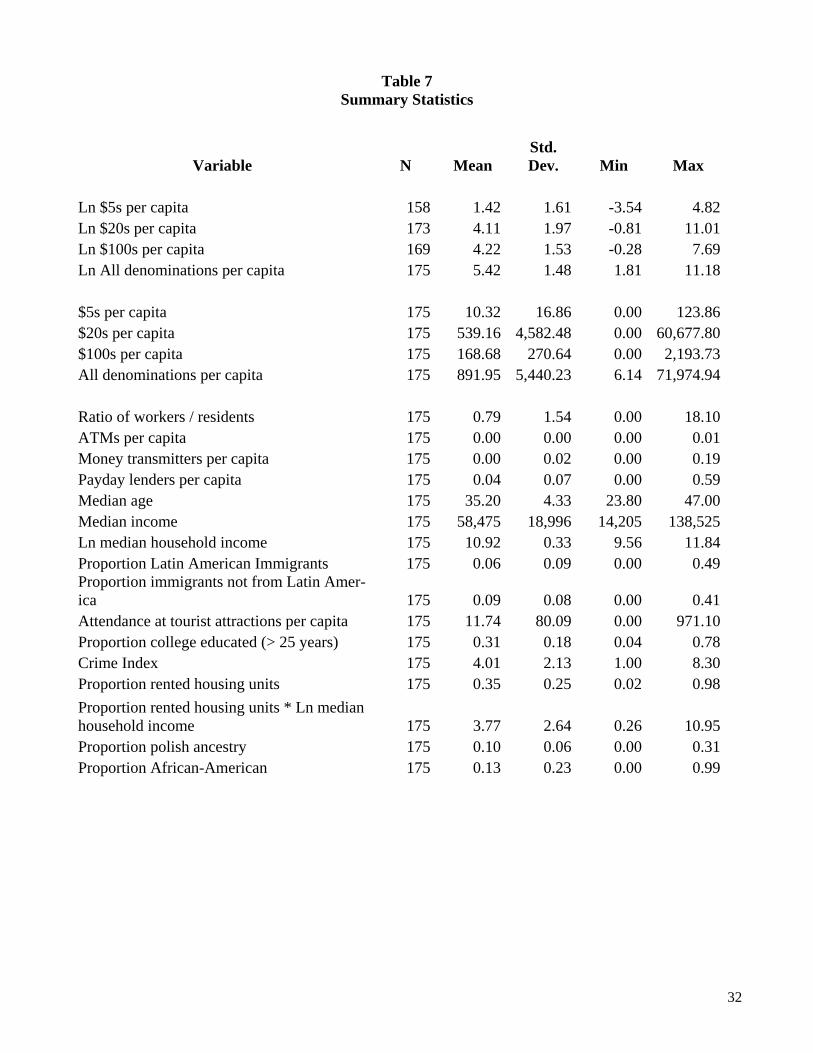
(p. 9). A number of other factors could explain this finding. Table 7, which contains the summary statis-
tics for neighborhoods in our data sample (discussed in the next section), highlights some differences
between Latin American immigrants and immigrants from other regions. The concentration of Latin Ameri-
can immigrants ranges from less than 1 percent to 49 percent per zip code (with a mean of 6 percent),
while the concentration of immigrants from all other regions ranges between less than 1 percent to 41 per-
cent.41
Polish immigrants are the second largest immigrant group in the Chicago area. As of 2000, the largest
population of Polish immigrants in the United States lived in Illinois (almost 140,000), and this Illinois
contingent represented almost 30 percent of the nation’s total foreign-born Polish population. Thus, exam-
ining the currency demand for foreign-born Polish residents provides a contrast by which to gauge the re-
sults from Latin American immigrants. In our sample, the proportion of foreign-born Polish residents per
neighborhood ranges between zero percent and 21 percent of the population per zip code (with a mean of
2 percent). The lower mean and standard deviation for the proportion of all other immigrants combined
and for the Polish immigrants (compared with the Latin American immigrants) illustrates that Latin
American immigrants tend to be more concentrated in some neighborhoods than other immigrant
groups.
A comparison of neighborhoods with a high concentration of foreign-born Latino residents (those with
foreign-born Latinos accounting for at least 30 percent of the resident population) versus neighborhoods
with a high concentration of foreign-born non-Latino residents (those with foreign-born non-Latinos ac-
counting for at least 30 percent of the resident population) reveals the following: Foreign-born Latino
residents are younger, are less educated, earn a lower income on average, and have immigrated to the
U.S. more recently. It is likely that linguistic barriers to banking are larger in the Latin American immi-
grant communities. Both groups tend to be more likely to live in neighborhoods with higher proportions
of renters, but this effect is somewhat more pronounced for Latin American immigrants.
Data and empirical analysis
As table 6 suggests and research finds, Latin American immigrants tend to establish themselves in
neighborhoods having relatively high densities of their fellow immigrants.42 Since most Mexican immi-

13
grants in the United States come from the central and southern parts of Mexico, “migration networks may
be developed in this area to the point that migration costs are generally low for most families and migra-
tion decisions largely reflect wage differences.”43 As a result of these forces, Mexican immigrants in the
Chicago area have tended to locate in neighborhoods such as Pilson and Little Village, which already
have a high proportion of Mexican and other Latin American immigrants. Using U.S. Census data, we
can study these clusters at the five-digit zip code level, enabling us to use a rich mix of socioeconomic
and demographic factors that are available at this geographic level.
Our data consist of annual cash orders from the Federal Reserve Bank of Chicago to bank branch
offices in the Chicago area in 2005, aggregated by zip code. The aggregated data allow us to measure
the aggregate flows of currency to a cross-section of zip codes in the Chicago area. Note that these or-
ders represent flows (rather than stocks) of currency from the Federal Reserve Bank of Chicago to de-
pository institutions in various zip codes.
Because of data limitations, we cannot use all of the cash orders we have. Since some larger banks oper-
ate as correspondent banks to smaller (community) banks in the Chicago area, it is not possible to determine
what proportion of ordered currency stays with each correspondent bank and what proportion ends up at
the smaller respondent banks.44 Therefore, we remove the large correspondent banks from our sample.
Our restricted data set contains 543 banks dispersed over 175 zip codes. Because we aggregate the data
to the zip codes in which the community banks operate, our results implicitly reflect the behavior of an
assortment of community banks.45
To this aggregated cash data, we add socioeconomic and demographic data on the native-born and for-
eign-born population at the zip code level from the 2000 U.S. Census. This includes data on income,
age, and education of residents at the zip code level. These three factors influence bank account ownership
for both immigrants and native-born residents. Higher levels of education are generally reflected in more
sophisticated financial decision-making. Individuals with bachelor’s or advanced degrees are 21 percent
more likely to have a checking account than those who have not completed high school.46 Age may affect a
resident’s choice of payment method, with younger residents more likely to embrace newer payment
methods, such as debit cards, and older residents more likely to stick with traditional payment instru-
ments, such as checks, cash, and, to some degree, credit cards.47 Income will also affect a resident’s de-
cision (and perhaps ability) to maintain a bank account.48

14
The type of housing in which immigrants live may have a bearing on their currency usage. Residents in
low-income neighborhoods who rent are more likely to pay that rent in cash than residents in middle- to
high-income neighborhoods.49 We therefore include the proportion of renters per neighborhood to cap-
ture this fact. We then interact this variable with our measure of income, because low-income neighbor-
hoods are the ones where property owners tend to demand cash payments. This tendency might be more
pronounced in neighborhoods with higher concentrations of more transient groups, such as immigrants.
We also consider a number of factors that likely affect transaction costs (shoe leather costs) for getting
into and out of an interest-bearing instrument (a bank account). As stated earlier, it is reasonable to as-
sume that these transaction costs differ across demographic segments of the population. Specifically,
immigrants may face higher implicit transaction costs to obtain an interest-bearing instrument, such as a
checking or savings account, because of language barriers, lack of documentation, and distrust of the
banking system.
While we tend to think of traditional depository institutions (that is, banks) as representing the financial
sector, immigrants often make use of financial institutions that are more on the “fringe,” such as payday
lenders, check cashers, and money transmitters, which provide a number of important services and are
often conveniently located. We include (per zip code) the number of money transmitters per capita, as
well as the number of payday lenders per capita to represent the relative size of the fringe banking sector.
Migrants predominantly use money transmitters to remit money to their home country—70 percent of
Mexican immigrants use them to remit money home. These institutions often charge hefty fees.50
Payday lenders, on the other hand, provide cash to residents, and the number of these institutions has
been on the rise in lower-income and immigrant neighborhoods. We separate these two types of fringe
institutions because we expect demand for currency to vary across neighborhoods based on the concen-
tration of each of these types of institutions. If residents are hoarding currency to remit it through a
money transmitter, then we would expect demand for currency to be positively associated with the num-
ber of money transmitters per 1,000 residents. However, residents receiving a loan from payday lenders
are most likely to be in lower-income neighborhoods, where it is more common to live from paycheck to
paycheck. These residents would tend to demand less currency. Under payday lending arrangements,
they are required to give the lender a post-dated check (not cash), and if they are living from paycheck to

15
paycheck, they are likely to be liquidity constrained. We anticipate, therefore, that the number of payday
lenders per capita will be negatively associated with the demand for currency.
We also add two variables to represent local (geographic) demand for currency. The first variable prox-
ies the demand by tourists and consists of total 2005 attendance at large tourist attractions in the Chicago
area.51 The economic activity surrounding these highly visited spots should tend to increase the local
demand for currency in the surrounding neighborhoods. The second geographic variable is the ratio of
workers to residents in each zip code. We include this variable to account for the increase in the demand
for currency by people commuting into a neighborhood to work. In addition, places of larger-scale em-
ployment in Chicago are often surrounded by restaurants and bars that cater to the workers and whose em-
ployees are often paid in cash.52
Criminal activity, such as drug sales and bookmaking, might result in increased demand for cash, in that
these activities ordinarily entail anonymity between parties involved in a transaction. We therefore in-
clude a measure of overall criminal activity per neighborhood. Specifically, we use an index of risk of
violent or property crime developed by the Federal Bureau of Investigation (FBI), where ten represents
the highest risk and one the lowest.53
Finally, we include two variables to test our hypotheses that the demand for currency differs between immi-
grant and native-born residents. We include the percentage of Latin American immigrants and the per-
centage of foreign-born residents that are not of Latin American descent to assess the effect of immigra-
tion on cash acquisition.54
Figure 7 illustrates the 175 zip codes with orders available for $5, $20, $100, and all denominations;
these zip codes are shaded in dark orange to distinguish them from the other zip codes. In our restricted
sample, some of the zip codes did not receive any shipments of particular denominations during 2005,
and so our sample size for the different denominations ranges from 158 to 175 zip codes.
Table 7 illustrates that, on average, residents of our sampled zip codes are about 35 years old, 31 percent
of them have a college degree, and they earn an average annual income of $58,475 per household. On
average, gross payments to residents per zip code in 2005 were $10.32 in $5 bills (log 1.42), $539.16 in
$20 bills (log 4.11), $168.68 in $100 bills (log 4.22), and $891.95 in all denominations (log 5.42).
16
The maps in figures 8 and 9 highlight the two most important components of our data set. Figure 8 de-
picts the spatial demand for $100 bills by zip code; zip codes exhibiting demand for $100 bills above the
75th percentile are shaded in dark orange, while those exhibiting demand below the 75th percentile are
in light orange. Figure 9 displays where foreign-born Latin American communities reside by zip code;
zip codes that have more than 6 percent foreign-born Latin American residents—the state’s average—are
in dark orange, while those that have less than 6 percent are in light orange.55 While the maps do not
match perfectly, we see some striking similarities between them; many zip codes in both figures are either
light orange or dark orange. Like our bivariate correlation table (table 6, p. 10), these two maps together
suggest that the areas that demand more $100 bills tend to be areas with a higher proportion of Latin
American immigrants.
Given our observations, the visual and statistical arguments, and the facts presented earlier, we introduce
four hypotheses to test empirically.
1. Neighborhoods (measured at the zip code level) having a greater share of Latin American immi-
grants will demand more $100 bills, all else being equal. These neighborhoods are likely to have
a large share of residents who do not have bank accounts and who use cash to pay bills, accumu-
late cash, and remit funds to their home countries.
2. Immigrants from other regions of the world may or may not demand more $100 bills. These im-
migrants are, on average, more educated and earn more. They speak English more competently
than Latin American immigrants, though by a very slim margin. Thus, it is difficult to predict
whether they might demand less, more, or the same amount and denomination of currency as
Latin American immigrants.
3. The demand for other denominations ($5 bills and $20 bills) will be lower for Latin American
immigrants than the demand for $100 bills. Twenty dollar bills (dispensed by about 94 percent of
ATMs in the U.S. in 2006) will be received by virtually all residents who obtain cash from
ATMs; $5 bills, the third smallest denomination available in U.S. bank notes, will not likely be
used as a store of value or to pay large bills in cash (such as rent).56
4. Residents in low-income neighborhoods who rent are more likely to pay that rent in cash than
residents in middle- to high-income neighborhoods. Therefore, the demand for cash will be
greater in lower-income neighborhood with a higher proportion of renters.
17
Regression analysis
To empirically test our hypotheses, we estimate a model of cash orders (flows) as a function of the for-
eign-born Latin American population and the control variables listed previously.
The regression equation is as follows:
iiiiidi eXBNonLALACashOrders
i++++= 321 ββα (1)
where CashOrders are, alternatively, either the amount per capita (in logs) of $5 bills, $20 bills, $100
bills, or all denominations of currency in the Chicago area; i indexes zip codes; d represents the alterna-
tive denomination ($5 bills, $20 bills, $100 bills, or all denominations) used in our analysis; and e is an
unobserved error term. The variable LA is the proportion of Latin American immigrants to total residents
per zip code, and the variable NonLA is the proportion of immigrants not from Latin America to total resi-
dents per zip code. Finally, X is a vector of variables (discussed earlier) that accounts for differential
transaction costs of holding currency and local demand for currency. It includes the following: ratio of
workers to residents, money transmitters per capita, payday lenders per capita, median age of residents,
log of median household income, attendance at tourist attractions per capita, proportion of residents with
college education (of those 25 years and older), crime index, and proportion of residents who rent,
which is also interacted with the log of median income. The regression coefficients are represented by a,
ß1, and ß2 and the vector, B3, in the equation.
Empirical results
Table 8 contains our regression results. We find highly statistically significant results for the regressions
using the log of $100 bills per capita, but less significant results for the other currency breakdowns (sta-
tistical significance levels are noted in the table). The first column of results in table 8 lists our results
for the regression using the log of $5 bills per capita as the dependant variable (CashOrders). The R-
squared is 0.2900. The only coefficients that are statistically significant at the 1 percent level are the
proportion of immigrants not from Latin America (with a coefficient estimate of –10.9114) and median
age (0.1413). This suggests that areas with a higher proportion of immigrants from regions other than
Latin America tend to use fewer $5 bills, and neighborhoods with older populations tend to hold more
cash.
18
The second column contains regression results using the log of $20 bills per capita. In this regression,
the following coefficients are statistically significant: the log of median household income at the 10 per-
cent level (with a coefficient estimate of 3.2890), the proportion of foreign-born residents not from Latin
America at the 1 percent level (–7.0775), and the crime index at the 5 percent level (0.2261).
The third column, the focus of our regression analysis, contains results using CashOrders equal to the
log of $100 bills per capita as the dependant variable. These results are strikingly different from those
using the log of $5 bills per capita and the log of $20 bills per capita. The coefficient on Latin American
immigrants is positive and significant for $100 bills—a result that supports our hypothesis that this group
demands more $100 bills than both native-born residents and immigrants from regions other than Latin
America. The coefficient is 3.9110 and is significant at the 5 percent level. Moreover, the economic im-
plication of this finding is significant; a one standard deviation increase in the percentage of Latin
American immigrants increases the demand for $100 bills by 42 percent. Converting these semi-elasticity
results to dollars, the coefficient represents an average holding of $266 per capita per year for Latin
American immigrants. A similar result (not shown in the table) for 2004 of $329 gives us an average hold-
ing of about three extra $100 bills for each Latin American immigrant.
Several other coefficients are statistically significant in this regression as well. The number of money
transmitting firms is positive and statistically significant (8.3612) at the 10 percent level, suggesting that
in neighborhoods with a greater number of money transmitting firms, residents tend to demand more
$100 bills. Presumably this behavior reflects the accumulation of cash to make periodic remittances to
the home country.
Median age is positive and significant (0.1473) at the 1 percent level, a result that implies that older
residents tend to hold more $100 bills. This could reflect a legacy of distrust of the banking system, be-
cause the residents themselves or their immediate family members experienced losses at banks in the
past.
The log of the median household income is positive and significant (3.7920) at the 1 percent level, im-
plying that higher income earners tend to hold more $100 bills. The proportion of college educated,
however, is negative and significant (–4.3087) at the 5 percent level, which we interpret as meaning that
more education leads them to utilize other payment methods. The coefficient on rented housing units is

19
positive and significant, while the coefficient on the interaction term between rented housing units and
the log of median household income is negative and significant (both at the 1 percent level), with the
overall net effect of the two terms being positive. We infer from this result that the demand for $100 bills
in neighborhoods with a greater proportion of rental units is higher because some proportion of those ten-
ants will pay their rent in cash, especially in lower-income neighborhoods. This result is consistent with
our hypothesis that demand for cash will be greater in neighborhoods with higher proportions of lower-
income residents and rental units.
The fourth column contains results similar to those using the log of $100 bills per capita; it lists the regres-
sion coefficients using the log of the value of all denominations of currency per capita as the dependent
variable. Since $100 bills tend to make up the largest proportion of the “all denominations” variable, it is
no surprise that the results for this variable parallel those for the log of $100 bills per capita. The R-squared
statistic of this regression is 0.2059. The following variables are statistically significant: median age (with
a positive coefficient), log of median household income (positive), the proportion of immigrants from
regions other than Latin America (negative), attendance at tourist attractions (negative), and the propor-
tion of college educated (negative).
The proportion of foreign-born residents not from Latin America is negative and significant in all four
regressions, which implies, generally, that neighborhoods with a greater percentage of foreign-born resi-
dents who are not from Latin America demand less currency, all else being equal. There are a number of
possible explanations. It could be that such foreign-born residents are more likely to have bank accounts
and conduct transactions using electronic payment methods and less currency. We will explore this issue
in future research.
To check for robustness, we also explore the demand for currency among two other groups, African
Americans and Polish immigrants. Currency demand may be different for African Americans than other
native-born residents because many African Americans remain unbanked—an estimated 46 percent of
them, according to the SIPP (see table 5, p. 9). Moreover, a recent study finds that both Latin Americans
and African Americans perceive that they do not have sufficient income to justify having a bank ac-
count.57 If this is true, African Americans should hold more cash. We test this hypothesis. We find that
African Americans demand slightly more $20 bills than other residents, though this result is relatively
weak (significant at only the 10 percent level). We find no difference in the demand for currency for any

20
other denomination for African Americans relative to other native-born residents. Next, we examine cur-
rency demand among Polish immigrants. We find that the demand for currency among Polish immi-
grants is similar to that of other foreign-born non-Latino residents and has the opposite sign to that for
Latin American immigrants. This result might suggest that Polish immigrants have a faster rate of as-
similation than Latin American immigrants do with regard to banking activities.
We interpret our regression results, specifically those using $100 bills, as directly bearing on the obsta-
cles to financial access that Latin American immigrants face and/or their reluctance to open and maintain
bank accounts. Moreover, these results may tell us more about portfolio holdings than the traditional trans-
action demand for money. Presumably the $5 and $20 denominations matter more than the $100 de-
nomination for many day-to-day smaller-scale transactions, while the $100 bills are primarily used as a
store of wealth, in part because some retail outlets will not accept them in exchange for goods or services.
Thus, the significant statistical finding for the $100 denomination for immigrants is suggestive of wealth
accumulation in this denomination. For recent immigrants, the two important uses for $100 bills are for
wired remittances (through such vehicles as Western Union), which are often done monthly, and for in-
person cash remittances, which are often done on a yearly basis. Other important uses include paying
rent and large bills.
Conclusion
In this paper, we examine the demand for cash (namely, $5 bills, $20 bills, and $100 bills) among Latin
American immigrants. As a result of their background and obstacles to obtaining and using deposit ac-
counts at financial institutions, a larger portion of Latin American immigrants (compared with native-
born residents and foreign-born non-Latino residents) appear to hold the cash they acquire rather than
depositing it in a transaction account. We investigate to what degree Latin American immigrants hold
more cash than other population groups by examining neighborhoods (by zip codes) with high densities
of Latin American immigrants and testing whether there is a significant increase in cash usage in those
locations. We find that the demand for $100 bills is greater in areas with high concentrations of foreign-
born Latin Americans. Our results suggest that Latin American immigrants are holding these bills as a
store of value, since the convenience of this large denomination in day-to-day transactions is limited.
Our study adds to the sizable literature on the unbanked population in the United States. Generally, these
studies describe characteristics of those who are unbanked. They are, on average, more likely to have a

21
lower income, lower net worth, and lower level of education than the general population; also, the un-
banked are less likely to own a home and are more likely to be a member of a minority race and be for-
eign-born. Our study complements this literature; it provides some evidence that unbanked Latin Ameri-
can immigrants may store their wealth in $100 bills. This behavior is not surprising. Many foreign-born
residents from Latin America in the United States were familiar with the U.S. currency before arriving;
they see U.S. bank notes as an attractive brand that holds its value (unlike some currencies that have ex-
perienced dramatic inflation).
Transaction costs associated with getting a bank account, language barriers, and general distrust of bank-
ing systems all contribute to Latin American immigrants’ predisposition to accumulate wealth in the
form of cash. To move these immigrants into the formal financial sector requires overcoming these barri-
ers and transaction costs. A sense of trust in banks must be instilled among Latin American immigrants.
This might be achieved through banks providing a similar set of products and services to those offered
by fringe institutions (and with which immigrants are familiar), at attractive prices. Banks are beginning
to realize the importance of encouraging Latin American immigrants to establish relationships with
them, and some have established check-cashing or remittance (money transfer) services, though, as we
noted earlier, they have not yet made significant inroads into this market.58
At the outset, we raised the question of whether the behavior of this immigrant group and, in particular,
the rapidly growing number of undocumented workers from Mexico and Central America might lie be-
hind the recent increase in real per capita domestic holdings of currency in the U.S. With the data we
analyze in this article, we cannot answer this question for the entire country. However, our study of the
Chicago metro area suggests that this topic warrants deeper investigation.

22
NOTES
1Gleick (1996). 2Economist Newspaper Limited (2007); Moore (1965); and Jovanovic and Rousseau (2002). 3The check infrastructure has already witnessed such disruptions. 4Suro et al. (2004). 5This shrinkage is less mysterious if one recognizes that in 1956 the largest denomination was a $10,000 note, while in 2006 it was a $100 note. For 2006, the calculation assumes that the average worker works 215 days a year. 6American Bankers Association and Dove Consulting (2005), table 1.11a. The survey reported 45.4 percent of respondents used cash less often, while just 16.2 percent of respondents used cash more often. 7American Bankers Association and Dove Consulting (2005), table 1.11c. 8Ibid., table 1.11b. 9Lindsey (1994–95). 10Currency demand rose in the year and a half preceding the date change. When no disruption occurred in financial systems across the globe around Y2K, households shed some of the additional precautionary cash balances they had acquired rela-tively quickly. This latter action reduced the ratio temporarily. 11For a discussion of these estimates, see Bach (1997) and Porter and Judson (1996). 12See Porter and Judson (1996) and Judson and Porter (2004). 13See Baumol (1952) and Tobin (1956). 14If currency accumulates over longer periods until it is used for remittances or for precautionary expenditures, the pattern will also follow a saw-tooth pattern, but with higher peaks and sharper drop-offs. 15Cagan (1958). 16See, for example, Porter and Bayer (1989), Porter and Weinbach (1999), and Judson and Porter (2004). 17A basic difficulty is that the sign on crime in the demand for currency regression is not obvious a priori. If criminals use currency to the exclusion of other payment methods, an increase in criminal activity may be associated with an increase in currency. The effect of such an increase on noncriminal elements depends on the nature of the crime. It is generally believed that in countries with relatively low rates of crime like Japan and Switzerland, cash holdings tend to be larger. However, one cannot rule out the possibility that an increase in violent crime might lead to some increase in currency holdings held merely to placate erstwhile robbers. 18Chicago has been an important gateway for the Mexican community into the upper Midwest for over 125 years. 19Massey and Espinosa (1997). 20To minimize the negative effect of inflation on the purchasing power of money, individuals have to spend time and effort protecting the value of their nominal assets—wearing out their shoes on the way back and forth to the bank. Economists use the shorthand “shoe leather” costs to describe these “brokerage” fees. 21Mulligan and Sala-i-Martin (2000). 22See the U.S. Census Bureau’s 2005 American Community Survey. 23Borjas and Katz (2005), p. 3. 24These series are from Passel (2005) with his estimate shown for 2010. 25Suro and Singer (2002). 26Paral and Norkewicz (2003). 27The source of data is the 2000 U.S. Census. For this reason, we concentrate our study on the Chicago area. Of the 12 Federal Reserve Districts, five have a significant Latino presence:

23
Atlanta, Chicago, Dallas, Richmond, and San Francisco. But several of the cash offices serving these Districts also represent significant transshipment locations for international shipments into and out of the United States. This international dimension confounds any analysis of local currency orders, particularly for cash offices in New York, Miami, and San Francisco and three Texas offices (El Paso, San Antonio, and Houston) in the Dallas Federal Reserve District. See Judson and Porter (2004) for panel data regression results that include and exclude various offices from currency demand specifications. 28A transaction account is defined as a savings or checking account. 29The SIPP estimate of the unbanked among all U.S. born is 17 percent (about twice as high as the Federal Reserve Board’s 2000 Survey of Consumer Finances). This disparity arises because the SIPP purposely attempts to sample a higher proportion of respondents in lower-income categories. 30Bucks, Kennickell, Moore (2006). Other reasons cited (with less than 10 percent frequency) were as follows: cannot man-age a checking account, find the minimum balance is too high, do not want an account, and have credit problems. 31As a result of the geographic isolation in Mexico, with innumerable mountain valleys separating native groups, a number of distinct dialects and/or languages emerged. It is estimated that around 10 percent of the Mexican population speaks one of these indigenous Indian languages. See, for example, www.houstonculture.org/ mexico/ling.html. 32Orozco (2004). 33Suro et al. (2004). 34See Porter and Judson (1996), table 1, and U.S. Department of the Treasury, Board of Governors of the Federal Reserve System, and U.S. Secret Service (2003), table 3.3. 35Massey and Espinosa (1997). Merriam-Webster’s online dictionary defines a coyote as “one who smuggles immigrants into the United States.” 36Inter-American Development Bank and Multilateral Investment Fund (2005). Countries included are: Argentina, Belize, Bolivia, Brazil, Colombia, Costa Rica, Dominican Republic, Ecuador, El Salvador, Guatemala, Guyana, Haiti, Honduras, Jamaica, Mexico, Nicaragua, Panama, Paraguay, Peru, Suriname, Trinidad and Tobago, Uruguay, and Venezuela. 37Suro et al. (2004). 38Orozco (2004). 39Detailed remittance information is available from the Inter-American Development Bank; see www.iadb.org/mif/remittances/usa/INDEX.cfm?language=en&parid=2&item1id=2&item2id=2. 40Amuedo-Dorantes, Bansak, and Pozo (2004). 41The Mexican immigrant neighborhoods in Chicago also include some second- and third-generation Latin American resi-dents, who may also tend to hold more currency as payment patterns change slowly over time. 42Ibarraran and Lubotsky (2007). 43Ibid., p. 32. 44Correspondent banks generally perform services for other banks (such as check clearing, currency, and courier services). The correspondents give these smaller banks access to financial markets to which they might not otherwise have entry (such as the foreign exchange or derivatives markets). 45To test whether the elimination of these institutions creates any direct bias in our empirical tests, we check whether the lo-cation of the community banks in our sample is correlated with the share of Latin American immigrants. The two series are uncorrelated. 46Paulson et al. (2006). 47Ibid. 48Amuedo-Dorantes, Bansak, and Pozo (2004). 49See American Bankers Association and Dove Consulting (2005), table 3.6a, which shows that of those with an annual in-come of less than $40,000, 10.6 percent self-report paying their rent or mortgage with cash, compared with 4.1 percent of those with an annual income of $40,000 to $99,999 and 0.9 percent of those with an annual income of $100,000 or more.
24
50Suro et al. (2004). 51This information can be found at www.chicagotraveler.com/ chicagos-largest-attractions.htm. 52Judson and Porter (2004) find implicit evidence for this at the cash office level. 53See www.fbi.gov/ucr/05cius/. The crime index includes violent crimes (murder, forcible rape, robbery, and aggravated as-sault) and property crimes (burglary, larceny-theft, motor vehicle theft, and arson). This FBI index reflects actual crime. It is therefore only indirectly an index of the risk of falling victim to crime. We assume that currency holders gauge the risk that they will encounter crime by the past experience in the neighborhood. We obtained these data by zip code at http://realestate.yahoo.com/Neighborhoods. 54The Mexican immigrant neighborhoods in Chicago will also include some second- and third-generation Latinos, who may also tend to hold more currency as payment patterns change slowly over time. These numbers are drawn from the 2000 U.S. Census, which was conducted in the midst of the most recent immigration boom from Mexico and Central America. As a result, it is quite possible that the next U.S. Census will reveal higher concentrations of Latinos than shown here. 55At 6 percent, Illinois ranks ninth in foreign-born Latin American residents, following California (15 percent), Florida (12 percent), Texas (10 percent), New York (10 percent), Nevada (10 percent), Arizona (9 percent), New Jersey (8 percent), and New Mexico (just over 6 percent). See the 2000 U.S. Census. 56The $2 denomination still exists but is used very infrequently. There are about seven times as many $5 bills as $2 bills in cir-culation. 57Seidman, Hababou, and Kramer (2005). 58In particular, the substitution of prepaid cards for currency in the immigrant community may also hold some promise. Pre-paid cards are cards that are purchased (say, with cash) and can be used on the existing card networks in the United States and elsewhere, just as debit cards and credit cards are used (Chakravorti and Lubasi, 2006).

25
REFERENCES
American Bankers Association and Dove Consulting, 2005, 2005/2006 Study of Consumer Payment Preferences, report, October, Washington, DC.
Amuedo-Dorantes, Cataline, Cynthia Bansak, and Susan Pozo, 2004, “On the remitting patterns of immi-grants: Evidence from Mexican survey data,” presentation at the conference, Payments in the Americas, Federal Re-serve Bank of Atlanta, October 7, available at www.frbatlanta.org/news/CONFEREN/ payments04/Amuedo-Dorantes.pdf.
Bach, Christopher L., 1997, “U.S. international transactions, revised estimates for 1974–96,” Survey of Current Business, July, available at www.bea.gov/scb/pdf/internat/bpa/1997/0797bop.pdf.
Baumol, William J., 1952, “The transactions demand for cash: An inventory-theoretic approach,” Quarterly Jour-nal of Economics, Vol. 66, No. 4, November, pp. 545–556.
Borjas, George J., and Lawrence F. Katz, 2005, “Evolution of the Mexican-born work force in the United States,” National Bureau of Economic Research, working paper, No. 11281, April.
Bucks, Brian K., Arthur B. Kennickell, and Kevin B. Moore, 2006, “Recent changes in U.S. family finances: Evidence from the 2001 and 2004 Survey of Consumer Finances,” Federal Reserve Bulletin, Board of Governors of the Federal Reserve System, Vol. 92, March 22, pp. A1–A38.
Cagan, Phillip, 1958, “The demand for currency relative to the total money supply,” Journal of Political Econ-omy, Vol. 66, No. 4, August, pp. 303–328.
Chakravorti, Sujit, and Victor Lubasi, 2006, “Payment instrument choice: The case of prepaid cards,” Eco-nomic Perspectives, Federal Reserve Bank of Chicago, Vol. 30, No. 2, Second Quarter, pp. 29–43.
Economist Newspaper Limited, 2007, “The end of the cash era,” Economist, Vol. 382, No. 8516, February 17–23, p. 13.
Gleick, James, 1996, “The end of cash,” New York Times Magazine, June 16.
Ibarraran, Pablo, and Darren Lubotsky, 2007, “Mexican immigration and self-selection: New evidence from the 2000 Mexican Census,” in Mexican Immigration to the United States, George Borjas (ed.), Chicago: University of Chicago Press, forthcoming.
Inter-American Development Bank and Multilateral Investment Fund, 2006, Remittances 2005: Promoting Financial Democracy, report, Washington, DC, March.
Jovanovic, Boyan, and Peter Rousseau, 2002, “Moore’s law and learning by doing,” Review of Economic Dy-namics, Vol. 5, pp. 346–375.
Judson, Ruth A., and Richard D. Porter, 2004, “Currency demand by Federal Reserve cash office: What do we know?,” Journal of Economics and Business, Vol. 56, No. 4, July–August, pp. 273–285.
Lindsey, Lawrence B., 1994–95, “America’s most ignored export,” Durell Journal of Money and Banking, Vol. 6, Winter, pp. 2–5.
Massey, Douglas S., and Kristin E. Espinosa, 1997, “What’s driving Mexico–U.S. migration? A theoretical, em-pirical, and policy analysis,” American Journal of Sociology, Vol. 102, No. 4, January, pp. 939–999.
Moore, Gordon E., 1965, “Cramming more components onto integrated circuits,” Electronics Magazine, Vol. 38, No. 8, April 19.

26
Mulligan Casey B., and Xavier Sala-i-Martin, 2000, “Extensive margins and the demand for money at low in-terest rates,” Journal of Political Economy, Vol. 108, No. 5. October, pp. 961–991.
Orozco, Manuel, 2004, “The remittance marketplace: Prices, policy, and financial institutions,” Pew Hispanic Center, report, June.
Paral, Rob, and Michael Norkewicz, 2003, The Metro Chicago Immigration Fact Book, Chicago: Roosevelt University, Institute for Metropolitan Affairs, June.
Passel, Jeffrey S., 2005, “Unauthorized migrants: Numbers and characteristics,” Pew Hispanic Center, report, June 14.
Paulson, Anna, Audrey Singer, Robin Newberger, and Jeremy Smith, 2006, Financial Access for Immi-grants: Lessons from Diverse Perspectives, Federal Reserve Bank of Chicago and Brookings Institution, report, May.
Porter, Richard D., and Amanda Bayer, 1989, “Monetary perspective on underground economic activity in the United States,” in The Underground Economies: Tax Evasion and Information Distortion, Edgar L. Feige (ed.), Cambridge, UK: Cambridge University Press.
Porter, Richard D., and Ruth Judson, 1996, “The location of U.S. currency: How much is abroad?” Federal Reserve Bulletin, Board of Governors of the Federal Reserve System, Vol. 82, October, pp. 883–903.
Porter, Richard D., and Gretchen Weinbach, 1999, “Currency ratios and U.S. underground economic activity,” Economic Letters, Vol. 63, No. 3, June, pp. 355–361.
Seidman, Ellen, Moez Hababou, and Jennifer Kramer, 2005, A Financial Services Survey of Low- and Moder-ate-Income Households, Center for Financial Services Innovation, report, July.
Singer, Audrey, 2004, “The rise of new immigrant gateways,” Living Cities Census Series, Brookings Institu-tion, Center on Urban and Metropolitan Policy, report, February.
Suro, Roberto, Sergio Bendixen, B. Lindsay Lowell, and Dulce C. Benavides, 2004, “Billions in motion: La-tino immigrants, remittances, and banking,” Pew Hispanic Center and Multilateral Investment Fund, report, No-vember.
Suro, Roberto, and Audrey Singer, 2002, “Latino growth in metropolitan America: Changing patterns, new lo-cations,” Survey Series, Census 2000, Brookings Institution, Center on Urban and Metropolitan Policy, and Pew Hispanic Center, report, July.
Tobin, James, 1956, “The interest elasticity of the transactions demand for cash,” Review of Economics and Sta-tistics, Vol. 38, No. 3, August, pp. 241–247.
U.S. Department of the Treasury, Board of Governors of the Federal Reserve System, and U.S. Secret Service, 2006, The Use and Counterfeiting of United States Currency Abroad, Part 3, report, Washington, DC: U.S. De-partment of the Treasury, September.
__________, 2003, The Use and Counterfeiting of United States Currency Abroad, Part 2, report, Washington, DC: U.S. Department of the Treasury, March.

27
Table 1
U.S. Banknotes in Circulation (Billions of dollars, except as noted)
$20s, billions $100s,billions District Received Paid Net Received Paid Net Boston 19 18.8 -0.2 4.3 5.5 1.2
New York 48.4 48 -0.4 76.5 89.8 13.3 Philadelphia 25.2 23.5 -1.7 10.4 7.7 -2.7 Cleveland 16 16.6 0.6 4.9 5.9 1 Richmond 32.5 37.9 5.4 12.9 18 5.1
Atlanta 47.4 44.1 -3.3 34.6 34.3 -0.2 Chicago 31.1 34.1 3.1 10.8 14.9 4 St. Louis 11.3 11.8 0.6 6.4 8 1.6
Minneapolis 6.4 6.7 0.4 2.3 3 0.7 Kansas City 13.2 13.8 0.6 6.3 7.6 1.4
Dallas 20.1 19 -1 14.9 15.1 0.1 San Francisco 49.9 45.7 -4.3 35.4 39.9 4.5
Total 320.4 320.2 -0.2 219.7 249.6 29.9
Source: United States Department of the Treasury, Board of Governors of the Federal Reserve System and U.S. Se-cret Service (2006).

28
Table 2 Shipments of $5s, $20s, and $100s by District, 2005
$5s, billions $20s, billions $100s, billions Fed District Received Paid Net Received Paid Net Received Paid Net
Boston 0.6 0.7 0 19 19 0.3 4.7 5.7 1 New York 1.7 1.6 -0.1 48 49.4 1 70.9 88 17.1 Philadelphia 0.6 0.8 0.1 21 22.7 1.8 9.2 7.2 -2 Cleveland 0.8 0.8 0 17 18.1 1.4 5.8 7.3 1.4 Richmond 1.1 1.2 0.1 34 36.2 2.6 14.1 17.9 3.7 Atlanta 2.5 2.4 0 48 45.4 -2 44.3 36.9 -7.5 Chicago 1.4 1.5 0.1 31 34.3 3.8 11.1 15 4 St. Louis 0.5 0.5 0 9.5 9.8 0.3 6.5 7.9 1.4 Minneapolis 0.3 0.3 0 5.9 6.4 0.5 2.4 3.1 0.7 Kansas City 0.6 0.7 0 13 13.5 1 6.4 8.1 1.7 Dallas 1.1 1.1 0 21 21.3 0 16.5 17.7 1.2 San Francisco 2.5 2.6 0.1 51 47.9 -3 37.4 43.1 5.7 Total 13.7 14 0.5 316 324.1 7.7 229.2 257.7 28.5
Source: Federal Reserve System

29
Table 3 Region of Birth of the Foreign-Born Population
1820-2000
Period Total Europe Asia Americas Africa Oceana1820-30 151,824 106,487 36 11,951 17 33,3331831-40 599,125 495,681 53 33,424 54 69,9111841-50 1,713,251 1,597,442 141 62,469 55 53,1441851-60 2,598,214 2,452,577 41,538 74,720 210 29,1691861-70 2,314,824 2,065,141 64,759 166,607 312 18,0051871-80 2,812,191 2,271,925 124,160 404,044 358 11,7041881-90 5,246,613 4,735,484 69,942 426,967 857 13,3631891-00 3,687,564 3,555,352 74,862 38,972 350 18,0281901-10 8,795,386 8,056,040 323,543 361,888 7,368 46,5471911-20 5,735,811 4,321,887 247,236 1,143,671 8,443 14,5741921-30 4,107,209 2,463,194 112,059 1,516,716 6,286 8,9541931-40 528,431 347,566 16,595 160,037 1,750 2,4831941-50 1,035,039 621,147 37,028 354,804 7,367 14,6931951-60 2,515,479 1,325,727 153,249 996,944 14,092 25,4671961-70 3,321,677 1,123,492 427,642 1,716,374 28,954 25,2151971-80 4,493,314 800,368 1,588,178 1,982,735 80,779 41,2541981-90 7,338,062 761,550 2,738,157 3,615,225 176,893 46,2371991-20000 9,095,417 1,359,737 2,795,672 4,486,806 354,939 98,263
Source: U.S. Census

30
Table 4 Recent Patterns of Mexican Immigration
1980-1989
1990-1994
1995-1999
2000-2004
Mexican Immigrants to U.S.
Thousands per year undocumented 130 450 750 700
legal 650 670 660 610 total 780 1,120 1,400 1,310
Source: Passel (2005)
Table 5 Percent of Unbanked in the US (2000) U.S.-Born and Foreign-Born Populations
(As a percentage of each group)
U.S. Born
Foreign-born
White 14% Mexican 53%
Black 46% Other Latin American 37%
Hispanic 34% Asian 20%
Other Race 34% European 17%
Total 17% Total 32%
Source: United States Census Bureau, 2000 Survey of Income Program Participation.

31
Table 6 Bivariate correlation between currency demand and proportion of immigrants
per zip code, 2005
$5s per capita
$20s per capita
$100s per capita
all $ per capita
Propor-tion na-
tive- born residents
Propor-tion Latin American residents
% foreign born, not Latinos
$5s per capita
-0.0148
$20s per
capita 0.8454
0.411 -0.015
$100s per capita 0 0.8434
0.0216 0.9979 0.0473
all bills per capita 0.7764 0 0.5329
0.1127 0.0098 -0.0165 0.0106
Proportion native-born
residents 0.1363 0.8972 0.8283 0.8893
0.018 -0.057 0.1454 -0.0471 -0.7348
Proportion
Latin Ameri-can residents 0.8129 0.4527 0.0541 0.5347 0
-0.1854 0.0464 -0.1311 0.0348 -0.6889 0.0145
% foreign born, not Latinos 0.0138 0.5407 0.0828 0.647 0 0.8488
The first (top) number in each row is the correlation and the second (bottom) number is the p-value. Sources: Authors’ calculations based on data from the Federal Reserve Bank of Chicago and U.S. Census Bureau.
32
Table 7 Summary Statistics
Variable N Mean Std. Dev. Min Max
Ln $5s per capita 158 1.42 1.61 -3.54 4.82Ln $20s per capita 173 4.11 1.97 -0.81 11.01Ln $100s per capita 169 4.22 1.53 -0.28 7.69Ln All denominations per capita 175 5.42 1.48 1.81 11.18 $5s per capita 175 10.32 16.86 0.00 123.86$20s per capita 175 539.16 4,582.48 0.00 60,677.80$100s per capita 175 168.68 270.64 0.00 2,193.73All denominations per capita 175 891.95 5,440.23 6.14 71,974.94 Ratio of workers / residents 175 0.79 1.54 0.00 18.10ATMs per capita 175 0.00 0.00 0.00 0.01Money transmitters per capita 175 0.00 0.02 0.00 0.19Payday lenders per capita 175 0.04 0.07 0.00 0.59Median age 175 35.20 4.33 23.80 47.00Median income 175 58,475 18,996 14,205 138,525Ln median household income 175 10.92 0.33 9.56 11.84Proportion Latin American Immigrants 175 0.06 0.09 0.00 0.49Proportion immigrants not from Latin Amer-ica 175 0.09 0.08 0.00 0.41Attendance at tourist attractions per capita 175 11.74 80.09 0.00 971.10Proportion college educated (> 25 years) 175 0.31 0.18 0.04 0.78Crime Index 175 4.01 2.13 1.00 8.30Proportion rented housing units 175 0.35 0.25 0.02 0.98Proportion rented housing units * Ln median household income 175 3.77 2.64 0.26 10.95Proportion polish ancestry 175 0.10 0.06 0.00 0.31Proportion African-American 175 0.13 0.23 0.00 0.99

33
Table 8 Regression Results from Equation 1
iiiiidi eXBNonLALACashOrders
i++++= 321 ββα
Standard errors are included below the coefficient estimate. The superscripts ***, **, * represent statistical significance at the 1 percent, 5 percent and 10 percent, respectively. The dependent variables (fives, twenties, hundreds, and all denomina-tions) are logged values per capita. We use OLS with robust errors (White-corrected standard errors).
1 2 3 4
Ln $5s Ln $20s Ln $100s
per capita per cap-
ita per cap-
ita
Ln all de-nomina-tions per
capita Ratio of workers / residents -0.0941 0.2742 -0.0538 0.3605 0.1413 0.3517 0.1936 0.23 ATMS per capita 168.4424 336.9934 144.7178 54.6092 132.5731 269.1874 173.658 178.5395 Money transmitters per capita -6.0245 -7.9953 8.3612 * 5.558 4.0282 5.6453 4.5289 3.9914 Payday lenders per capita 0.4495 0.21 0.1198 -0.7994 2.4617 3.2977 2.7129 2.0543 Median age 0.1413 *** 0.0351 0.1473 *** 0.0868 ** 0.0391 0.0516 0.0478 0.04 Ln median household income 2.3523 3.289 * 3.792 *** 3.0254 ** 1.5101 1.8717 1.3639 1.2223 Proportion foreign born Latinos 0.7273 -0.4011 3.911 ** 1.2131 1.9928 1.9181 1.7138 1.5443 Proportion foreign born, not Latinos -10.9114 *** -7.0775 *** -6.2651 *** -7.4823 *** 1.6754 2.1212 1.6547 1.558 Attendance at tourist attractions per capita 0.0017 -0.0073 0.0009 -0.0053 * 0.0022 0.0045 0.0022 0.0029 Proportion college educated (> 25 years) -2.2807 -3.6899 -4.3087 ** -3.0888 * 1.7597 2.2636 1.7944 1.6041 Crime 0.1102 0.2261 ** -0.0425 0.1133 0.0848 0.1085 0.0789 0.0823 Proportion rented housing units 2.6449 -7.2145 38.6101 *** 11.0544 13.632 17.783 13.456 11.3529 Proportion rented housing units * Ln median household income 0.0661 0.86 -3.2647 *** -0.7287 1.2253 1.5971 1.2019 1.0167 Constant -29.2618 * -33.1942 -41.8754 *** -30.9275 ** 16.7418 20.9298 15.3209 13.7003 # Observations 158 173 169 175 R-squared 0.29 0.1945 0.1953 0.2059

34
Figure 1: Ratio of Total Currency to GDP
3.0%
3.5%
4.0%
4.5%
5.0%
5.5%
6.0%
6.5%
1965 1967 1969 1971 1973 1975 1977 1979 1981 1983 1985 1987 1989 1991 1993 1995 1997 1999 2001 2003 2005
Source: Federal Reserve Board

35
Figure 2: Ratio of Domestic Currency to GDP
2.0%
2.5%
3.0%
3.5%
4.0%
4.5%
5.0%
1965 1967 1969 1971 1973 1975 1977 1979 1981 1983 1985 1987 1989 1991 1993 1995 1997 1999 2001 2003 2005Source: Federal Reserve Board

36
Figure 3: Currency per capita and Treasury note yield
$0
$200
$400
$600
$800
$1,000
$1,200
$1,400
$1,600
1965 1967 1969 1971 1973 1975 1977 1979 1981 1983 1985 1987 1989 1991 1993 1995 1997 1999 2001 2003 2005
Source: Board of Govenors of the Federal Reserve System from Haver Analytics; Bureau of Labor Statitics; U.S. Census Bureau with Haver Estimates; Calculations made by the authors
0%
2%
4%
6%
8%
10%
12%
14%
16%
Currency per capita 5-Year Treasury Note Yield at Constant Maturity
Notes: LHS means left-hand scale. RHS means right-hand scale.

37
Figure 4: Historical Crime Rates
10,000
100,000
1,000,000
10,000,000
100,000,000
1970 1972 1974 1976 1978 1980 1982 1984 1986 1988 1990 1992 1994 1996 1998 2000 2002 2004Source: FBI, Uniform Crime Reports
Rat
e pe
r 100
,000
, rat
io s
cale
All ages total crimesAdult drug crimesJuvenile drug crimes
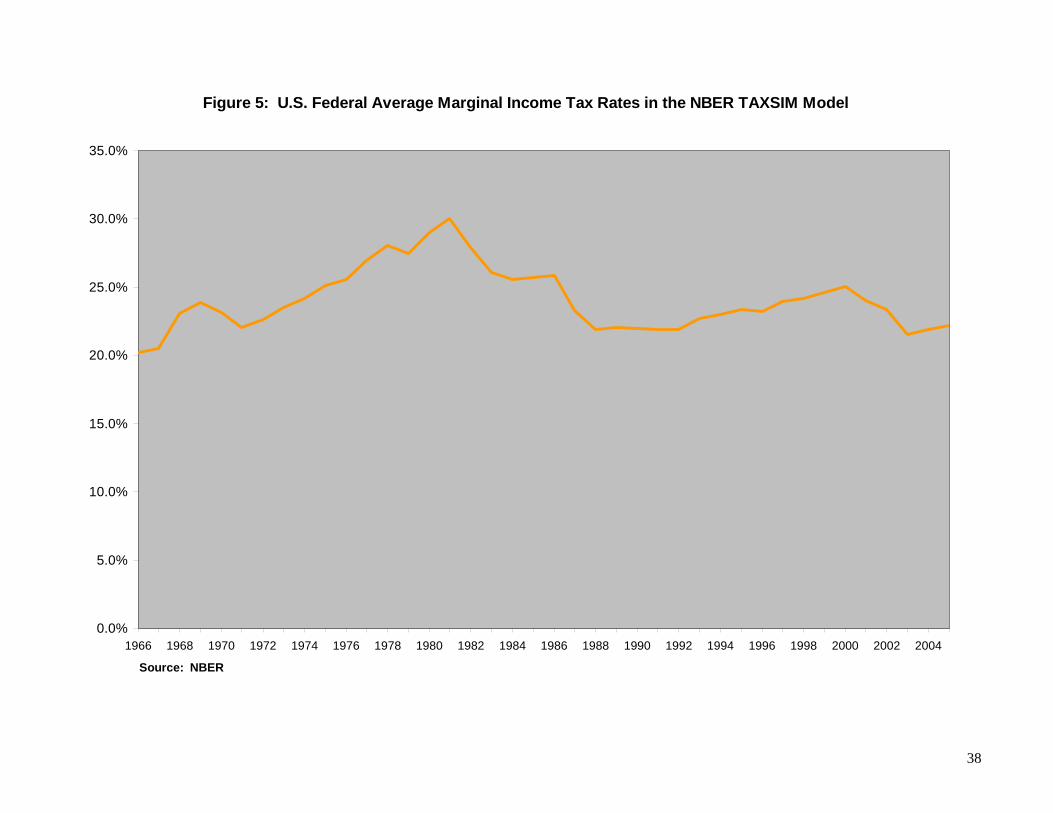
38
Figure 5: U.S. Federal Average Marginal Income Tax Rates in the NBER TAXSIM Model
0.0%
5.0%
10.0%
15.0%
20.0%
25.0%
30.0%
35.0%
1966 1968 1970 1972 1974 1976 1978 1980 1982 1984 1986 1988 1990 1992 1994 1996 1998 2000 2002 2004
Source: NBER

39
Figure 6: Mexican-Born Population in the U.S.
0
1,000
2,000
3,000
4,000
5,000
6,000
7,000
8,000
9,000
10,000
1850 1860 1870 1880 1890 1900 1910 1920 1930 1940 1950 1960 1970 1980 1990 2000
Source: Jeffery Passel, Pew Hispanic Center (see references)
thou
sand
s

40
Figure 7
Zip Codes included in study

41
Figure 8 Aggregate Orders for $100s per zip code in the Chicago area: 2005
Source: Authors calculations using Federal Reserve Bank of Chicago data

42
Figure 9 Proportion of Foreign Born Latin Americans per zip code: 2000
Source: US Census


