
AFRL-RX-WP-TP-2010-4161
AB-INITIO SIMULATIONS OF MOLTEN Ni ALLOYS (PREPRINT) Christopher Woodward Metals Branch Metals, Ceramics & NDE Division Mark Asta University of California Dallas R. Trinkle University of Illinois, Urbana-Champaign James Lill High Performance Technologies Inc. Stefano Angioletti-Uberti Imperial College London
APRIL 2010
Approved for public release; distribution unlimited. See additional restrictions described on inside pages
STINFO COPY
AIR FORCE RESEARCH LABORATORY MATERIALS AND MANUFACTURING DIRECTORATE
WRIGHT-PATTERSON AIR FORCE BASE, OH 45433-7750 AIR FORCE MATERIEL COMMAND
UNITED STATES AIR FORCE
i
REPORT DOCUMENTATION PAGE Form Approved
OMB No. 0704-0188
The public reporting burden for this collection of information is estimated to average 1 hour per response, including the time for reviewing instructions, searching existing data sources, gathering and maintaining the data needed, and completing and reviewing the collection of information. Send comments regarding this burden estimate or any other aspect of this collection of information, including suggestions for reducing this burden, to Department of Defense, Washington Headquarters Services, Directorate for Information Operations and Reports (0704-0188), 1215 Jefferson Davis Highway, Suite 1204, Arlington, VA 22202-4302. Respondents should be aware that notwithstanding any other provision of law, no person shall be subject to any penalty for failing to comply with a collection of information if it does not display a currently valid OMB control number. PLEASE DO NOT RETURN YOUR FORM TO THE ABOVE ADDRESS.
1. REPORT DATE (DD-MM-YY) 2. REPORT TYPE 3. DATES COVERED (From - To)
April 2010 Journal Article Preprint 01 April 2010 – 01 April 2010 4. TITLE AND SUBTITLE
AB-INITIO SIMULATIONS OF MOLTEN Ni ALLOYS (PREPRINT) 5a. CONTRACT NUMBER
In-house 5b. GRANT NUMBER
5c. PROGRAM ELEMENT NUMBER
62102F
6. AUTHOR(S)
Christopher Woodward (AFRL/RXLMD) Mark Asta (University of California) Dallas R. Trinkle (University of Illinois, Urbana-Champaign) James Lill (High Performance Technologies Inc.) Stefano Angioletti-Uberti (Imperial College London)
5d. PROJECT NUMBER
4347
5e. TASK NUMBER
RG
5f. WORK UNIT NUMBER
M02R1000
7. PERFORMING ORGANIZATION NAME(S) AND ADDRESS(ES) 8. PERFORMING ORGANIZATION
Metals Branch (AFRL/RXLM) Metals, Ceramics & NDE Division Materials and Manufacturing Directorate Wright-Patterson Air Force Base, OH 45433-7750 Air Force Materiel Command, United States Air Force ------------------------------------------------------------------ University of California, Berkeley Department of Materials Science and Engineering Berkeley, CA 94720
University of Illinois, Urbana-Champaign Dept. of Materials Science & Engineering Urbana, IL 61801 --------------------------------------------------- High Performance Technologies Inc. Consultant at WPAFB Dayton, OH 45433-7817 --------------------------------------------------- Imperial College London Department of Materials Prince Consort Road 20 SW72BP London, UK
REPORT NUMBER
AFRL-RX-WP-TP-2010-4161
9. SPONSORING/MONITORING AGENCY NAME(S) AND ADDRESS(ES)
Air Force Research Laboratory
10. SPONSORING/MONITORING AGENCY ACRONYM(S)
Materials and Manufacturing Directorate Wright-Patterson Air Force Base, OH 45433-7750 Air Force Materiel Command United States Air Force
AFRL/RXLMD 11. SPONSORING/MONITORING AGENCY REPORT NUMBER(S)
AFRL-RX-WP-TP-2010-4161
12. DISTRIBUTION/AVAILABILITY STATEMENT
Approved for public release; distribution unlimited.
13. SUPPLEMENTARY NOTES Journal article submitted to Acta Materialia. PAO Case Number: 88ABW-2010-0637; Clearance Date: 18 Feb 2010. Paper contains color.
14. ABSTRACT Convective instabilities responsible for misoriented grains in directionally solidified turbine airfoils are produced by variations in liquid-metal density with composition and temperature across the solidification zone. Here, fundamental properties of molten Ni-based alloys, required for modeling these instabilities, are calculated using ab-initio molecular dynamics simulations. Equations of state are derived from constant number-volume-temperature ensembles at 1830 and 1750 K for elemental, binary (Ni-X, X= Al, W, Re, and Ta) and ternary (Ni-Al-X, X= W, Re, and Ta) Ni alloys. Calculated molar volumes agree to within 0.6-1.8% of available measurements. Predictions are used to investigate the range of accuracy of a parameterization of molar volumes with composition and temperature based on measurements of binary alloys. Structural analysis reveals a pronounced tendency for icosahedral short-range order for Ni-W and Ni-Re alloys and the calculations provide estimates of diffusion rates and their dependence on compositions and temperature.
15. SUBJECT TERMS Directional solidification, Density; Nickel alloys; Liquids; Diffusion-liquid; Ab-initio electron theory; Molecular dynamics
16. SECURITY CLASSIFICATION OF: 17. LIMITATION OF ABSTRACT:
SAR
18. NUMBER OF PAGES
32
19a. NAME OF RESPONSIBLE PERSON (Monitor)
a. REPORT Unclassified
b. ABSTRACT Unclassified
c. THIS PAGE Unclassified
Christopher F. Woodward 19b. TELEPHONE NUMBER (Include Area Code)
N/A
Standard Form 298 (Rev. 8-98) Prescribed by ANSI Std. Z39-18

Ab-initio Simulations of Molten Ni Alloys
Christopher Woodward
Materials and Manufacturing Directorate, Air Force Research Laboratory, Wright Patterson Air Force Base, Dayton,Ohio 45433-7817
Mark Asta
Department of Materials Science and Engineering, University of California, Berkeley, CA 94720, and Department ofChemical Engineering and Materials Science, University of California at Davis, Davis, CA 95616
Dallas R. Trinkle
Department of Materials Science and Engineering, University of Illinois, Urbana-Champain, Urbana, IL 61801
James Lill
High Performance Technologies Inc., Wright Patterson Air Force Base, Dayton, OH 45433-7817
Stefano Angioletti-UbertiDepartment of Materials, Imperial College London, Prince Consort Road 20, SW72BP London, UK
Abstract
Convective instabilities responsible for misoriented grains in directionally solidified turbine
airfoils are produced by variations in liquid-metal density with composition and temperature across
the solidification zone. Here, fundamental properties of molten Ni-based alloys, required for mod-
eling these instabilities, are calculated using ab-initio molecular dynamics simulations. Equations
of state are derived from constant number-volume-temperature ensembles at 1830 and 1750 K for
elemental, binary (Ni-X, X= Al, W, Re, and Ta) and ternary (Ni-Al-X, X= W, Re, and Ta) Ni
alloys. Calculated molar volumes agree to within 0.6-1.8% of available measurements. Predic-
tions are used to investigate the range of accuracy of a parametrization of molar volumes with
composition and temperature based on measurements of binary alloys. Structural analysis reveals
a pronounced tendency for icosahedral short-range order for Ni-W and Ni-Re alloys and the calcu-
lations provide estimates of diffusion rates and their dependence on compositions and temperature.
Key words: Directional solidification; Density; Nickel alloys; Liquids; Diffusion-liquid;
Ab-initio electron theory; Molecular dynamics1

The constant pressure to improve efficiency and performance of terrestrial and aero turbine en-
gines has produced significant materials and engineering challenges. The components that see
the highest temperatures, turbine airfoils, are actively cooled through internal channels and em-
ploy thermal barrier coatings that insulate the base alloy from the highest gas flow temperatures.
Modern airfoils are manufactured by a directional solidification process that produces a single
crystal Ni-based superalloy component with unrivaled high temperature properties. Superalloy
chemistries and airfoil geometries have become increasingly complex with each generation of
aero turbine engine design. While the evolving chemistry has produced significant improvements
in high temperature creep resistance, the increased levels of refractory elements are also associated
the formation of defects during processing. These so-called freckle defects are formed by density-
driven convective instabilities in the solidification front (i.e. the mushy zone) that result in chains
of small equiaxed grains. The high angle grain boundaries and compositional variations produced
by these defects are known to adversely affect mechanical properties. Quantitative models for
predicting the conditions leading to the formation of these defects are required for optimizing the
materials processing of these materials for high performance applications.
Currently there is also a strong desire in the aerospace material and design communities to
move toward a systems design approach that would enable optimization of the site specific proper-
ties of a component. The balance of material and component properties could then take advantage
of variations in the processing-structure-properties relationships of the material and the site spe-
cific requirements of the part. For single-crystal Ni-based superalloys this will require a quanti-
tative model for predicting commercial processing regimes for defect-free casting over the widest
possible range of refractory metal compositions. Current theory of thermo-chemical convection in
the mushy zone suggests that such instabilities occur when a Rayleigh number exceeds a critical
value(1; 2; 3; 4). The Rayleigh number (R) is a measure of the ratio of the buoyancy force to the
retarding frictional force in the mushy zone:
R = (∆ρ/ρ)gKl/αν (1)
where l is an appropriate length scale, K is the average permeability, g the acceleration produced byPreprint submitted to Acta Materialia February 10, 2010

gravity, α is the thermal diffusivity, ν is the kinematic viscosity of the fluid, and (∆ρ/ρ), the density
contrast. This last term is a measure of the variation in mass density over the mushy zone between
the liquid metal near the solid-liquid dendrite interface and the cooler melt at the bottom and sides
walls of the mold. Temperature gradients present during casting as well as the variations in solute
concentration in the melt that develop as a consequence of equilibrium partitioning between solid
and liquid phases will influence the density contrast. The mass-density difference reflects both the
composition (c) and temperature (T ) dependence of the liquid-hase molar volume V(c, T ). Freckle
formation is highly susceptible to variations in the permeability of the mushy zone as dictated by
dendrite arm spacing as well as the density contrast. Traditional models of the Rayleigh-number
criterion assume that the density gradients are aligned with solidification front and in the plane
normal to the acceleration provided by gravity. These assumptions have become problematic as
airfoil designs have become more complex with the introduction of cooling channels and other
design features. Currently, most castings have significant heat losses through the mold that create
horizontal thermal gradients and tilted solid-liquid interfaces.
Confirming mathematical models for freckle formation in specific alloy systems requires ac-
curate assessment of the various parameters in Eq. 1. The kinematic viscosity, permeability and
density gradients are difficult to measure experimentally and are not well documented for super-
alloys. The present work is part of a larger effort to better quantify the parameters defining this
Rayleigh number. Others in our research team have estimated the permeability using fluid flow
simulations of the mushy zone(5). Such calculations use realistic reconstructions of the mushy-
zone dendritic structure derived from serial sectioning of decanted molds(6). Documented here
are ongoing efforts to develop and validate robust models for the liquid metal densities, ∆ρ, using
ab-initio molecular dynamics simulations (7).
In a detailed study of superalloy liquid metal densities Mukai et al. (8; 9; 10) measured the
densities of several binary liquid Ni-based alloys, and a few representative ternaries, as functions
of c and T . These data were then used to develop a model for V(c, T ) in superalloys(10). Because
of the lack of sufficient data for multi-component systems, the model approximates the total molar
volume as the sum of solute partial-molar volumes which are derived from constituent binary
systems. Changes in V(c, T ) driven by the explicit interactions between the different chemical3

species (e.g. solutes) are neglected. Also, measured density data for some key elements, such as
Re, were unavailable. The partial molar volume contributions for these elements were treated as
parameters to fit available data from multi-component superalloys. Nevertheless, predictions from
the Mukai model produce good agreement, within a few percent, with the available experimentally
measured densities of commercial superalloys.
Experimental measurements of the composition and temperature dependent densities for either
model (NiAlW) or multicomponent superalloys (i.e. RENE-N4) relevant to our larger effort on
freckle formation are not readily available. In the current work we use state-of-the-art ab-initio
molecular dynamics simulations as a means for testing the accuracy of the Mukai model for ρ(c, T )
in this system. These calculations are useful as an independent test the accuracy of the Mukai
parameters for elements and ranges of composition where direct measurements of liquid density
are unavailable.
1. Computational Methods
In this work ab-initio molecular dynamics (AIMD) are used to compute time averaged prop-
erties of molten Ni-based alloys. The simulation method evolves ionic positions using classical
Nose-Hoover dynamics yielding trajectories that sample an equilibrium distribution corresponding
to an ensemble with fixed particle number, volume and temperature (i.e. NVT) with interatomic
forces derived from the electronic structure approximation provided by density functional theory
(DFT). The commerical DFT software (Vienna ab-initio simulation package), (11; 12; 13),
developed at the Institut fur Materialphysik of the Univeritat Wien, is used to generate Hellmann-
Feynman (i.e. atomic) forces required for the AIMD study.
The liquid-alloy simulations employed a 500-atom cubic supercell with periodic boundary
conditions and fixed periodic lengths. AIMD calculations were performed for elemental, binary
and ternary alloy compostions, twelve in all, at two simulation temperatures. The alloy compo-
sitions are tailored to the test the accuracy of the Mukai parametrization and its application to
Ni-Al-W alloys used as model materials in validation experiments. The calculations also sample
alloy chemistries containing refractory additions, such as Re, where experimental data is currently
unavailable. Within the manuscript the composition of the simulation cells are identified by the4
number of each atomic species in the calculation: Al500, Ni500, Ni400Al100, Ni473W27, Ni400W100,
Ni473Re27, Ni400Re100, Ni473Ta27, Ni400Ta100, Ni436Al50W14, Ni436Al50Re14 and Ni436Al50Ta14.
The Nose-Hoover equations of motion were integrated using thermostat temperatures of T=1830
and T=1750 K. To ensure that the conserved energy in the Nose-Hoover dynamics produce a drift
in time no larger than 1 meV/atom·ps time steps (∆t) for the MD simulations were chosen at or
below ∆t=0.003 ps. Initial configurations for the Ni500 and Ni400Al100 simulations were derived
from snapshots of classical molecular-dynamics simulations based on classical interatomic poten-
tials (14). For the binary and ternary alloy simulations the initial configurations were obtained by
replacing Ni and Al atoms, selected at random, by the appropriate target atomic species. Differ-
ent temperature simulations were then started from the same atomic configurations with different
random initial velocities.
The self-consistent charge density and corresponding interatomic forces were computed at
each time step to integrate the ionic trajectories. Also, relevant system properties including the
pressure, energy, temperature and atomic coordinates were calculated and stored. The calcula-
tions employed a plane-wave basis set with a cutoff energy of 260 eV to represent the electronic
wavefunctions and ultrasoft pseudopotentials (15; 16). For simulations of this size a single k-
point (Γ) was more than adequate for performing accurate reciprocal-space summations. Elec-
tronic eigenvalues are occupied according to Fermi statistics with an electronic temperature equal
to that for the ionic system. Also, the exchange correlation potential was approximated using a
generalized-gradient approximation (PW91)(17). For each temperature and alloy composition at
least three simulations were performed over a range of volumes spanning plus or minus five per-
cent of the estimated equilibrium value. In order to obtain good statistical precision in calculated
equation-of-state parameters total simulation times ranged from 5–10 ps. Correlation times were
found in the range of 40-60 fs, and this was taken into account for all thermal averages and error
estimates. Diffusion and liquid structure factors were calculated in order to verify that the sizes of
the supercells and simulation times were of sufficient magnitude to produce realistic results.
There is also a strong interest in evaluating the efficacy of AIMD simulations to determine
densities in chemically complex engineering alloys such as RENE-N4. Such calculations pose
additional challenges in terms of sampling a sufficiently large configurational space and simula-5

tion times to produce a reasonably accurate estimate of the liquid metal densities. In order to
address these issues we have modified the current version of (release 4.6.31) to integrate the
molecular dynamics equations appropriate for a fixed number, pressure and temperature (NPT)
ensemble. This approach significantly improves the efficiency of calculating equilibrium volumes,
liquid metal diffusion rates and viscosities. Our approach, described briefly here, is to derive the
equations for Parrinello-Rahman dynamics using two mathematically distinct methods: (deter-
ministic) Nose-Hoover chain thermostats for atoms and cell vectors, and Langevin thermostats
with stochastic forces and pressure tensors. These techniques were then used to perform cross
validation of both the integration schemes and the accuracy and self consistency of the Hellmann-
Feynman forces and the stress tensor. The dynamics are constrained to eliminate center-of-mass
motion and to impose irrotational deformations on the simulation cell. A further option was in-
cluded to allow for restricting deformations to volumetric (shape-preserving) fluctuations. Finally,
minimal changes were made to the source code to include this new AIMD option and to ac-
commodate the required input and output parameters. In order to validate this NPT method it is
used to evaluate the dependence of molar volume on temperature, i.e. the volume thermal expan-
sion coefficient (β), for several of the chemistries calculated assessed using the NVT method. A
detailed description of the methodology will be presented in another manuscript(18).
2. Results
While the main focus of this study is the prediction of liquid metal molar volumes, the AIMD
calculations also provide a means to quantify the local ordering and kinetics in the melt. Such
observations are also used to establish that the simulations are of long enough duration to allow
appreciable inter diffusion such that the calculated thermal averages are not biased by the choice
of the initial atomic configuration. Also, the cell volume must be large enough such that positional
correlations decay sufficiently over the length of the simulation box in order to produce a realistic
liquid structure. These convergence requirements are considered before reviewing the calculated
dependence of molar volume on composition and temperature.
6

Kinetics. In order to estimate the values of the diffusion kinetics in these systems the averaged
mean-squared displacements for Ni, Al, W, Ta, and Re were calculated from the simulations of the
pure and binary liquids. Fig. 1 shows the solvent and solute results for Ni, and binary Ni400X100
(X=Al, W, Ta, Re) liquids at T=1830K for the lowest pressure NVT simulations for each chem-
istry. The slopes of the best-fit lines relating mean-square displacements and time are used to
derive the estimates of the concentration-dependent tracer-diffusion constants at this temperature.
Quantities in Table 1 are derived from the mean-squared displacements at three to four volumes
and linear fits of diffusion constants with volume to compute the diffusion constants at equilibrium.
The slope of this line also yields a measure of the activation volume at zero pressure as shown in
the table. The self diffusion in Ni is in good agreement with a previous AIMD study by Jakse
and co-workers looking at the dynamic properties of liquid Ni(19). Working with a 108 atom su-
percell at 1850 K with NVT sampling they find a self diffusion of 4.4 × 10⁻⁵cm2/sec. The current
simulations show Re and W as the slowest diffusion species, consistent with their large atomic
mass and size, as compared to the other atomic species. Also, the Ni diffusion constant is lower
in the Ni-X melts, relative to pure Ni, an effect which is roughly linear with solute concentration.
However, this appears contary to the fact that the average atomic volume is larger in the alloys.
Further analysis (below) reveals relatively strong solute-solvent interactions in the alloy melts, an
observation which is corroborated in the radial distribution and neighbor analysis.
Classical experimental measurements of self-diffusion in liquid metals, such as capillary-
reservoir or diffusion couple methods, are problematic in Ni alloys due to the lack of specific
radio-isotopes(20). Recently, because of interest in short range ordering in Al rich Al-Ni binaries,
inelastic neutron scattering has been used to study diffusion and chemical ordering in Al-Ni melts.
Using these methods Chathoth et al. measured self diffusion of 3.8 × 10⁻⁵cm2/s for elemental
Ni at 1795 K(21). In another related manuscript, using the same method, this group reports Ni
self diffusion at 1795K in Ni-25Al (at.%) of 3.9 × 10⁻⁵cm2/s(22). These values are in excellent
agreement with our calculated values of Ni self diffusion for elemental Ni and Ni-20Al at 1830K,
5.3(3) × 10−5 and 3.4(4) × 10−5cm2/s respectively. There is very few measurements of solute dif-
fusion in liquid melts, however recently tracer diffusion constants have been reported for Ni-2W
(at.%)(23). These experiments were performed in the temperature range of 1,755-2,022K and were7
carefully designed to minimize effects of convection. The measured tracer diffusion coefficient for
W, 2.4(2) × 10−5cm2/sec, is again in excellent agreement with our results for a Ni473W27 alloy at
1,830K where we find a value of 4.2(2) × 10−5cm2/s.
Fig. 1 and the good statistics of the inter diffusion constants demonstrates that significant inter-
diffusion is occurring over the timescale of the AIMD simulations and that simulations of this size,
run for approximately 5-7 psec, have evolved over sufficiently long times to give robust estimates
of the equilibrium molar volumes. This expectation is supported by the relatively small estimated
statistical uncertainties in the molar volumes quoted below. Finally, this is also supported by the
results of a test performed for binary Ni-W samples, where two different initial atomic configura-
tions were used to compute the equilibrium volume of the same chemistry. The final results were
found to agree within statistical uncertainties.
Local Ordering. Fig. 2 shows the radial distribution functions, gα,β(r), for each of the (α,β) pairs
of species in pure Ni and binary Ni400X100 (X=Al, W and Re) melts. All the distribution functions
converge to the uncorrelated limit of unity in a distance which is less than half the diagonal dis-
tance across the simulation cell. This verifies that the cell dimensions are large enough to provide
uncorrelated motion of individual and groups of atoms. The distribution functions also provide
insights into the nature of chemical ordering in the melt. For example, the main peak of gNi-X is
larger than the solute-solute (X-X) and solvent-solvent (Ni-Ni) pairs which suggests a preference
in the melt for for chemical short-range ordering between neighbors of unlike species. Also, the
average nearest-neighbor bond length for Ni-Ni and X-X bond lengths (roughly 2.59 Å) is sig-
nificantly larger than for Ni-X pairs (approximately 2.485 Å). These results are consistent with a
significant preference for chemical short-range ordering between Ni and X species in each of the
systems considered. Information about the liquid structure beyond those given by the pair distri-
bution function g(r) can be obtained through the so-called Common Neighbour Analysis (CNA)
(24) and the Angle Probability distribution function P(θ).
In the CNA each pair of neighbours is characterized by a triplet jkl describing the local config-
uration of the pair. The index j gives the number of neighbours common to both atoms in the pair,
k is the number of bonds between these neighbours and l is the longest continuous chain formed by
8

the k bonds between common neighbours. Atoms are considered bonded (i.e. neighbours) if their
separation distance falls below some critical value, typically this is taken as either the position of
the first peak or the first minimum in g(r). Here we choose the minimum in the g(r) as the relevant
criterion. Note that in a binary or multi-component alloy the minimum of the partial pair distribu-
tion function for the specific atoms involved is used. The CNA analysis has been performed for
pure Ni, Ni473Re27 and Ni473W27 at a temperature of 1830 K and the results are shown in Fig. 3.
Fig. 3 shows that there is a clear preference for the formation of icosahedral short range order,
with a secondary preference for bcc type order. A much lower distribution of fcc and hcp type
clusters are found even though Ni is a closed packed metal in the solid state. It is worth noting
that no clear effect of alloying with Re and W is visible in our data. This icosahedral short range
order was postulated by Frank over 50 years ago for fcc metals (25) and was recently confirmed
in experimental obeservations for both pure liquid Ni (26) and in Ni-Ag amorphous alloys (27).
Similar results had already been found for liquid Ni by Posada-Amarillas and Garzon using a
semiempirical n-body potential (28). Icosahedral ordering in liquid alloys of fcc metals is thought
to be present because it maximizes the short range density of a structure (25) (while fcc-packing
maximizes the long range density (29)), thus lowering the enthalpy of the system. This type of
ordering cannot be found in crystals simply because it does not permit periodic filling of a 3D
space (but is commonly found in quasicrystals for example). Presence of bcc type ordering is
also interesting. Some simulations in simple Lennard-Jones systems (30) show that at moderate
undercooling precritical nuclei have a preeminently bcc structure which partially disappear in
critical nuclei.
Complimentary information about the local environment in the liquid is gained by analyzing
the Angle Probability distribution function P(θ). P(θ) is defined so that P(θ)dθ is the probability
of finding a triplet of neighbours with an angle in the range [θ − θ + dθ]. The P(θ) for the three
different compositions that we analyzed are generally not geometrically perfect, even though the
corresponding icosahedral and bcc short-range order is clearly demonstrated by the CNA analysis.
For a perfect icosahedral or bcc cluster one expects bond angles of 120 and approximately 60
degrees. As shown in Fig. 4, the shift of the peaks in the angular distribution function to slightly
lower angles reflects the distortions inherent in the local structural units. While all of the Ni-9

centered data falls on the same line, the solute centered data for W and Re exhibit a splitting
towards lower and higher angles respectively.
Molar volumes. In order to compute equilibrium molar volumes using NVT dynamics AIMD
simulations were performed at each composition for a series of simulation-cell volumes where the
average pressure (P) as a function of V was calculated. For each temperature and composition
a total of three to four volumes were considered. The calculated time-averaged pressures were
then used to derive an equation of state, assuming a quadratic relationship between P and V .
Using the derived equation of state, the equilibrium (zero-pressure) volume (V0), bulk modulus
(B = −V0(dP/dV)) and its pressure derivative (B′) were computed. An example of this approach
is shown schematically in Fig. 5 for simulations of liquid Ni400Al100 at 1830 K. The pressure is
plotted, on the left-hand image, as a function of simulation time for each of the considered atomic
volumes. At each volume there is an initial pressure transient, lasting for a few tenths of a ps, after
which the pressure fluctuates about a well defined average value indicated by the solid line. The
time scale and amplitude of these fluctuations about equilibrium were used to derive estimates
of the statistical uncertainties in the calculated time-averaged pressure. The right-hand side of
Fig. 5 shows the results of such analysis. The data points and error bars show the pressures and
associated statistical uncertainties computed as a function of volume from the AIMD simulations.
Finally, the smooth solid line connecting these data points is a least-squares quadratic fit, which
yields the equilibrium values of volume (V0) and the bulk modulus as shown in the inset. Similar
results are recorded in Table 2, listing calculated equilibrium volumes for each of the twelve liquid
Ni-based alloy compositions considered to date.
3. Discussion
As described in the Introduction, a primary motivation for the present work is to use AIMD
simulations as a framework for developing and validating predictive models for ρ(c, T ) in Ni-
based superalloys. To that end listed along side the AIMD results in Table 2 are the values from
the most recent parametrization of molten superalloy densities, due to Mukai et al.(10). In or-
der to produce this parametrization Mukai measured the density of elemental Ni(8), and a wide
10
variety of binary Ni-X alloys. Some of these compositions correspond to those considered in
this study, so comparison to these measurements provides a means to gauge the accuracy of the
AIMD simulations. For elemental Ni at these temperatures the error is 1.6 and 0.8 percent for
1750 and 1830 K respectively. Using Mukai’s fits to experimental measurements for Ni-19.7Al
and Ni-5.83W (at.%), the approximate compositions for the first two binaries listed in Table 2, we
find average errors in the AIMD results to be below 1.8 percent. There are also several other re-
cent measurements of liquid Ni alloy densities. Using a sesslie drop method Feng and co-workers
measured the density of elemental Ni and dilute solutions of W in Ni, the AIMD predictions are
within 1.4 % of the elemental Ni results(31). Also, Plevachuk and coworkers have developed a
non-contact technique which uses electromagnetic leviation and optical dilatometry to measure
the high temperature liquid metal densities. Their recent measurements focussed on the Al rich
Ni-Al alloys, however extrapolating our Ni-20Al predictions to the measured density Ni-25Al we
find the AIMD prediction within 0.6 % of the measured values(32). The AIMD results for molar
volumes are consistently larger than the measured values, with the exception of this non-contact
method. While this trend is similar to the predictions of traditional Density Functional methods
(i.e. applications of the local density approximation) for crystal lattice parameters, we note that
these calculations are based on the generalized gradient approximation (PW91)(17).
For compositions in the range of the original Mukai parametrization, based on partial molar
volumes, interpolations to quarternary and higher order systems are reported to have errors in the
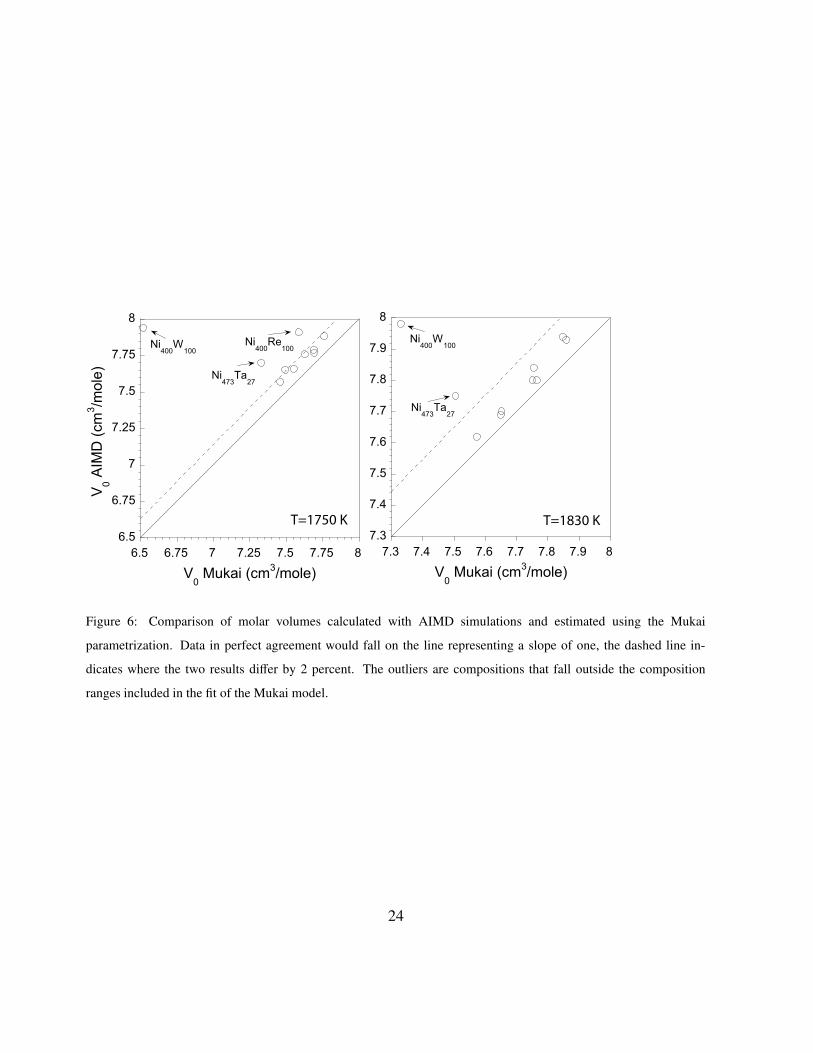
range of 2 percent. In order to illustrate the trend in the molar volume data the AIMD and Mukai
results are plotted in Fig. 6. For compositions inside the range of Mukai’s experimental database
the agreement between the two methods is within 2 percent, as indicated in Fig. 6 by the dotted
lines. However, when the model needs to extrapolate to the AIMD sampled compositions errors
can be quite large, as is the case for Ni400W100, Ni473Ta27 and Ni400Re100. Also for the case of
Ni400Ta100, not shown in the Fig. 6, the Mukai parametrization diverges from the AIMD result by
at least 7 cm3/mole. There is also a systematic increase in the difference between the fitted and
AIMD results with decreasing temperature, as indicated by the spread of data points within the 2%
margin of error. As discussed below this is an indication that the two methods produce different
coefficients of thermal expansion.11

The ternary alloys in Table 2 can also be used to assess the accuracy of the experimental
parametrization for interpolating within the sampled experimental data and the sensitivity of the
approximation for predicting molar volumes for compositions outside the range of experimentally
fitted data. The former case is a test of approximating the molar volume as the sum of partials
molar volumes of non-interacting chemical species. For example, each of the ternary alloy com-
positions Ni436Al50X14 with refractory elements (X=W, Re or Ta) can be represented as the average
of the binary Ni400Al100 and Ni473X27 melts also considered here. This composition relationship is
equivalent to traversing from the Ni-Al to Ni-X sides of a ternary triangle (i.e. inset in Fig. 7a).
As illustrated in Fig. 7a the AIMD simulations produce molar volumes of the ternary melts that
are all very well approximated (to within 0.8%) by a linear interpolation between the binary alloy
values. The Mukai model is also accurate using the average of the two binaries, producing less
than a 0.4 % deviation from linearity for the ternary alloys containing W and Re. However, the
molar volume predicted by the Mukai model for Ni473Ta27 produces deviations from linearity of
approximately 2 and 3 % for the ternary and binary alloys respectively.
Fig. 7 b illustrates the variation in molar volume for Ni-W and Ni-Re for solute concentrations
up to 20 at.%. The AIMD results produce nearly linear behavior (though not plotted similar results
are found for Ni-Ta alloys) in this range of compostion. The Mukai parametrization produces
significant deviations from linearity for the Ni-W alloys (≈13 %). Surprisingly the Re predictions,
which are not fit to binary data but are inferred from measurements of multicomponent alloys,
show linear behavior in agreement with the AIMD results. Mukai’s predictions for the Ni-Ta
alloys are not included here because the extrapolation from 4 to 20 at.% produces deviations from
linearity of more than 100 %. These results suggest that one of the main assumptions in the
Mukai parametrization, namely that the partial molar volumes of the binary alloys can be used
to interpolate molar volumes for multicomponent systems, is reasonably accurate in the Ni-Al-X
(X=W, Re or Ta) alloys. The AIMD results illustrate that application of the Mukai model should
be restricted to the range of compositions sampled by the underlying experimental measurements.
Table 2 also shows Mukai’s prediction of the coefficient of thermal expansion, β, and we note
that for the compositions actually measured the agreement with the Mukai model are quite good.
Mukai’s experimental measurements using the (modified) sessile drop method and (modified) py-12

cnometric method place β in the range of 2.0 × 10⁻⁴K−1. Previous studies using a wider variety
of methods estimate β for elemental Ni to be in the range of 1. − 1.5 × 10⁻⁴K−1(20; 33). Also,
one earlier study based on gamma ray attenuation, an experimental method for measuring liquid
metal densities not influenced by surface tension or chemical contamination on the fluid surface,
found the coefficient of thermal expansion for elemental liquid Ni of 9.42×10⁻⁵K−1(34). The only
other non-contact method density measurement technique that has been applied to the Ni alloys
is the very recent work of Plevachuk et al. where using electromagnetic levitation and optical
dilatometry they find a coefficient of thermal expansion of 1.2 × 10⁻⁴K−1 for Ni-25Al (at.%).
Variations in molar volume with temperature for alloys with high solute concentrations can
be derived from the AIMD results using one of several methods. Liquid metal density measure-
ments in binary Ni alloys indicate that the temperature dependence is linear so finite difference
methods should be reasonably accurate. An alternative technique, based on the results of AIMD
simulations at a single temperature, was used to derive the thermal expansion coefficient (β) for
the temperatures and compositions listed in Table 2. For any ensemble averaged property <A> in
a canonical ensemble:
〈A〉 =∑
i Ai exp (−Ei/kBT )∑
i exp (−Ei/kBT )(2)
where E is the energy of the system. Taking the derivative with temperature and using correlation
notation, [A, B] = 〈AB〉 − 〈A〉〈B〉:
d〈A〉dT=
[〈AE〉 − 〈A〉〈E〉]kBT 2 =
[A, E]kBT 2 (3)
substituting the ensembled averaged pressure for 〈A〉 gives: d〈P〉/dT = [P, E]/(kBT 2). The volu-
metric temperature expansion coefficient can be expressed as:
β =1V0
dV0
dT=
1V0
dV0
dPdPdT
∣
∣
∣
∣
∣
V0
(4)
Using the definition of the bulk modulus: B = 1/V0dP/dV |V0, where, consistent with the current
notatation, P is the system pressure as apposed to the applied pressure:
β =1B
dPdT
∣
∣
∣
∣
∣
V0
=[P, E]V0
kBT 2B(5)
13

All the quantities in the last equation are readily available for each composition and tempera-
ture sampled by the AIMD calculations and the predicted values for β are shown in Table 2. Using
the value of β at one temperature to estimate the Molar volume at the other temperature for each
table entry yields predictions with average errors of approximately 0.1 %.
Comparing the values for β to that measured by modified sessile drop and modified pycnomet-
ric methods (10) we see that the AIMD results consistently underestimate these thermal expansion
coefficients. The AIMD results are in much better agreement with the results of non-contact den-
sity experiments, such as gamma ray attenuation and electromagnetic levitation/optical dilatometry
techniques, though here also the computational method underestimates β by approximately 25 %
for elemental Ni.
The temperature dependence of the molar volumes was studied over a wider range of temper-
atures using the version of modified to sample NPT ensembles. The results of calculations,
for elemental Ni and Ni473W27 at 1750, 1850, and 1950 K, are shown in Fig. 8. Within the er-
ror of the respective calculations the NVT and NPT ensembles give the same molar volumes for a
given chemistry and temperature. The wider temperature range of the NPT calculations also yields
values for β, as indicated in Fig. 8, that are consistent with the previous calculations.
Another measure of the self consistency between AIMD calculations and the Mukai model are
the predictions for partial molar volumes in the solute dilute limit. For a binary alloy the methods
of intercepts implies that the partial molar volume for a solute is Vsolute = V+(1−c)dV/dc, where c
is the solute concentration. In the dilute limit as c→ 0 the reference volume, V, becomes the molar
volume for pure Ni, VNi. The resulting estimates of the partial molar volumes at infinite dilution,
V in fsolute/VNi, calculated from the AIMD results and the Mukai parametrization are given in Table 3.
Conventional thermodynamics would suggest that V in fsolute/VNi would be somewhat insensitive to
changes in temperature (T > Tmelt), and this weak dependence is observed in the raw experimental
data for Ni-W (8). The Mukai model predicts large changes in partial molar volume at small solute
concentrations, an effect that is particularly pronounced in Ni-Ta. such results are consistent with
small errors in the second order fitting coefficients introduced in the quadratic fits to the narrow
range of experimentally measured compositions. Such errors would also produce large excursions
in liquid metal densities for high solute concentrations shown in Fig. 7. The AIMD results predict14
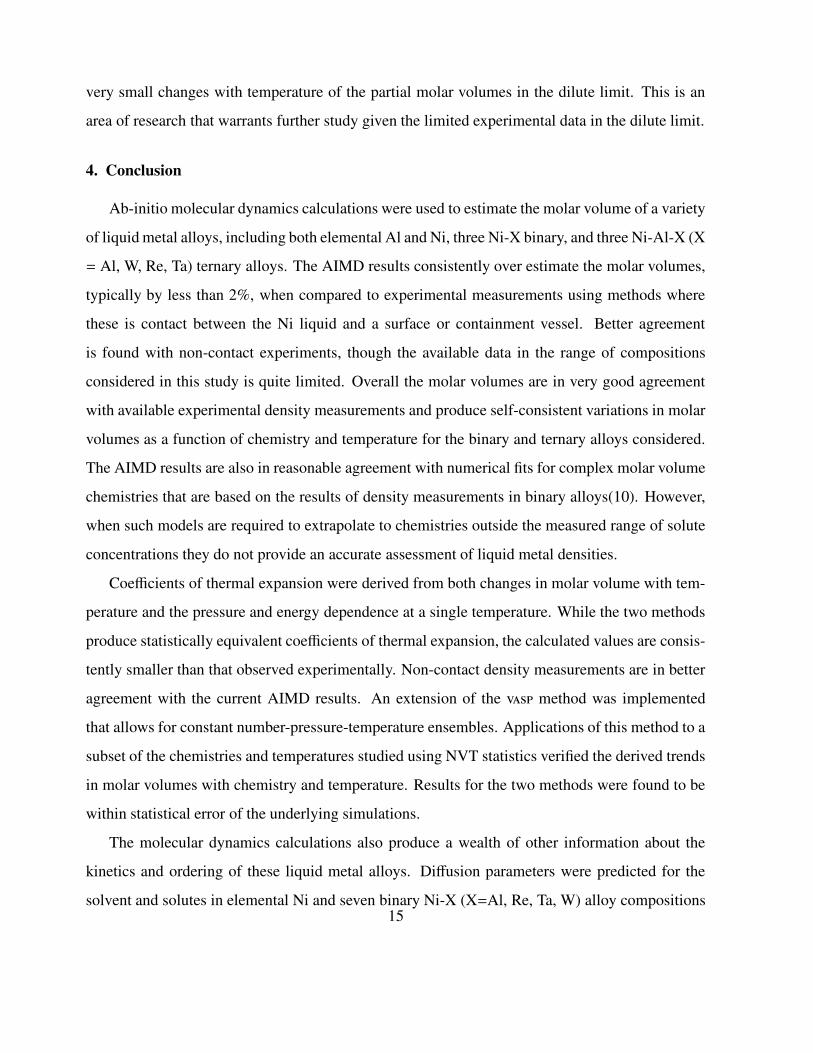
very small changes with temperature of the partial molar volumes in the dilute limit. This is an
area of research that warrants further study given the limited experimental data in the dilute limit.
4. Conclusion
Ab-initio molecular dynamics calculations were used to estimate the molar volume of a variety
of liquid metal alloys, including both elemental Al and Ni, three Ni-X binary, and three Ni-Al-X (X
= Al, W, Re, Ta) ternary alloys. The AIMD results consistently over estimate the molar volumes,
typically by less than 2%, when compared to experimental measurements using methods where
these is contact between the Ni liquid and a surface or containment vessel. Better agreement
is found with non-contact experiments, though the available data in the range of compositions
considered in this study is quite limited. Overall the molar volumes are in very good agreement
with available experimental density measurements and produce self-consistent variations in molar
volumes as a function of chemistry and temperature for the binary and ternary alloys considered.
The AIMD results are also in reasonable agreement with numerical fits for complex molar volume
chemistries that are based on the results of density measurements in binary alloys(10). However,
when such models are required to extrapolate to chemistries outside the measured range of solute
concentrations they do not provide an accurate assessment of liquid metal densities.
Coefficients of thermal expansion were derived from both changes in molar volume with tem-
perature and the pressure and energy dependence at a single temperature. While the two methods
produce statistically equivalent coefficients of thermal expansion, the calculated values are consis-
tently smaller than that observed experimentally. Non-contact density measurements are in better
agreement with the current AIMD results. An extension of the method was implemented
that allows for constant number-pressure-temperature ensembles. Applications of this method to a
subset of the chemistries and temperatures studied using NVT statistics verified the derived trends
in molar volumes with chemistry and temperature. Results for the two methods were found to be
within statistical error of the underlying simulations.
The molecular dynamics calculations also produce a wealth of other information about the
kinetics and ordering of these liquid metal alloys. Diffusion parameters were predicted for the
solvent and solutes in elemental Ni and seven binary Ni-X (X=Al, Re, Ta, W) alloy compositions15

and excellent agreement was found with recent diffusion measurements in Ni, Ni-Al, and Ni-W.
The rapid kinetics of the AIMD simulations offer a reasonable means for estimating the diffu-
sion coefficients in liquid metal alloys and offers an alternative to the high temperature diffusion
experiments.
5. Acknowledgements
This research was supported in part by a grant of computer time from the DoD High Perfor-
mance Computing Modernization Program at the Air Force Research Laboratory DoD Supercom-
puting Research Center (AFRL-DSRC). MA and DRT were supported in part with a grant from
the Air Force Office of Scientific Research under the Materials Engineering for Affordable New
Systems (MEANS-II) program. The authors gratefully acknowledge insightful discussions with
T. Pollock, P. Voorhees, and S.H. Davis, and the technical assistance provided by S. Kajihara at
the AFRL-DSRC.
References
[1] J. R. Sarazin, A. Hellawell, Channel formation in pb-sn, pb-sb, and pb-sn-sb alloy ingots and comparison with
the system nh4ci-h2o, Met. Mat. Trans. A 19 (1988) 1861–1871.
[2] T. M. Pollock, W. H. Murphy, The breakdown of single-crystal solidification in high refractory nickel-base
alloys, Met. Mat. Trans. A 27 (1996) 1081–1094.
[3] P. Auburtin, S. L. Cockcroft, A. Mitchell, in: R. Kissinger, D. Deye, D. Anton, A. Cetel, M. Nathal, T. Pollock,
D. Woodford (Eds.), Superalloys 1996, TMS, Warrendale, PA, 1996, p. 433.
[4] C. Beckermann, J. P. Gu, W. J. Boettinger, Development of a freckle predictor via rayleigh number method for
single-crystal nickel- base superalloy castings, Met. Mat. Trans. A 31 (2000) 2545–2557.
[5] S. M. Roper, S. H. Davis, P. W. Voorhees, Convection in a mushy zone forced by sidewall heat losses, Metall.
Mater. Trans. 38A (2007) 1069–1079.
[6] J. Madison, J. E. Spowart, D. J. Rowenhorst, J. Fiefler, T. M. Pollock, Characterization of three-dimensional
dendritic structures in nickle-base single crystals for investigation of defect formation, in: Proceedings of the
Eleventh International Symposium on Superalloys, The Minerals, Metals and Materials Society, Warrendale,
Pennsylvania, 2008, pp. 881–888.
[7] C. Woodward, M. Asta, J. Lill, D. Trinkle, S. Angioletti-Uberti, Ab-initio molecular dynamic simulation of
molten ni-based alloys, in: Proceedings of the HPCMP Users Group Conference 2008, Los Alamitos, California,
16

Conference Publishing Services, 2008, pp. 169–174; M. Asta et al., ibid, 2007, pp. 147-152; M. Asta et al., ibid,
2006, pp. 177-181.
[8] K. Mukai, L. Fang, Z. Li, Measurement of the density of binary ni-x (x=co, w, ta, al) alloys, Mater. Trans. 45
(2004) 1754–1763.
[9] K. Mukai, Z. Li, L. Fang, Measurement of the densities of nickel-based ternary, quaternary and commercial
alloys, Mater. Trans. 45 (2004) 2987–2993.
[10] K. Mukai, Z. Li, K. C. Mills, Prediction of the densities of liquid ni-based superalloys, Met. Mat. Trans. B 36
(2005) 255–262.
[11] G. Kresse, J. Hafner, Ab initio molecular dynamics for liquid metals, Phys. Rev. B 47 (1) (1993) 558–561.
doi:10.1103/PhysRevB.47.558.
[12] G. Kresse, J. Hafner, Ab initio molecular-dynamics simulation of the liquid- metal˘amorphous-semiconductor
transition in germanium, Phys. Rev. B 49 (20) (1994) 14251–14269. doi:10.1103/PhysRevB.49.14251.
[13] G. Kresse, J. Furthmuller, Efficient iterative schemes for ab initio total-energy calculations using a plane-wave
basis set, Phys. Rev. B 54 (16) (1996) 11169–11186. doi:10.1103/PhysRevB.54.11169.
[14] M. Asta, D. Morgan, J. J. Hoyt, B. Sadigh, J. D. Althoff, D. de Fontaine, S. M. Foiles, Embedded-atom-method
study of structural, thermodynamic, and atomic-transport properties of liquid ni-al alloys, Phys. Rev. B 59 (22)
(1999) 14271–14281. doi:10.1103/PhysRevB.59.14271.
[15] D. Vanderbilt, Soft self-consistent pseudopotentials in a generalized eigenvalue formalism, Phys. Rev. B 41 (11)
(1990) 7892–7895. doi:10.1103/PhysRevB.41.7892.
[16] G. Kresse, D. Joubert, From ultrasoft pseudopotentials to the projector augmented-wave method, Phys. Rev. B
59 (3) (1999) 1758–1775. doi:10.1103/PhysRevB.59.1758.
[17] J. P. Perdew, Y. Wang, Accurate and simple analytic representation of the electron-gas correlation energy, Phys.
Rev. B 45 (23) (1992) 13244–13249.
[18] J. Lill, C. Woodward, D. Trinkle, Manuscript in preparation.
[19] N. Jakse, J. F. Wax, A. Pasturel, Transport properties of liquid nickel near the melting point: an ab-initio molec-
ular dynamics study, J. Chem. Phys. 126 (2007) 234508–5.
[20] T. Iida, R. Guthrie, The physical properties of liquid metals, Oxford, Clarendon Press, 1988.
[21] S. M. Chathoth, A. Meyer, M. M. Koza, F. Juranyi, Atomic diffusion in liquid ni, nip, pdnip, and pdnicup alloys,
Applied Physics Letters 85 (21) (2004) 4881–4883. doi:10.1063/1.1825617.
URL http://link.aip.org/link/?APL/85/4881/1
[22] S. K. Das, J. Horbach, M. M. Koza, S. M. Chatoth, A. Meyer, Influence of chemical short-range order on atomic
diffusion in al–ni melts, Applied Physics Letters 86 (1) (2005) 011918. doi:10.1063/1.1845590.
URL http://link.aip.org/link/?APL/86/011918/1
[23] J. P. Leonard, T. J. Renk, M. O. Thompson, M. J. Aziz, Solute diffusion in liquid nickel measured by pulsed ion
17

beam melting, Met. Mat. Trans. A 35 (2004) 2803–2807.
[24] J. Honeycutt, H. Andersen, Difference in icosahedral short-range order in early and late transition metal liquids,
J. Phys. Chem 91 (1987) 4950.
[25] F. Frank, Supercooling of liquids, Proc. Roy. Soc. Lond. Series A 215 (1120) (1952) 43–46.
[26] G. W. Lee, A. K. Gangopadhyay, K. F. Kelton, R. W. Hyers, T. J. Rathz, J. R. Rogers, D. S. Robinson, Difference
in icosahedral short-range order in early and late transition metal liquids, Phys. Rev. Lett. 93 (3) (2004) 037802.
doi:10.1103/PhysRevLett.93.037802.
[27] W. K. Luo, H. W. Sheng, F. M. Alamgir, J. M. Bai, J. H. He, E. Ma, Icosahedral short-range order in amorphous
alloys, Phys. Rev. Lett. 92 (14) (2004) 145502. doi:10.1103/PhysRevLett.92.145502.
[28] A. Posada-Amarillas, I. L. Garzon, Microstructural analysis of simulated liquid and amorphous ni, Phys. Rev. B
53 (13) (1996) 8363–8368. doi:10.1103/PhysRevB.53.8363.
[29] F. Spaepen, Condensed-matter science: Five-fold symmetry in liquids, Nature 408 (2000) 781–782.
[30] P. R. ten Wolde, M. J. Ruiz-Montero, D. Frenkel, Numerical evidence for bcc ordering at the surface of a critical
fcc nucleus, Phys. Rev. Lett. 75 (14) (1995) 2714–2717. doi:10.1103/PhysRevLett.75.2714.
[31] X. Feng, Y. Ren-hui, F. Liang, L. Lan-xiao, Z. Hong-kai, Densities of molten ni-(cr, co, w) superalloys, Trans.
NonFer. Met. Soc. China 18 (2008) 24–27.
[32] Y. Plevachuk, I. Egry, D. H.-M. J. Brillo, I. Kaban, Density and atomic volume in liquid al-fe and al-ni binary
alloys, Int. J. Mat. Res. 98 (2007) 107–111.
[33] A. F. Crawley, Int. Metall. Rev. 19 (1974) 32–48.
[34] W. D. Drotning, Thermal expansion of nickle to 2300k, in: D. C. Larson (Ed.), Thermal Expansion 7, Plenum
Press, New York, 1988, pp. 17–28.
18

Table 1: Calculated diffusion parameters (10−5 cm2/s) and activation volumes for binary Ni-alloys at 1830 K. Values
for D are the result of a linear fit of the diffusion parameters found for the three or more calculations used to determine
the equilibrium volume. The fit produces D at zero pressure and it’s the first derivative which is used to define the
activation volume, Va = −kBTd(lnD)/dP. Errors, in parentheses, are derived using standard propagation of errors
based on the statistical error estimates from the raw data.
Composition Solvent (Ni) Solute (X)
Cell Alloy D(Ni) Va(Ni) D(X) Va(X)
Ni500 Ni 5.3(3) 1.3(3)
Ni473Re27 Ni-5.4Re 5.0(2) 1.3(2) 3.6(4) 0.3(5)
Ni473Ta27 Ni-5.4Ta 4.6(1) 1.3(2) 3.7(3) 0.5(4)
Ni473W27 Ni-5.4W 4.2(2) 1.3(2) 3.6(4) 0.9(6)
Ni400Al100 Ni-20Al 3.4(4) 1.2(2) 3.5(3) 2.3(4)
Ni400Re100 Ni-20Re 3.2(2) 0.9(2) 2.3(2) 0.8(3)
Ni400Ta100 Ni-20Ta 3.5(1) 1.2(2) 2.9(2) 0.9(4)
Ni400W100 Ni-20W 3.2(1) 1.1(2) 2.5(3) 1.1(2)
19

Table 2: Calculated atomic volumes (cm3/mole) and volumetric thermal expansion coefficents (10−5K−1) for molten
Ni-alloys at 1750 and 1830 K. The numbers in parentheses represent estimated 95% confidence intervals on the last
digit. The calculated (AIMD) results are compared with the predictions of the parametrized model due to Mukai et
al..(10) For the Ni-Ta alloys Mukai fit to compositions in the dilute limit (<3.5 at%) making it inappropriate to
extrapolate to high solute concentrations.
T=1750 K T=1830 K
AIMD Mukai AIMD Mukai
Composition V β V β V β V β
Al500 12.80(2) 12.0 12.91(3) 10.9
Ni500 7.57(1) 7.10 7.4597 18.6 7.62(1) 6.71 7.5724 18.6
Ni400Al100 7.88(1) 7.33 7.7628 13.9 7.94(1) 5.55 7.8492 13.8
Ni473W27 7.66(1) 6.61 7.5534 16.3 7.70(1) 5.74 7.6520 16.1
Ni400W100 7.94(1) 6.38 6.5192 155. 7.98(1) 6.44 7.3294 138.
Ni473Re27 7.65(1) 7.37 7.4940 26.0 7.69(1) 7.00 7.6499 25.5
Ni400Re100 7.91(1) 6.84 7.5869 44.9 7.93(1) 6.25 7.8593 43.3
Ni473Ta27 7.70(1) 7.28 7.3310 29.7 7.75(1) 6.26 7.5053 29.0
Ni400Ta100 8.14(1) 10.5 —– 8.18(1) 9.09 ——
Ni436Al50W14 7.77(1) 7.52 7.6920 12.0 7.80(1) 6.18 7.7655 11.8
Ni436Al50Re14 7.75(1) 7.62 7.6291 20.0 7.80(1) 9.10 7.7510 19.7
Ni436Al50Ta14 7.79(1) 7.74 7.6911 10.4 7.84(1) 7.29 7.7553 10.4
Table 3: Partial Molar Volumes at infinite dilution.
Chemistry T = 1750 K T = 1850 K
Solute PMV AIMD Mukai AIMD Mukai
W V∞W/VNi 1.25 1.55 1.24 1.33
Re V∞Re/VNi 1.22 1.08 1.20 1.19
Ta V∞Ta/VNi 1.38 2.13 1.37 1.61
20

Figure 1: Calculated AIMD mean-square displacements of solvent (left) and solute (right) species for elemental Ni
and binary Ni-X (X=Al, W, Re, and Ta) alloys at 1830 K. Deviations in the ”random walk” from the long-time linear
diffusion relation, 〈|r(t)− r(0)|2〉 = 6Dt, are shown as filled areas for each species. The results shown here are from the
lowest pressure simulations at these chemistries. The diffusion constants (D) in Table 1 are derived from the slopes of
the mean square displacement curves at several volumes interpolated to zero pressure. Self diffusion of Ni decreases
with solute additions with Al producing the smallest effect and W the largest. The relative solute diffusion in these
liquid Ni-X metals follows the same trends of the respective solvent diffusion.
0 2.437 4.562 6.562 8.687 10.811 15
r [Å]
0
1
gNi-Ni(r)
pure NiNi400W100
Ni400Re
100Ni400Al100
0 2.485 4.65 6.69 8.9 11.02 15
r [Å]
0
1
gNi-X(r)
Ni400W100
Ni400Re
100Ni400Al100
0 2.74 4.65 6.81 8.93 15
r [Å]
0
1
gX-X(r)
Ni400W100
Ni400Re
100Ni400Al100
Figure 2: Radial distribution functions calculated from AIMD simulations for elemental Ni and binary Ni-X (X=Al,
W and Re) alloys at T=1830 K. The three plots show results, from left to right, for solvent-solvent (Ni-Ni), solvent-
solute (Ni-X) and solute-solute (X-X) pairs.
21

0
5
10
15
20
25
A B C D E F G H I J K L M
Icosahedra
Bcc
Hcp Hcp Fcc
Frac
tion
of P
opul
atio
n (%
)
Common Neighbour Analysis
Pure NiNi473Re27Ni473W27
Figure 3: Common Neighbour Analysis of pure Ni, Ni473Re27 and Ni473W27 at 1830 K. The combined analysis shows
the presence of similar short range order in the three samples, with almost no dependence on composition. Icosahedral
and bcc-type ordering are found to be the most abundant.
0
0.6
1.2
0.0
0.6
1.2
0.0
0.6
1.2
30 60 90 120 150 180
Ang
le D
istr
ibut
ion
P(θ
) (%
)
Angle (˚)
Pure Ni
Ni473Re27Ni−CentredRe−Centred
Ni473W27Ni−CentredW−Centred
Figure 4: Angle distribution function P(θ) at 1830 K for pure Ni, Ni473Re27 and Ni473W27. For perfect icosahedric or
bcc like structures the two main peaks are expected to be around 120 and 60 degrees, in our samples distorsions due
to the liquid nature shift the peaks to lower values. The angle distribution for all three cases of the Ni centered data
fall on essentially the same line, and there is a slight shift to lower angles for the W centered distribution relative to
the rest of the data.
22

0 1 2 3 4 5 6t [ps]
67.82
11.46
−6.00
−28.21
P [k
bar]
12.365 13.016 13.280 13.667
V [Å3/atom]
0
67.82
11.46
−6.00
−28.21
P [k
bar]
quadratic fit:V0= 13.181 ± 0.004Å3
B = 888 ± 7.3 kbar
Figure 5: Graphic representation of the equation of state calculations for liquid metal Ni400Al100 alloy at 1830 K.
Representative AIMD calculations of pressure as a function of simulation time for four volumes (left) with a horizontal
line indicating time averaged values. The volume at these pressures, with error bars, (right) are fit to a quadratic
polynomial, with results of this least squares fit shown in inset. Interpolating to the zero pressure volume produces
the predicted equilibrium volume the bulk modulus and it’s derivative for a given composition and temperature. Error
bars and estimated uncertainties are based on standard uncertainty analysis.
23
T=1750 K T=1830 K
7.3
7.4
7.5
7.6
7.7
7.8
7.9
8
7.3 7.4 7.5 7.6 7.7 7.8 7.9 8
V0 Mukai (cm
3/mole)
Ni400
W100
Ni473
Ta27
6.5
6.75
7
7.25
7.5
7.75
8
6.5 6.75 7 7.25 7.5 7.75 8
V0 A
IMD
(cm
3/m
ole
)
V0 Mukai (cm
3/mole)
Ni400
W100
Ni400
Re100
Ni473
Ta27
Figure 6: Comparison of molar volumes calculated with AIMD simulations and estimated using the Mukai
parametrization. Data in perfect agreement would fall on the line representing a slope of one, the dashed line in-
dicates where the two results differ by 2 percent. The outliers are compositions that fall outside the composition
ranges included in the fit of the Mukai model.
24

Ni400Al100
Ni436Al50X14
Ni473X27
Ni
6.5
7.0
7.5
8.0
0 0.05 0.1 0.15 0.2
Ni-W (AIMD)Ni-W (Mukai)Ni-Re (AIMD)Ni-Re (Mukai)
Molar Fraction
V0
(cm
3/mole)
Composition
Ni400 Al100 Ni436 Al50X14 Ni473 X27 Ni
7.3
7.4
7.5
7.6
7.7
7.8
7.9Ni-Al-W (AIMD)Ni-Al-W (Mukai)
Ni-Al-Re (AIMD)Ni-Al-Re (Mukai)Ni-Al-Ta (AIMD)Ni-Al-Ta (Mukai)
1 2 3 4
Figure 7: Variation of molar volumes at 1750 K for ternary and binary alloys calculated using AIMD simulations and
estimated using the Mukai parametrization. The figure on the left shows compositions spanning the ternary triangle
(see inset). Results are linear in composition with deviations from linearity of less than 0.8 %. The Mukai model
results for Ni473Ta27 are the exception producing deviations from linearity of approximately 3 %. The figure on the
right shows binary Ni-X (X= W and Re) compositions up to Ni-20X at.% which is outside the range of the Mukai
reference measurements. The Mukai Ni-W molar volumes show significant deviations from linearity, which is not
predicted by the AIMD simulations. Similar, though far more dramatic deviations are observed for Ni-Ta alloys in
this range of composition (see text).
25

7.5
7.55
7.6
7.65
7.7
7.75
7.8
1700 1750 1800 1850 1900 1950 2000
Ni500
nVT
Ni500
nPT
Ni473
W27
nVT
Ni473
W27
nPT
Molar Volume (cm
3/Mole)
T (K)
β = 8.5x10⁻⁵
K-1
β = 6.7x10⁻⁵
K-1
Figure 8: The variation in molar volume with temperature for elemental Ni and Ni473Al27 calculated using constant
number-volume-temperature and number-pressure-temperature ensembles. The coefficient of thermal expansion (β =
V−1dV/dT ), calculated from a linear fit to each dataset, are shown adjacent to each curve. The two methods for
deriving the molar volume are within numerical error of the respective calculations, producing slopes and β that are
also within numerical error.
26


