August 7, 2008August 7, 2008
New York Group Lunch Presentation New York Group Lunch Presentation for Investors and Analystsfor Investors and Analysts
AerCap Holdings N.V.AerCap Holdings N.V.
2
Forward Looking Statements & Safe HarborForward Looking Statements & Safe Harbor
This presentation contains certain statements, estimates and forecasts with respect to future performance and events. These statements, estimates and forecasts are “forward-looking statements”. In some cases, forward-looking statements can be identified by the use of forward-looking terminology such as “may,” “might,” “will," “should,” “expect,” “plan,” “intend,” “estimate,”“anticipate,” “believe,” “predict,” “potential” or “continue” or the negatives thereof or variations thereon or similar terminology. All statements other than statements of historical fact included in this presentation are forward-looking statements and are based on various underlying assumptions and expectations and are subject to known and unknown risks, uncertainties and assumptions, may include projections of our future financial performance based on our growth strategies and anticipated trends in our business. These statements are only predictions based on our current expectations and projections about future events. There are important factors that could cause our actual results, level of activity performance or achievements to differ materially from the results, level of activity, performance or achievements expressed or implied in the forward-looking statements. As a result, there can be no assurance that the forward-looking statements included in this presentation will prove to be accurate or correct. In light of these risks, uncertainties and assumptions, the future performance or events described in the forward-looking statements in this presentation might not occur. Accordingly, you should not rely upon forward-looking statements as a prediction of actual results and we do not assume any responsibility for the accuracy or completeness of any of these forward-looking statements. We do not undertake any obligation to, and will not, update any forward-looking statements, whether as a result of new information, future events or otherwise.
3
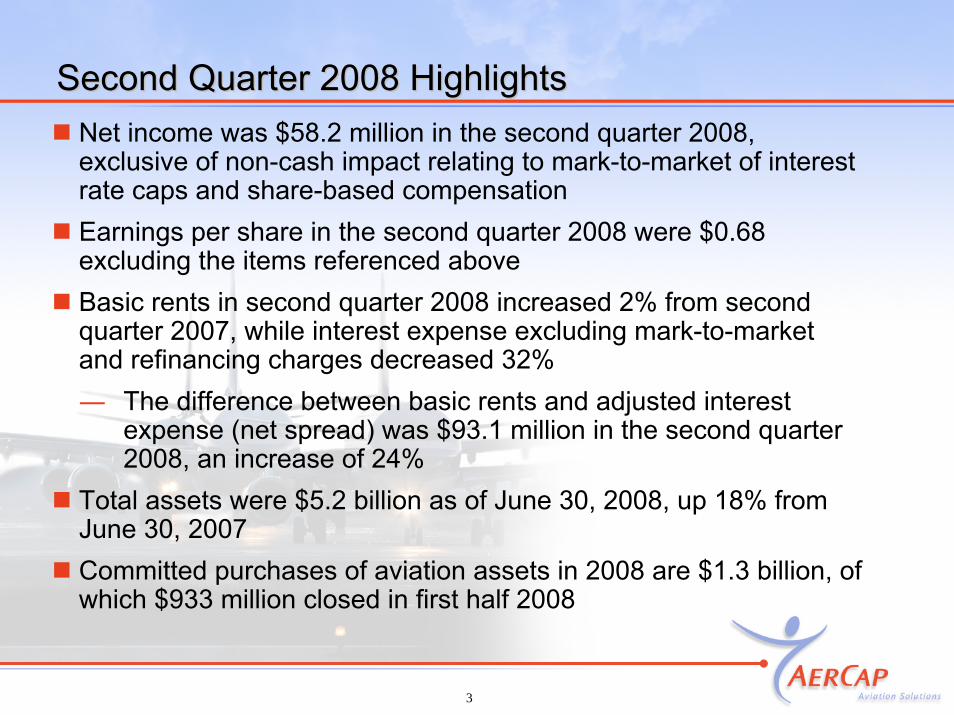
Second Quarter 2008 HighlightsSecond Quarter 2008 HighlightsNet income was $58.2 million in the second quarter 2008, exclusive of non-cash impact relating to mark-to-market of interest rate caps and share-based compensationEarnings per share in the second quarter 2008 were $0.68 excluding the items referenced aboveBasic rents in second quarter 2008 increased 2% from second quarter 2007, while interest expense excluding mark-to-market and refinancing charges decreased 32% ― The difference between basic rents and adjusted interest
expense (net spread) was $93.1 million in the second quarter 2008, an increase of 24%
Total assets were $5.2 billion as of June 30, 2008, up 18% from June 30, 2007Committed purchases of aviation assets in 2008 are $1.3 billion, of which $933 million closed in first half 2008

44
2008 Passenger Growth by Region2008 Passenger Growth by Region
Sources: IATA (some 230 airlines, excludes; domestic traffic and non-members; such as charter operators and LCCs),
ATA (12 US major airlines), AEA (32 European members excluding most LCCs and charter airlines)
AAPA (17 major Asian airlines excluding Middle East, China, India and LCCs), ALTA (35 member airlines)
Year on Year RPK Growth May 2008
6.0%
5.1%4.7%
8.9%
0.9%
10.9%
0.4%
5.5%
4.6%
3.6%
0%
1%
2%
3%
4%
5%
6%
7%
8%
9%
10%
11%
12%
May - I
nterna
tional
(IATA)
May - U
S (ATA)
May - E
urope
(AEA)
May -A
sia (A
APA)
May - L
atin A
merica
(ALTA)
YTD - Inte
rnatio
nal (I
ATA)
YTD - US (A
TA)
YTD - Europ
e (AEA)
YTD -Asia
(AAPA)
YTD - Lati
n Ameri
ca (A
LTA)

5
Aircraft Aircraft LessorsLessors Offer Attractive Valuations with Offer Attractive Valuations with Stable Contracted Earnings and Strong Cash FlowsStable Contracted Earnings and Strong Cash Flows
Lessors are priced as pure aviation plays but operate very differently to airlines
Airline valuations influenced by declining passenger traffic, record high fuel costs and a credit market in crisis
Reality for lessors is different:Contracted earningsSound cash flows
Risk mitigants include:Portfolio purchased at significant discount to current market valuesPortfolio largely consists of favorable and efficient A320s and A330s Individual customer concentrations below 5% of lease revenue (all but one) Leases have good collateral (security deposits and maintenance reserves)
OPPORTUNITIES FOR LEASE ORDERS (SALE AND LEASE BACKS) ARE INCREASING AS AIRLINES LOOK TO FREE UP CASH TO COPE WITH THE INDUSTRY DOWNTURN
5
6
Discussion TopicsDiscussion Topics
Update on Funding
Net Spread
Portfolio Analysis
Additional Cash Flow Disclosures
2008 Outlook

7
Funding/Access to CapitalFunding/Access to Capital
* Free cash only (excludes restricted cash balance of $183.8 million)** Operating cash flow is reduced for interest cost*** Includes revolving lines of credit, ECA financing, and pre-delivery payment financing
Unrestricted Cash Balance at June 30, 2008* $176 Million
Operating Cash Flow for 2Q 2008** $86 Million
Financing Transactions Completed in Q2 2008 – Nearly $2 Billion• ALS II – 30 new Aircraft Securitisation $1.0 Billion• TUI Portfolio Acquisition Facility $489 Million• A320 Pre-Delivery Payments Debt Facility $269 Million• Engine Acquisition Facility $100 Million• A330 Pre-Delivery Payments Debt Facility $68 Million
Available Lines of Credit at June 30, 2008*** ~$3.0 Billion

8
ALS II LimitedALS II Limited
0
5
10
15
Num
ber o
f airc
raft
2008 2009 2010
Year of scheduled delivery from Airbus
$1 Billion “ALS II Ltd” Securitization provides financing requirements for 30 A320 family aircraft from forward order delivering between 2008 and 2010
Key features of deal include:― Issuance of Class A1 and A2 floating rate notes― Commitment to fund aircraft upon delivery― No recourse to AerCap Group― Ratings of A1 / A+ by Moody’s and S&P― Spread of one month LIBOR plus 185bps― Loan to Value 74%― No insurance wrap― Expected final payment date in 2020― AerCap Group remains owner of E note
Type of aircraft
A320-20025 aircraft
A319-1005 aircraft

99
~$6 Billion of Purchases (2008 – 2011)
Cash Sources:
Cash in Bank of ~$200 Million
Operating Cash Flows Generated in 2008 - 2011
~$1.5B
~$1.0B
~$1.3B
~$0.5B
~$1.0B
~$0.8B
Capital Requirements and SourcesCapital Requirements and Sources
Sale of 7 Slots Completed
Likely Financing Sources:- ECAs- Bank Debt- Capital
Markets- JOLs- GLLs
Existing Revolving Lines of Credit
Cash Needed for Purchases
ECA Financings in Process
Sales and Remaining Financing
~$6 Billion of Capital
For TUI Aircraft Portfolio Purchase
10 A330s & 20 A320s
30 A320s
Bank Financing
ALS II Securit-zation

10
Net Spread (Margin)Net Spread (Margin)($ Millions)
2Q 2007 2Q 2008 % Change
Basic Lease Rents 125 127 2%
(32%)
24%
11%
Less: Interest Expense* (50) (34)
Net Spread (Margin) 75 93
Average Lease Assets 3,122 3,460
*Excludes non-cash impact relating to the mark-to-market of interest rate caps and 2007 refinancing charges
- Basic lease rents on floating rate leases were lower as a result of lower interest rates- Interest expense was also reduced by the same amount, keeping margins intact- Growth of ~11% in lease assets, plus benefit from caps driving ~24% increase in margins

11
Net Spread TrendsNet Spread Trends
($ Millions) 2007 Avg. Quarter
2008 1st Quarter
2008 2nd Quarter
Net Spread (Margin)* 77 86 93
* Net Spread = Basic rents minus interest expense (excluding non-cash charges relating to the mark-to-market of interest rate caps and 2007 refinancing charges)
Growth in Net Spread Reflective of Growth in Leasing Income;Growth in Net Spread Reflective of Growth in Leasing Income;2008 Avg. Quarter Expected to be ~$95 Million (+23% over 2007)2008 Avg. Quarter Expected to be ~$95 Million (+23% over 2007)

1212
Lease Yield, Interest Rates, and Net SpreadLease Yield, Interest Rates, and Net Spread
2007 1st Half 2008
Lease Yield (excl. Maintenance) 16.1% 15.3%
Interest Cost (% of Lease Asset) 6.1% 4.4%
Net Spread (% of Lease Asset) 10.0% 10.9%
Note:- Lease Yield incl. Maintenance is 18.1% in 2007 and 17.4% in 1st Half 2008- Interest Cost as a % of Debt is 6.7% in 2007 and 4.7% in 1st Half 2008
Benefits from Use of Interest Rate Caps Driving Improvement in Net Spread Margin %

1313
High Quality and Well Diversified PortfolioHigh Quality and Well Diversified Portfolio
89% narrowbody – “Work Horses” of industry
High share of liquid / remarketable aircraft
Average age of owned aircraft fleet 7.5 years
76 engines in portfolio, as of June 30, 2008, incl. 2 on order
― CFM56 engines, one of the most widely used engines in the commercial aviation industry, represented 84% of our portfolio
Owned PortfolioManaged Portfolio
Number of Aircraft
Owned
% Net book Value at 31 December
Number ofAircraft
Number of Aircraft
on Order
Number of Aircraft under
Purchase Contract and letter of Intent
Total Owned, Managed
and Ordered Aircraft
Airbus A300 Freighter 1 0.8% - - - 1
Airbus A319 15 12.6% - 14 - 29
Airbus A320 58 35.7% 13 48 1 120
Airbus A321 19 16.0% 1 - - 20
Airbus A330 5 5.0% - 30 - 35
Airbus A340 - 0.0% 1 - - 1
Boeing 737 NG 18 16.6% 30 - 3 51
Boeing 737 Classic 16 3.9% - - 2 18
Boeing 757 11 4.2% 2 - - 14
Boeing 767 4 3.4% 3 - - 6
Fokker 100 - 0.0% 1 - - 1
MD 11 Freighter 1 0.9% 1 - - 2
MD-82 6 0.5% 2 - - 10
MD-83 4 0.4% 4 - - 6
Total 158 100.0% 58 92 6 314
Aircraft Portfolio as of June 30, 2008

14
Aircraft Portfolio ValuationAircraft Portfolio Valuation($ Billion) NBV or
Price PaidExternal
Appraisers
Difference/ Appraisers
Value
A320 Family, A330s, & B737NGs (~95% of Portfolio; …only ~12% > 8 Years of Age)
B757s, B767s, A300s (~1.5% of Portfolio)
5.37
0.08
6.93
0.13
23%
38%
23%
23%
B737 Classics and All Others (~3.5% of Portfolio) 0.20 0.26
Total Aircraft Assets 5.65 7.32
Note:- Based on data provided by external appraisers (Ascend, BK Associates, and AISI)- Includes AerCap’s currently owned aircraft plus forward orders- Based on information as of March 31, 2008 - Excluding JV partner’s share
15
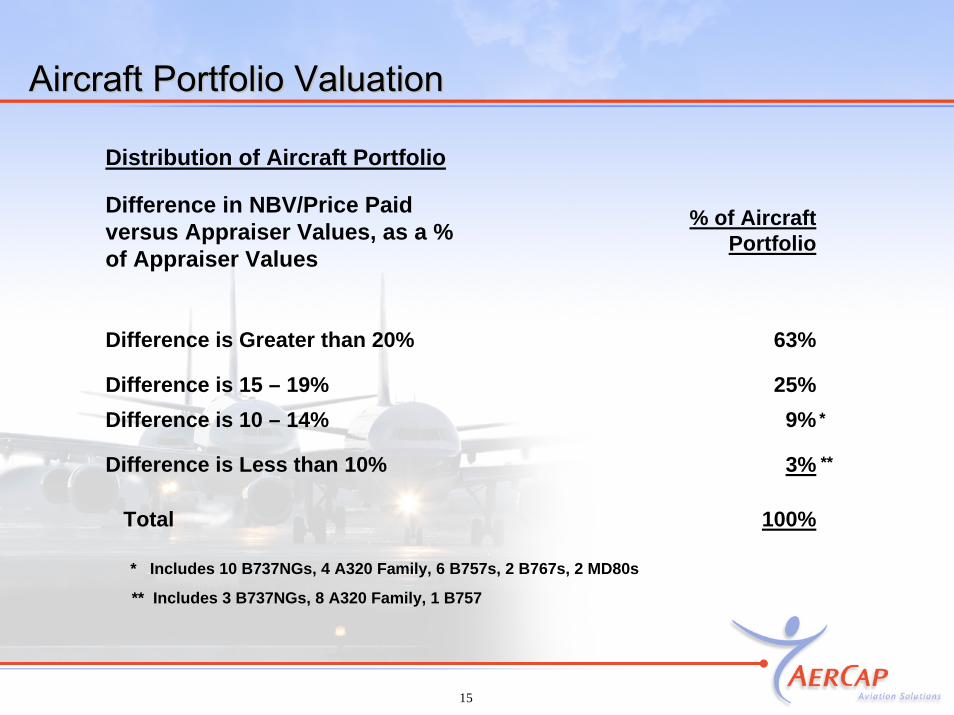
Aircraft Portfolio ValuationAircraft Portfolio Valuation
Distribution of Aircraft Portfolio
Difference in NBV/Price Paid versus Appraiser Values, as a % of Appraiser Values
% of Aircraft Portfolio
Difference is Greater than 20%
Difference is 15 – 19%
63%
25% Difference is 10 – 14% 9%
Difference is Less than 10% 3%
Total 100%
* Includes 10 B737NGs, 4 A320 Family, 6 B757s, 2 B767s, 2 MD80s
*
**
** Includes 3 B737NGs, 8 A320 Family, 1 B757

16
Sales Revenue vs. Proceeds from SalesSales Revenue vs. Proceeds from Sales(Income vs. Cash Flow Statement)(Income vs. Cash Flow Statement)
Sales Revenue ( from Income Statement) 181 323
Less: Inventory Sales* (34) (68)
Non-Cash Maintenance Sales Revenue (7) (7)
Add:Cash Received from Prior Period Sales 24 -
Proceeds from Sales/Disposal of Assets (from Cash Flow Statement) 164 248
2Q 2008 1H 2008($ Million)
* Reflected in Change in Assets /Liabilities in Cash Flow Statement (Inventories)

17
Gain from SalesGain from Sales(Income vs. Cash Flow Statement)(Income vs. Cash Flow Statement)
Gain from Sales (Income Statement) …. Sales Revenue less COGS 40 73
Less: Inventory Sales* (10) (20)
Gain on Disposal of Assets (Cash Flow Statement) 30 53
2Q 2008 1H 2008($ Million)
* Reflected in Change in Assets /Liabilities in Cash Flow Statement (Inventories)
18
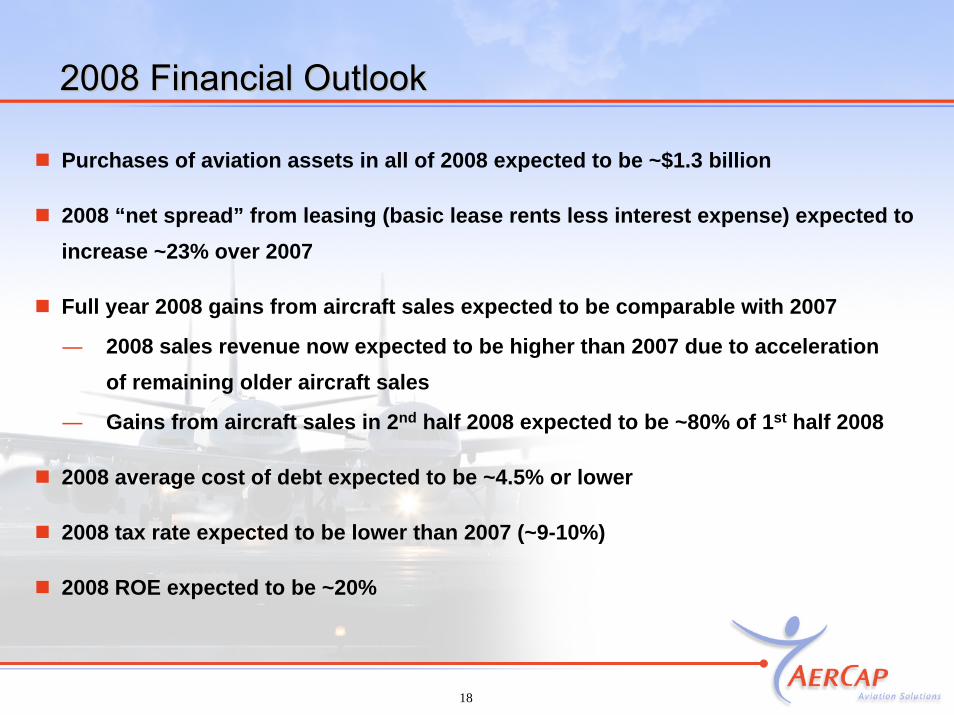
2008 Financial Outlook2008 Financial Outlook
Purchases of aviation assets in all of 2008 expected to be ~$1.3 billion
2008 “net spread” from leasing (basic lease rents less interest expense) expected to increase ~23% over 2007
Full year 2008 gains from aircraft sales expected to be comparable with 2007
― 2008 sales revenue now expected to be higher than 2007 due to acceleration of remaining older aircraft sales
― Gains from aircraft sales in 2nd half 2008 expected to be ~80% of 1st half 2008
2008 average cost of debt expected to be ~4.5% or lower
2008 tax rate expected to be lower than 2007 (~9-10%)
2008 ROE expected to be ~20%


