Download - Aegon Q1 2016 Results Presentation

Helping people achieve a lifetime of financial security
Q1 2016 Results
Alex Wynaendts Darryl Button
CEO CFO
The Hague – May 12, 2016

2
Q1 results impacted by volatile markets Strong sales momentum reflects successful implementation of strategy
• Underlying earnings were up as higher earnings from Europe more than offset lower US earnings
• Solvency II ratio at end of Q1 2016 ~155% as a result of the share buyback, 2015 final dividend and negative capital generation driven by adverse market movements
• Continued strong sales from fee-based deposit businesses
Overview
Note: Earnings = underlying earnings before tax
+1.3pp compared with Q1 2015
-5pp
compared with year-end 2015
excluding one-time items and
market impacts of EUR (0.9)bn
+36% compared with Q1 2015
€ ~0.3bn ~155%
Solvency II Capital generation
+7% compared with Q1 2015
€ 462m 7.3%
Return on Equity Earnings
€ 3.6bn
Sales

3
Underlying earnings before tax increased Results impacted by lower equity markets
• In the Americas earnings declined mainly because of the recurring impact of the Q3 2015 actuarial assumption changes and model updates and lower fee income from lower average equity markets
• Higher earnings from Europe as a result of lower DPAC amortization in the UK and normalization of surrenders in Poland
• Asset Management earnings remained stable, while Asia improved and Holding costs were lower
Earnings
Underlying earningsbefore tax Q1 15
Americas Europe Asia, AAMand Holding
Underlying earningsbefore tax Q1 16
432 (7) 28 9 462
Underlying earnings before tax comparison (EUR million)

4
Lower fee earnings in the Americas Lower average balances as a result of lower average equity markets
• Unfavorable equity market returns during the first half of the quarter resulted in lower average account balances
• Lower average account balances resulted in USD 15 million lower fee earnings compared with YE 2015
- Retirement Plans (RP) impacted by USD 4 million, Variable Annuities (VA) by USD 10 million and Mutual Funds (MF) by USD 1 million
Earnings
* Retirement Plans’ account balances, excluding Mercer acquired business which is priced on a per participant basis, as well as balances where the earnings are based off an investment spread
VA account balances (USD billion)
66.7
64.7
66.8
Q4 15ending
Q1 16avg
Q1 16ending
RP* account balances (USD billion)
106.7 105.8
110.7
Q4 15ending
Q1 16avg
Q1 16ending
MF account balances (USD billion)
16.7
16.4
16.9
Q4 15ending
Q1 16avg
Q1 16ending
USD (4)
million
USD (10)
million
USD (1)
million

5
Net income impacted by fair value items Losses on alternative investments and hedges
Earnings
• Alternative investment losses in Americas mainly the result of poor hedge funds returns
• Losses on fair value items with an accounting match due to the differences between Solvency II and IFRS on Aegon’s interest rate hedges in the Netherlands. Liabilities moved by EUR (2.4) billion and derivatives moved by EUR 2.3 billion
• Fair value hedging without an accounting match negative as a result of hedge mismatches in the US caused by high market volatility, and negative results in NL and the Holding
FV investments
EUR (104) million
FV hedging with
accounting match
EUR (101) million
FV hedging without
accounting match
EUR (152) million
• Americas: (135)
• Netherlands: 31
• US GMWB: 7
• Netherlands
guarantees: (108)
• US Macro: (92)
• Netherlands: (26)
• Holding: (41)
• UK: 7
1 2 3
1
2
3
Net income Q1 2016
Income taxes
Realized gains
Run-off businesses
Other charges
Net impairments
Fair value items
UEBT Q1 2016
UEBT to net income development in Q1 2016 (EUR million)
462
(358)
(36)
(6)
28
54
(1)
143

6
Solvency II ratio at ~155% Ratios mainly impacted by adverse market impacts
Capital
* Pro forma basis includes reinsurance of 2/3 of UK annuity book pre-Part VII transfer
• EUR 400 million share
buyback
• EUR 280 million proposed
final 2015 dividend
• Deducted from Solvency II
own funds when
management decision
made
• Pro forma UK
annuity portfolio sale
• Other
• Wider mortgage spread in NL
• Credit ratings migration
• Staff pension plans IAS 19 loss
• Second order impacts of lower
interest rates (credit risk, longevity
risk, volatility adjuster and risk
margins)
~155%* ~160%
Q4 2015 Q1 2016
~140% ~135% ~480%
United States Netherlands
+2% (6%) +5% (6%)
United Kingdom*
• Capital generation
excluding market
impacts and one-
time items
Capital return to
shareholders Other Market impacts Capital generation
Local solvency
ratio by unit
SII SII RBC
7
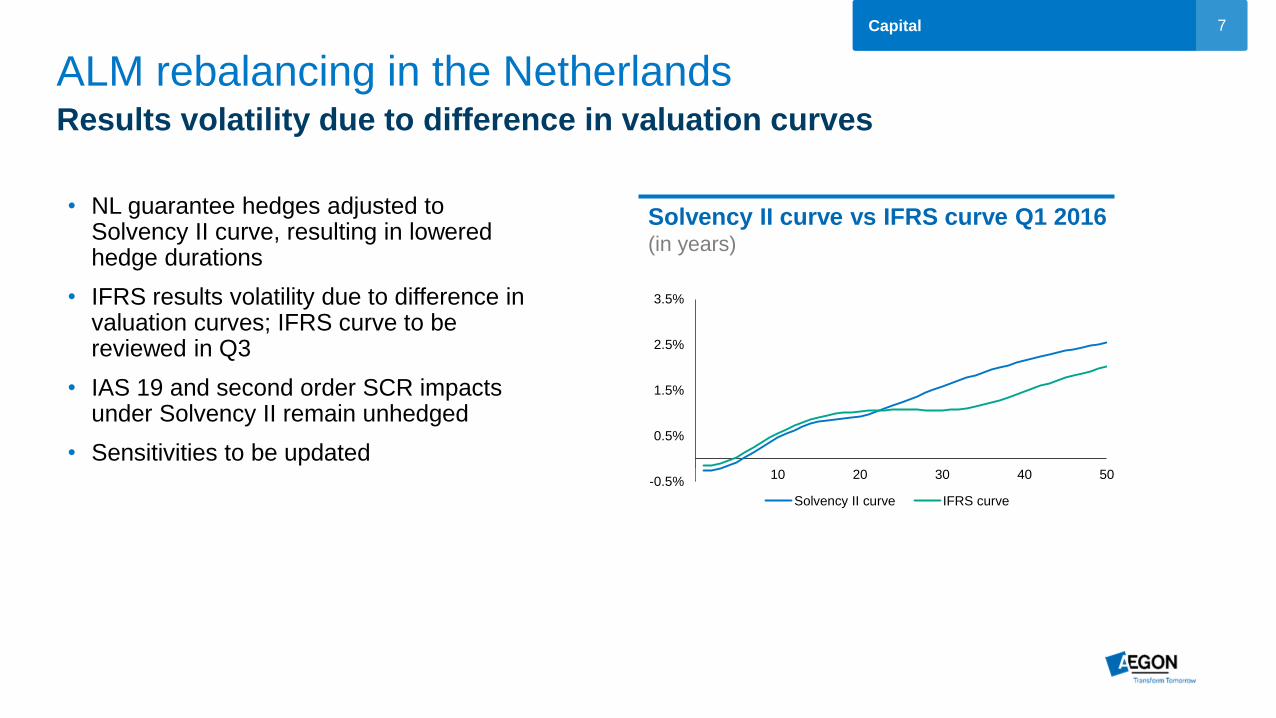
ALM rebalancing in the Netherlands Results volatility due to difference in valuation curves
Capital
• NL guarantee hedges adjusted to Solvency II curve, resulting in lowered hedge durations
• IFRS results volatility due to difference in valuation curves; IFRS curve to be reviewed in Q3
• IAS 19 and second order SCR impacts under Solvency II remain unhedged
• Sensitivities to be updated
Solvency II curve vs IFRS curve Q1 2016 (in years)
-0.5%
0.5%
1.5%
2.5%
3.5%
0 10 20 30 40 50
Solvency II curve IFRS curve
8
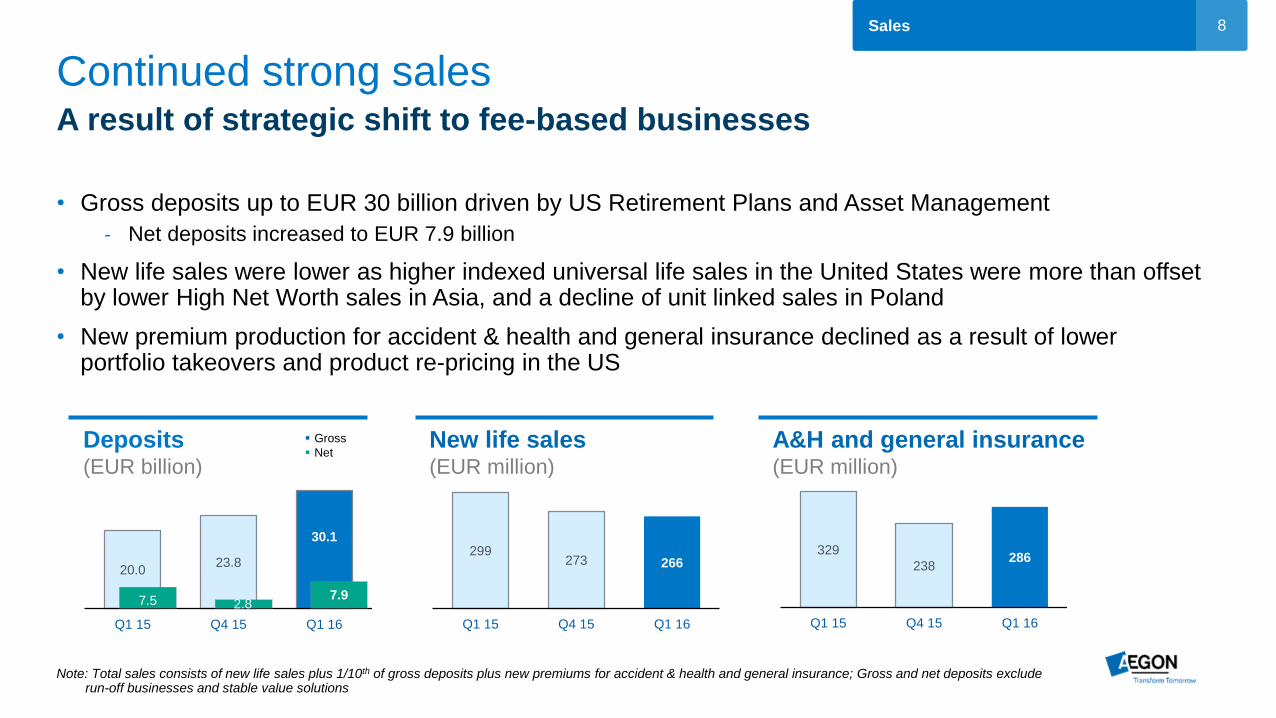
Continued strong sales A result of strategic shift to fee-based businesses
• Gross deposits up to EUR 30 billion driven by US Retirement Plans and Asset Management
- Net deposits increased to EUR 7.9 billion
• New life sales were lower as higher indexed universal life sales in the United States were more than offset by lower High Net Worth sales in Asia, and a decline of unit linked sales in Poland
• New premium production for accident & health and general insurance declined as a result of lower portfolio takeovers and product re-pricing in the US
Sales
Note: Total sales consists of new life sales plus 1/10th of gross deposits plus new premiums for accident & health and general insurance; Gross and net deposits exclude run-off businesses and stable value solutions
Deposits (EUR billion)
20.0 23.8
30.1
Q1 15 Q4 15 Q1 16
7.9 7.5
New life sales (EUR million)
A&H and general insurance (EUR million)
299 273 266
Q1 15 Q4 15 Q1 16
329
238 286
Q1 15 Q4 15 Q1 16
Gross
Net
2.8

9
Final DOL Fiduciary Rule Better understanding the implications of the complex regulation
Regulation
• Comes into full effect as of January 1, 2018 (with certain aspects effective April 2017)
• Concerns remain about access to financial advice for individuals
• Work still needs to be done together with the industry and distribution networks to fully understand the impact of the final DOL rule
• Focused on ensuring organizational readiness for the DOL rule
• Developing a variety of solutions that support the needs of customers and distribution partners
• Continue to help people achieve a lifetime of financial security
Key takeaways Potential impact Actions
• Short-term negative impact of 10 - 20% on VA sales in line with industry expectations
• No meaningful impact on VA back book
• Impact on other businesses ‒ Rollovers (-)
‒ Mutual funds (-)
‒ Retirement plans (+)
• Higher implementation and compliance related expenses

10
Cost savings programs progressing Benefits of cost savings program to be reflected as of second half of 2016
Strategy
Americas Netherlands Holding & Other
Total annual cost savings of EUR 200 million by year end 2018
• Reduce complexity by
transforming to ONE
Transamerica
• Completed voluntary
separation incentive plan in
Q1 2016
• Announced additional
position eliminations in Q1
• USD 40 million of benefits
to be reflected in second
half of 2016
• Aligning reporting structure
with business units
• Reduce complexity and
streamline processes
• Reduction of legacy
systems
• Improve procurement
across the organization
• Cost savings identified on
existing book in:
• Operations
• IT
• Support
• Commerce costs
• Continuing reduction of
legacy systems
• Product simplification
• Customer self-service
11
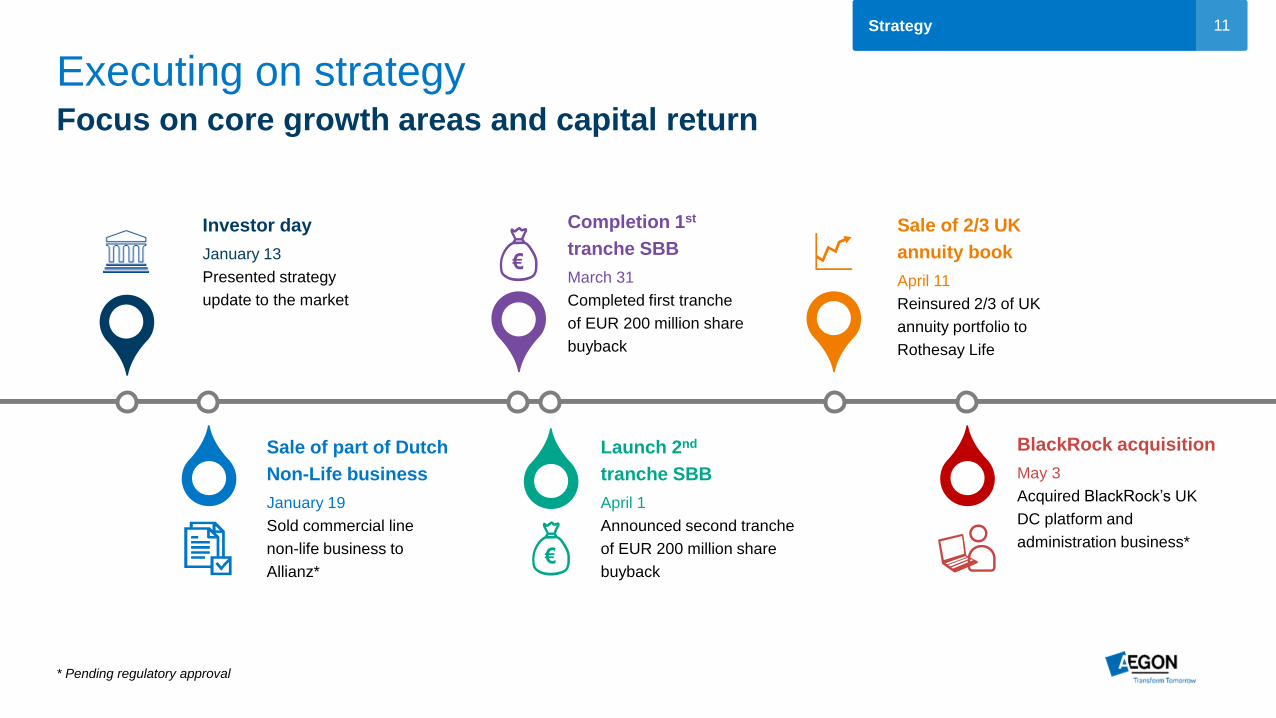
Executing on strategy Focus on core growth areas and capital return
Strategy
Sale of part of Dutch
Non-Life business
January 19
Sold commercial line
non-life business to
Allianz*
Investor day
January 13
Presented strategy
update to the market
Completion 1st
tranche SBB
March 31
Completed first tranche
of EUR 200 million share
buyback
Sale of 2/3 UK
annuity book
April 11
Reinsured 2/3 of UK
annuity portfolio to
Rothesay Life
BlackRock acquisition
May 3
Acquired BlackRock’s UK
DC platform and
administration business*
Launch 2nd
tranche SBB
April 1
Announced second tranche
of EUR 200 million share
buyback
* Pending regulatory approval

12 12 Appendix
For questions please contact
Investor Relations
+31 70 344 8305
P.O. Box 85
2501 CB The Hague
The Netherlands
Appendix
13
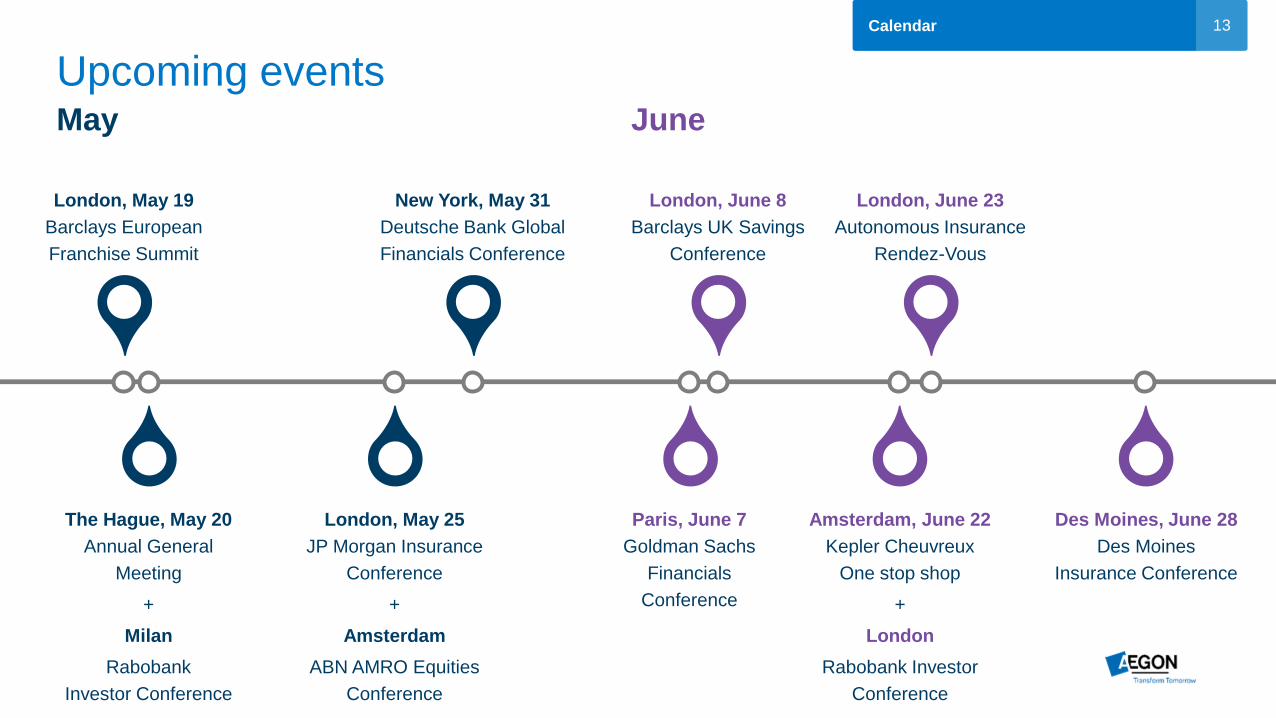
Upcoming events May June
London, May 19
Barclays European
Franchise Summit
The Hague, May 20
Annual General
Meeting
+
Milan
Rabobank
Investor Conference
London, May 25
JP Morgan Insurance
Conference
+
Amsterdam
ABN AMRO Equities
Conference
New York, May 31
Deutsche Bank Global
Financials Conference
Paris, June 7
Goldman Sachs
Financials
Conference
London, June 8
Barclays UK Savings
Conference
Amsterdam, June 22
Kepler Cheuvreux
One stop shop
+
London
Rabobank Investor
Conference
Des Moines, June 28
Des Moines
Insurance Conference
London, June 23
Autonomous Insurance
Rendez-Vous
Calendar

14
Index Press subject to go directly to the section
Appendix
Q1 2016
Financials
Slide 21-32
Q1 2016
Asset portfolio
Slide 18-20
Strategy
support
Slide 15-17

15
9%
57%
34%
Asia <1%
Aegon at a glance
Life insurance, pensions &
asset management for
30 million customers
Our roots date back to the
first half of the 19th century Close to 30,000 employees
(March 31, 2016)
Employees History Focus
Underlying earnings
before tax of
EUR 462 million (2016 YTD)
Revenue-generating
investments are
EUR 705 billion (March 31, 2016)
in claims and benefits
EUR 43 billion (2015)
Paid out Investments Earnings
Americas
Europe AAM
Strategy support

16
Responsible business
• Extend Responsible Investment approach to externally managed assets where possible
• Investigate the risks represented by climate change, and adapt our investment strategy if required
• Investigate the investment opportunities in the transition to a low-carbon economy as part of the Impact Investment program
• Educate our customers, employees and society at large on issues surrounding retirement security, longevity and population aging
• Explore opportunities for product and services that improve our customers’ Retirement Readiness and promote healthy aging
Our commitment: “To act responsibly and to create positive impact for all our stakeholders”
Putting our customers at
the center of what we do
Having a responsible
investments approach
Empowering our
employees Promoting retirement
readiness
• Invest in our workforce by providing training and development opportunities related to the strategic direction of the company
• Create a positive, open working environment that stimulates diversity and inclusion
Aegon’s approach
to sustainability is
recognized externally
Embedded in our operations
• Deliver products and services customers can trust (market conduct standards)
• Take value for the customer into account at every step of the product development process
Strategy support

17
Committed to financial education Conduct research, educate the public and lead dialogue on financial issues
Strategy support
Helping people achieve a lifetime of financial security
Publication of original research
regarding: retirement, longevity,
population aging, retirement
security, healthcare coverage
and health & wellness
International presence Established Centers for
longevity and retirement in the
US, the Netherlands and Brazil
Research publication The Centers for longevity and
retirement are a collaboration of
experts from Aegon’s
businesses in Europe, the
Americas and Asia
Partnering up Building relationships with
respected partners in the field of
longevity, retirement and health
Leveraging expertise

18
General account investments By geography
March 31, 2016 amounts in EUR millions, except for the impairment data
Americas Europe Asia Holding & other Total
Cash/Treasuries/Agencies 18,316 20,952 261 62 39,592
Investment grade corporates 39,434 10,024 3,071 - 52,528
High yield (and other ) corporates 2,913 280 110 - 3,303
Emerging markets debt 1,502 1,474 107 - 3,083
Commercial MBS 4,899 634 526 - 6,059
Residential MBS 4,316 798 74 - 5,189
Non-housing related ABS 2,928 3,264 307 - 6,500
Housing related ABS - 987 - - 987
Subtotal 74,308 38,413 4,456 62 117,240
Residential mortgage loans 24 25,614 - - 25,638
Commercial mortgage loans 7,493 61 - - 7,553
Total mortgages 7,517 25,675 - - 33,192
Convertibles & preferred stock 295 2 - - 297
Common equity & bond funds 436 875 - 114 1,425
Private equity & hedge funds 1,971 122 - 3 2,095
Total equity like 2,701 999 - 117 3,817
Real estate 1,202 1,160 - - 2,362
Other 815 3,274 - 7 4,096
General account (excl. policy loans) 86,543 69,521 4,456 187 160,706
Policyholder loans 2,052 9 18 - 2,079
Investments general account 88,595 69,530 4,473 187 162,784
Impairments as bps (Q1 2016) 4 - 1 - 2
Asset portfolio

19
Structured assets and corporate bonds By rating
March 31, 2016 amounts in EUR millions
AAA AA A BBB <BBB NR Total
Structured assets by rating
Commercial MBS 4,396 1,068 317 144 135 - 6,059
Residential MBS 2,351 304 205 221 2,109 - 5,189
Non-housing related ABS 3,059 900 1,783 500 258 - 6,500
Housing related ABS - 289 669 28 - - 987
Total 9,805 2,560 2,975 893 2,502 - 18,735
Credits by rating
IG Corporates 1,168 4,450 22,465 24,444 - - 52,528
High yield corporate - - 3 3 3,297 - 3,303
Emerging markets debt 82 167 1,042 1,066 720 6 3,083
Total 1,250 4,617 23,510 25,512 4,017 6 58,913
Cash/Treasuries/Agencies 39,592
Total 11,056 7,177 26,484 26,405 6,519 6 117,240
Asset portfolio

20
US energy & commodity exposure Direct and indirect by rating
March 31, 2016 amounts in EUR millions
AAA AA A BBB <BBB/NR Total Unrealized gain
/ (loss)
Independent - 3 327 634 139 1,104 (57)
Oil field services - 41 181 1 157 380 (77)
Midstream - - 231 1,002 85 1,317 (21)
Integrated 145 385 445 362 149 1,486 67
Refining - - - 128 48 176 (2)
Total energy related 145 429 1,185 2,126 577 4,463 (89)
Metals and mining - - 234 303 167 704 (77)
Total corporate bonds 145 429 1,419 2,429 744 5,167 (166)
Commercial paper - - - 69 - 69 -
Real estate LP - - - - - 154 -
Total general account exposure
145 429 1,419 2,499 744 5,390 (166)
% of US general account.. 6.1%
CDS exposure (notional) - - 31 232 49 313
Note: Amounts are fair value per March 31, 2016; 96.9% fair value to amortized cost for corporate bonds
Asset portfolio
21
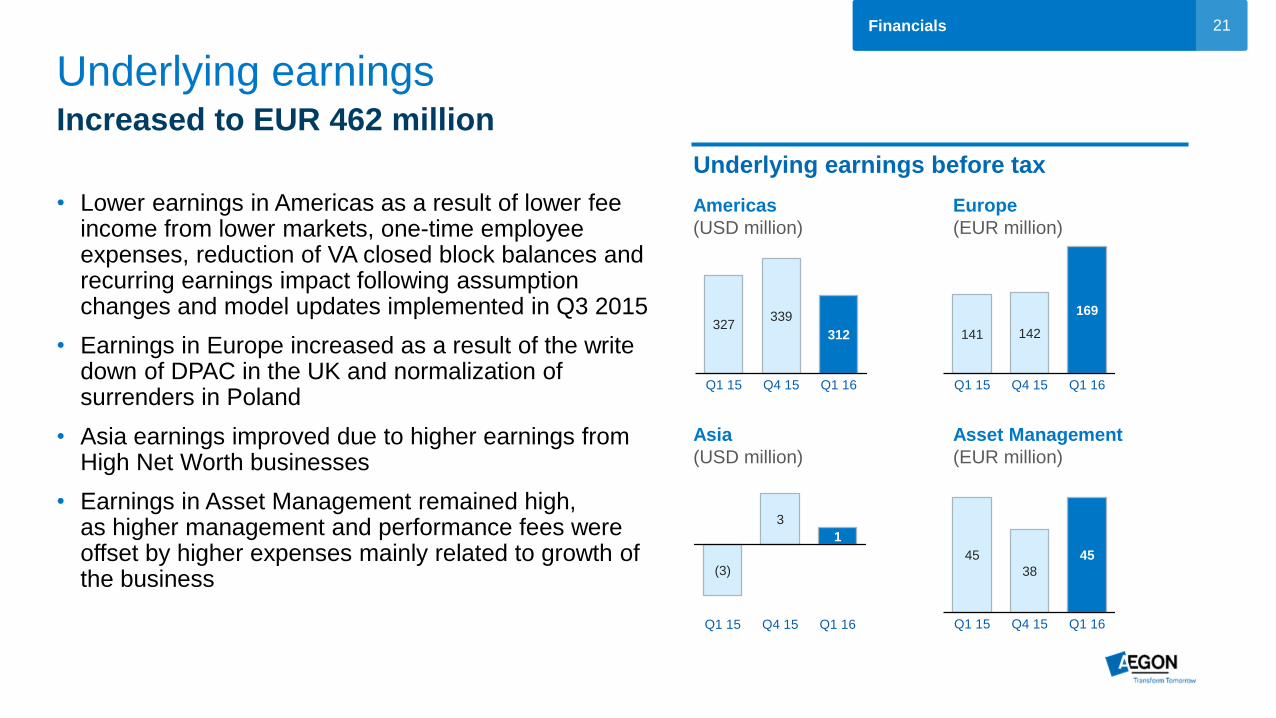
Underlying earnings Increased to EUR 462 million
• Lower earnings in Americas as a result of lower fee
income from lower markets, one-time employee expenses, reduction of VA closed block balances and recurring earnings impact following assumption changes and model updates implemented in Q3 2015
• Earnings in Europe increased as a result of the write down of DPAC in the UK and normalization of surrenders in Poland
• Asia earnings improved due to higher earnings from High Net Worth businesses
• Earnings in Asset Management remained high, as higher management and performance fees were offset by higher expenses mainly related to growth of the business
Financials
45
38
45
Q1 15 Q4 15 Q1 16
Americas
(USD million)
Asia
(USD million)
Asset Management
(EUR million)
Europe
(EUR million)
141 142
169
Q1 15 Q4 15 Q1 16
327 339
312
Q1 15 Q4 15 Q1 16
(3)
3
1
Q1 15 Q4 15 Q1 16
Underlying earnings before tax

22
Fair value items Impacted by alternative investments and hedge programs
Total of EUR (358) million
Financials
Note: FV hedging with accounting match excludes changes in own credit spread and other non-hedged items
Americas: (135)
Alternative investments (-)
Real estate (-)
Credit derivatives (-)
Netherlands: 31
Real estate (+)
US GMWB: 7
Interest rates (-)
Other (+)
Netherlands guarantees: (108)
Credit related hedges (+)
Accounting mismatch on interest
rate hedges (-)
Other (-)
US macro hedging: (92)
Equity (-)
IUL product hedge (-)
Interest rate hedges (+)
Other (-)
Other: (1)
• Chinese equity portfolio (-)
• Other FV items (+)
FV hedging with
accounting match
EUR (101) million
Derivatives ∆: EUR 2,314m
Liability ∆: EUR (2,415)m
FV hedging without
accounting match
EUR (152) million
Derivatives ∆: EUR (110)m
Liability ∆: EUR (42)m
FV other
EUR (1) million
FV investments
EUR (104) million
Netherlands: (26)
Duration management (-)
Other (+)
UK: 7
Inflation hedge (+)
Equity (+)
Holding: (41)
Perpetual securities and LT debt (-)
23
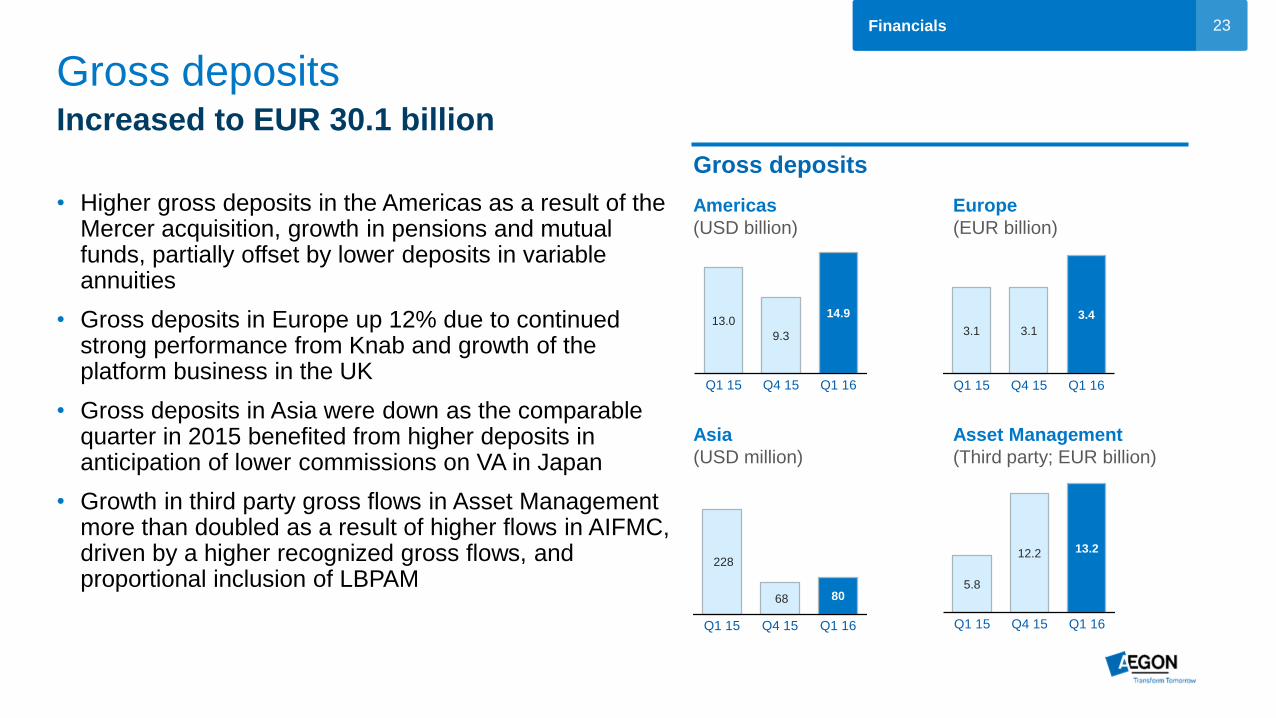
Gross deposits Increased to EUR 30.1 billion
• Higher gross deposits in the Americas as a result of the
Mercer acquisition, growth in pensions and mutual funds, partially offset by lower deposits in variable annuities
• Gross deposits in Europe up 12% due to continued strong performance from Knab and growth of the platform business in the UK
• Gross deposits in Asia were down as the comparable quarter in 2015 benefited from higher deposits in anticipation of lower commissions on VA in Japan
• Growth in third party gross flows in Asset Management more than doubled as a result of higher flows in AIFMC, driven by a higher recognized gross flows, and proportional inclusion of LBPAM
Financials
Americas
(USD billion)
Asia
(USD million)
Asset Management
(Third party; EUR billion)
Europe
(EUR billion)
Gross deposits
3.1 3.1
3.4
Q1 15 Q4 15 Q1 16
228
68 80
Q1 15 Q4 15 Q1 16
13.0
9.3
14.9
Q1 15 Q4 15 Q1 16
5.8
12.2 13.2
Q1 15 Q4 15 Q1 16
24
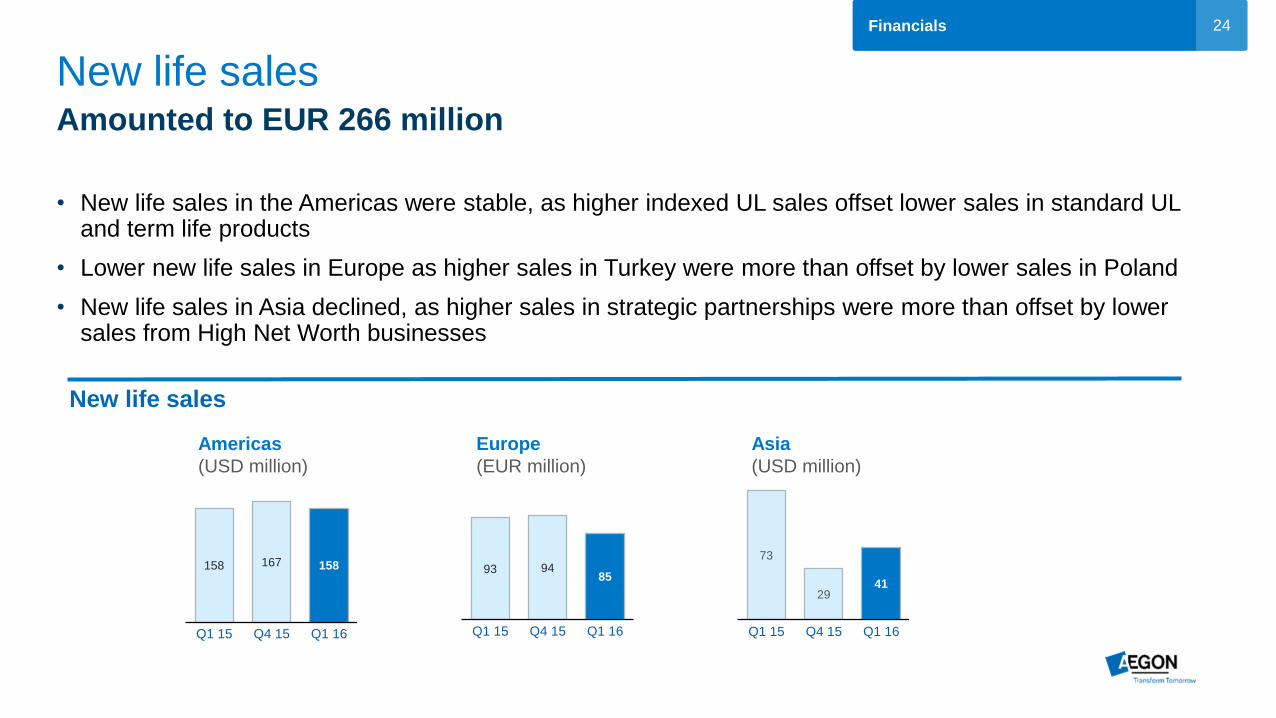
New life sales Amounted to EUR 266 million
• New life sales in the Americas were stable, as higher indexed UL sales offset lower sales in standard UL
and term life products
• Lower new life sales in Europe as higher sales in Turkey were more than offset by lower sales in Poland
• New life sales in Asia declined, as higher sales in strategic partnerships were more than offset by lower sales from High Net Worth businesses
Financials
Americas
(USD million)
Asia
(USD million)
Europe
(EUR million)
New life sales
93 94 85
Q1 15 Q4 15 Q1 16
158 167 158
Q1 15 Q4 15 Q1 16
73
29 41
Q1 15 Q4 15 Q1 16

25
MCVNB of EUR 133 million Impacted by margin pressure, low interest rates and methodology change
• Higher MCVNB in the Americas mainly driven by a higher contribution from life insurance, offsetting a lower contribution from VA
• MCVNB in Europe decreased as a result of a change in the product mix for pensions in the Netherlands
• MCVNB in Asia declined, driven by lower sales, lower interest rates and widening credit spreads
Financials
Americas
(USD million)
Asia
(USD million)
Europe
(EUR million)
64
46 56
Q1 15 Q4 15 Q1 16
70
111 89
Q1 15 Q4 15 Q1 16
16
2
(5)
Q1 15 Q4 15 Q1 16
Market consistent value of new business
Note: There is no MCVNB recognized on new Asset Management business

26
Operating expenses Increased to EUR 960 million
• Operating expenses in the Americas increased driven by the Mercer acquisition and one-time employee expenses
• Operating expenses in Europe remained stable as lower restructuring expenses in NL were offset by expense growth in the UK as a result of upgrading policies from the back book and Spain
• Increase in operating expenses in Asia driven by higher expenses in China and the increase in Aegon’s stake in its strategic partnership in India from 26% to 49%
• Operating expenses in Asset Management up mainly due to business growth, currency movements, elevated project-related expenses and the inclusion of costs relating to the partnership with LBPAM
Financials
Operating expenses
Americas
(USD million)
Asia
(USD million)
Asset Management
(EUR million)
Europe
(EUR million)
359 388
360
Q1 15 Q4 15 Q1 16
450 472 479
Q1 15 Q4 15 Q1 16
38 36
43
Q1 15 Q4 15 Q1 16
96
126 114
Q1 15 Q4 15 Q1 16

27
Capital generation and capital buffer Impacted by adverse financial markets
• Capital generation of EUR 0.3 billion, excluding market impacts of EUR (0.7) billion and one-time items of EUR (0.2) billion
• Capital buffer in the holding decreased to EUR 1.0 billion driven by completion of the first tranche of the share buyback and investments in country units
Financials
Capital generation (EUR billion)
Holding capital buffer development (EUR billion)
Q1 16
Capital generation (0.6)
Market impacts & one-time items (0.9)
Capital generation excluding market impacts & one-time items 0.3
Holding funding & operating expenses (0.1)
Free cash flow 0.2
Q4 15 Q1 16
Starting position 1.8 1.4
Net dividends received from units 0.2 (0.1)
Acquisitions & divestments - -
Dividends & share buyback - (0.2)
Funding & operating expenses (0.1) (0.1)
Leverage issuances/redemptions (0.5) -
Other 0.0 (0.0)
Ending position 1.4 1.0

28
2012 2013 2014 2015 Q1 2016
Payout annuities 0.5 0.5 0.4 0.4 0.4
Institutional spread-based business 0.6 0.4 0.3 0.3 0.2
BOLI/COLI 0.5 0.5 0.6 0.4 0.4
Life reinsurance 1.1 0.7 0.6 0.6 0.3
2.7 2.1 2.0 1.7 1.3
Capital allocated to run-off businesses Further reduced in Q1 2016
• Current capital allocated to run-off businesses of USD 1.3 billion
• Capital intensive run-off businesses negatively impact return on equity
- Capital allocated to run-off businesses included in RoE calculations, but earnings are excluded
• Reduction of USD 0.3 billion of capital due to accounting change - Part of the ambition to reduce capital allocated to run-off businesses by USD 1 billion by 2018
Financials
Allocated capital to run-off businesses (USD billion)

29
Main economic assumptions
US NL UK
Exchange rate against euro 1.10 n.a. 0.71
Annual gross equity market return (price appreciation + dividends) 8% 7% 7%
US NL UK
10-year government bond yields Develop in line with forward curves per year-end 2015
10-year government bond yields Grade to 4.25% in 10 years time
Credit spreads Grade from current levels to 110 bps over four years
Bond funds Return of 4% for 10 years and 6% thereafter
Money market rates Remain flat at 0.2% for two quarters followed by a 9.5-year grading to 2.5%
Main assumptions for US DAC recoverability
Main assumptions for financial targets
Overall assumptions
Financials
30
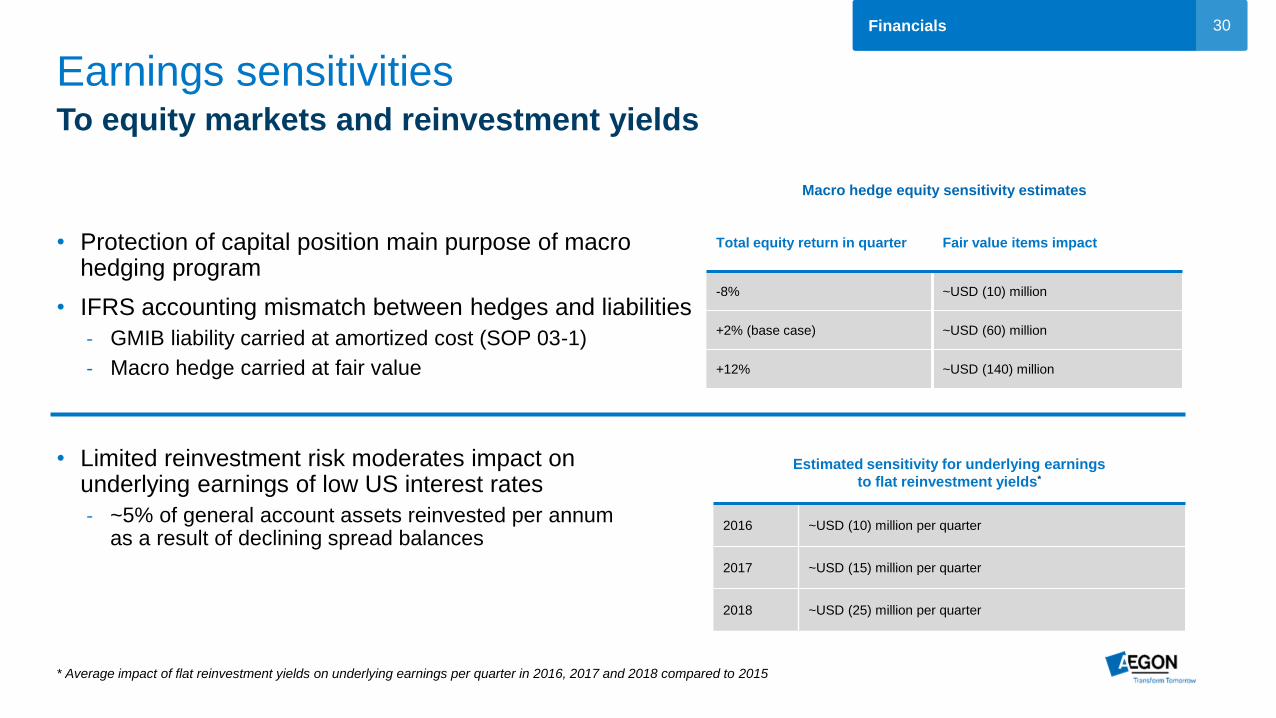
Earnings sensitivities To equity markets and reinvestment yields
• Protection of capital position main purpose of macro hedging program
• IFRS accounting mismatch between hedges and liabilities
- GMIB liability carried at amortized cost (SOP 03-1)
- Macro hedge carried at fair value
Financials
* Average impact of flat reinvestment yields on underlying earnings per quarter in 2016, 2017 and 2018 compared to 2015
Macro hedge equity sensitivity estimates
Total equity return in quarter Fair value items impact
-8% ~USD (10) million
+2% (base case) ~USD (60) million
+12% ~USD (140) million
Estimated sensitivity for underlying earnings
to flat reinvestment yields*
2016 ~USD (10) million per quarter
2017 ~USD (15) million per quarter
2018 ~USD (25) million per quarter
• Limited reinvestment risk moderates impact on underlying earnings of low US interest rates
- ~5% of general account assets reinvested per annum as a result of declining spread balances

31
Investing in Aegon
• Aegon ordinary shares - Traded on Euronext Amsterdam since 1969
and quoted in euros
• Aegon New York Registry Shares (NYRS) - Traded on NYSE since 1991 and quoted in US dollars
- One Aegon NYRS equals one Aegon Amsterdam-listed common share
- Cost effective way to hold international securities
Financials
Aegon’s ordinary shares
Aegon’s New York Registry Shares
Ticker symbol AGN NA
ISIN NL0000303709
SEDOL 5927375NL
Trading Platform Euronext Amsterdam
Country Netherlands
Aegon NYRS contact details
Broker contacts at Citibank:
Telephone: New York: +1 212 723 5435
London: +44 207 500 2030
E-mail: [email protected]
Ticker symbol AEG US
NYRS ISIN US0079241032
NYRS SEDOL 2008411US
Trading Platform NYSE
Country USA
NYRS Transfer Agent Citibank, N.A.

32
Disclaimer
Cautionary note regarding non-IFRS measures
This document includes the following non-IFRS financial measures: underlying earnings before tax, income tax, income before tax and market consistent value of new business. These non-IFRS measures are calculated by consolidating on a proportionate basis Aegon’s joint ventures and
associated companies. The reconciliation of these measures, except for market consistent value of new business, to the most comparable IFRS measure is provided in note 3 ‘Segment information’ of Aegon’s Condensed Consolidated Interim Financial Statements. Market consistent value of new
business is not based on IFRS, which are used to report Aegon’s primary financial statements and should not be viewed as a substitute for IFRS financial measures. Aegon may define and calculate market consistent value of new business differently than other companies. Aegon believes that
these non-IFRS measures, together with the IFRS information, provide meaningful information about the underlying operating results of Aegon’s business including insight into the financial measures that senior management uses in managing the business. In addition, return on equity is a ratio
using a non-IFRS measure and is calculated by dividing the net underlying earnings after cost of leverage by the average shareholders’ equity excluding the preferred shares, the revaluation reserve and the reserves related to defined benefit plans.
Local currencies and constant currency exchange rates
This document contains certain information about Aegon’s results, financial condition and revenue generating investments presented in USD for the Americas and Asia, and in GBP for the United Kingdom, because those businesses operate and are managed primarily in those currencies. Certain
comparative information presented on a constant currency basis eliminates the effects of changes in currency exchange rates. None of this information is a substitute for or superior to financial information about Aegon presented in EUR, which is the currency of Aegon’s primary financial
statements.
Forward-looking statements
The statements contained in this document that are not historical facts are forward-looking statements as defined in the US Private Securities Litigation Reform Act of 1995. The following are words that identify such forward-looking statements: aim, believe, estimate, target, intend, may, expect,
anticipate, predict, project, counting on, plan, continue, want, forecast, goal, should, would, is confident, will, and similar expressions as they relate to Aegon. These statements are not guarantees of future performance and involve risks, uncertainties and assumptions that are difficult to predict.
Aegon undertakes no obligation to publicly update or revise any forward-looking statements. Readers are cautioned not to place undue reliance on these forward-looking statements, which merely reflect company expectations at the time of writing. Actual results may differ materially from
expectations conveyed in forward-looking statements due to changes caused by various risks and uncertainties. Such risks and uncertainties include but are not limited to the following:
Changes in general economic conditions, particularly in the United States, the Netherlands and the United Kingdom;
Changes in the performance of financial markets, including emerging markets, such as with regard to:
► The frequency and severity of defaults by issuers in Aegon’s fixed income investment portfolios;
► The effects of corporate bankruptcies and/or accounting restatements on the financial markets and the resulting decline in the value of equity and debt securities Aegon holds; and
► The effects of declining creditworthiness of certain private sector securities and the resulting decline in the value of sovereign exposure that Aegon holds;
Changes in the performance of Aegon’s investment portfolio and decline in ratings of Aegon’s counterparties;
Consequences of a potential (partial) break-up of the euro or the potential exit of the United Kingdom and/or Greece from the European Union;
The frequency and severity of insured loss events;
Changes affecting longevity, mortality, morbidity, persistence and other factors that may impact the profitability of Aegon’s insurance products;
Reinsurers to whom Aegon has ceded significant underwriting risks may fail to meet their obligations;
Changes affecting interest rate levels and continuing low or rapidly changing interest rate levels;
Changes affecting currency exchange rates, in particular the EUR/USD and EUR/GBP exchange rates;
Changes in the availability of, and costs associated with, liquidity sources such as bank and capital markets funding, as well as conditions in the credit markets in general such as changes in borrower and counterparty creditworthiness;
Increasing levels of competition in the United States, the Netherlands, the United Kingdom and emerging markets;
Changes in laws and regulations, particularly those affecting Aegon’s operations’ ability to hire and retain key personnel, the products Aegon sells, and the attractiveness of certain products to its consumers;
Regulatory changes relating to the pensions, investment, and insurance industries in the jurisdictions in which Aegon operates;
Standard setting initiatives of supranational standard setting bodies such as the Financial Stability Board and the International Association of Insurance Supervisors or changes to such standards that may have an impact on regional (such as EU), national or US federal or state level financial
regulation or the application thereof to Aegon, including the designation of Aegon by the Financial Stability Board as a Global Systemically Important Insurer (G-SII).
Changes in customer behavior and public opinion in general related to, among other things, the type of products also Aegon sells, including legal, regulatory or commercial necessity to meet changing customer expectations;
Acts of God, acts of terrorism, acts of war and pandemics;
Changes in the policies of central banks and/or governments;
Lowering of one or more of Aegon’s debt ratings issued by recognized rating organizations and the adverse impact such action may have on Aegon’s ability to raise capital and on its liquidity and financial condition;
Lowering of one or more of insurer financial strength ratings of Aegon’s insurance subsidiaries and the adverse impact such action may have on the premium writings, policy retention, profitability and liquidity of its insurance subsidiaries;
The effect of the European Union’s Solvency II requirements and other regulations in other jurisdictions affecting the capital Aegon is required to maintain;
Litigation or regulatory action that could require Aegon to pay significant damages or change the way Aegon does business;
As Aegon’s operations support complex transactions and are highly dependent on the proper functioning of information technology, a computer system failure or security breach may disrupt Aegon’s business, damage its reputation and adversely affect its results of operations, financial
condition and cash flows;
Customer responsiveness to both new products and distribution channels;
Competitive, legal, regulatory, or tax changes that affect profitability, the distribution cost of or demand for Aegon’s products;
Changes in accounting regulations and policies or a change by Aegon in applying such regulations and policies, voluntarily or otherwise, which may affect Aegon’s reported results and shareholders’ equity;
The impact of acquisitions and divestitures, restructurings, product withdrawals and other unusual items, including Aegon’s ability to integrate acquisitions and to obtain the anticipated results and synergies from acquisitions;
Catastrophic events, either manmade or by nature, could result in material losses and significantly interrupt Aegon’s business; and
Aegon’s failure to achieve anticipated levels of earnings or operational efficiencies as well as other cost saving and excess capital and leverage ratio management initiatives.
Further details of potential risks and uncertainties affecting Aegon are described in its filings with the Netherlands Authority for the Financial Markets and the US Securities and Exchange Commission, including the Annual Report. These forward-looking statements speak only
as of the date of this document. Except as required by any applicable law or regulation, Aegon expressly disclaims any obligation or undertaking to release publicly any updates or revisions to any forward-looking statements contained herein to reflect any change in Aegon’s
expectations with regard thereto or any change in events, conditions or circumstances on which any such statement is based.


