
Instructions for use
Title Adenosine and inosine release during hypoxia in the isolated spinal cord of neonatal rats
Author(s) Takahashi, T.; Otsuguro, K.; Ohta, T.; Ito, S.
Citation British Journal of Pharmacology, 161(8): 1806-1816
Issue Date 2010-12
Doc URL http://hdl.handle.net/2115/47528
Rights The definitive version is available at www.interscience.wiley.com
Type article (author version)
File Information BJP161-8_1806-1816.pdf
Hokkaido University Collection of Scholarly and Academic Papers : HUSCAP

1
Adenosine and inosine release during hypoxia in the isolated spinal cord of rats
Running title: Adenosine and inosine release during hypoxia
T. Takahashi, K. Otsuguro, T. Ohta and S. Ito
Laboratory of Pharmacology, Graduate School of Veterinary Medicine, Hokkaido
University, Sapporo 060-0818, Japan
Correspondence: Ken-ichi Otsuguro, Laboratory of Pharmacology, Graduate School of
Veterinary Medicine, Hokkaido University, Kita 18, Nishi 9, Sapporo 060-0818, Japan
Tel. & Fax.: +81-11-706-5220
E-mail address: [email protected]
Word count: 6,289
Number of figures: 10
Number of tables: 0

2
Summary
Background and purpose: Adenosine and inosine accumulate extracellularly during
hypoxia/ischemia in the brain and may act as neuroprotectants. In spinal cord, there is
pharmacological evidence for increases in extracellular adenosine during hypoxia, but
no direct measurements of purine release, and furthermore the efflux pathways and
origin of extracellular purines are unknown. To characterize hypoxia-evoked purine
accumulation, we examined the effect of acute hypoxia on the extracellular levels of
adenosine and inosine in the isolated rat spinal cord.
Experimental approach: Extracellular adenosine and inosine concentrations were
assayed in an in vitro preparation of the isolated spinal cord of the neonatal rat by high
performance liquid chromatography (HPLC).
Key results: The extracellular level of inosine was about tenfold higher than that of
adenosine. Acute hypoxia (10 min) caused a temperature-dependent increase in these
two purines, which was inhibited by an increase in external Ca2+, but not by several
inhibitors of efflux pathways or metabolic enzymes of adenine nucleotides. Inhibitors
of adenosine deaminase or equilibrative nucleoside transporter (ENT) abolished the
hypoxia-evoked increase in inosine but not adenosine. A glial metabolic inhibitor
3
abolished the increase of both purines evoked by hypoxia but not by oxygen-glucose
deprivation, hypercapnia or an adenosine kinase inhibitor.
Conclusions and implications: Our data suggest that hypoxia releases adenosine itself
from intracellular sources. Inosine formed intracellularly may be released through
ENTs. During hypoxia, astrocytes appear to play a key role in purine release from the
rat spinal cord.
Key words: Hypoxia, adenosine, inosine, spinal cord, fluoroacetate
Abbreviations: AA, arachidonic acid; ACSF, artificial cerebrospinal fluid; BBG,
brilliant blue G; CBX, carbenoxolone; DPSPX,
1,3-dipropyl-8-(p-sulphophenyl)xanthine; DIP, dipyridamole; ENT, equilibrative
nucleoside transporter; EHNA, erythro-9-(2-hydroxy-3-nonyl)adenine hydrochloride;
FA, fluoroacetate; HPLC, high performance liquid chromatography; NBTI,
S-(4-nitrobenzyl)-6-thioinosine; OGD, oxygen-glucose deprivation; PDE,
phosphodiesterase; SPZ, sulfinepyrazone.
4
Introduction
Adenosine accumulates in the extracellular space during cerebral hypoxia/ischemia
(Latini and Pedeta, 2001; Pearson et al., 2003), and it acts as a neuroprotectant under
this pathological condition mainly due to the inhibition of excessive neuronal
excitation by adenosine A1 receptors (Wardas, 2002; Pedata et al., 2007). However, the
exact mechanisms responsible for adenosine accumulation are unknown. In the rat
brain, oxygen-glucose deprivation (OGD) or hypercapnia was reported to release ATP
(Parkinson and Xiong, 2004; Liu et al., 2008; Dulla et al., 2005), resulting in the
increase in extracellular adenosine due to their degradation by a series of ecto-enzymes
such as ecto-5’-nucleotidase (Matsuoka and Ohkubo, 2004; Gödecke, 2008). On the
other hand, there is also evidence showing that adenosine itself is directly released by
hypoxia (Martín et al., 2007) and OGD (Frenguelli et al., 2007).
In the rat hippocampal slices, Ca2+ inhibits adenosine release during hypoxia
indicating non-exocytotic release of adenosine (Dale et al., 2000; Martín et al., 2007).
A glial metabolic inhibitor is also reported to inhibit the hypoxia-evoked adenosine
release, suggesting the involvement of astrocytic function (Martín et al., 2007).
Inosine also accumulates during hypoxia/ischemia and elicits protective
effects (Haun et al., 1996; Litsky et al., 1999; Chen et al., 2002; Shen et al., 2007). In
5
rat hippocampal slices, most of the inosine increase occurring during hypoxia is due to
the extracellular degradation of adenosine mediated by ecto-adenosine deaminase
(Frenguelli et al., 2003). On the other hand, the increase in inosine during OGD is due
to the formation of inosine intracellularly and its subsequent release by equilibrative
nucleoside transporters (ENTs) in cultured rat cortical neurons and astrocytes
(Parkinson and Xiong, 2004). The mechanism of adenosine and inosine accumulation
in the extracellular space appears to depend on the experimental conditions and/or the
region of CNS involved.
Various diseases or surgical procedures cause hypoxic/ischemic conditions in
the spinal cord that impair spinal function (Cheshire et al., 1996; Tator et al., 1997;
Rowland et al., 2008). It has been reported that acute hypoxia depresses spinal synaptic
transmission which is reversed by adenosine A1 receptor antagonists (Lloyd et al.,
1988; 1989; Czéh and Somjen, 1990, Park et al., 2002). However, there is no direct
evidence showing the extracellular adenosine level during hypoxia, and efflux
pathways and origin of extracellular adenosine in response to hypoxia are unknown in
the spinal cord. In addition, the extracellular concentration of inosine is also expected
to show a considerable change because adenosine deaminase plays a significant role in
adenosine metabolism in the rat spinal cord (Golembiowska et al., 1995; 1996).

6
To investigate the effect of brief exposure to hypoxia on the accumulation of
adenosine and inosine in the spinal cord, we measured the extracellular concentration
of purines in isolated neonatal rat spinal cord preparations in which acute hypoxia
immediately resulted in adenosine A1 receptor-sensitive synaptic depression (Lloyd et
al., 1989).
Methods
Preparations
All experiments were approved by the Animal Care and Use Committee of the
Graduate School of Veterinary Medicine, Hokkaido University. All efforts were made
to minimize animal suffering and to reduce the number of animals used. Both male and
female neonatal rats (Wistar, 0-7 days old) were used.
Neonatal rats were killed by decapitation, and the spinal cords were isolated.
The composition of artificial cerebrospinal fluid (ACSF) was as follows (mM): NaCl
138; NaHCO3 21; NaH2PO4 0.6; CaCl2 1.25; KCl 3.5; MgCl2 2.0; glucose 10; gassed
with 95% O2 and 5% CO2; pH~7.3. Hypoxic ACSF was gassed with 95% N2 and 5%
CO2 (pH~7.3) at least 1 h before the experiments were started. The partial pressures of
O2 (pO2), measured with a dissolved oxygen meter (ISO2, World Precision Instruments,

7
USA), were 65.8±1.4 % (n=3) and 5.0±0.9 % (n=3) in normal and hypoxic ACSF,
respectively. Hypercapnic ACSF was prepared by gassing with 80% O2 and 20% CO2
(pH~6.7). For OGD, glucose was substituted by equimolar sucrose in the hypoxic
ACSF. For Ca2+-free ACSF, CaCl2 was removed and 1 mM EGTA was added.
Experimental protocols
The isolated spinal cord was cut into several pieces and equilibrated in ACSF for 1 h at
35°C. Then solution (1 ml) was changed every 10 min and the sample solution was
collected. In some experiments, tissues were treated with ACSF containing
fluoroacetate for 30 min or other drugs for 20 min before exposure to hypoxia or other
stimulants. The purine level in the presence of drugs was compared with that in its
absence in preparations obtained from littermates.
Measurement of purine concentration
Collected sample solutions (500 µl) were immediately chilled on ice, and 180 µl of 0.1
M citrate-phosphate buffer (pH 4.0) and 50 µl solution of 4 µM α,β-methylene ADP
(internal standard) were added. Then a 365 µl aliquot of the mixture was separated and
10 µl of 45% chloroacetaldehyde was added to it for the measurement of adenosine
8
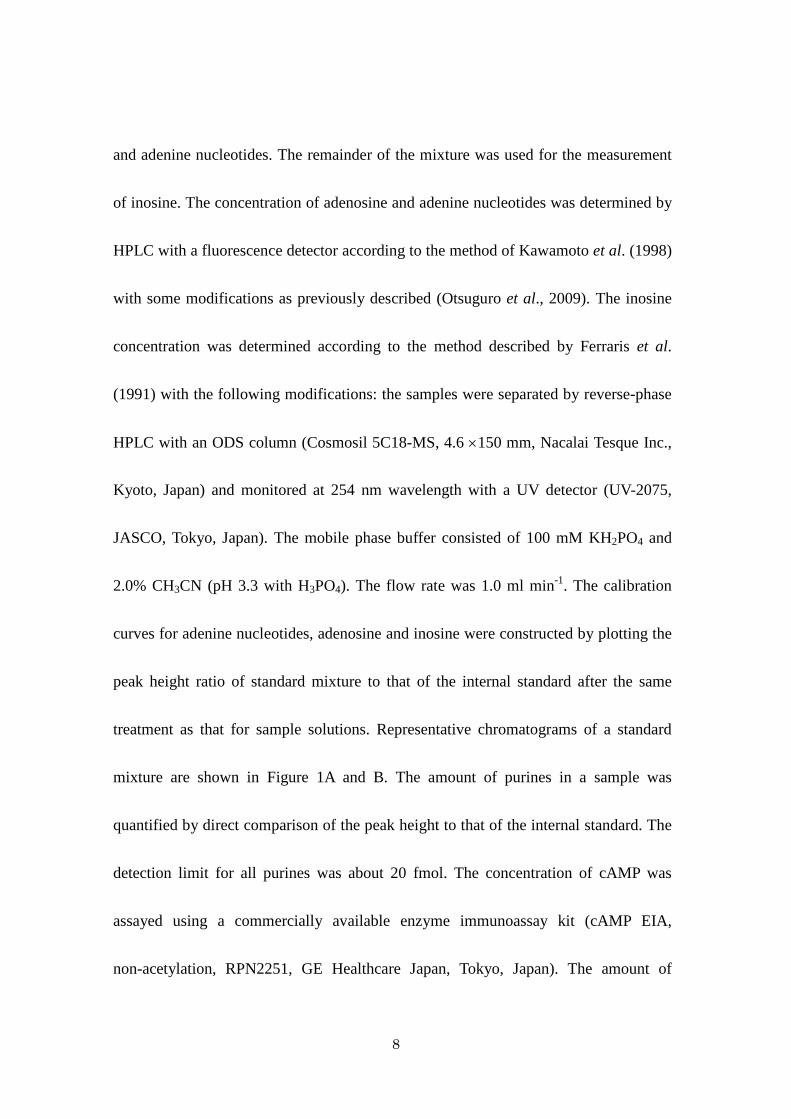
and adenine nucleotides. The remainder of the mixture was used for the measurement
of inosine. The concentration of adenosine and adenine nucleotides was determined by
HPLC with a fluorescence detector according to the method of Kawamoto et al. (1998)
with some modifications as previously described (Otsuguro et al., 2009). The inosine
concentration was determined according to the method described by Ferraris et al.
(1991) with the following modifications: the samples were separated by reverse-phase
HPLC with an ODS column (Cosmosil 5C18-MS, 4.6 ×150 mm, Nacalai Tesque Inc.,
Kyoto, Japan) and monitored at 254 nm wavelength with a UV detector (UV-2075,
JASCO, Tokyo, Japan). The mobile phase buffer consisted of 100 mM KH2PO4 and
2.0% CH3CN (pH 3.3 with H3PO4). The flow rate was 1.0 ml min-1. The calibration
curves for adenine nucleotides, adenosine and inosine were constructed by plotting the
peak height ratio of standard mixture to that of the internal standard after the same
treatment as that for sample solutions. Representative chromatograms of a standard
mixture are shown in Figure 1A and B. The amount of purines in a sample was
quantified by direct comparison of the peak height to that of the internal standard. The
detection limit for all purines was about 20 fmol. The concentration of cAMP was
assayed using a commercially available enzyme immunoassay kit (cAMP EIA,
non-acetylation, RPN2251, GE Healthcare Japan, Tokyo, Japan). The amount of

9
purines accumulated in 10 min was expressed as the extracellular amount per
milligram of tissue wet weight (pmol mg-1). The increments of adenosine and inosine
in response to the stimulants (i.e. hypoxia, OGD, hypercapnia or ABT-702) were
estimated by subtracting the resting release for preceding 10 min incubation without
stimulants from the stimulants-evoked release for 10 min, and were expressed as
∆adenosine and ∆inosine, respectively.
Data analysis
Results are expressed as mean±SEM (n=number of observations). Statistical
comparisons between two samples from the same preparation and between those from
littermates were performed by the paired and unpaired Student’s t-test, respectively.
For multiple comparisons, ANOVA following Dunnett’s test was used. A P value of
less than 0.05 was considered significant.
Drugs
ABT-702 dihydrochloride, arachidonic acid sodium salt (AA), brilliant blue G (BBG),
carbenoxolone disodium salt (CBX), guanosine 3’5’-cyclic monophosphate sodium
salt (cGMP), ARL 67156 trisodium salt, 1,3-dipropyl-8-(p-sulphophenyl)xanthine

10
(DPSPX), dipyridamole (DIP), S-(4-nitrobenzyl)-6-thioinosine (NBTI), α,β-methylene
ADP sodium salt, rolipram and (±)-sulfinepyrazone (SPZ) were purchased from Sigma
Chemical Co. (St. Louis, MO, USA). Erythro-9-(2-Hydroxy-3-nonyl) adenine
hydrochloride (EHNA) was from Tocris (Bristol, UK). Sodium fluoroacetate (FA) was
from Wako Pure Chemical Ind. (Osaka, Japan). All drugs were mixed in ACSF and
applied to preparations. Drug/molecular target nomenclature follows that
recommended by Alexander et al. (2009).
Results
The isolated spinal cord was incubated with normal ACSF under normoxic conditions
and the extracellular amounts of adenine nucleotides (ATP, ADP, AMP), adenosine and
inosine in the ACSF were measured using HPLC (Figure 1C and D). ATP and ADP
could not be detected. The level of inosine was approximately ten or more times higher
than the levels of adenosine and AMP. Brief (10 min) exposure of the isolated spinal
cord to hypoxic ACSF evoked a significant increase in the concentration of adenosine
and inosine but not AMP. ATP and ADP were not detected during hypoxia (Figure 2A).
The effect of oxygen-glucose deprivation (OGD) on the rat spinal cord was examined
because OGD has been reported to release adenine nucleotides in the rat cultured

11
forebrain astrocytes (Parkinson and Xiong, 2004) and hippocampal slices (Frenguelli
et al., 2007). OGD (10 min) evoked significant increases in adenosine and inosine but
not AMP in the rat spinal cord. ATP and ADP were not detected during OGD (Figure
2B). The effect of OGD (10 min) on the increase in purines was reversible for
adenosine (pre: 0.43±0.12 pmol mg-1, OGD: 1.28±0.18 pmol mg-1, P<0.01, post:
0.70±0.07 pmol mg-1, n=4) and inosine level (pre: 5.30±0.57 pmol mg-1, OGD:
17.69±2.73 pmol mg-1, P<0.01, post: 6.55±1.46 pmol mg-1, n=4) (P<0.01 versus pre,
Dunnett’s test).
The adenosine and inosine appearing in the ACSF in response to longer
exposure times of the spinal cord to hypoxic ACSF were also examined. The increases
in adenosine and inosine during hypoxia gradually declined, but they were
significantly larger than control throughout the exposure for 30 min (Figure 3). After
return to normoxia, the levels of these purines returned to baseline within 10 min.
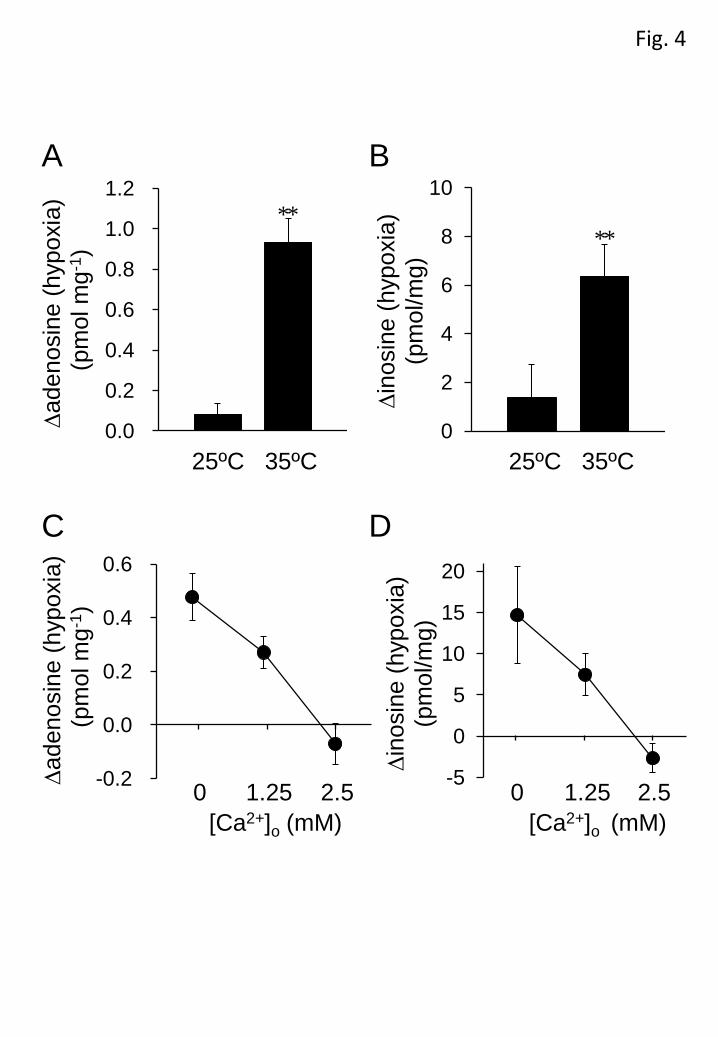
We next examined the dependency of the extracellular adenosine and inosine
increase on temperature and external Ca2+ concentration. The basal level of adenosine
in the ACSF at 25ºC (0.17±0.01 pmol mg-1, n=8, P<0.05, unpaired Student’s t-test) was
significantly lower than that at 35ºC (0.35±0.05 pmol mg-1, n=8), while there was no
significant difference in the basal level of inosine between 25ºC (5.13±1.20 pmol mg-1,

12
n=8) and 35ºC (6.39±0.54 pmol mg-1, n=8). The increase in adenosine and inosine in
response to hypoxic ACSF (10 min) was markedly lower at 25ºC than at 35ºC (Figures
4A and B). The hypoxia-evoked increases in adenosine and inosine were suppressed by
extracellular Ca2+ in a concentration-dependent manner and abolished by 2.5 mM Ca2+
(Figures 4C and D). The extracellular Ca2+ concentration used did not significantly
affect the basal levels of adenosine (0 mM Ca2+: 0.59±0.17 pmol mg-1, 1.25 mM Ca2+:
0.38±0.06 pmol mg-1, 2.5 mM Ca2+: 0.46±0.07 pmol mg-1, n=6) and inosine (0 mM
Ca2+: 12.29±2.65 pmol mg-1, 1.25 mM Ca2+: 15.95±1.51 pmol mg-1, 2.5 mM Ca2+:
12.07±1.33 pmol mg-1, n=6).
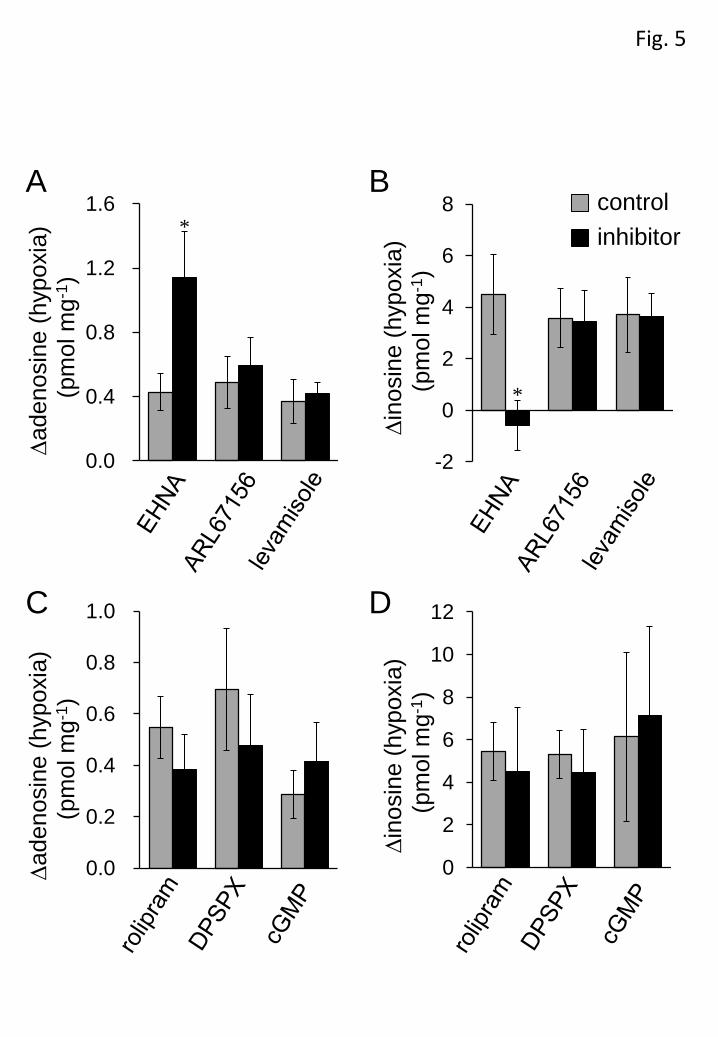
The contribution of the purine metabolic pathways to the hypoxia-evoked
increase in adenosine and inosine was investigated by using several inhibitors of
enzymes involved in these pathways. EHNA (10 µM), an inhibitor of adenosine
deaminase that prevents the conversion of adenosine to inosine, significantly increased
the basal adenosine level (control: 0.79±0.12 pmol mg-1 versus EHNA: 1.71±0.26
pmol mg-1, n=6, P<0.01, unpaired Student’s t-test) and decreased the basal inosine
level (EHNA: 6.66±1.06 pmol mg-1 versus control: 13.88±3.29 pmol mg-1, n=6,
P<0.05, unpaired Student’s t-test). In the presence of EHNA, the hypoxia (10
min)-evoked adenosine increase was significantly enhanced, while hypoxia failed to
13
increase inosine levels (Figures 5A and B), indicating that the increase in inosine was
largely due to the metabolism of adenosine by adenosine deaminase.
Extracellular adenosine is formed through the degradation of extracellular
ATP by a series of ecto-nucleotidases, including ecto-ATPase and ecto-alkaline
phosphatase. ARL67156 (100 µM) and levamisole (1 mM), respective inhibitors of
ecto-ATPase and alkaline phosphatase, did not affect the basal levels of adenosine
(ARL67156: 0.40±0.14 pmol mg-1 versus control: 0.37±0.09 pmol mg-1, n=6,
levamisole: 0.33±0.06 pmol mg-1 versus control: 0.42±0.05 pmol mg-1, n=5) and
inosine (ARL67156: 3.73±0.64 pmol mg-1 versus control: 4.47±1.12 pmol mg-1, n=6,
levamisole: 5.12±1.23 pmol mg-1 versus control: 5.37±1.51 pmol mg-1, n=5) or their
hypoxia (10 min)-evoked increase (Figures 5A and B). Extracellular adenosine is also
produced from extracellular cAMP degradation, which is initiated by
ecto-phosphodiesterase (PDE). PDE4 is a cAMP-specific and major PDE subtype in
the CNS (Jin et al., 1999; Nikulina et al., 2004). However, the PDE4 inhibitor rolipram
(100 µM), and the ecto-PDE inhibitors DPSPX (1 mM) and cGMP (1 mM), did not
show any significant effect on the hypoxia (10 min)-evoked increase in adenosine and
inosine (Figures 5C and D). To confirm the contribution of cAMP to purine
accumulation, we measured the extracellular level of cAMP. The level of cAMP was

14
very low and there was no significant difference in the cAMP level between normoxic
(4.16±0.41 fmol mg-1, n=4) and hypoxic (4.13±0.56 fmol mg-1, n=4) conditions for 10
min. These results suggest that extracellular degradation of ATP and cAMP does not
contribute to the accumulation of adenosine and inosine during hypoxia. Rolipram,
DPSPX and cGMP did not significantly affect the basal levels of adenosine (rolipram:
0.48±0.10 pmol mg-1 versus control: 0.52±0.11 pmol mg-1, n=8, DPSPX: 0.51±0.01
pmol mg-1 versus control: 0.63 pmol mg-1, n=6, cGMP: 0.33±0.04 pmol mg-1 versus
control: 0.39±0.05 pmol mg-1, n=6) and inosine (rolipram: 12.72±2.64 pmol mg-1
versus 14.47±1.48 pmol mg-1, n=8, DPSPX: 11.50±4.84 pmol mg-1 versus control:
11.94±3.33 pmol mg-1, n=6. cGMP: 8.24±1.58 pmol mg-1 versus control: 10.67±2.63
pmol mg-1, n=6). We also examined the effect of homocysteine thiolactone on the
accumulation of adenosine and inosine during hypoxia because it had been reported to
reduce the adenosine accumulation during OGD by trapping intracellular adenosine in
the rat hippocampus (Lloyd et al., 1993, Frenguelli et al., 2007). However,
homocysteine thiolactone had no effect on the hypoxia-evoked purine increase in the
spinal cord (data not shown).
To determine the possible pathways for the transport of purines across the
plasma membrane, the effects of inhibitors of several pathways were assessed. A
15
mixture of ENT inhibitors NBTI (5 µM) and DIP (10 µM), significantly increased the
basal level of adenosine (NBTI + DIP: 0.92±0.19 pmol mg-1 versus control: 0.72±0.18
pmol mg-1, n=8, P<0.05, unpaired Student’s t-test) but not that of inosine (NBTI +
DIP: 16.06±3.56 pmol mg-1 versus control: 15.20±2.73 pmol mg-1, n=8). On the other
hand, ENT inhibitors significantly suppressed the hypoxia (10 min)-evoked increase in
inosine but not adenosine (Figure 6). These results indicate that ENTs play important
roles in regulating extracellular adenosine concentration during normoxia and in the
efflux pathway of inosine during hypoxia, but not normoxia. As cAMP transporters and
channels with large conductance, such as gap junction channels, P2X7 receptors and
maxi-anion channels, are possible efflux pathways for adenine nucleotides (Darby et
al., 2003; Dutta et al., 2004; Suadicani et al., 2006; Kang et al., 2008; Liu et al., 2008;
Lin et al., 2008; El-Sheikh et al., 2008; Russel et al., 2008), the inhibitors of these
transporters and channels were examined. SPZ (2 mM), a cAMP transporter inhibitor,
CBX (100 µM), a gap junction channel inhibitor, BBG (5 µM), a P2X7 receptor
antagonist and AA (20 µM), a maxi-anion channel inhibitor, had no effect on the basal
levels of adenosine (SPZ: 0.70±0.06 pmol mg-1 versus control: 0.89±0.16 pmol mg-1,
n=6, CBX: 0.82±0.31 pmol mg-1 versus control: 0.89±0.28 pmol mg-1, n=6, BBG:
1.14±0.63 pmol mg-1 versus control: 0.93±0.54 pmol mg-1, n=6, AA: 0.28±0.09 pmol

16
mg-1 versus control: 0.29±0.09 pmol mg-1, n=6) and inosine (SPZ: 7.07±1.58 pmol
mg-1 versus control: 10.51±0.90 pmol mg-1, n=6, CBX: 4.91±0.65 pmol mg-1 versus
control: 6.58±2.17 pmol mg-1, n=6, BBG: 5.29±1.23 pmol mg-1 versus 4.59±1.14 pmol
mg-1, n=6, AA: 9.92±2.95 pmol mg-1 versus control: 10.78±3.60 pmol mg-1, n=6) or on
hypoxia (10 min)-evoked increases in these purines (Figure 6).
In rat cultured cortical astrocytes, the hypoxia-evoked adenosine release is
suppressed in the presence of a glial metabolic inhibitor (Martín et al., 2007). We
investigated the effect of FA, a glial metabolic inhibitor, on the hypoxia-evoked
increase in adenosine and inosine in the rat spinal cord. Although the application of FA
(5 mM) for 30 min did not affect the basal levels of adenosine and inosine, the
significant increase in adenosine and inosine during hypoxia disappeared in the
presence of FA (Figure 7). The increase in inosine seemed to be more sensitive to FA
than that of adenosine.
To confirm the effect of FA, the isolated spinal cords were pre-incubated with
5 mM FA for 30 min and then exposed to hypoxia or other stimulants for 10 min in the
presence of FA. The hypoxia-evoked increases in adenosine and inosine were
significantly suppressed by FA (Figure 8). OGD is reported to cause adenosine and
inosine release from both astrocytes and neurons (Parkinson and Xiong, 2004).
17
However, the exposure of OGD for 10 min increased the levels of adenosine and
inosine regardless of the presence or absence of FA. We have previously reported that
hypercapnia causes the release of adenosine by inhibiting the activity of adenosine
kinase in the rat spinal cord (Otsuguro et al., 2006; 2009). In the present study, we
found that the extracellular level of inosine was also increased by the exposure (10
min) of hypercapnia (20% CO2). ABT-702 (10 µM), an adenosine kinase inhibitor, also
evoked increase in adenosine and inosine (Figure 8). After the pre-incubation (30 min),
FA failed to suppress these purine increases in response to hypercapnia or ABT-702.
As ABT-702 increased not only adenosine but also inosine, the effect of
EHNA on the ABT-702-evoked increase in these purines was examined. EHNA (10
µM) markedly enhanced the ABT-702 (10 µM)-evoked increase in adenosine, but
abolished that in inosine (Figure 9).
Discussion and conclusions
In the present experiments, the accumulation of purines in the extracellular space
during hypoxia was studied in the rat spinal cord. Our results suggest that the increase
in extracellular adenosine concentration during hypoxia occurs through the release of
intracellular adenosine, and that astrocytes play a key role in the release of purines

18
from the rat spinal cord.
Extracellular ATP and cAMP can be sources of adenosine because of the
activity of ecto-enzymes such as ecto-ATPase, ecto-alkaline phosphatase and ecto-PDE
(Matsuoka and Ohkubo, 2004; Gödecke, 2008). However, brief exposure (<30 min) to
hypoxia and oxygen-glucose deprivation (OGD) have been shown to release adenosine
itself from rat cultured cortical astrocytes (Martín et al., 2007) and the hippocampus
(Frenguelli et al., 2007), respectively. Our data also suggest that hypoxia directly
releases adenosine itself in the rat spinal cord for the following reasons. Firstly,
increases in extracellular ATP and cAMP did not occur during hypoxia. Secondly, the
increase in adenosine was insensitive to the inhibitors of ecto-metabolic enzymes. In
cultured rat forebrain astrocytes, it has been reported that a 60 min exposure to OGD
releases adenine nucleotides into extracellular spaces, where they were then converted
to adenosine (Parkinson and Xiong, 2004). In the rat hippocampus, the ATP release
need longer exposures (>10 min) of OGD in the young animals (11-15 days old) than
the older ones (Frenguelli et al., 2007). It may be a reason why ATP release is not
observed in our experiments of neonatal rats (0-7 days old).
Our data show an inosine/adenosine ratio that is larger than the ratios
previously reported in the rat brain (Frenguelli et al., 2003; Parkinson and Xiong,

19
2004). EHNA, an adenosine deaminase inhibitor, enhanced both the basal and
hypoxia-evoked adenosine increase, while it decreased the basal inosine level and
abolished the evoked inosine increase. These results indicate that inosine is formed
from adenosine during hypoxia through the activity of adenosine deaminase. ABT-702,
an adenosine kinase inhibitor, increased not only adenosine but also inosine to the
same extent as hypoxia did. In addition, EHNA markedly enhances the
ABT-702-evoked increase in adenosine, while it abolished that in inosine, indicating
the rapid conversion from adenosine to inosine by adenosine deaminase. In the rat
hippocampus, the intracellular adenosine increase induced by energy depletion is
mainly regulated by adenosine deaminase (Lloyd and Fredholm, 1995). In the rat
spinal cord, it has been reported that coadministration of adenosine kinase and
adenosine deaminase inhibitors evoked a marked synergic release of adenosine,
suggesting that only a modest inhibition of adenosine kinase is required to recruit the
involvement of adenosine deaminase (Golembiowska et al., 1995). In the rat spinal
cord, it is likely that the activity of adenosine deaminase is high enough to play a key
role in regulating intracellular adenosine concentration, especially when adenosine
formation is increased.
The extracellular increases in adenosine and inosine during hypoxia were both

20
temperature dependent. In the rat hippocampus, a rise in temperature causes an
increase in intracellular adenosine concentration, and thus adenosine efflux from
tissues (Masino et al., 2001). The large increase in extracellular adenosine observed at
35°C in the present study could accelerate the formation of inosine. At 25°C, hypoxia
had little effect on adenosine and inosine accumulation, implying the involvement of
enzymatic processes in the release of purines and/or reduced demand for oxygen in
tissues at lower temperature.
The Ca2+ concentration in cerebrospinal fluid is approximately 1.25 mM
(Hunter and Smith, 1960), which was the Ca2+ concentration of the ACSF used in the
present study. The hypoxia-evoked adenosine and inosine increases were enhanced by
the removal of external Ca2+ and greatly inhibited by a high concentration (2.5 mM) of
Ca2+, indicating the involvement of non-exocytotic mechanisms. Similar phenomena
also occur in rat hippocampal slices (Dale et al., 2000) and cultured cortical astrocytes
(Martín et al., 2007). In addition, hypercapnia-evoked adenosine release is also
inhibited by Ca2+ (Otsuguro et al., 2006; 2009). These data emphasize the importance
of Ca2+ in the control of purine concentration under pathological conditions. Ca2+
probably acts by inhibiting the formation and /or release of purines in the CNS
including the spinal cord.

21
The ENT inhibitors blocked the hypoxia-evoked increase in inosine but not
adenosine, suggesting that ENT is a main pathway for inosine release during hypoxia.
FA, a glial metabolic inhibitor, abolished the increase in adenosine and inosine induced
by hypoxia, but not to suppress the increase in these purines by hypercapnia or
ABT-702. In the rat brain, fluorocitrate (FC), another glial metabolic inhibitor, also
abolished the hypoxia-evoked adenosine release (Martín et al., 2007). It seems likely
that adenosine is released by astrocytes. Alternatively, astrocytic activity may affect
purine release from other cells such as neurons, since astrocytes control neuronal
function under physiological and pathological conditions (Hansson and Rönnbäck,
2003; Hydon and Carmignoto, 2006; Rossi et al., 2007). On the other hand, it has been
reported that both astrocytes and neurons release adenosine during OGD (Parkinson
and Xiong, 2004). In our study, unlike hypoxia, OGD increased the purine level in
presence of FA. Therefore, OGD might recruit different mechanisms for purine release
triggered by hypoxia. Astrocytes have been also proposed to regulate basal adenosine
level (Pascual et al., 2005). However, the treatment of 5 mM FA for 30 min suppressed
the hypoxia-evoked release but not the basal level of purines. In the cultured astrocytes,
FC (1 mM, 1h) was shown to reduce the basal adenosine level (Martín et al. 2007). On
the other hand, the prolong treatment (>1h) of high concentration (20 mM) of FA has

22
been reported to increase adenosine release by itself (Canals et al., 2008). The effects
of glial metabolic inhibitors such as FA and FC on the basal purine release appear to
depend on the experimental conditions.
In conclusion, hypoxia induces the release of adenosine itself, which is
negatively modulated by Ca2+. Hypoxia also releases inosine, which is mainly
produced intracellularly and released through the activity of ENTs (Figure 10). The
concentration of extracellular inosine was markedly higher than that of adenosine
during normoxia and hypoxia. Astrocytic function plays an important role in purine
accumulation during hypoxia, but not during hypercapnia or OGD in the rat spinal
cord.
Acknowledgements
This work was supported by a Grant-in-Aid for Scientific Research from the Ministry
of Education, Science, Sports and Culture of Japan.
Conflict of interest
23
None.
References
Alexander SPH, Mathie A, Peters JA (2009). Guide to receptors and channels (GRAC),
4th edition. Br J Pharmacol 158; S1-S254.
Canals S, Larrosa B, Pintor J, Mena MA, Herreras O (2008). Metabolic challenge to
glia activates an adenosine-mediated safety mechanism that promotes neuronal
survival by delaying the onset of spreading depression waves. J Cereb Blood Flow
Metab 28: 1835-1844.
Chen P, Goldberg DE, Kolb B, Lanser M, Benowitz LI (2002). Inosine induces axonal
rewiring and improves behavioral outcome after stroke. Proc Natl Acad Sci USA 99:
9031-9036.
Cheshire WP, Santos CC, Massey EW, Howard JF Jr. (1996) Spinal cord infarction:
etiology and outcome. Neurology 47: 321-330.
Czéh G, Somjen GG. (1990) Hypoxic failure of synaptic transmission in the isolated
spinal cord, and the effects of divalent cations. Brain Res 527: 224-233.
Dale N, Pearson T, Frenguelli BG (2000). Direct measurement of adenosine release

24
during hypoxia in the CA1 region of the rat hippocampal slice. J Physiol 526:
143-155.
Darby M, Kuzmiski JB, Panenka W, Feighan D, MacVicar BA (2003). ATP released
from astrocytes during swelling activates chloride channels. J Neurophysiol 89:
1870-1877.
Dulla CG, Dobelis P, Pearson T, Frenguelli BG, Staley KJ, Masino SA (2005).
Adenosine and ATP link PCO2 to cortical excitability via pH. Neuron 48: 1011-1023.
Dutta AK, Sabirov RZ, Uramoto H, Okada Y (2004). Role of ATP-conductive anion
channel in ATP release from neonatal rat cardiomyocytes in ischaemic or hypoxic
conditions. J Physiol 559: 799-812.
El-Sheikh AA, van den Heuvel JJ, Koenderink JB, Russel FG (2008). Effect of
hypouricaemic and hyperuricaemic drugs on the renal urate efflux transporter,
multidrug resistance protein 4. Br J Pharmacol 155: 1066-1075.
Ferraris SP, Lew H, Elsayed NM (1991). Simultaneous determination of inosine,
hypoxanthine, xanthine, and uric acid and the effect of metal chelators. Anal
Biochem 195: 116-121.
Frenguelli BG, Llaudet E, Dale N (2003). High-resolution real-time recording with
microelectrode biosensors reveals novel aspects of adenosine release during

25
hypoxia in rat hippocampal slices. J Neurochem 86: 1506-1515.
Frenguelli BG, Wigmore G, Llaudet E, Dale N (2007). Temporal and mechanistic
dissociation of ATP and adenosine release during ischaemia in the mammalian
hippocampus. J Neurochem 101: 1400-1413.
Gödecke A (2008). cAMP: fuel for extracellular adenosine formation? Br J Pharmacol
153: 1087-1089.
Golembiowska K, White TD, Sawynok J (1995). Modulation of adenosine release
from rat spinal cord by adenosine deaminase and adenosine kinase inhibitors. Brain
Res 699: 315-320.
Golembiowska K, White TD, Sawynok J (1996). Adenosine kinase inhibitors augment
release of adenosine from spinal cord slices. Eur J Pharmacol 307: 157-162.
Hansson E, Rönnbäck L (2003). Glial neuronal signaling in the central nervous system.
FASEB J 17: 341-348.
Haun SE, Segeleon JE, Trapp VL, Clotz MA, Horrocks LA (1996). Inosine mediates
the protective effect of adenosine in rat astrocyte cultures subjected to combined
glucose-oxygen deprivation. J Neurochem 67: 2051-2059.
Hunter G, Smith HV (1960). Calcium and magnesium in human cerebrospinal fluid.
Nature 186: 161-162.

26
Haydon PG, Carmignoto G (2006). Astrocyte control of synaptic transmission and
neurovascular coupling. Physiol Rev 86: 1009-1031.
Jin SL, Richard FJ, Kuo WP, D'Ercole AJ, Conti M (1999). Impaired growth and
fertility of cAMP-specific phosphodiesterase PDE4D-deficient mice. Proc Natl
Acad Sci USA 96: 11998-12003.
Kawamoto Y, Shinozuka K, Kunitomo M, Haginaka J (1998). Determination of ATP
and its metabolites released from rat caudal artery by isocratic ion-pair
reversed-phase high-performance liquid chromatography. Anal Biochem 262: 33-38.
Kang J, Kang N, Lovatt D, Torres A, Zhao Z, Lin J, Nedergaard M (2008). Connexin
43 hemichannels are permeable to ATP. J Neurosci 28: 4702-4711.
Latini S, Pedata F (2001). Adenosine in the central nervous system: release
mechanisms and extracellular concentrations. J Neurochem 79: 463-484.
Liu HT, Sabirov RZ, Okada Y (2008). Oxygen-glucose deprivation induces ATP
release via maxi-anion channels in astrocytes. Purinergic Signal 4: 147-154.
Litsky ML, Hohl CM, Lucas JH, Jurkowitz MS (1999). Inosine and guanosine preserve
neuronal and glial cell viability in mouse spinal cord cultures during chemical
hypoxia. Brain Res 821: 426-432.
Lin JHC, Lou N, Kang N, Takano T, Hu F, Han X, Xu Q, Lovatt D, Torres A, Willecke

27
K, Yang J, Kang J, Nedergaard M (2008). A central role of connexin 43 in hypoxic
preconditioning. J Neurosci 28: 681-695.
Lloyd HGE, Spence I, Johnston GAR (1988). Involvement of adenosine in synaptic
depression induced by a brief period of hypoxia in isolated spinal cord of neonatal
rat. Brain Res 462: 391-395.
Lloyd HGE, Perkins A, Spence I (1989). Effect of magnesium on depression of the
monosynaptic reflex induced by 2-chloroadenosine or hypoxia in the isolated spinal
cord of neonatal rats. Neurosci Lett 101: 175-181.
Lloyd HGE, Lindström K, Fredholm BB (1993). Intracellular formation and release of
adenosine from rat hippocampal slices evoked by electrical stimulation or energy
depletion. Neurochem Int 23: 173-185.
Lloyd HGE, Fredholm BB (1995). Involvement of adenosine deaminase and adenosine
kinase in regulating extracellular adenosine concentration in rat hippocampal slices.
Neurochem Int 26: 387-395.
Masino SA, Latini S, Bordoni F, Pedata F, Dunwiddie TV (2001). Changes in
hippocampal adenosine efflux, ATP levels, and synaptic transmission induced by
increased temperature. Synapse 41: 58-64.
Martín ED, Fernández M, Perea G, Pascual O, Haydon PG, Araque A, Ceña V (2007).

28
Adenosine released by astrocytes contributes to hypoxia-induced modulation of
synaptic transmission. Glia 55: 36-45.
Matsuoka I, Ohkubo S (2004). ATP- and adenosine-mediated signaling in the central
nervous system: adenosine receptor activation by ATP through rapid and localized
generation of adenosine by ecto-nucleotidases. J Pharmacol Sci 94: 95-99.
Nikulina E, Tidwell JL, Dai HN, Bregman BS, Filbin MT (2004). The
phosphodiesterase inhibitor rolipram delivered after a spinal cord lesion promotes
axonal regeneration and functional recovery. Proc Natl Acad Sci USA 101:
8786-8790.
Otsuguro K, Yamaji Y, Ban M, Ohta T, Ito S (2006). Involvement of adenosine in
depression of synaptic transmission during hypercapnia in isolated spinal cord of
neonatal rats. J Physiol 574: 835-847.
Otsuguro K, Ban M, Ohta T, Ito S (2009). Roles of purines in synaptic modulation
evoked by hypercapnia in isolated spinal cord of neonatal rat in vitro. Br J
Pharmacol 156: 1167-1177.
Park YK, Jung SJ, Kwak J, Kim J (2002). Effect of hypoxia on excitatory transmission
in the rat substantia gelatinosa neurons. Biochem Biophys Res Commun 295:
929-936.

29
Parkinson FE, Xiong W (2004). Stimulus- and cell-type-specific release of purines in
cultured rat forebrain astrocytes and neurons. J Neurochem 88: 1305-1312.
Pascual O, Casper KB, Kubera C, Zhang J, Revilla-Sanchez R, Sul JY, Takano H,
Moss SJ, McCarthy K, Haydon PG (2005). Astrocytic purinergic signaling
coordinates synaptic networks. Science 310: 113-116.
Pearson T, Currie AJ, Etherington LAV, Gadalla AE, Damian K, Llaudet E, Dale N,
Frenguelli BG (2003). Plasticity of purine release during cerebral ischemia: clinical
implications? J Cell Mol Med 7: 362-375.
Pedata F, Melani A, Pugliese AM, Coppi E, Cipriani S, Traini C (2007). The role of
ATP and adenosine in the brain under normoxic and ischemic conditions. Purinergic
Signal 3: 299-310.
Rossi DJ, Brady JD, Mohr C (2007). Astrocyte metabolism and signaling during brain
ischemia. Nat Neurosci 10: 1377-1386.
Rowland JW, Hawryluk GWJ, Kwon B, Fehlings MG (2008). Current status of acute
spinal cord injury pathophysiology and emerging therapies: promise on the horizon.
Neurosurg Focus 25: E2.
Russel FG, Koenderink JB, Masereeuw R (2008). Multidrug resistance protein 4
(MRP4/ABCC4): a versatile efflux transporter for drugs and signalling molecules.
30
Trends Pharmacol Sci 29: 200-207.
Shen H, Chen GJ, Harvey BK, Bickford PC, Wang Y (2007). Inosine reduces ischemic
brain injury in rats. Stroke 36: 654-659.
Suadicani SO, Brosnan CF, Scemes E (2006). P2X7 receptors mediate ATP release and
amplification of astrocytic intercellular Ca2+ signaling. J Neurosci 26: 1378-1385.
Tator CH, Koyanagi I (1997) Vascular mechanisms in the pathophysiology of human
spinal cord injury. J Neurosurg 86: 483-492.
Waradas J (2002). Neuroprotective role of adenosine in the CNS. Pol J Pharmacol 54:
313-326.

31
Figure legends
Figure 1 Chromatograms of purines obtained by reverse-phase HPLC. A
standard mixture (2.0 pmol) of ATP, ADP, AMP and adenosine was injected with IS
(internal standard) after ethenopurine derivation and monitored with fluorescence
detector (A). A standard solution of inosine (2.0 pmol) was injected with IS and
monitored with UV detector (B). Sample solutions collected 10 min after incubation of
isolated spinal cord with normoxic or hypoxic ACSF were injected and monitored with
fluorescence detector (C) and UV detector (D). Superimposed chromatograms in
normoxia and hypoxia were normalized to the peak amplitude of IS.
Figure 2 Amount of extracellular purine during normoxia, hypoxia and
oxygen-glucose deprivation (OGD) in the rat spinal cord. The isolated spinal cords
were incubated in normal ACSF and then in hypoxic (A) or OGD ACSF (B) for 10 min
each. Each column and error bar represents the mean±SEM. (n=10-11). **P < 0.01
versus normoxia (paired Student’s t-test).
Figure 3 Time course of adenosine (A) and inosine increase (B) evoked by

32
hypoxia. ACSF was changed every 10 min. The isolated spinal cords were exposed to
hypoxic ACSF for 30 min (filled circle). Spinal cord preparations isolated from
littermates were used as controls without hypoxic exposure (open circle). Each column
and error bar represents the mean±SEM. (n=5-9) *P < 0.05 versus control at same time
point (unpaired Student’s t-test).
Figure 4 Effects of temperature and extracellular Ca2+ on adenosine and
inosine levels. The hypoxia-evoked increment in adenosine (A) and inosine (B) were
measured at 25 and 35°C. Each column and error bar represents the mean±SEM. (n=8)
**P < 0.01 versus at 25°C (unpaired Student’s t-test). The hypoxia-evoked increment
in adenosine (C) and inosine (D) in 0, 1.25 and 2.5 mM extracellular Ca2+ was
measured. Each symbol and error bar represents the mean±SEM. (n=6).
Figure 5 Effect of inhibitors of purine metabolic enzymes. The
hypoxia-evoked increment in adenosine (A and C) and inosine (B and D) was
measured in the presence (black columns) and absence (gray columns) of 10 µM
erythro-9-(2-hydroxy-3-nonyl)adenine (EHNA, n=6), 100 µM ARL67156 (n=6), 1
mM levamisole (n=5), 100 µM rolipram (n=8), 1 mM

33
1,3-dipropyl-8-(p-sulphophenyl)xanthine (DPSPX, n=6) and 1 mM cGMP (n=6). Each
column and error bar represents the mean±SEM. *P < 0.05, **P < 0.01 versus in the
absence of inhibitors (unpaired Student’s t-test).
Figure 6 Effect of inhibitors of the purine efflux pathway. The hypoxia-evoked
increment in adenosine (A) and inosine (B) was measured in the presence (black
columns) and absence (gray columns) of 5 µM S-(4-nitrobenzyl)-6-thioinosine (NBTI)
+ 10 µM dipyridamole (DIP, n=8), 2 mM sulfinepyrazone (SPZ, n=6), 100 µM
carbenoxolone (CBX, n=6), 5 µM brilliant blue G (BBG, n=6) and 20 µM arachidonic
acid (AA, n=6). Each column and error bar represents the mean±SEM. *P < 0.05, **P
< 0.01 versus in the absence of inhibitors (unpaired Student’s t-test).
Figure 7 Effect of a glial metabolic inhibitor on the amount of extracellular
adenosine (A) and inosine (B). ACSF was changed every 10 min and samples were
collected. The preparations were exposed to hypoxic ACSF for 40 min (filled circle).
Control preparations obtained from littermates were incubated in normal ACSF for 50
min (open circle). Fluoroacetate (FA, 5 mM) was applied to all preparations for 30 min.
Each column and error bar represents the mean±SEM. (n=4-8) *P < 0.05 versus

34
control at the same time point (unpaired Student’s t-test).
Figure 8 Effect of a glial metabolic inhibitor on the adenosine (A) and inosine
(B) increase caused by different stimulants. Preparations were pre-incubated with
fluoroacetate (FA) for 30 min. Then, in the presence (black columns) and absence
(grey columns) of FA, purine accumulation was induced by hypoxia (n=7-8),
oxygen-glucose deprivation (OGD, n=6), hypercapnia (n=8) or 10 µM ABT-702 (n=7).
Each column and error bar represents the mean±SEM. *P < 0.05 versus in the absence
of FA (unpaired Student’s t-test).
Figure 9 Effect of EHNA on purine accumulation by ABT-702. The ABT-702
(10 µM)-evoked increment in adenosine (A) and inosine (B) was measured in the
presence (black columns) and absence (gray columns) of 10 µM
erythro-9-(2-hydroxy-3-nonyl)adenine (EHNA). Each column and error bar represents
the mean±SEM. *P < 0.05 versus in the absence of EHNA (unpaired Student’s t-test).
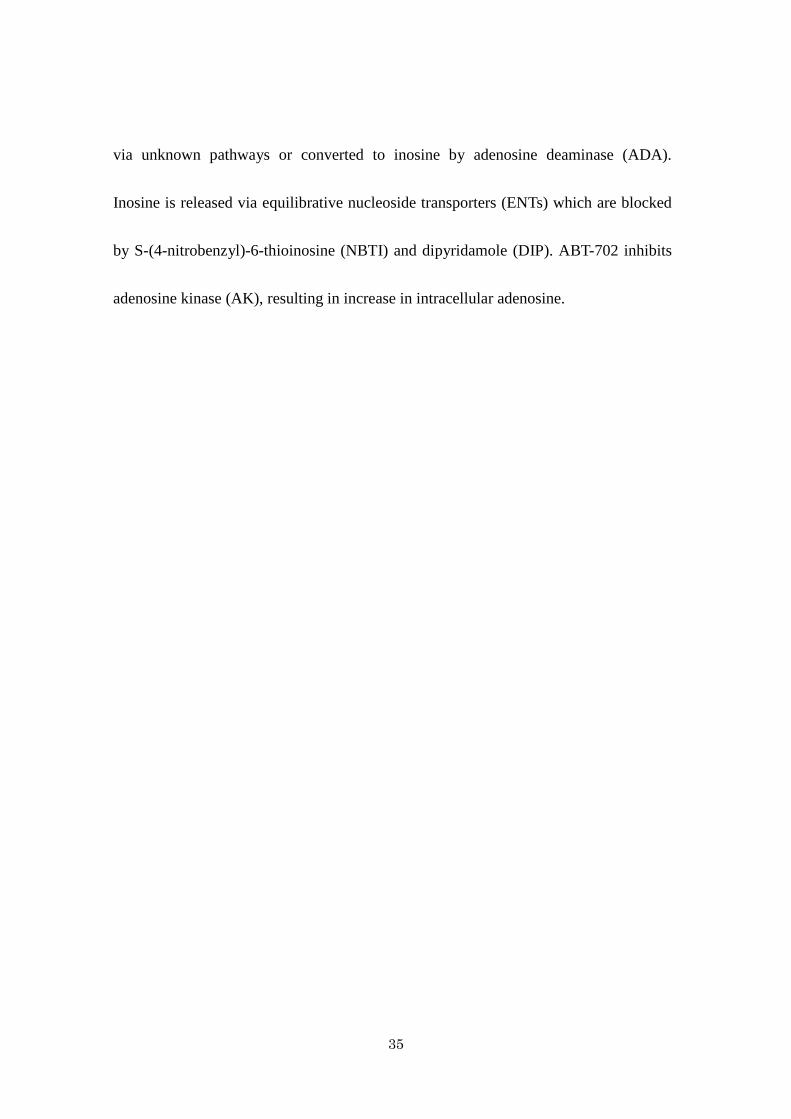
Figure 10 Schematic representation of adenosine and inosine production and
release in rat spinal cords. Hypoxia increases intracellular adenosine, which is released
35
via unknown pathways or converted to inosine by adenosine deaminase (ADA).
Inosine is released via equilibrative nucleoside transporters (ENTs) which are blocked
by S-(4-nitrobenzyl)-6-thioinosine (NBTI) and dipyridamole (DIP). ABT-702 inhibits
adenosine kinase (AK), resulting in increase in intracellular adenosine.

Fig. 1
20 4 6 8 10time (min)
ATP
ADPAMP adenosine
IS
0.1 mV
0 6
IS inosine
0.01 mV
A
B
42time (min)
6 7time (min)
2 4 6 8time (min)
C DIS
AMPadenosine
IS
inosine
hypoxia
normoxia
hypoxia
normoxia

0 5 10 15 20
0.0 0.5 1.0 1.5 2.0
ADP
adenosine
AMP
ATP Not Detected
inosine
purines
(pmol mg-1)
(pmol mg-1)
normoxiahypoxia
* *
Not Detected
* *
Fig. 2
0.0 0.5 1.0 1.5 2.0
A
B
ADP
adenosine
AMP
ATP Not Detected
Not Detected
* *
0 5 10 15 20 25
inosine * *
purines
(pmol mg-1)
(pmol mg-1)
normoxiaOGD

0
10
20
30
0
1
2 hypoxia
time (min)
aden
osin
e (p
mol
mg-
1 )in
osin
e (p
mol
mg-
1 )
Fig. 3
** *
hypoxia
* *
*
A
B
10 20 30 40 50 60 70time (min)
10 20 30 40 50 60 70
normoxiahypoxia
-0.2
0.0
0.2
0.4
0.6
-5
0
5
10
15
20
∆ade
nosi
ne (h
ypox
ia)
(pm
olm
g-1 )
∆ino
sine
(hyp
oxia
)(p
mol
/mg)
0 1.25 2.5 0 1.25 2.5[Ca2+]o (mM) [Ca2+]o (mM)
0.0
0.2
0.4
0.6
0.8
1.0
1.2
0
2
4
6
8
10
∆ade
nosi
ne (h
ypox
ia)
(pm
olm
g-1 )
∆ino
sine
(hyp
oxia
)(p
mol
/mg)
25ºC 35ºC 25ºC 35ºC
****
Fig. 4
A B
C D
∆ade
nosi
ne (h
ypox
ia)
(pm
olm
g-1 )
∆ade
nosi
ne (h
ypox
ia)
(pm
olm
g-1 )
-2
0
2
4
6
8
∆ino
sine
(hyp
oxia
)(p
mol
mg-
1 )∆i
nosi
ne(h
ypox
ia)
(pm
olm
g-1 )
*
*
Fig. 5
A B
C D
0.0
0.2
0.4
0.6
0.8
1.0
0
2
4
6
8
10
12
0.0
0.4
0.8
1.2
1.6 controlinhibitor

-6
-3
0
3
6
9
12
0.0
0.4
0.8
1.2
1.6
∆ade
nosi
ne (h
ypox
ia)
(pm
olm
g-1 )
∆ino
sine
(hyp
oxia
)(p
mol
mg-
1 )
*
Fig. 6
A
B
controlinhibitor

0
1
2
3
0
10
20
30
40
50
hypoxiaFA
aden
osin
e(p
mol
mg-
1 )in
osin
e (p
mol
mg-
1 )
10 20 30 40 50time (min)
**
*
hypoxiaFA
10 20 30 40 50time (min)
Fig. 7
A
B
normoxia + FAhypoxia + FA

-3
0
3
6
9
12
15
-0.3
0
0.3
0.6
0.9
1.2∆a
deno
sine
(pm
olm
g-1 )
∆ino
sine
(pm
olm
g-1 )
*
*
Fig. 8A
B
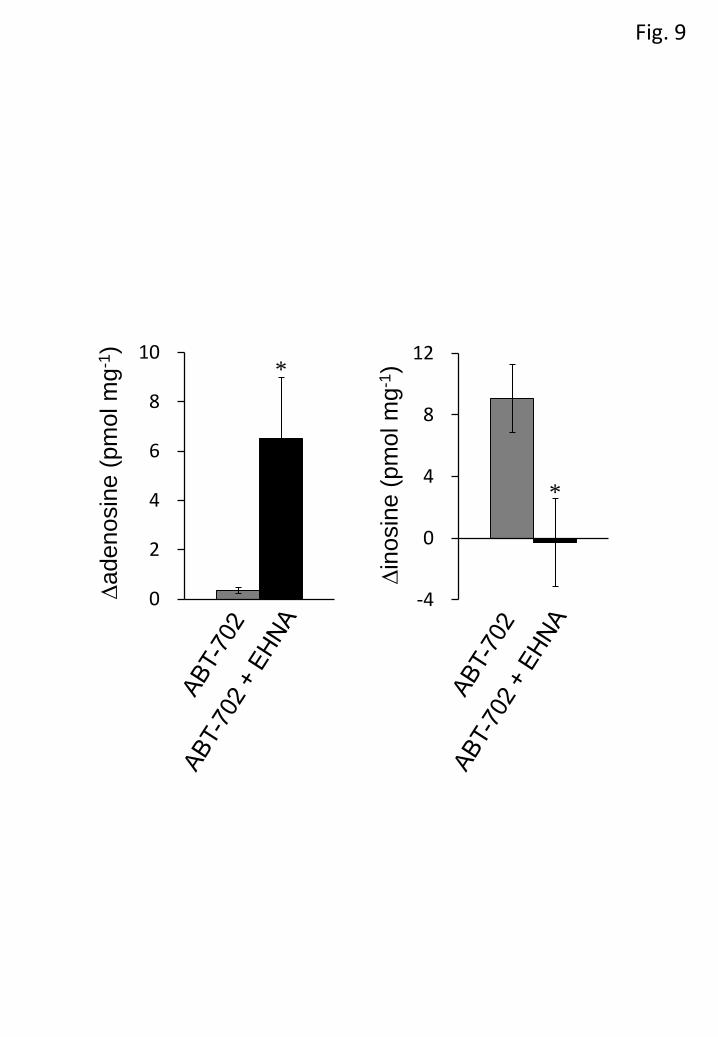
Fig. 9
0
2
4
6
8
10
-4
0
4
8
12
∆ade
nosi
ne (p
mol
mg-
1 )
∆ino
sine
(pm
olm
g-1 )*
*

Fig. 10
adenosine inosineADA
AMP
AK
ABT-702EHNA
ENTs
NBTI + DIP
hypoxia


