Download - Action Research Deployment Teams

Action Research Action Research Deployment TeamsDeployment Teams
May - 2007May - 2007
AgendaAgenda Strategic Plan/Plan on a PageStrategic Plan/Plan on a Page SIP RubricSIP Rubric SMART GoalsSMART Goals Team planning for continuous Team planning for continuous
improvementimprovement Workshop evaluation & Workshop evaluation &
planning for next yearplanning for next year


Random Acts of Improvement
School Direction
Goals and Measures
School Direction
Aligned Acts of Improvement
Goals and Measures

Hoover School Improvement Plan 2006-2007
Excellence for All
The mission of the Hoover community is to develop life-long learners and responsible citizens through continuous
improvement and excellence for all.
Customer Satisfaction Data-Driven Decisions
Learning for All Teamwork
Visionary Leadership
Reading Comprehension During the 2006-2007 school year the number of K-5 students at Hoover who improve their reading comprehension skills will increase by 5% in each grade level as measured by the District Benchmark Reading Assessments (LAPO & ERA). Math Computation During the 2006-2007 school year, the percentage of students scoring in the high and intermediate proficiency levels will increase in math computation at Hoover Elementary as measured by the district math assessments and the ITBS. Social, Emotional, Behavioral- School Climate During the 2006-2007 school year, Hoover students in grade 2-5 will increase their level of student respect based on the Hoover student satisfaction survey.
Continuous Improvement
VISION
HOOVER MISSION
CORE VALUES
HOOVER SCHOOL IMPROVEMENT GOALS
GUIDING PHILOSOPHY


(Your School Mission Statement Here)
(Your School SIP SMART Goals Here)

Pre Planning: Identification of Need1. Develop/Review Student Learning Expectations2. Examine alignment of learning expectations with assessments3. Review assessment data4. Identify areas of need based on assessment
Plan:1. Describe the current process for addressing the identified area of need
(flow chart) 2. Review data to determine baseline performance in the specific area
identified (Run Chart/Pareto Diagram)3. Identify potential root causes contributing to the identified area of need (Cause & Effect Diagram, 5 Why’s, Relations Diagram)4. Study research-based best practice/improvement theory addressing areas
of need
DO1. Plan for implementation of improvement theory (Force Field Analysis, Action Plan)2. Implement research-based best practices improvement theory based on root causes according to the Action Plan3. Monitor the implementation of research-based best practice/improvement theory to insure integrity and fidelity4. Assess student learning
Study:1. Examine student assessment results (compare to baseline)2. Assess the impact of research-based best practice/improvement theory on
student achievement
Act:1. Standardize the implementation of research-based best practice (improvement theory) that improved student learning (revise the flow chart to reflect changes made to the system)2. If improvement theory was unsuccessful continue the PDSA cycle (try another improvement theory based on the next identified root causes)
Action ResearchOverview
for Professional
Learning Communitie
s


Alignment & SMART GoalsAlignment & SMART Goals

What Are SMART GOALS?
SS pecific, strategic
MM easurable
AA ttainable
RR esults-oriented
TT ime-bound

Math sub-test 11th grade
Math subtest ITED NPR
Target 85% based on trend data
Proficient above 40th NPR
Fall 2008 ITED
By the fall of 2008, 85% of all 11th grade students will score above the 40th NPR on the ITED math subtest.

SMART GoalSMART Goal
By the fall of 2008, 85% of all 11th grade students will score above the 40th NPR on the ITED math subtest.

SMART GoalSMART Goal During the 2006-07 school year, SAMPLE During the 2006-07 school year, SAMPLE
school will increase students’ proficiency in school will increase students’ proficiency in vocabulary skills in the non-proficient student vocabulary skills in the non-proficient student subgroups as measured by the ITBS subgroups as measured by the ITBS vocabulary sub test assessment (See targets vocabulary sub test assessment (See targets below for each non-proficient sub group)below for each non-proficient sub group)
SubgroupSubgroup 05-06 Actual05-06 Actual 06-07 Target06-07 Target
African AmericanAfrican American 52.4%52.4% 55.4%55.4%
American IndianAmerican Indian 50%50% 53%53%
IEPIEP 0%0% 10%10%
Free & ReducedFree & Reduced 58.7%58.7% 64%64%

GOAL STATEMENT
SMART GOAL
INDICATORS
MEASURES
TARGETS
ACTION PLAN
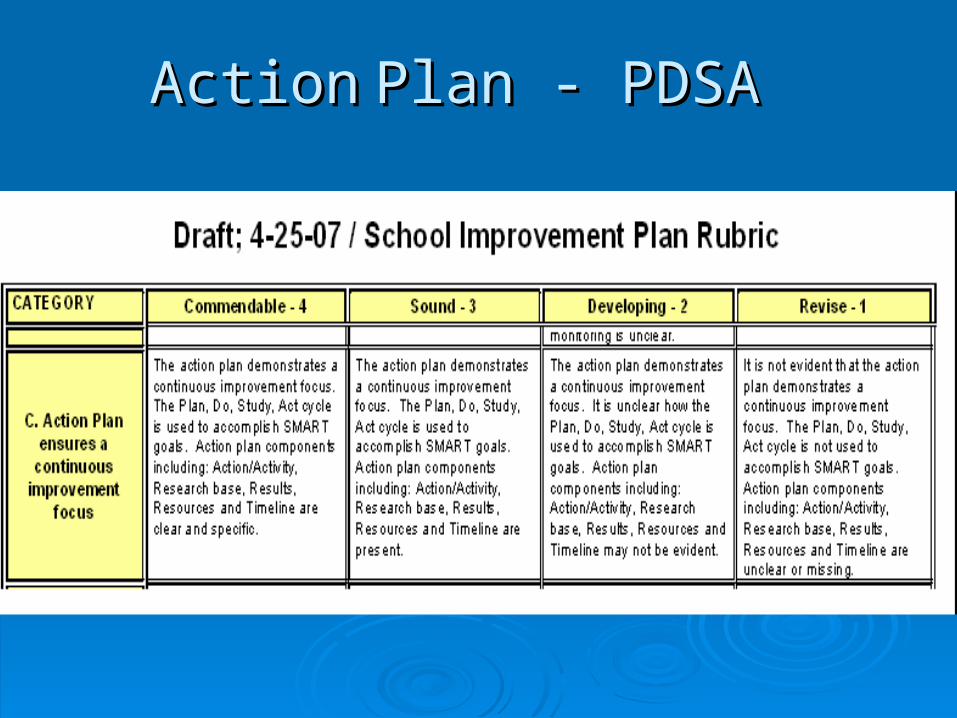
ActionAction Plan - PDSAPlan - PDSA

Pre Planning: Identification of Need1. Develop/Review Student Learning Expectations2. Examine alignment of learning expectations with assessments3. Review assessment data4. Identify areas of need based on assessment
Plan:1. Describe the current process for addressing the identified area of need
(flow chart) 2. Review data to determine baseline performance in the specific area
identified (Run Chart/Pareto Diagram)3. Identify potential root causes contributing to the identified area of need (Cause & Effect Diagram, 5 Why’s, Relations Diagram)4. Study research-based best practice/improvement theory addressing areas
of need
DO1. Plan for implementation of improvement theory (Force Field Analysis, Action Plan)2. Implement research-based best practices improvement theory based on root causes according to the Action Plan3. Monitor the implementation of research-based best practice/improvement theory to insure integrity and fidelity4. Assess student learning
Study:1. Examine student assessment results (compare to baseline)2. Assess the impact of research-based best practice/improvement theory on
student achievement
Act:1. Standardize the implementation of research-based best practice (improvement theory) that improved student learning (revise the flow chart to reflect changes made to the system)2. If improvement theory was unsuccessful continue the PDSA cycle (try another improvement theory based on the next identified root causes)
Action ResearchOverview
for Professional
Learning Communitie
s


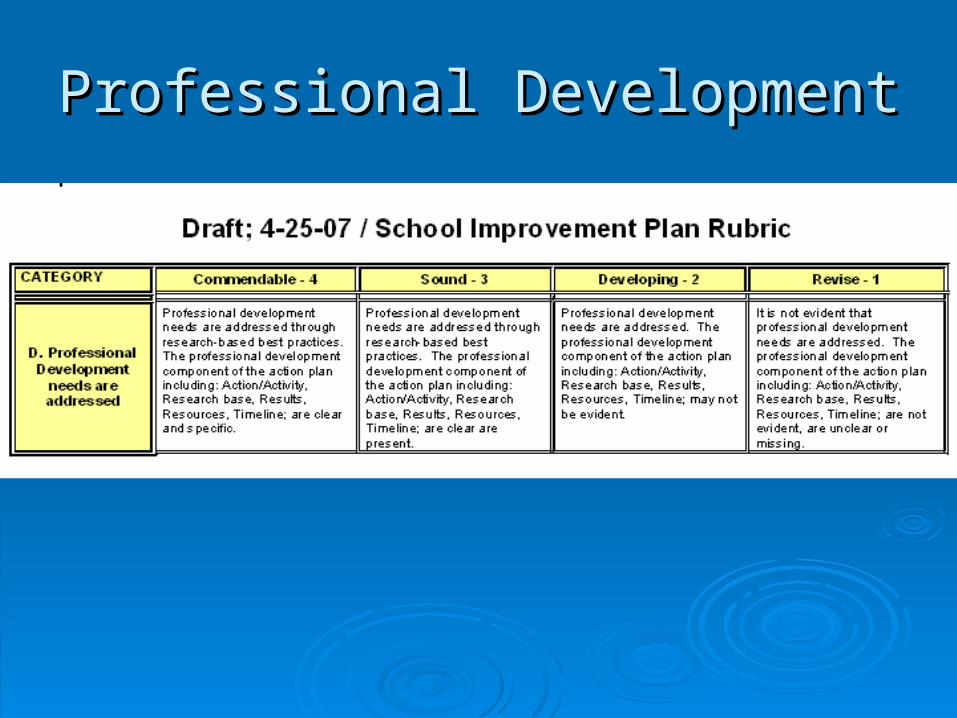
Professional DevelopmentProfessional Development


Team PlanningTeam PlanningUse the Use the
planning planning tooltool
Leave with a Leave with a plan!plan!

Thinking about PDSA this past Thinking about PDSA this past year… what’s in your “top 3”?year… what’s in your “top 3”?
Top 3 SuccessesTop 3 Successes Top 3 StrugglesTop 3 Struggles
What changes will be made to next year’s PDSA efforts?

Next steps…Next steps… SIPSIP
SMART goalsSMART goals PDSAPDSA Professional DevelopmentProfessional Development
Use the “Organizing and Planning for CI” Use the “Organizing and Planning for CI” tool to guide your planningtool to guide your planning
Update your SIP by June 30Update your SIP by June 30thth
Your school’s “plan on a page” draft with Your school’s “plan on a page” draft with your SIP June 30thyour SIP June 30th
Set and communicate direction!Set and communicate direction!
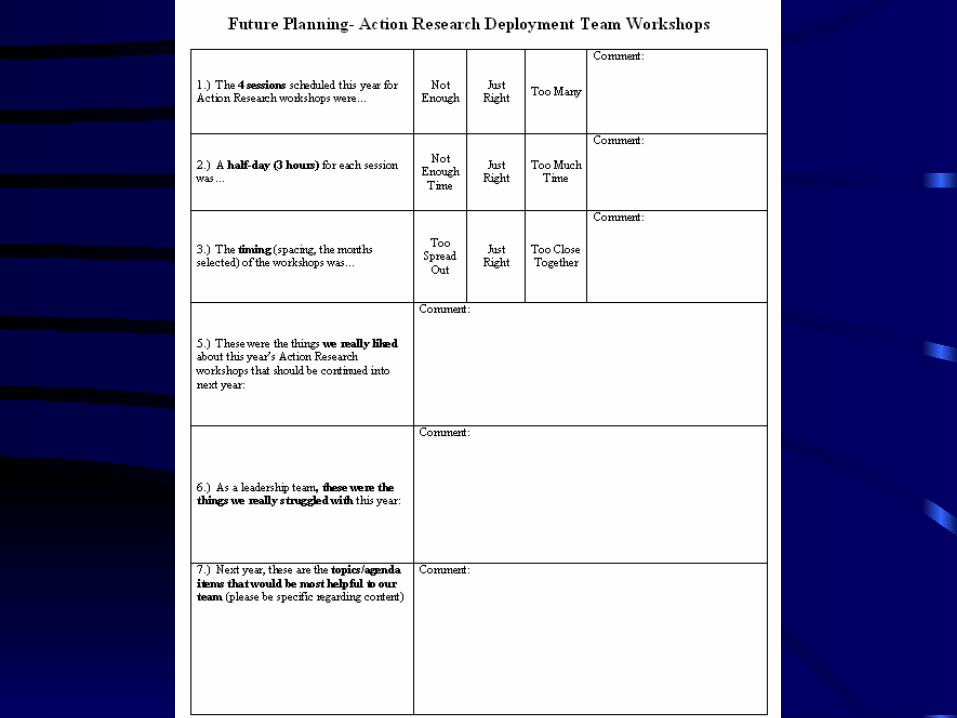
Please complete the evaluation for today’s sessionPlease complete the evaluation for today’s session


During the 2006-07 school year, non-proficient During the 2006-07 school year, non-proficient students (as indicated by the ITBS math students (as indicated by the ITBS math problem-solving subtest) at Sample school will problem-solving subtest) at Sample school will improve their math problem-solving skills as improve their math problem-solving skills as measured by an increase in the percentage of measured by an increase in the percentage of students scoring in the “high” and “proficient” students scoring in the “high” and “proficient” levels on the ITBS math problem –solving levels on the ITBS math problem –solving assessment. The 2006-07 performance target is assessment. The 2006-07 performance target is for 85% of Sample School students for score in for 85% of Sample School students for score in the “high and “proficient levels.the “high and “proficient levels.


