
ACTAMeeting of the
Governing Board
October 11, 2018
Alameda Corridor Transportation Authority

Item 4
MOW RFP Update

MOW RFP Update
RFP Date1. Release RFP Aug 15, 20182. Close of 1st Round of Written Questions Aug 29, 20183. Response to 1st Round of Written Questions Sep 4, 20184. Pre-Proposal Meeting Sep 5, 20185. Close of 2nd Round of Written Questions Sep 19, 20186. Response to 2nd Round of Written Questions Sep 24, 20187. Proposals Due Oct 3, 20188. Interviews * Oct 17, 20189. Close of 3rd Round of Written Questions Sep 27, 201810. Response to 3rd Round of Written Questions Oct 1, 2018 11. Complete Negotiations Nov 7, 201812. NMA Approval Issuance to Ports & Railroads Nov 14, 201813. Harbor Commission Approval by Early Jan 201914. Recommendation for ACTA Board Approval ** Feb 8, 201915. Agreement Begins Mar 1, 2019

Item 5
Federal Advocacy

Federal Advocacy RFP
January 16, 2018 RFP posted
February 21, 2018 proposal deadline – 3 proposal received
Review panel: 2 ACTA representatives and 1 representative each from POLA and POLB
March 19, 2018 interviews with the 3 firms in Washington DC
Recommendation: award of contract to Manatt, Phelps, & Phillips in the amount of $190,000 for 32 months through June 30, 2021 with 3-year optional extension with Board approval
At its April 2018 meeting, the Board requested more information concerning the legislative agenda

Item 6 & 7
Police & Security AmendmentDispatching Amendment
Police & Security AmendmentDispatching Amendment
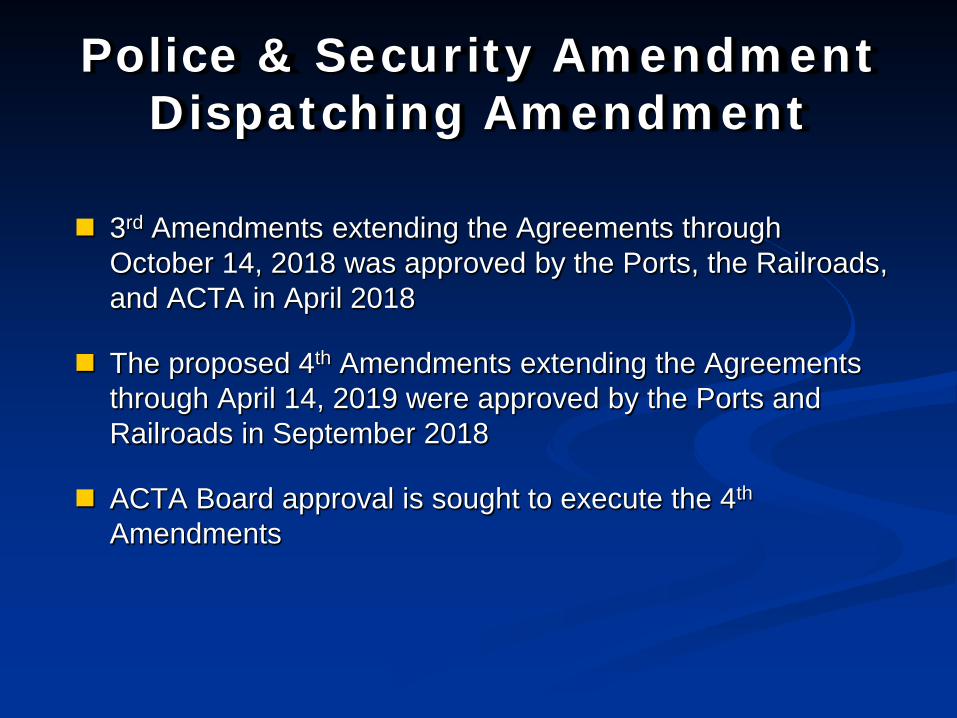
3rd Amendments extending the Agreements through October 14, 2018 was approved by the Ports, the Railroads, and ACTA in April 2018
The proposed 4th Amendments extending the Agreements through April 14, 2019 were approved by the Ports and Railroads in September 2018
ACTA Board approval is sought to execute the 4th
Amendments

Item 8
AEI Readers

AEI Readers
ACTA’s Automatic Equipment Identification (AEI) Reader System includes 3 dozen locations along the Corridor
The system tracks the movement of containers by the Railroads
This information is used by ACTA to confirm the accuracy of the self-assessed fees paid to ACTA by the Railroads
The Railroads use the AEI data at some locations for their own operational purposes
The Railroads requested an upgrade of modules to more securely communicate data via the internet vs. phone lines

AEI Readers The Railroads have agreed to share both the installation and
maintenance cost for the upgraded AEI Readers, which is advantageous to ACTA
Cost share is approximately 36% UPRR, 21% BNSF, and 43% ACTA The cost of the upgrade is approximately $250,000 to replace the
modules at 28 locations Comet Industries was part of the team that originally supplied the
ACTA system. Both Railroads use Comet’s equipment along their own track networks.
Using another vendor’s modules can result in the following:1. In some cases, the rest of the electronic equipment in addition to
the modules at each location would have to be replaced at a cost of about $670,000
2. In other cases, the use of a new module within the existing system could create warranty issues with little or no savings
Therefore for compatibility purposes it is recommended that a sole source procurement from Comet Industries be approved.

Item 9
PFM change to PFMFA

Item 10
Peregrine Falcon Habitat Relocation
(SR47 MOU)

Peregrine Falcon Habitat Relocation (SR47 MOU)
In January 2011, ACTA and POLA executed an MOU regarding the relocation of the peregrine nesting habitat on the Heim Bridge through January 31, 2016
The 1st Amendment was executed in October 2016, extending through August 31, 2018
The parties now wish to execute a new MOU effective September 1, 2018 to terminate the earlier of August 31, 2023 (5-years) or project completion including permanent relocation of the habitat

Item 11
SR47 ConstructionSupport Amendment No. 3
with Caltrans

SR47 Construction SupportAmendment No. 3 with Caltrans
In March 2015, ACTA executed Amendment No. 1 increase the amount not-to-exceed reimbursement amount from $3M to $4.3M
In September 2017, ACTA executed Amendment No. 2 increasing the amount from $4.3M to $5.3M
Authority is requested to execute Amendment No.3 increasing the amount from $5.3M to $6.9M

Item 12
Homeless Update

Alameda Corridor Transportation Authority
October 11, 2018 Board Meeting

BOARD OF SUPERVISORS’ MOTIONOn November 21, 2017, the Board directed the Chief Executive Officer, the Los Angeles Homeless Services Authority, and other critical stakeholders, to: • develop a plan with the Alameda Corridor
Transportation Authority to address the encampment issues along the Corridor,
• identify how the Countywide Outreach System and other strategies funded through Measure H can support outreach and housing efforts, and
• identify whether additional resources beyond currently allocated resources to support plan implementation
18

ALAMEDA CORRIDOR• The Alameda Corridor passes
through seven cities: Los Angeles, Carson, Compton, Lynwood, South Gate, Huntington Park, and Vernon.
• These cities are in the First, Second, and Fourth Supervisorial Districts, which go through Service Planning Areas (SPA) 6, 7, and 8.
19

STRATEGY E6 - HOMELESS OUTREACH• Designed to create an integrated
and cohesive street-based outreach system aimed at better identifying, assisting, and housing people experiencing homelessness
• Through expanded coordination, aims to strategically mobilize outreach teams to better serve Los Angeles County’s large unsheltered population
20

STRATEGY E6 - HOMELESS OUTREACHTo help protect your privacy, PowerPoint has blocked automatic download of this picture.
21

KEY OUTCOMES (NADEAU SITE)November 2017– September 2018
1 secured permanent housing
100
entered crisis, bridge, and interim housing 5
individuals (unduplicated) have been engaged by outreach teams and 16 have had CES assessments done
22

SHIFT IN HOMELESS POPULATION
Changes in population since Summer 2018
23

HOMELESS OUTREACH PLAN
The outreach and engagement plan going forward is as follows:• The Sheriff Department’s Homeless Outreach Services
Team (HOST) and LAHSA’s HOST Homeless Engagement Teams (HETs) to assess the current status of the Nadeau homeless encampment
• Based on the assessment by HOST and HET, a timeline for continued HOST/HET engagement will be developed
• Based on the progress of the HOST/HET efforts, a date will be identified to clean the ACTA property (ACTA will be responsible for funding the clean up efforts)
24

HOMELESS OUTREACH PLAN cont’d
• Conduct the clean-up and secure the site with the goal of the encampment not being re-established
• Outreach teams will conduct regular, ongoing visits to the area to engage with any homeless individuals in the area
• Outreach and engagement is most successful with repeated visits to engage and build trust with our homeless neighbors
25

KEY OUTCOMESNovember 2017– September 2018
10 secured permanent housing
100
entered crisis, bridge, and interim housing 25
individuals have been engaged by outreach teams
THANK YOU!
Homeless Initiative Kenneth Hahn Hall of Administration500 West Temple Street, Room 493
Los Angeles, CA [email protected]
http://homeless.lacounty.gov
26

Item 13
ACET FY18 Closeout CWOs

Item 14
Performance Update

9.3%
6.1%
12.7%
4.2%
-4.4%
-15.9%
15.7%
1.9%0.3%
3.0% 2.4%
-3.2%
3.4%5.4%
3.3%
-20.0%
-15.0%
-10.0%
-5.0%
0.0%
5.0%
10.0%
15.0%
20.0%
2004 2005 2006 2007 2008 2009 2010 2011 2012 2013 2014 2015 2016 2017 2018**
Gai
n/ L
oss
San Pedro Bay Ports Loaded Container TEU Volumes (yr/yr)
2003-2018
* San Pedro Bay Ports Loaded TEUs ** 2018 - CYD through August 2018
9.07M* 9.62M 10.84M 11.30M 11.06M 11.32M 10.97M 11.34M10.80M 9.08M 10.51M 10.71M 10.74M 12.15M est.11.95M

Port Container Throughput (TEUs) – Aug 2018
POLA POLB Combined
Aug-18 %Change* Aug-18 %Change* Aug-18 %Change*
Imports 420,573 -2.8% 343,029 -3.6% 763,602 -3.1%
Exports 162,466 2.1% 119,546 1.9% 282,012 2.0%
Total Loaded 583,039 -1.5% 462,575 -2.2% 1,045,614 -1.8%
Empty 243,600 -4.9% 216,968 -1.1% 460,568 -3.2%
Total 826,638 -2.5% 679,543 -1.9% 1,506,181 -2.2%
YTD %Change* YTD %Change* YTD %Change*
Imports 3,078,778 -0.5% 2,683,017 7.6% 5,761,795 3.1%
Exports 1,282,738 -1.1% 1,052,508 10.2% 2,335,246 3.7%
Total Loaded 4,361,516 -0.7% 3,735,525 8.3% 8,097,041 3.3%
Empty 1,607,825 -7.4% 1,585,406 12.0% 3,193,231 1.3%
Total 5,969,341 -2.6% 5,320,931 9.4% 11,290,272 2.7%
* Relative to same period in 2017

Performance ComparisonAugust ’18 vs. ’17, CY18 & FY19 Year to Date
Railroad Self-Assessment Revenue
’18 ’17 Change
Revenue $9.5 M $9.4 M 0.8 %
Calendar Year to Date $74.9 M $70.6 M 6.1 %
Fiscal Year to Date * $18.8 M $18.6 M 1.3 %
* Note: Does not include reconciliations / adjustments for fiscal year-end.
Operations
’18 ’17 Change
Trains (Daily) 1,219 (39.3) 1,189 (38.4) 2.5 %
Calendar Year to Date 9,295 (38.3) 8,938 (36.8) 4.0 %
Fiscal Year to Date 2,403 (38.8) 2,359 (38.0) 1.9 %

Performance Use Fees & Container ChargesAugust ‘18 vs. ‘17, CY18 & FY19 Year to Date
Operations – On Corridor (Use Fees)
’18 ’17 Change
TEU’s * 432,483 (7,886) 426,520 (7,777) 1.4 %
Calendar Year to Date 3,238,756 (7,533) 3,030,728 (7,050) 6.9 %
Fiscal Year to Date 854,819 (7,793) 841,903 (7,675) 1.5 %
Operations – Around Corridor (Container Charges)
’18 ’17 Change
TEU’s * 23,013 (420) 37,471 (683) - 38.6 %
Calendar Year to Date 213,081 (496) 284,124 (661) - 25.0 %
Fiscal Year to Date 47,524 (433) 69,440 (633) - 31.6 %
Operations – Combined
’18 ’17 Change
TEU’s * 455,496 (8,305) 463,990 (8,460) - 1.8 %
Calendar Year to Date 3,451,836 (8,029) 3,314,852 (7,710) 4.1 %
Fiscal Year to Date 902,343 (8,226) 911,343 (8,308) - 1.0 %
* Note: Numbers in ( ) are the Average Daily Containers, Daily TEU’s ÷ 1.77 = Containers.
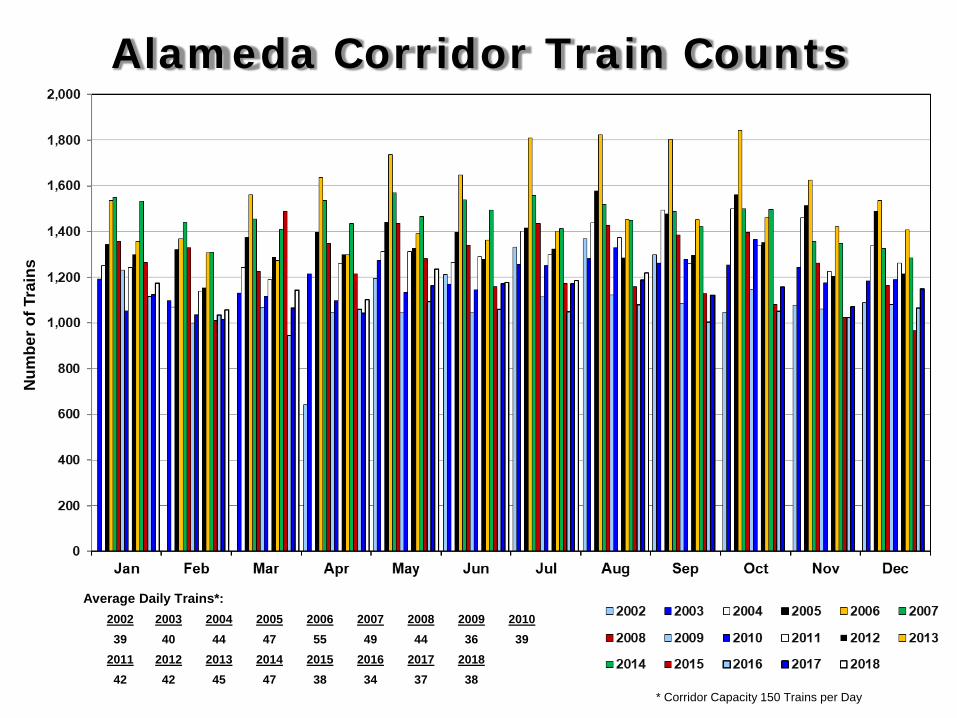
2002 2003 2004 2005 2006 2007 2008 2009 201039 40 44 47 55 49 44 36 39
2011 2012 2013 2014 2015 2016 2017 201842 42 45 47 38 34 37 38
Num
ber o
f Tra
ins
Alameda Corridor Train Counts
* Corridor Capacity 150 Trains per Day
Average Daily Trains*:

112.2
54.7 62.0 65.580.5
95.2 94.085.3 79.3
93.2 96.2 98.4107.8 104.1 102.5 101.3
109.6
18.80
20
40
60
80
100
120
FY03 FY04 FY05 FY06 FY07 FY08 FY09 FY10 FY11 FY12 FY13 FY14 FY15 FY16 FY17 FY18 FY19
Mill
ions
Fiscal Year
Use Fees & Container Chargesas of August 31, 2018
ActualBudget

ACTA Import Volume Loss
Port Imports IPI Trans Local
2014 7,787,274 2,959,070 2,276,321 2,551,833
100% 38.0% 29.3% 32.8%
2015 7,784,727 2,843,550 2,390,832 2,550,345
100 % 36.5 % 30.7 % 32.8 %
2014 / 15 Growth 0.0 % - 3.9 % 5.0 % 0.0 %
2016 7,987,323 2,657,908 2,652,075 2,677,340
100 % 33.3 % 33.2 % 33.5 %
2015 / 16 Growth 2.6 % - 6.5 % 10.9 % 5.0 %
2017 8,579,276 2,734,306 2,834,880 3,010,090
100% 31.9% 33.0% 35.1%
2016 / 17 Growth 7.4% 2.9% 6.9% 12.4%

LA/LB Import Rail VolumesTE
U’s
x10
00
% T
rans
load
ed
% Transloaded
Total Rail Volume
Intact Rail Volume
Transload Rail Volume

ACTA Percentage of the Ports’ Containerized Volume Imports Exports Loaded Empties Total
2004 41.8% 43.5% 42.2% 14.2% 33.6%
2005 40.3 47.4 42.0 17.6 34.2
2006 44.1 51.3 45.9 20.7 38.0
2007 42.3 51.0 45.0 16.3 36.8
2008 41.1 47.2 43.1 14.3 36.0
2009 37.9 49.0 41.6 9.9 34.2
2010 36.8 49.0 40.1 10.0 32.9
2011 38.6 48.8 42.0 10.6 34.6
2012 36.9 47.6 40.5 9.8 33.1
2013 37.3 47.5 40.6 9.7 33.1
2014 38.0 46.3 40.6 13.2 33.6
2015 36.5 43.8 38.6 15.6 32.0
2016 33.3 43.1 36.2 9.3 28.8
2017 31.9 43.9 35.3 10.4 28.0
‘06-’17 Change - 12.2 - 8.0 - 10.6 - 10.3 - 10.0
2018 33.4 45.6 37.1 8.3 29.1Source: Alameda Corridor Transportation Authority

-100.0
0.0
100.0
200.0
300.0
400.0
500.0
600.0
2017
2018
2019
2020
2021
2022
2023
2024
2025
2026
2027
2028
2029
2030
2031
2032
2033
2034
2035
2036
2037
2038
Debt Service Comparison
Before Refunding After Refunding Delta
4.75% Increase 5.75% Increase 7.75% Increase
$ in
Mill
ions
Fiscal Years
Debt Service Comparison
(with 1.75% Average CPI Increase)
ACTA projected revenue curves for 3, 4, & 6% port loaded container growth, plus 1.75% CPI fee increase.

Annual Performance Comparison
ACTA Revenue * Containers *(Containers = TEUs/1.75)
6.4% 7.9%
35.6
22.9
12.7
64.3
71.3
56.2
51.2
20.1
37.8
18.4
42.7
21.6
72.3
91.296.1
89.8
18.9
69.0
20.8
74.2
21.9
75.6
63.6
12.0
71.8
15.4
87.280
.013
.293.2
84.0
13.2
97.2
91.2
12.3
103.5
Millions
(1,53
8)(6
,627)
(1,85
1)(7
,213)
(1,89
9)(5
,712)(1,84
2)
(1,83
2)
(4,15
6)(2
,090)
(4,72
6)
(3,66
5)
(7,52
7)(1
,885)
1.43M
2.19M
2.49M
2.78M
3.44M 3.31M
2.99M
(949
)(5
,438)
2.33M (1,24
2)(6
,307)
2.76M
(1,04
3)(6
,810)
2.87M
(6,59
2)2.7
7M(9
66) (873
)(6
,931)
2.85M
Rev. 2-6-2018
Thousands
96.6
11.9108.5
(7,37
3)(8
22)
2.99M
92.1
10.2
102.4
(704
)(7
,233)
2.89M
88.8
99.2
10.4
(6,52
2)(7
06)
2.65M
95.9
105.6
9.6
(7,17
8)(6
39)2
.85M
Note: - #s in ( ) = Daily Average for Year- #s above line trucked around Corridor subject to Container Charge- #s below line travels on the Corridor subject to Use Fee
* Railroad Self Assessed


