
1
Achievement of Curriculum for Excellence
(CfE) Levels 2016/17
Experimental Statistics – Data under development
12th December 2017
These statistics are currently being developed and have been published to involve users and stakeholders in their development, and to build in quality and understanding at an early stage. The annual Achievement of Curriculum for Excellence (CfE) Levels Return includes data on all Primary 1, Primary 4, Primary 7 and Secondary 3 pupils in publicly funded mainstream schools, and all pupils based in publicly funded special schools/units. This return measures national performance in the literacy organisers (i.e. reading, writing, and listening and talking) and numeracy, and reports on the percentage of pupils who have achieved the expected CfE level, based on teacher professional judgements, relevant to their stage (please see section 1.2 for more detail on CfE levels). All figures are for Achievement of CfE Levels in reading, writing and listening and talking in the English language unless otherwise specified (Achievement of CfE Levels in Gàidhlig can be found in Chapter 8). The information was based on teacher professional judgements as at June 2017. This publication provides detailed analysis on national and local authority level results for each stage. These results are not directly comparable to Achievement of Curriculum for Excellence (CfE) Levels 2015/16 results as they continue to be data under development (see sections 1.5 and 1.6). Full results are available from http://www.gov.scot/stats/bulletins/01302
2
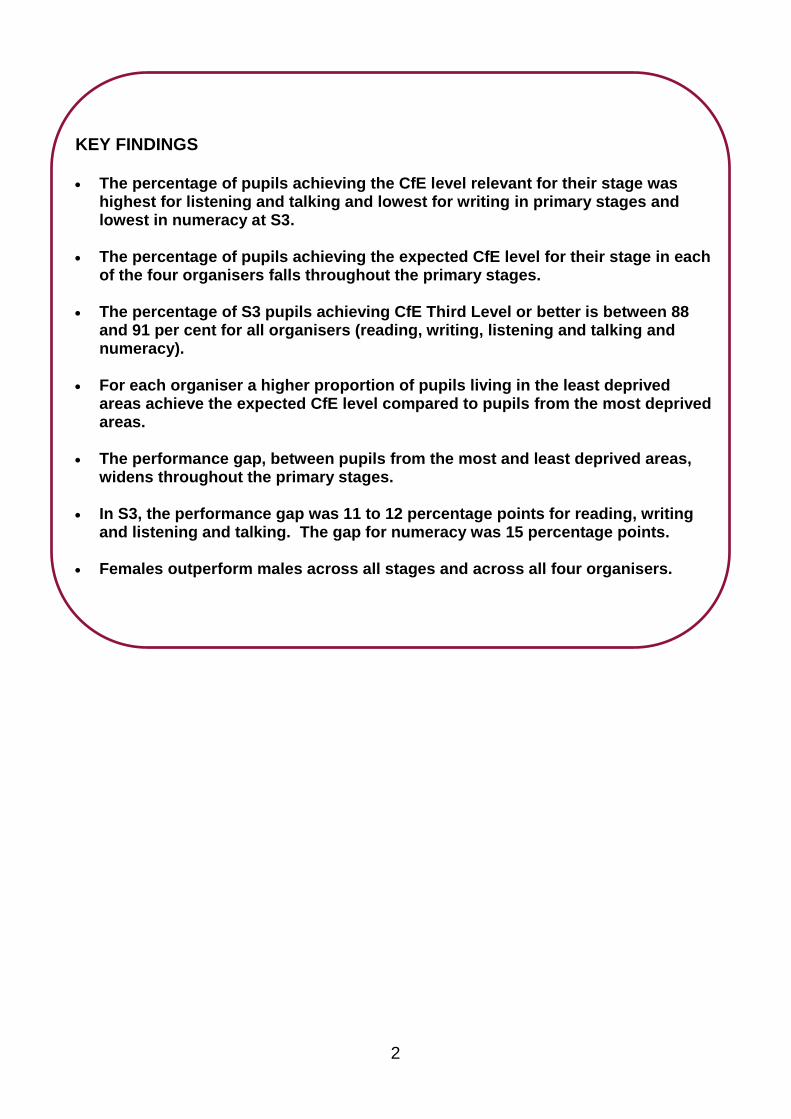
KEY FINDINGS The percentage of pupils achieving the CfE level relevant for their stage was
highest for listening and talking and lowest for writing in primary stages and lowest in numeracy at S3.
The percentage of pupils achieving the expected CfE level for their stage in each
of the four organisers falls throughout the primary stages. The percentage of S3 pupils achieving CfE Third Level or better is between 88
and 91 per cent for all organisers (reading, writing, listening and talking and numeracy).
For each organiser a higher proportion of pupils living in the least deprived
areas achieve the expected CfE level compared to pupils from the most deprived areas.
The performance gap, between pupils from the most and least deprived areas, widens throughout the primary stages.
In S3, the performance gap was 11 to 12 percentage points for reading, writing and listening and talking. The gap for numeracy was 15 percentage points.
Females outperform males across all stages and across all four organisers.

3
Chart 1.1: Percentage of primary pupils achieving expected CfE levels, 2016/17
The percentage of P1 pupils achieving Early Level:
80 per cent in reading
77 per cent in writing
85 per cent in listening and talking
83 per cent in numeracy The percentage of P4 pupils achieving First Level:
77 per cent in reading
71 per cent in writing
83 per cent in listening and talking
75 per cent in numeracy The percentage of P7 pupils achieving Second Level:
76 per cent in reading
69 per cent in writing
81 per cent in listening and talking
70 per cent in numeracy

4
Chart 1.2: Percentage of S3 pupils achieving Third Level or better and Fourth Level, 2016/17
The percentage of S3 pupils achieving Third Level or better:
90 per cent in reading
89 per cent in writing
91 per cent in listening and talking
88 per cent in numeracy The percentage of S3 pupils achieving Fourth Level:
51 per cent in reading
48 per cent in writing
51 per cent in listening and talking
56 per cent in numeracy

5
Contents
Achievement of Curriculum for Excellence (CfE) Levels 2016/17 ...................... 1
Chapter 1: Introduction .......................................................................................... 6
1.1 Achievement of CfE Levels Return .................................................................. 6
1.2 Curriculum for Excellence levels ..................................................................... 6
1.3 Gaelic Medium Education ................................................................................ 7
1.4 Pupils based in special schools/units .............................................................. 7
1.5 Experimental statistics ..................................................................................... 8
1.6 Quality assurance ............................................................................................ 8
1.7 Reporting of national data ............................................................................. 10
Chapter 2: Achievement of CfE levels by SIMD .................................................. 11
Chapter 3: Achievement of CfE levels by gender ................................................ 14
Chapter 4: Achievement of CfE levels by ethnicity .............................................. 16
Chapter 5: Achievement of CfE levels by Urban Rural Classification ................. 19
Chapter 6: Achievement of CfE levels by Additional Support Needs (ASN) status22
Chapter 7: Achievement of CfE levels by English as an Additional Language (EAL) status ......................................................................................................... 24
Chapter 8: Achievement of CfE levels in Gàidhlig ............................................... 26
Chapter 9: Achievement of CfE levels of pupils based in special schools/units .. 28
Chapter 10: Achievement of CfE levels by Local Authority ................................. 30
Chapter 11: Background notes ............................................................................ 36
11.1 Sources and coverage ................................................................................. 36
11.2 School level data ......................................................................................... 36
11.3 Supplementary tables .................................................................................. 37
11.4 Revisions Policy........................................................................................... 37
11.5 Further information on attainment ............................................................... 37

6
Chapter 1: Introduction
1.1 Achievement of CfE Levels Return
The data collated in the Achievement of Curriculum for Excellence (CfE) Levels Return relates to achievement in the Broad General Education (BGE). It is based on teacher professional judgements regarding pupils’ achievement in literacy and numeracy against CfE levels. The data was provided to the Scottish Government by all 32 local authorities and all grant-aided schools. The information included in this publication is the second set of Achievement of CfE Level data to be gathered and published under CfE. The data shows the CfE level achieved for each pupil within selected stages (P1, P4, P7 and S3 in mainstream schools and for all pupils based in standalone special schools/units) in the following curriculum organisers: reading, writing, listening and talking and numeracy, and relates to the CfE level achieved as at June 2017. A very small percentage of pupils have long term significant and complex additional support needs that mean that it is unlikely that they will progress through the CfE levels during their time in education. These pupils are recorded as ‘child following individual milestones’ and are included in the data. However, children for whom the teacher has been unable to make a professional judgement are not included; for example, if a pupil has recently moved to the school and the teacher feels there has been insufficient time for them to form a professional judgement of a pupil’s performance. Teacher professional judgements of achievement of a level are based on all of the evidence collected by teachers during the ongoing assessment of children and young people’s learning. A wide range of evidence is collected in a variety of ways. This includes observing learners at work, assessing their work in class and assessing children’s knowledge and understanding by talking to them about their learning.
1.2 Curriculum for Excellence levels
Curriculum for Excellence is designed to provide a coherent, more flexible and enriched curriculum for children and young people aged from 3 to 18. The curriculum includes the totality of experiences which are planned for children and young people through their education, wherever they are being educated. Curriculum for Excellence defines five levels of learning. The first four levels in the Broad General Education are described in the Experiences and Outcomes, with progression to qualifications described under a fifth level, the senior phase.
The path most children and young people are expected to follow through the levels reflects the stages of maturation of children and young people and the changing ways in which they engage with learning as they develop. Some children and young people will start learning at these levels earlier and others later, depending upon individual needs and aptitudes. The framework is however designed to be flexible in order to permit careful planning for those with additional support needs, including those who, for example, have a learning difficulty and those who are particularly high attaining.

7
CfE Level Stage
Early The final two years of early learning and childcare before a child goes to school and P1, or later for some.
First To the end of P4, but earlier or later for some.
Second To the end of P7, but earlier or later for some.
Third and Fourth
S1 to S3, but earlier or later for some. The Fourth Level broadly equates to Scottish Credit and Qualifications Framework Level 4. The Fourth Level experiences and outcomes are intended to provide possibilities for choice and young people's programmes will not include all of the Fourth Level outcomes.
Senior Phase S4 to S6, and college or other means of study.
1.3 Gaelic Medium Education
Pupils based in Gaelic Medium Primary Schools/classes will learn and develop their literacy and numeracy skills in both the medium of Gaelic and English. Pupils in Primary 1 Gaelic Medium Primary Schools will generally be immersed in developing their reading, writing, listening and talking and numeracy skills in the medium of Gaelic. From around Primary 3, children based in Gaelic Medium Primary Schools/classes will also start to develop their skills in reading, writing and listening and talking in the English language. It is expected that by the end of Primary 7, most children who have been based in Gaelic Medium Primary Schools/classes should be achieving Second Level in reading, writing, and listening and talking in both Gàidhlig and English. For pupils based in Gaelic Medium Primary Schools/classes, the following data has been collected and published for 2016/17:
P1 - Reading (Gàidhlig), Writing (Gàidhlig), Listening and Talking (Gàidhlig) only
P4 - Reading (Gàidhlig), Writing (Gàidhlig), Listening and Talking (Gàidhlig), numeracy only
P7 and S3 – Reading (Gàidhlig and English), Writing (Gàidhlig and English), Listening and Talking (Gàidhlig and English), Numeracy
1.4 Pupils based in special schools/units
Special schools/units cater for children of all ages. The information gathered as part of this return does not include a specific stage for these pupils (i.e. they are recorded as being a pupil based in a special school/unit). Therefore, it is not possible to calculate the percentage of pupils who have achieved the CfE level relevant to their stage. The data reported shows the overall picture of CfE levels that have been achieved for the pupils based in special schools/units. These data are not included in the headline figures; they are reported in Chapter 9.

8
1.5 Experimental statistics
Experimental statistics are Official Statistics that are undergoing development. They are defined in the Code of Practice for Official Statistics as: 'new Official Statistics undergoing evaluation that are published in order to involve users and stakeholders in their development as a means to build in quality at an early stage'. Principle 4, Practice 5 of the Code instructs producers to release experimental statistics to achieve continuous improvement in statistical processes; Protocol 1, Practice 5 states that producers should 'involve users in the evaluation of experimental statistics'. There is an emphasis across the Government Statistical Service (GSS) to consult users during the review of statistics, and to make experimental series available during this period to assist in the quality assurance, development and familiarisation of the statistics. The Code of Practice for Official Statistics promotes and supports the release of experimental statistics to involve users in their development at an early stage; however, it is likely that the statistics will not be fully compliant in all areas due to their nature as ‘data being developed’. The Scottish Government releases experimental statistics to engage with users and understand their needs as part of compliance with Principle 1 of the Code. The statistics may also be released to help develop methods and improvements in quality under Principle 4 of the Code, and it is important that these developments are fully discussed alongside the statistics. The statistics should always be supported by appropriate guidance and commentary to inform users about their strengths and weaknesses, particularly in relation to use under Principle 8 of the Code (Frankness and Accessibility). The reason for these statistics being classed as experimental statistics is because they are based on a new and developing data source. As such time is required: a. To receive informed feedback from users and potential users of the statistics; b. For users to become familiar with the new statistics and methodology.
1.6 Quality assurance
The collection of these data reflects a developing approach within schools to the assessment of children’s progress against CfE levels. It is therefore important to consider whether and how this affects the quality, reliability and usability of the data. As part of the quality assurance process, feedback was sought from all data suppliers (local authorities and grant-aided schools) on the process of compiling the data and on factors which may affect data quality. The majority of data providers provided substantive feedback covering the assessment process followed by schools, their own quality assurance of the data and whether they had any outstanding concerns over the quality of the data. Of the data providers that submitted information on data quality, one in three stated that they had no outstanding concerns. Around two in five data providers reported greater levels of confidence in data quality compared to 2015/16 (attributed to more familiarity with benchmarks and better QA processes), and around one in four stated that future work was planned, particularly around further development of moderation activity.

9
A few data providers indicated that, consistent with this data collection being new and in development, there was evidence some practitioners had underestimated pupil performance. Based on this information, caution must be applied in interpreting the results in this publication and the published school level data. In particular, comparisons between authorities or between schools should not be made without consideration of the context of the authority or school and the underlying approach to assessment. For special schools/units, around 17 per cent of pupils were recorded as ‘not assessed’ (Code 99). It has been reported that some pupils were recorded as ‘not assessed’ when these pupils are in fact working towards national qualifications and out of scope of this collection on Broad General Education performance. Further work is required to estimate the extent of this issue. There has been an improved level of coverage for special schools/units compared to 2015/16. In 2015/16 there were data returns for approximately 70 per cent of pupils, compared to approximately 95 per cent for 2016/17. Another improvement in this year’s collection was the inclusion of S3 pupils expected CfE level in reading, writing and listening and talking in Gàidhlig. This was not collected in 2015/16 but has been for 2016/17 to bring it in line with the other English literacy organisers. At a national level, there has been a notable change in the percentage of pupils reported as achieving Fourth Level in S3. This was 10 percentage points higher than 2015/16 for the literacy organisers and around seven percentage points for numeracy, compared to 2015/16. This is not unexpected in line with feedback from local authorities on their quality assurance procedures and increase in moderation activities. The expected standards under CfE were embedded in the experiences and outcomes from the outset, however it was clear that further clarity was required. As a result, Education Scotland published draft Curriculum for Excellence Benchmarks for literacy and numeracy in August 2016 in order to provide a more explicit and clear statement of standards. These standards were available to teachers ahead of the data collection for 2016/17. A new national programme of Quality Assurance and Moderation has been put in place to provide more support and improve confidence and understanding amongst teachers, and in August 2017, Scottish National Standardised Assessments were made available for teachers to help inform their judgements. This is expected to have an impact on the consistency of data in future years. In 2016/17 there has been more guidance available, more moderation completed by local authorities, a full school year to assess pupils and an increased coverage in this collection for Gaelic Medium schools/classes and special schools/units, that should all have contributed to ongoing improvement in the data quality. Achievement of Curriculum for Excellence (CfE) Levels 2016/17 results continue to be data under development and are not directly comparable to Achievement of Curriculum for Excellence (CfE) Levels 2015/16 results.

10
1.7 Reporting of national data
Chapters 2-7 (national results) and Chapter 10 (local authority results):
includes all assessed P1, P4, P7 and S3 pupils attending mainstream schools (including one grant-aided school)
excludes pupils attending special schools/units
excludes English Medium literacy results for P1 and P4 pupils in Gaelic Medium schools/classes (this data not collected; pupils will be learning in the Gaelic language)
includes English Medium literacy results for all assessed P7 and S3 pupils in Gaelic Medium schools/classes
includes numeracy results for all assessed P4, P7 and S3 pupils in Gaelic Medium schools/classes .
Chapter 8 – Achievement of CfE levels in Gàidhlig include Gaelic Medium literacy results for P1, P4, P7 and S3 pupils in Gaelic Medium Schools/classes.
Chapter 9 – Achievement of CfE levels of pupils based in special schools/units includes results for all pupils (aged 3 -18) based in special schools/units.

11
Chapter 2: Achievement of CfE levels by SIMD
Pupils from the least deprived areas performed better than pupils from the most
deprived areas at all stages, in all four organisers of reading, writing, listening and talking and numeracy.
Within Primary schools, the largest gap was at P7 in writing (22 percentage points); with the smallest gap at P1 in listening and talking (12 percentage points).
At S3, the largest gap was in numeracy performance at 15 percentage points.
Across all stages, the percentage of pupils achieving the expected CfE level increased as the level of deprivation decreased. Chart 2.1 shows that the smallest performance gaps were reported for S3, where the gap between least and most deprived pupils achieving Third Level or better was 11 percentage points for reading and listening and talking; 12 for writing and 15 for numeracy. The largest performance gap was reported for P7 pupils, with the largest in writing at 22 percentage points.
Chart 2.1: Percentage of pupils achieving expected CfE levels, by SIMD1, 2016/17
1 Scottish Index of Multiple Deprivation 2016

12
Table 2.1: Percentage of P1 pupils achieving Early Level by SIMD, 2016/17
SIMD Reading Writing Listening &
Talking Numeracy
SIMD Quintile 1 - Most Deprived 73 70 81 78
SIMD Quintile 2 77 74 83 81
SIMD Quintile 3 81 78 86 84
SIMD Quintile 4 86 82 89 87
SIMD Quintile 5 - Least Deprived 90 88 93 92
Unknown2 61 58 68 65
Total 80 77 85 83
Table 2.2: Percentage of P4 pupils achieving First Level by SIMD, 2016/17
SIMD Reading Writing Listening &
Talking Numeracy
SIMD Quintile 1 - Most Deprived 68 62 77 67
SIMD Quintile 2 73 66 80 71
SIMD Quintile 3 77 72 83 75
SIMD Quintile 4 83 78 88 80
SIMD Quintile 5 - Least Deprived 87 83 91 85
Unknown3 65 58 70 62
Total 77 71 83 75
Table 2.3: Percentage of P7 pupils achieving Second Level by SIMD, 2016/17
SIMD Reading Writing Listening &
Talking Numeracy
SIMD Quintile 1 - Most Deprived 67 59 73 62
SIMD Quintile 2 71 63 77 65
SIMD Quintile 3 76 69 83 71
SIMD Quintile 4 81 74 86 75
SIMD Quintile 5 - Least Deprived 87 81 90 82
Unknown4 61 52 66 56
Total 76 69 81 70
2 Unable to match 4.0% of P1 pupils to SIMD datazone.
3 Unable to match 3.8% of P4 pupils to SIMD datazone.
4 Unable to match 2.4% of P7 pupils to SIMD datazone.

13
Table 2.4: Percentage of S3 pupils achieving Third Level or better by SIMD, 2016/17
SIMD Reading Writing Listening &
Talking Numeracy
SIMD Quintile 1 - Most Deprived 85 83 86 81
SIMD Quintile 2 88 86 89 85
SIMD Quintile 3 90 89 91 90
SIMD Quintile 4 93 92 94 92
SIMD Quintile 5 - Least Deprived 96 95 96 95
Unknown5 79 79 79 76
Total 90 89 91 88
Table 2.5: Percentage of S3 pupils achieving Fourth Level by SIMD, 2016/17
SIMD Reading Writing Listening &
Talking Numeracy
SIMD Quintile 1 - Most Deprived 37 34 37 39
SIMD Quintile 2 43 40 43 47
SIMD Quintile 3 52 49 53 59
SIMD Quintile 4 59 56 59 65
SIMD Quintile 5 - Least Deprived 69 66 69 74
Unknown6 34 31 34 36
Total 51 48 51 56
5 Unable to match 2.1% of S3 pupils to SIMD datazone.
6 Unable to match 2.1% of S3 pupils to SIMD datazone.

14
Chapter 3: Achievement of CfE levels by gender
A higher percentage of females are achieving the expected CfE level compared to males across all stages and organisers.
The difference between the percentage of males and females that achieved the expected CfE level was largest in writing and smallest in numeracy, at all stages.
At all stages and across all four organisers, females outperformed males; particularly in writing. The largest difference between the percentage of males and females achieving the relevant level in writing was in P7 at 14 percentage points, with the lowest in S3 at eight percentage points. The smallest difference in performance between genders was in numeracy. Females outperformed males but by a smaller margin; three percentage points in P1 and S3 and two percentage points in P4 and P7. With respect to S3 pupils achieving Fourth Level, the difference between genders was greatest, but the pattern was still the same in that the smallest difference was in numeracy and the largest was in writing. Table 3.1: Percentage of primary pupils achieving expected CfE levels by gender, 2016/17
Stage Gender Reading Writing Listening &
Talking Numeracy
P1 (Early Level
Females 83 81 89 85
Males 77 73 82 82
Total 80 77 85 83
P4 (First Level)
Females 80 77 87 76
Males 73 65 79 74
Total 77 71 83 75
P7 (Second Level)
Females 80 76 85 71
Males 72 62 77 69
Total 76 69 81 70
15
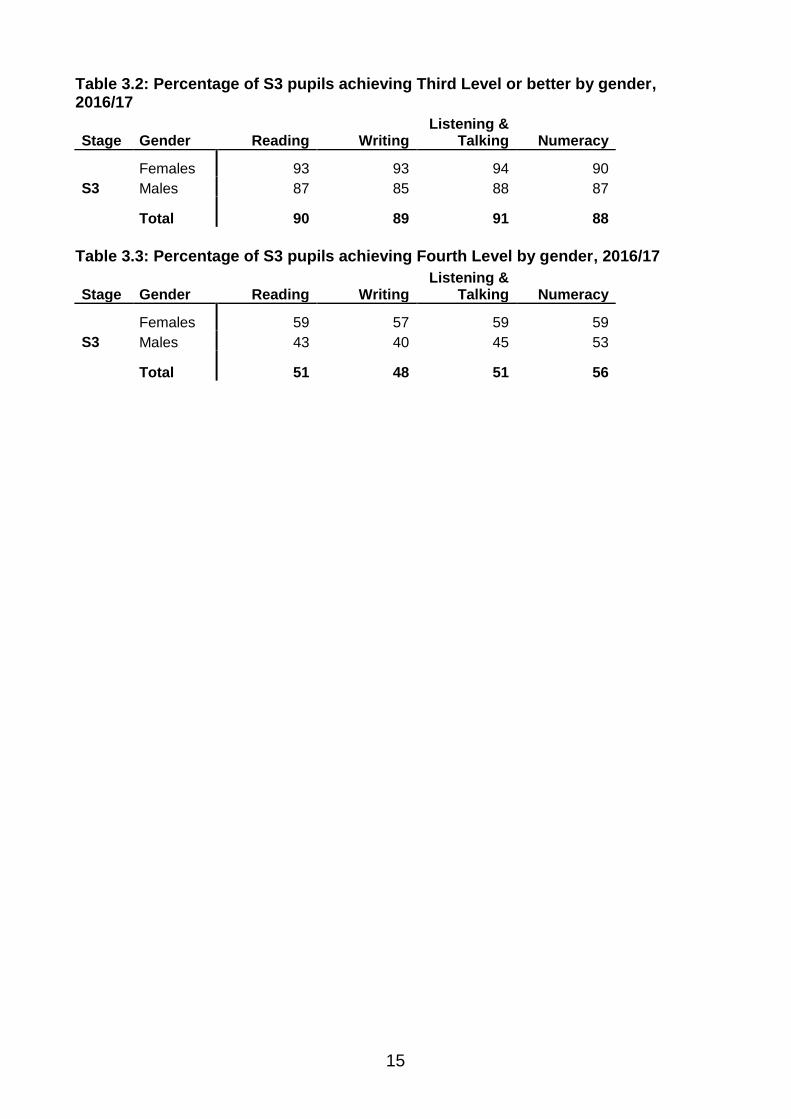
Table 3.2: Percentage of S3 pupils achieving Third Level or better by gender, 2016/17
Stage Gender Reading Writing Listening &
Talking Numeracy
Females 93 93 94 90
S3 Males 87 85 88 87
Total 90 89 91 88
Table 3.3: Percentage of S3 pupils achieving Fourth Level by gender, 2016/17
Stage Gender Reading Writing Listening &
Talking Numeracy
Females 59 57 59 59
S3 Males 43 40 45 53
Total 51 48 51 56

16
Chapter 4: Achievement of CfE levels by ethnicity
Generally, a lower percentage of pupils of White – Non Scottish and Other Ethnicity backgrounds are achieving the expected CfE level compared to other pupils particularly from P4 onwards in the literacy organisers.
A higher percentage of pupils of Asian – Chinese ethnic background are achieving the expected CfE level in numeracy compared to all other ethnic backgrounds.
The highest percentage of pupils that achieved the expected CfE level in numeracy was for pupils of an Asian – Chinese background, with results of 89 per cent for all primary stages and 99 per cent for S3. The lowest literacy performance at P1 was reported for pupils of Asian – Pakistani and of Other Ethnicity backgrounds. This changed for P4, P7 and S3 where pupils from Other Ethnicity backgrounds and White – Non Scottish pupils saw the lowest percentages achieving the expected level for their stage. Table 4.1: Percentage of P1 pupils achieving Early Level by ethnicity, 2016/17
Ethnicity Reading Writing Listening &
Talking Numeracy
White - Scottish 82 79 87 85
White - Non Scottish 79 76 82 83
Mixed or multiple ethnic groups 85 82 88 88
Asian - Indian 87 86 88 86
Asian - Pakistani 71 68 74 74
Asian - Chinese 82 81 80 89
Asian - Other 76 75 78 83
African / Black / Caribbean 82 79 84 85
All other categories 71 65 71 76
Not Disclosed / Unknown7 69 67 76 74
Total 80 77 85 83
7 Ethnicity not disclosed, unknown or unable to match to Pupil Census 2016 for 8.1% of P1 pupils.

17
Table 4.2: Percentage of P4 pupils achieving First Level by ethnicity, 2016/17
Ethnicity Reading Writing Listening &
Talking Numeracy
White - Scottish 78 72 84 75
White - Non Scottish 75 69 81 75
Mixed or multiple ethnic groups 85 82 86 82
Asian - Indian 85 80 87 82
Asian - Pakistani 77 72 83 74
Asian - Chinese 85 84 87 89
Asian - Other 76 72 82 77
African / Black / Caribbean 79 73 84 76
All other categories 61 54 65 63
Not Disclosed / Unknown8 66 60 73 64
Total 77 71 83 75
Table 4.3: Percentage of P7 pupils achieving Second Level by ethnicity, 2016/17
Ethnicity Reading Writing Listening &
Talking Numeracy
White - Scottish 77 69 82 71
White - Non Scottish 73 66 78 70
Mixed or multiple ethnic groups 82 76 86 76
Asian - Indian 87 81 88 85
Asian - Pakistani 81 75 83 75
Asian - Chinese 85 80 84 89
Asian - Other 77 70 85 75
African / Black / Caribbean 82 77 85 77
All other categories 61 55 65 65
Not Disclosed / Unknown9 64 55 69 59
Total 76 69 81 70
Table 4.4: Percentage of S3 pupils achieving Third Level or better by ethnicity, 2016/17
Ethnicity Reading Writing Listening &
Talking Numeracy
White - Scottish 91 89 91 88
White - Non Scottish 88 86 88 88
Mixed or multiple ethnic groups 92 91 92 92
Asian - Indian 91 91 94 94
Asian - Pakistani 92 91 93 90
Asian - Chinese 95 95 96 99
Asian - Other 92 90 92 94
African / Black / Caribbean 91 89 91 92
All other categories 76 75 78 85
Not Disclosed / Unknown10
80 79 80 78
Total 90 89 91 88
8 Ethnicity not disclosed, unknown or unable to match to Pupil Census 2016 for 5.3% of P4 pupils.
9 Ethnicity not disclosed, unknown or unable to match to Pupil Census 2016 for 3.5% of P7 pupils.
10 Ethnicity not disclosed, unknown or unable to match to Pupil Census 2016 for 2.9% of S3 pupils.

18
Table 4.5: Percentage of S3 pupils achieving Fourth Level by ethnicity, 2016/17
Ethnicity Reading Writing Listening &
Talking Numeracy
White - Scottish 51 49 52 56
White - Non Scottish 51 49 51 57
Mixed or multiple ethnic groups 60 56 57 64
Asian - Indian 64 63 63 73
Asian - Pakistani 51 47 50 61
Asian - Chinese 70 69 69 86
Asian - Other 57 59 57 71
African / Black / Caribbean 48 45 51 57
All other categories 43 42 44 52
Not Disclosed / Unknown11
35 33 36 38
Total 51 48 51 56
11
Ethnicity not disclosed, unknown or unable to match to Pupil Census 2016 for 2.9% of S3 pupils.

19
Chapter 5: Achievement of CfE levels by Urban Rural Classification
The percentage of P1 and P4 pupils that achieved the expected level for their stage was highest for pupils living in accessible rural areas. Performance was highest for P7 pupils from large urban and accessible rural areas.
Performance tended to be lower for pupils from remote small towns (and remote rural areas in the case of some P4 pupils).
The percentage of P1 pupils achieving the expected level for their stage was highest for pupils from accessible rural areas and lowest for pupils from remote small towns, for all four organisers. The percentage of P4 pupils achieving the level was highest for pupils from accessible rural areas; performance was lowest for pupils from remote small towns and remote rural areas. Performance at P7 tended to be highest for pupils from large urban areas and accessible rural areas; whereas a lower percentage of pupils from remote small towns achieved the level in each organiser. The percentage of S3 pupils achieving Third Level or better was generally high across most categories for all organisers (88 – 92 per cent), apart from pupils from remote small towns where there was slightly lower performance (e.g. 82 per cent for numeracy). Table 5.1: Percentage of P1 pupils achieving Early Level by Urban Rural
Classification12
, 2016/17
Urban Rural Classification Reading Writing Listening &
Talking Numeracy
Large urban areas 81 78 87 85
Other urban areas 80 77 85 84
Accessible small towns 82 78 86 84
Remote small towns 75 73 81 79
Accessible rural areas 85 82 89 87
Remote rural areas 78 75 82 79
Unknown13
61 58 68 65
Total 80 77 85 83
12
Urban Rural Classification
13 Unable to match 4.0% of P1 pupils to Urban Rural Classification.

20
Table 5.2: Percentage of P4 pupils achieving First Level by Urban Rural Classification, 2016/17
Urban Rural Classification Reading Writing Listening &
Talking Numeracy
Large urban areas 79 73 85 77
Other urban areas 76 70 82 74
Accessible small towns 77 71 83 76
Remote small towns 75 68 82 70
Accessible rural areas 80 74 86 77
Remote rural areas 75 68 81 71
Unknown14
65 58 70 62
Total 77 71 83 75
Table 5.3: Percentage of P7 pupils achieving Second Level by Urban Rural Classification, 2016/17
Reading Writing Listening &
Talking Numeracy
Large urban areas 78 71 83 74
Other urban areas 75 68 81 69
Accessible small towns 77 69 83 71
Remote small towns 69 59 75 62
Accessible rural areas 78 71 84 73
Remote rural areas 73 64 78 66
Unknown15
61 52 66 56
Total 76 69 81 70
Table 5.4: Percentage of S3 pupils achieving Third Level or better by Urban Rural Classification, 2016/17
Urban Rural Classification Reading Writing Listening &
Talking Numeracy
Large urban areas 90 88 91 88
Other urban areas 91 89 91 89
Accessible small towns 91 90 92 88
Remote small towns 86 85 88 82
Accessible rural areas 91 90 92 91
Remote rural areas 91 90 92 88
Unknown16
79 79 79 76
Total 90 89 91 88
14
Unable to match 3.8% of P4 pupils to Urban Rural Classification.
15 Unable to match 2.4% of P7 pupils to Urban Rural Classification.
16 Unable to match 2.1% of S3 pupils to Urban Rural Classification.

21
Table 5.5: Percentage of S3 pupils achieving Fourth Level by Urban Rural Classification, 2016/17
Urban Rural Classification Reading Writing Listening &
Talking Numeracy
Large urban areas 51 49 52 55
Other urban areas 51 48 51 56
Accessible small towns 53 51 55 56
Remote small towns 43 40 44 51
Accessible rural areas 54 51 53 61
Remote rural areas 52 50 54 57
Unknown17
34 31 34 36
Total 51 48 51 56
17
Unable to match 2.1% of S3 pupils to Urban Rural Classification.
22
Chapter 6: Achievement of CfE levels by Additional Support Needs
(ASN) status
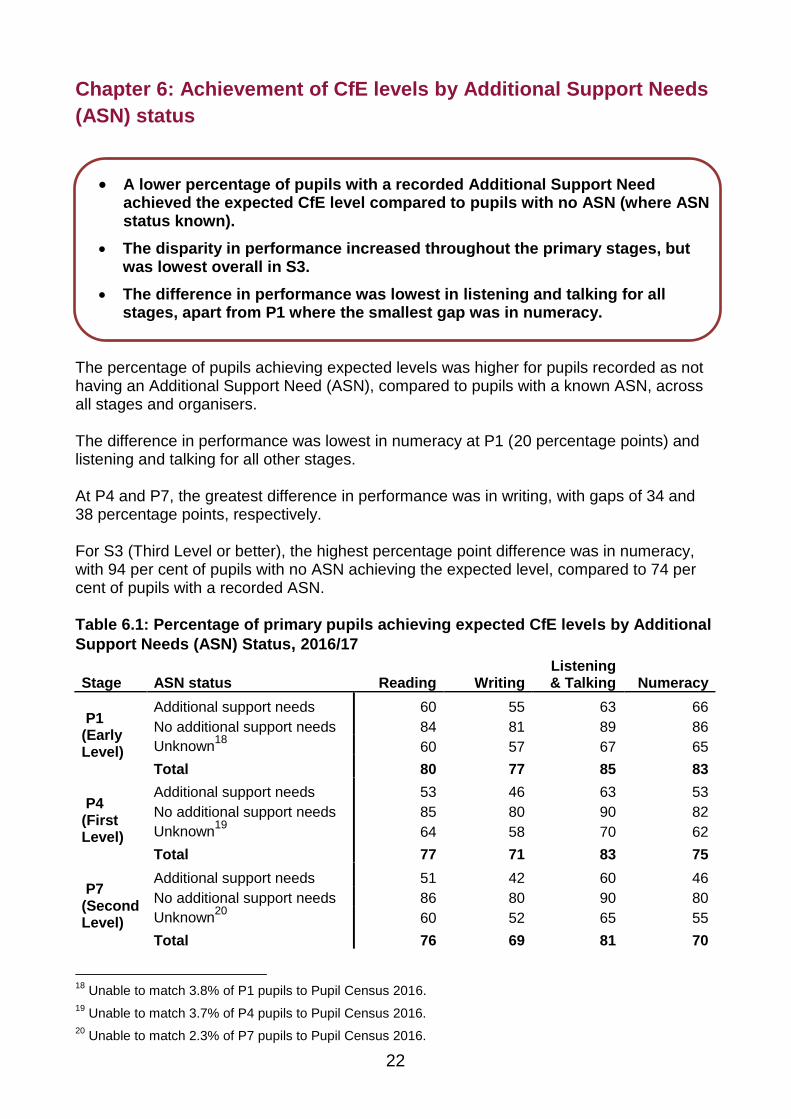
A lower percentage of pupils with a recorded Additional Support Need achieved the expected CfE level compared to pupils with no ASN (where ASN status known).
The disparity in performance increased throughout the primary stages, but was lowest overall in S3.
The difference in performance was lowest in listening and talking for all stages, apart from P1 where the smallest gap was in numeracy.
The percentage of pupils achieving expected levels was higher for pupils recorded as not having an Additional Support Need (ASN), compared to pupils with a known ASN, across all stages and organisers. The difference in performance was lowest in numeracy at P1 (20 percentage points) and listening and talking for all other stages. At P4 and P7, the greatest difference in performance was in writing, with gaps of 34 and 38 percentage points, respectively. For S3 (Third Level or better), the highest percentage point difference was in numeracy, with 94 per cent of pupils with no ASN achieving the expected level, compared to 74 per cent of pupils with a recorded ASN. Table 6.1: Percentage of primary pupils achieving expected CfE levels by Additional
Support Needs (ASN) Status, 2016/17
Stage ASN status Reading Writing Listening & Talking Numeracy
P1 (Early Level)
Additional support needs 60 55 63 66
No additional support needs 84 81 89 86
Unknown18
60 57 67 65
Total 80 77 85 83
P4 (First Level)
Additional support needs 53 46 63 53
No additional support needs 85 80 90 82
Unknown19
64 58 70 62
Total 77 71 83 75
P7 (Second Level)
Additional support needs 51 42 60 46
No additional support needs 86 80 90 80
Unknown20
60 52 65 55
Total 76 69 81 70
18
Unable to match 3.8% of P1 pupils to Pupil Census 2016.
19 Unable to match 3.7% of P4 pupils to Pupil Census 2016.
20 Unable to match 2.3% of P7 pupils to Pupil Census 2016.

23
Table 6.2: Percentage of S3 pupils achieving Third Level or better by Additional
Support Needs (ASN) Status, 2016/17
Stage ASN status Reading Writing Listening &
Talking Numeracy
Additional support needs 77 75 79 74
S3 No additional support needs 95 94 96 94
Unknown21
78 78 78 75
Total 90 89 91 88
Table 6.3: Percentage of S3 pupils achieving Fourth Level by Additional Support
Needs (ASN) Status, 2016/17
Stage ASN status Reading Writing Listening &
Talking Numeracy
Additional support needs 29 27 30 33
S3 No additional support needs 60 57 60 65
Unknown22
32 30 33 35
Total 51 48 51 56
21
Unable to match 2.0% of S3 pupils to Pupil Census 2016.
22 Unable to match 2.0% of S3 pupils to Pupil Census 2016.

24
Chapter 7: Achievement of CfE levels by English as an Additional
Language (EAL) status
The percentage of pupils achieving the expected CfE level was lower for
pupils with English as an Additional Language, compared to non-EAL pupils (where EAL status known).
The differences in performance were smaller for numeracy than for the literacy organisers across all stages.
The differences in performance were generally smaller at S3 than in the primary stages.
The percentage of pupils achieving expected levels was higher for pupils recorded as not having English as an Additional Language (EAL), compared to EAL pupils, across all stages and organisers. The gap in performance was lowest in numeracy across all stages; highest in P1 at seven percentage points and lowest in S3 (Third Level or better) at two percentage points. In P1, the greatest difference in performance between pupils who have EAL and those who have not, was in listening and talking; 71 per cent compared to 87 per cent. This was the biggest difference in expected levels across all the stages. In P4, the differences were similar over all the literacy organisers at 10 to 11 percentage points. A similar pattern was observed for both P7 and S3 pupils with the percentage point difference ranging from 11 to 13 (P7) and nine to ten percentage points (S3) across the literacy organisers.
Table 7.1: Percentage of primary pupils achieving expected CfE levels by English as an Additional Language (EAL) Status, 2016/17
Stage EAL status Reading Writing Listening & Talking Numeracy
P1 (Early Level)
English as an additional language 70 67 71 78
English as main language/fluent 82 78 87 85
Unknown23
60 57 67 65
Total 80 77 85 83
P4 (First Level)
English as an additional language 68 63 74 71
English as main language/fluent 78 72 84 76
Unknown24
64 58 70 62
Total 77 71 83 75
P7 (Second Level)
English as an additional language 65 59 69 67
English as main language/fluent 77 70 82 71
Unknown25
60 52 65 55
Total 76 69 81 70
23
Unable to match 3.8% of P1 pupils to Pupil Census 2016.
24 Unable to match 3.7% of P4 pupils to Pupil Census 2016.
25 Unable to match 2.3% of P7 pupils to Pupil Census 2016.

25
Table 7.2: Percentage of S3 pupils achieving Third Level by English as an Additional Language (EAL) Status, 2016/17
Stage EAL status Reading Writing Listening &
Talking Numeracy
English as an additional language 82 80 83 87
S3 English as main language/fluent 91 89 91 89
Unknown26
78 78 78 75
Total 90 89 91 88
Table 7.3: Percentage of S3 pupils achieving Fourth Level by English as an
Additional Language (EAL) Status, 2016/17
Stage EAL status Reading Writing Listening & Talking Numeracy
English as an additional language 39 37 39 54
S3 English as main language/fluent 52 49 52 56
Unknown27
32 30 33 35
Total 51 48 51 56
26
Unable to match 2.0% of S3 pupils to Pupil Census 2016.
27 Unable to match 2.0% of S3 pupils to Pupil Census 2016.

26
Chapter 8: Achievement of CfE levels in Gàidhlig
The percentage of primary pupils, in Gaelic Medium Schools/classes, achieving the expected CfE level was highest for Gàidhlig listening and talking, and lowest for Gàidhlig writing.
The percentage of S3 pupils achieving the expected CfE level was highest for reading and listening and talking (98 per cent) and lower for writing (94 per cent).
The pattern of Gàidhlig reading and writing performance was similar to English reading and writing; the percentage of pupils achieving expected CfE levels decreased throughout the primary stages and increased again in S3. For Gàidhlig listening and talking, however, the highest percentage of primary pupils that achieved the expected level was observed at P4, at 83 per cent. Chart 8.1 Percentage of pupils achieving expected CfE levels in Gàidhlig 2016/17
Performance was similar across all three organisers in P1. At P4 and P7, listening and talking results were highest, with a difference of 13 and 18 percentage points between Gàidhlig listening and talking and Gàidhlig writing results (Chart 8.1). At S3, performance was highest in Gàidhlig reading and Gàidhlig listening and talking.

27
Table 8.1: Percentage of pupils achieving expected CfE levels in Gàidhlig, 2016/17
Stage Gàidhlig Reading Gàidhlig Writing Gàidhlig Listening
& Talking
P1 (Early Level) 81 80 81
P4 (First Level) 78 71 83
P7 (Second level) 73 62 80
S3 Third Level or better 98 94 98
S3 Fourth Level 55 40 52

28
Chapter 9: Achievement of CfE levels of pupils based in special
schools/units
Around 30 per cent of pupils based in special schools/units are reported as following their own individual milestones.
Around a quarter of pupils were assessed as ‘Not yet achieved Early Level’.
For each organiser, nearly 30 per cent of pupils based in special schools/units are reported as having achieved a CfE level.
Chart 9.1: Percentage of pupils in special schools/units achieving CfE levels, 2016/17
Chart 9.1 shows the highest level achieved for all pupils in special schools/units (see section 1.4). The most common category was ‘Child following individual milestones’, which was the case for around three in ten pupils, followed by around a quarter of pupils who had ‘Not yet achieved Early Level’.

29
Of the pupils who achieved a CfE level in the special schools/units population, this was highest for listening and talking at 30 per cent, closely followed by numeracy (29 per cent), reading (28 per cent) and writing (27 per cent). The number of pupils in special schools/units not assessed was around 17 per cent (see section 1.6).

30
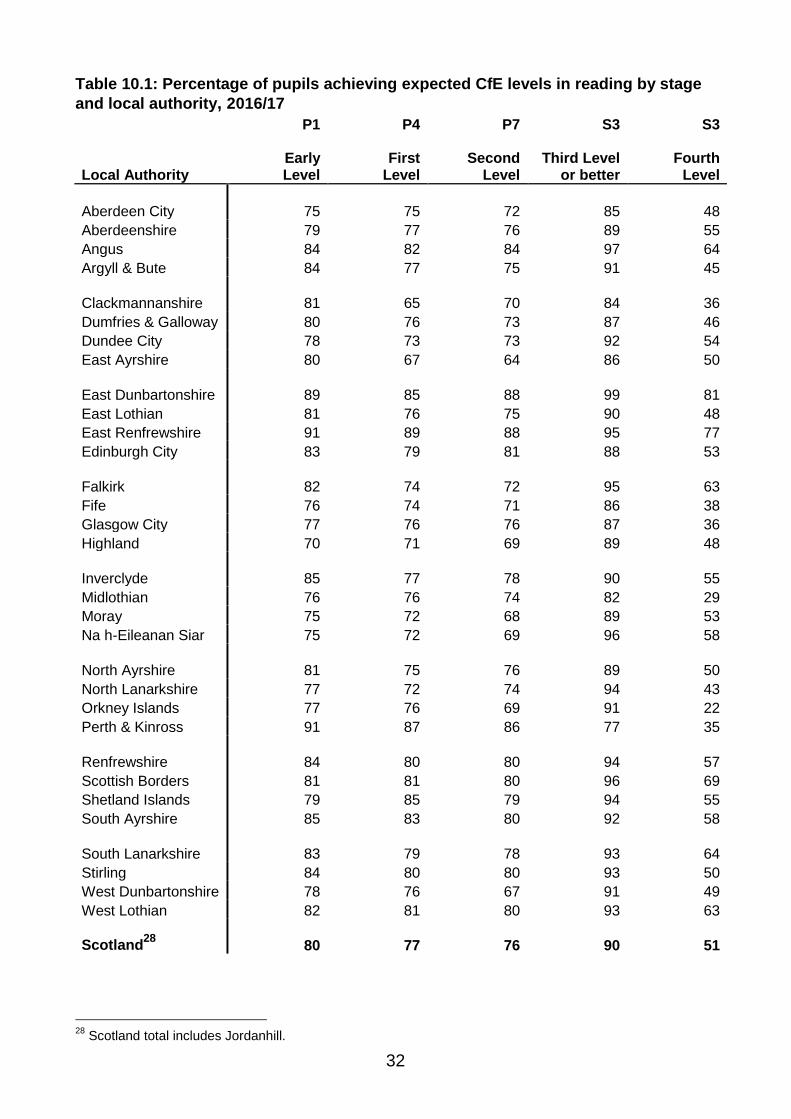
Chapter 10: Achievement of CfE levels by Local Authority
As this information is new and currently 'experimental', comparisons across local authorities should not be made without full knowledge of local authorities’ approach to assessment. The magnitude of the variation between authorities has reduced compared to 2015/16, and is summarised below.
At a national level, there has been a notable change in levels of reporting of achievement of Fourth Level in S3 (see section 1.6), this is also observed in the local authority level results.
The variation in the percentage of pupils achieving the expected level in reading by local authority: o P1 (Early Level): From 70 to 91 per cent (difference of 21 percentage
points) o P4 (First Level): From 65 to 89 per cent (difference of 24 percentage
points) o P7 (Second Level): From 64 to 88 per cent (difference of 24 percentage
points) o S3 (Third Level or better): From 77 to 99 per cent (difference of 21
percentage points).
The variation in the percentage of pupils achieving the expected level in writing by local authority: o P1 (Early Level): From 65 to 90 per cent (difference of 25 percentage
points) o P4 (First Level): From 58 to 86 per cent (difference of 28 percentage
points) o P7 (Second Level): From 49 to 85 per cent (difference of 36 percentage
points) o S3 (Third Level or better): From 76 to 98 per cent (difference of 22
percentage points).
The variation in the percentage of pupils achieving the expected level in listening and talking by local authority: o P1 (Early Level): From 76 to 94 per cent (difference of 18 percentage
points) o P4 (First Level): From 73 to 90 per cent (difference of 17 percentage
points) o P7 (Second Level): From 68 to 93 per cent (difference of 25 percentage
points) o S3 (Third Level or better): From 80 to 99 per cent (difference of 19
percentage points).

31
The percentage of pupils achieving the expected level numeracy variation by local authority: o P1 (Early Level): From 71 to 94 per cent (difference of 24 percentage
points) o P4 (First Level): From 60 to 90 per cent (difference of 31 percentage
points) o P7 (Second Level): From 54 to 86 per cent (difference of 33 percentage
points) o S3 (Third Level or better): From 64 to 96 per cent (difference of 32
percentage points).
32
Table 10.1: Percentage of pupils achieving expected CfE levels in reading by stage
and local authority, 2016/17
P1 P4 P7 S3 S3
Local Authority Early Level
First Level
Second Level
Third Level
or better Fourth
Level
Aberdeen City 75 75 72 85 48
Aberdeenshire 79 77 76 89 55
Angus 84 82 84 97 64
Argyll & Bute 84 77 75 91 45
Clackmannanshire 81 65 70 84 36
Dumfries & Galloway 80 76 73 87 46
Dundee City 78 73 73 92 54
East Ayrshire 80 67 64 86 50
East Dunbartonshire 89 85 88 99 81
East Lothian 81 76 75 90 48
East Renfrewshire 91 89 88 95 77
Edinburgh City 83 79 81 88 53
Falkirk 82 74 72 95 63
Fife 76 74 71 86 38
Glasgow City 77 76 76 87 36
Highland 70 71 69 89 48
Inverclyde 85 77 78 90 55
Midlothian 76 76 74 82 29
Moray 75 72 68 89 53
Na h-Eileanan Siar 75 72 69 96 58
North Ayrshire 81 75 76 89 50
North Lanarkshire 77 72 74 94 43
Orkney Islands 77 76 69 91 22
Perth & Kinross 91 87 86 77 35
Renfrewshire 84 80 80 94 57
Scottish Borders 81 81 80 96 69
Shetland Islands 79 85 79 94 55
South Ayrshire 85 83 80 92 58
South Lanarkshire 83 79 78 93 64
Stirling 84 80 80 93 50
West Dunbartonshire 78 76 67 91 49
West Lothian 82 81 80 93 63
Scotland28
80 77 76 90 51
28
Scotland total includes Jordanhill.

33
Table 10.2: Percentage of pupils achieving expected CfE levels in writing by stage
and local authority, 2016/17
P1 P4 P7 S3 S3
Local Authority Early Level
First Level
Second Level
Third Level or better
Fourth Level
Aberdeen City 73 70 66 82 46
Aberdeenshire 76 71 66 87 52
Angus 81 77 80 96 64
Argyll & Bute 80 70 67 91 40
Clackmannanshire 77 58 49 82 31
Dumfries & Galloway 77 68 66 86 46
Dundee City 73 66 62 91 52
East Ayrshire 76 62 59 85 47
East Dunbartonshire 86 83 85 98 81
East Lothian 77 70 65 87 44
East Renfrewshire 89 86 85 95 72
Edinburgh City 80 74 74 87 52
Falkirk 79 71 66 95 59
Fife 73 66 62 85 36
Glasgow City 75 70 69 85 34
Highland 68 64 59 88 46
Inverclyde 83 73 69 89 54
Midlothian 71 66 58 78 24
Moray 65 63 59 88 49
Na h-Eileanan Siar 75 65 63 95 51
North Ayrshire 78 69 69 88 49
North Lanarkshire 75 67 68 93 43
Orkney Islands 73 67 61 91 21
Perth & Kinross 90 83 82 76 30
Renfrewshire 82 73 71 93 55
Scottish Borders 76 77 74 95 65
Shetland Islands 78 73 69 93 48
South Ayrshire 82 78 74 91 57
South Lanarkshire 81 74 71 92 60
Stirling 81 73 74 92 44
West Dunbartonshire 69 70 59 91 43
West Lothian 78 79 75 91 56
Scotland29
77 71 69 89 48
29
Scotland total includes Jordanhill.

34
Table 10.3: Percentage of pupils achieving expected CfE levels in listening and
talking by stage and local authority, 2016/17
P1 P4 P7 S3 S3
Local Authority Early Level
First Level
Second Level
Third Level or better
Fourth Level
Aberdeen City 82 83 81 86 47
Aberdeenshire 85 83 79 90 54
Angus 88 87 89 97 66
Argyll & Bute 89 82 81 95 44
Clackmannanshire 86 76 75 87 40
Dumfries & Galloway 83 82 80 89 48
Dundee City 87 82 77 92 54
East Ayrshire 85 78 70 88 49
East Dunbartonshire 93 90 93 99 82
East Lothian 89 85 83 91 49
East Renfrewshire 94 90 91 94 77
Edinburgh City 86 84 82 88 54
Falkirk 87 81 81 96 63
Fife 81 78 75 86 36
Glasgow City 83 83 81 89 38
Highland 76 79 76 90 50
Inverclyde 87 88 84 92 56
Midlothian 85 78 74 84 31
Moray 82 73 74 89 49
Na h-Eileanan Siar 76 74 73 94 53
North Ayrshire 88 82 83 88 51
North Lanarkshire 82 79 78 95 44
Orkney Islands 80 79 68 87 26
Perth & Kinross 93 90 87 80 31
Renfrewshire 91 88 86 94 56
Scottish Borders 85 87 85 97 72
Shetland Islands 84 87 83 94 55
South Ayrshire 89 87 86 93 57
South Lanarkshire 87 85 85 93 64
Stirling 88 84 86 94 52
West Dunbartonshire 84 83 75 95 52
West Lothian 86 89 86 93 64
Scotland30
85 83 81 91 51
30
Scotland total includes Jordanhill.

35
Table 10.4: Percentage of pupils achieving expected CfE levels in numeracy by
stage and local authority, 2016/17
P1 P4 P7 S3 S3
Local Authority Early Level
First Level
Second Level
Third Level or better
Fourth Level
Aberdeen City 80 74 69 82 51
Aberdeenshire 84 76 68 91 64
Angus 86 80 79 95 61
Argyll & Bute 85 73 72 95 72
Clackmannanshire 79 60 54 64 26
Dumfries & Galloway 82 71 69 86 52
Dundee City 79 70 60 84 44
East Ayrshire 81 63 57 85 48
East Dunbartonshire 90 84 84 96 76
East Lothian 81 71 69 84 55
East Renfrewshire 94 90 86 95 76
Edinburgh City 87 79 76 91 59
Falkirk 84 71 65 93 62
Fife 82 74 66 87 49
Glasgow City 83 75 72 86 46
Highland 72 68 59 86 51
Inverclyde 88 74 74 82 40
Midlothian 76 73 63 89 65
Moray 71 61 58 87 61
Na h-Eileanan Siar 77 65 59 79 44
North Ayrshire 83 75 73 81 55
North Lanarkshire 82 72 68 93 61
Orkney Islands 79 71 63 94 72
Perth & Kinross 92 86 85 75 37
Renfrewshire 88 76 74 93 56
Scottish Borders 81 78 71 90 66
Shetland Islands 81 72 68 83 59
South Ayrshire 92 85 80 90 50
South Lanarkshire 86 75 74 90 56
Stirling 86 78 75 90 59
West Dunbartonshire 81 71 63 84 55
West Lothian 84 81 74 92 61
Scotland31
83 75 70 88 56
31
Scotland total includes Jordanhill.

36
Chapter 11: Background notes
11.1 Sources and coverage
The data included in the publication are provided to Scottish Government by local authorities and grant-aided schools. Independent schools are not included in the data collection. The assessments of children’s progress are undertaken by teachers in schools. A copy of the specification issued to data providers can be found here. The data covers pupils in Primary 1, Primary 4, Primary 7 and Secondary 3 in mainstream schools and all pupils based in special schools/units. Data was provided for 225,547 pupils. Teacher judgements cover the four organisers of reading, writing, and listening and talking and numeracy. The data relate to achievement as at June 2017 (at, or near, the end of the 2016/17 school year). Mainstream pupils for whom the teacher has been unable to make a professional judgement are not included in the published results (1.1 per cent of pupils). To reduce burden on data providers, as per the Code of Practice for Official Statistics, the contextual information was added to the school returns by using previously collected data. Pupil data were matched to the Pupil Census 2016. From this census the following variables were added:
Ethnicity
Additional Support Needs
English as an Additional Language The Pupil Census data was then linked to the Scottish Index of Multiple Deprivation 2016 (SIMD) and the 6-fold Urban Rural Classification 2013-2014. Around three per cent of records could not be matched to the SIMD or the Urban Rural Classification; these are presented under category ‘Unknown’ in the publication tables. A very small percentage of children have long term significant and complex additional support needs that mean that it is unlikely that they will progress through the CfE levels during their time in education. These children are included within the data as ‘child following individual milestones’. Data was returned from all schools within scope for the collection. There were a small number of pupils for whom data was not supplied, or for whom data was not provided for all components requested.
11.2 School level data
School level results are also being published alongside this publication. They are available online via this link. Data will be published for all publicly funded primary and secondary schools (but not special schools) subject to data protection limitations. All school level results will be presented in ten per cent bandings (i.e. under 10 per cent, 10 per cent – under 20 per cent, … , 90 per cent or more). To prevent potential disclosure of information relating to individual pupils, any results relating to a grouping of 20 pupils or fewer will be suppressed. This means that around 19 per cent of primary schools and five per cent of secondary schools will have no information published for them.

37
As with the national and local authority level data, all school results include ‘children working towards individual milestones’. However, children who were recorded as ‘Not Assessed’ are not included in the calculations. The quality limitations described in section 1.6 also apply to school level data. There is greater likelihood that an individual school’s results are affected by variations in assessment approach, socio-economic context and school size (for example) than is the case at the more aggregated local authority or Scotland level. On that basis, we would advise against making direct comparisons between schools. The publication online does not allow direct, on-screen comparisons of schools.
11.3 Supplementary tables
The collection involves a large amount of data which cannot be summarised in this publication. This report seeks to highlight the key messages and give a flavour of the range of analysis possible. Detailed tables are published as supporting tables alongside this publication, and provide a fuller picture of the findings. The tables within this report and school level information can be found at: http://www.gov.scot/Topics/Statistics/Browse/School-Education/ACEL
11.4 Revisions policy
Data submission for the latest year can identify required revisions for previously submitted data. Scottish Government will revise the previous years’ results at the time of publication of the latest years’ results. Data revisions must be received by October for inclusion in the next publication. Achievement of CfE Levels 2015/16 data has been revised and new supplementary tables published following receipt of revised data from two local authorities and a minor coding revision for two special schools. The changes were no greater 0.05 percentage points to the Scotland total, no greater than 1.0 percentage point for a local authority figure, and no greater than 0.2 percentage points to the special school totals.
11.5 Further information on attainment
There is a range of other reliable information on the performance of Scotland’s school pupils. The Scottish Government also publishes analysis of school leaver attainment (qualifications) destinations. The latest post-appeal data are available at http://www.gov.scot/Publications/2017/06/9699/0 Scotland participates in the OECD’s triennial Programme for International Student Assessment (PISA) survey. This assessment is carried out by 15 year-olds in over sixty countries, including all OECD countries, and as such is a key international benchmark of performance. The results of previous PISA surveys are available at www.gov.scot/pisa For updates on new education statistics, any forthcoming changes to education statistical publications and stakeholder consultations please register with Scotstat at the following website: http://www.scotland.gov.uk/Topics/Statistics/scotstat Media enquiries about the information in this Statistics Publication Notice should be addressed to: Gurjit Singh, Tel: +44(0) 131 244 2701

38
An Official Statistics publication for Scotland
Official and National Statistics are produced to high professional standards set out in the Code of Practice for Official Statistics. Both undergo regular quality assurance reviews to ensure that they meet customer needs and are produced free from any political interference. Correspondence and enquiries For enquiries about this publication please contact: Marion MacRury Education Analytical Services Telephone: 0131 244 0315 e-mail: [email protected] For general enquiries about Scottish Government statistics please contact: Office of the Chief Statistician, Telephone: 0131 244 0442, e-mail: [email protected]
How to access background or source data The data collected for this statistical bulletin
☐ are available in more detail through statistics.gov.scot
☐ are available via an alternative route
☒ may be made available on request, subject to consideration of legal and ethical
factors. Please contact [email protected] for further information.
☐ cannot be made available by Scottish Government for further analysis as
Scottish Government is not the data controller.
Complaints and suggestions If you are not satisfied with our service or have any comments or suggestions, please write to the Chief Statistician, 2W, St Andrews House, Edinburgh, EH1 3DG, Telephone: (0131) 244 0302, e-mail [email protected] If you would like to be consulted about statistical collections or receive notification of publications, please register your interest at www.gov.scot/scotstat Details of forthcoming publications can be found at www.gov.scot/statistics ISSN 1479-7569 ISBN 978-1-78851-473-6 Crown Copyright You may use or re-use this information (not including logos) free of charge in any format or medium, under the terms of the Open Government Licence. See: www.nationalarchives.gov.uk/doc/open-government-licence/


