
ACETONE 175
5. POTENTIAL FOR HUMAN EXPOSURE
5.1 OVERVlEW
Acetone is emitted into the atmosphere both from natural and anthropogenic (man-made) sources.
Natural sources of emission include plants and trees (Graedel et al. 1986; Isidorov et al. 1985; Khalil
and Rasmussen 1992), volcanic eruptions (Isidorov et al. 1990), forest fires (Graedel et al. 1986), and
insects and microbes (Graedel et al. 1986). Acetone is also produced endogenously and expired in
human breath (Conkle et al. 1975). Some important anthropogenic sources of acetone in the air
include vehicular exhaust (Graedel et al. 1986), chemical manufacturing (Graedel et al. 1986), tobacco
smoke (Manning et al. 1983), wood burning and pulping (Graedel et al. 1986), refuse and polyethylene
combustion (Graedel et al. 1986; Hodgkin et al. 1982; NAS 1976), petroleum production (Graedel et
al. 1986), certain landfill sites (Hodgson et al. 1992; LaRegina et al. 1986), and solvent use (Graedel
et al. 1986). The sensitized photoreaction of dissolved organic matters naturally produces acetone in
seawater (Mopper and Stahovec 1986). Chemical manufacturing industries (Abrams et al. 1975),
energy-related industries (Mohr and King 1985), and user industries (Abrams et al. 1975) release
acetone to surface waters. Acetone is released into groundwater mainly as a result of leaching from
municipal and industrial landfills (Brown and Donnelly 1988). The principal sources of acetone in soil
are municipal and industrial discharge in landfills (EPA 1988b). Another source is atmospheric
deposition (Grosjean and Wright 1983). Acetone is released in soil from natural sources, such as
disposed agricultural and food wastes and animal wastes (Graedel et al. 1986).
Acetone has been identified in at least 560 of the 1,350 hazardous waste sites that have been proposed
for inclusion on the EPA National Priorities List (NPL) (HAZDAT 1991). However, the number of
sites evaluated for acetone is not known. The frequency of these sites within the United States can be
seen in Figure 5-l. Of these sites, 559 are located in the United States and 1 is located in the
Commonwealth of Puerto Rico (not shown).
The two processes that are important in determining the fate of acetone in the atmosphere are reaction
with hydroxyl radicals and photolysis. The estimated half-life of acetone in the air due to
combinations of these two reactions is 22 days (Meyrahn et al. 1986). Because of this reasonably long
half-life, acetone is transported long distances from its source of emission. Wet deposition transports

ACETONE 1775. POTENTIAL FOR HUMAN EXPOSURE
atmospheric acetone to surface water and the terrestrial surface (Grosjean and Wright 1983). The most
important fate determining process for acetone in water is biodegradation (Rathbun et al. 1982).
Because of its high water solubility, acetone does not adsorb significantly to sediment and suspended
solids in water. Acetone does not bioconcentrate in aquatic organisms (Rustung et al. 1931), and there
is no data on acetone biomagnification in aquatic and terrestrial food chains. Biodegradation is the
most important degradative process for acetone in sediment and soil (Rathbun et al. 1982). The
important transport processes of acetone in soil are volatilization to the atmosphere and leaching into
groundwater.
The levels of acetone in ambient air and water are generally low. The concentration of acetone in the
atmosphere in remote areas is <1 ppb (volume per volume [v/v]) (1 ppb=0.00l ppm) (Cavanagh et al.
1969; Arnold et al. 1986). Its mean concentration in the atmosphere of rural areas is <3 ppb (Shepson
et al. 1991; Snider and Dawson 1985). The mean concentration of acetone in urban air in the United
States is 6.9 ppb (Shah and Singh 1988). Acetone concentration in indoor air in the United States is
generally slightly higher than outdoor air (8.0 ppb versus 6.9) (Shah and Singh 1988), due to the use
of household consumer products containing acetone. The concentration of acetone in open seawater
near the Bahamas was 0.35 ppb (Kieber and Mopper 1990). The concentration of acetone in the
Potomac River in Virginia was below the detection limit of 40 ppb (Hall et al. 1987), and the level
will be higher in water receiving industrial and municipal discharge containing acetone. An industrial
landfill leachate in Michigan contained 62 ppm acetone (Brown and Donnelly 1988). An acetone
concentration <3,000 ppb was detected in a drinking water well in New Jersey (Burmaster 1982). The
level of acetone in finished drinking water is generally low (Coleman et al. 1976; Keith et al. 1976),
and the reported concentration in drinking water from Seattle, Washington, was 1 ppb (Keith et al.
1976). A concentration of 6 ppb acetone was detected in the sediment of a creek adjacent to a landfill
in Louisville, Kentucky (Stonebraker and Smith 1980). Acetone has been detected in the volatile
components of several fruits and vegetables (Bartley and Schwade 1989; Lovegren et al. 1979).
The general population is exposed to acetone by inhaling ambient air and by ingesting drinking water
and food containing acetone. No data for the total daily intake of acetone for the general population
were located. There is a great deal of evidence that workers in certain industries, such as certain paint,
plastic, artificial fiber, and shoe factories are exposed to much higher levels of acetone than the
general population (Kawai et al. 1990a; Pezzagno et al. 1986). Professional painters, and commercial
and household cleaners are also likely to be exposed to higher acetone concentrations than the general
ACETONE 178
5. POTENTIAL FOR HUMAN EXPOSURE
population. Among the general population, smokers, frequent users of nail polish removers and people
who live near certain landfill sites (emitting higher than ambient levels of acetone) or other industrial
sources of emission are susceptible to higher exposure concentrations of acetone.
5.2 RELEASES TO THE ENVIRONMENT
5.2.1 Air
Acetone is emitted into the atmosphere both from natural and anthropogenic (man-made) sources.
Natural sources of emission include plants and trees. Acetone has been detected in a number of plant
volatiles including onions, grapes, cauliflower, tomatoes, wild mustard, beans, and peas (HSDB 1992),
and emissions have been detected from a variety of trees including willow, aspen, birch, balsam
poplar, oak, fir, pine, juniper, cedar, and cypress (Isidorov et al. 1985; Khalil and Rasmussen 1992).
Acetone is produced endogenously and released as a component of human breath (Conkle et al. 1975;
Krotoszynski 1977; Trotter et al. 1971). Volatiles from animal wastes, microbes, and insects are also
examples of natural sources of acetone in the air (Graedel et al. 1986). In addition, forest fires and
volcanic eruptions emit acetone into the atmosphere (Graedel et al. 1986; Isidorov et al. 1990).
Some important anthropogenic sources of acetone in the air are automobile and diesel exhaust (Barber
and Lodge 1963; Jonsson et al. 1985; Lloyd 1978), chemical manufacture (Graedel et al. 1986),
tobacco smoke (Manning et al. 1983), wood burning and pulping (Graedel et al. 1986; Kleinienst et al,
1986; Lipari et al. 1984), polyethylene burning (Hodgkin et al. 1982), refuse combustion (NAS 1976),
petroleum production (Graedel 1978), certain landfill sites (Hodgson et al. 1992; LaRegina et al. 1986;
Militana and Mauch 1989), and solvent uses (Medinilla and Espigares 1988). Acetone is also formed
in the atmosphere from the photochemical oxidation of propane (Arnold and Ziereis 1986; Singh and
Hanst 1981) and possibly from propylene oxide and epichlorohydrin (Spicer et al. 1985). Atmospheric
emissions are also likely from several consumer products including nail polish removers, particle board
(Tichenor and Mason 1988), carpet backing (Hodgson et al. 1993), some paint removers (Hahn and
Werschulz 1986), and a number of liquid/paste waxes or polishes (Knoeppel and Schauenburg 1989;
Sack et al. 1992). Certain detergents/cleansers (Knoeppel and Schauenburg 1989; Sack et al. 1992),
adhesives, and carburetor and choke cleaners (EPA 1989) are also known to contain acetone.
ACETONE 179
5. POTENTIAL FOR HUMAN EXPOSURE
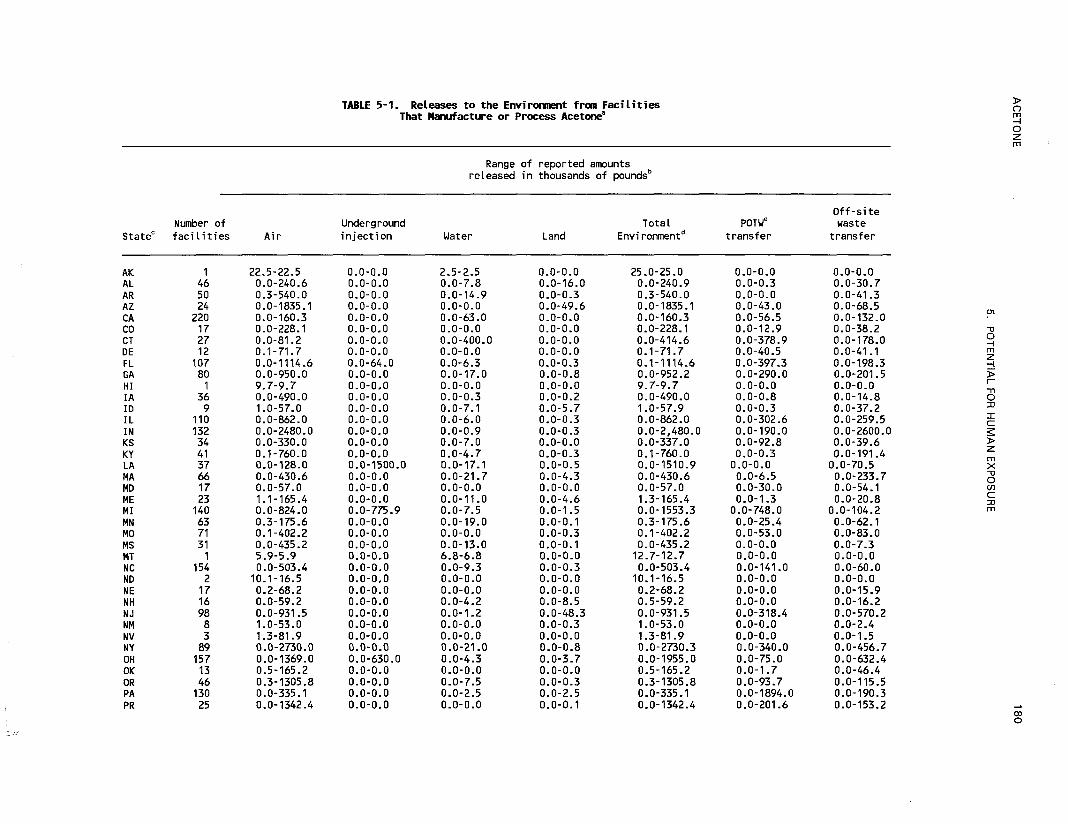
Acetone released into air from facilities in each state in the United States that manufactured or
processed acetone during 1990 are listed in Table 5-l (TR190 1992). According to TR190 (1992), an
estimated total of 180 million pounds of acetone, amounting to 96.7% of the total environmental
release, was discharged to the air from manufacturing and processing facilities in the United States in
1990. The TRI data should be used with caution since only certain types of facilities were required to
report. This is not an exhaustive list. From the monitoring data on levels of acetone in pristine areas
and urban/suburban areas (see Section 5.4.1), it seems likely that the total emission of acetone in the
atmosphere from anthropogenic sources exceeds the total emission from natural sources.
5.2.2 Water
Acetone is released into surface water as waste water from certain chemical manufacturing industries
(Gordon and Gordon 1981; Hites and Lopez-Avila 1980; Jungclaus et al. 1978). It is also released in
water from energy-related industries, such as coal-gasification (Mohr and King 1985; Pellizzari et al.
1979) and oil shale processing (Hawthorne and Sievers 1984; Pellizzari et al. 1979). Acetone was
found in 27 of 63 effluent waters from a wide range of chemical industries in the United States (Perry
et al, 1979). A survey of industrial effluents indicates that acetone was detected in effluents from
various industrial products such as, paper, plastic, pharmaceutical, specialty cleaning and polishing
products, paint and allied products, gum and wood chemicals, cyclic intermediates, industrial organic
chemicals, gypsum products, and paper board products (Abrams et al. 1975).
Acetone is released to groundwater as a result of leaching from municipal and industrial landfills
(Brown and Donnelly 1988; Gould et al. 1983; Sawhney and Raabe 1986; Steelman and Ecker 1984;
Stonebraker and Smith 1980). Leaching from polyethylene distribution pipes may be a source of
acetone in drinking water (Anselme et al. 1985). One of the sources of acetone in seawater is the
sensitized photoreaction of dissolved organic matters (Mopper and Stahovec 1986). The releases of
acetone to water from facilities that manufactured or processed acetone in states within the United
States during 1990 are reported in Table 5-l (TR190 1992). According to TR190 (1992), an estimated
total of 1.28 million pounds of acetone, amounting to 0.7% of the total environmental release, was
discharged to the water from manufacturing and processing facilities in the United States in 1990. In
addition, these facilities discharged an estimated 12.2 million pounds of acetone, amqunting to 6.6% of
the total environmental release to municipal waste water of publicly owned treatment works (POTW)
in 1990 (TR190 1992).


ACETONE 182
5. POTENTIAL FOR HUMAN EXPOSURE
5.2.3 SoilAcetone leaches readily in soil (see Section 5.4.3). Therefore, the detection of acetone in leachate and
groundwater from municipal and industrial landfills indicates the source of acetone in landfill soils is
municipal and industrial discharge. Information regarding the release of acetone from facilities that
manufactured or processed the compound in 1990 is reported in Table 5-l (TR190 1992). Table 5-l
shows that the amount of acetone released into soil from these facilities accounts for 0.1% of the total
environmental release of acetone. Other sources of acetone released into soil include disposal of
agricultural and food waste, animal wastes (see Section 5.2.1), and atmospheric wet deposition.
Household septic tank effluents are another source of acetone in soil because these effluents containing
acetone are discharged into the soil (DeWalle et al. 1985). According to the HAZDAT of ATSDR,
acetone was detected in 43% of the soil from Superfund sites tested for acetone (HAZDAT 1991).
The information used from the HAZDAT includes data from NPL sites only.
5.3 ENVIRONMENTAL FATE
5.3.1 Transport and Partitioning
Organic compounds with ambient vapor pressure >10-4 mmHg should exist almost entirely in the vapor
phase (Eisenreich et al. 1981). Since the vapor pressure of acetone is 181.72 mmHg at 20°C (see
Table 3-2), acetone should exist exclusively in the vapor phase in the atmosphere. Furthermore, the
collection methods used for the quantification of acetone in the atmosphere (Jarke et al. 1981; Juttner
1986; LaRegina et al. 1986) indicate that atmospheric acetone exists as vapor. Due to the atmospheric
half-life, which is on the order of days (see Section 5.3.2.1), acetone will be transported long distances
in the air. Although not a large sink (Chatfield et al. 1987), small amounts of acetone will be
removed from the atmosphere by wet deposition (Grosjean and Wright 1983), which will transport
acetone from the atmosphere to surface water and soil.
The complete miscibility of acetone in water suggests that partitioning of acetone from the water
column to sediments and suspended solids in water is not significant. The estimated low value of 0.73
for log Koc (see Table 3-2) also suggests that adsorption of acetone to sediments and suspended solids
is not significant. In the absence of water, acetone vapor adsorbs rather strongly to the clay
component of soil by hydrogen bonding (Goss 1992; Steinberg and Kreamer 1993). The sorption is
ACETONE 183
5. POTENTIAL FOR HUMAN EXPOSURE
dependent on relative humidity, and increasing the humidity decreases sorption drastically. In water
saturated soil or sediment, only organic carbon, as indicated by Koc, and not hydrogen bonding may
control the sorption of acetone (Steinberg and Kreamer 1992). The experimental adsorption studies
with kaolinite, monkmorillonite, and stream sediments showed very little or no loss of acetone from
water to the adsorbents (Rathbun et al. 1982). The transport of acetone from the water column to the
atmosphere depends on the Henry’s law constant. The Henry’s law constant for acetone is 4.26x10⁻⁵
atm-m3/mol (see Table 3-2). Therefore, volatilization of acetone from water, although not very fast, is
significant (Thomas 1982). The volatilization rate of a chemical depends on the characteristics of the
chemical and the water and on other ambient conditions (e.g., water depth, suspended solid
concentration, water current, wind speed, temperature). Based on an estimation method (Thomas
1982) and a Henry’s law constant value of 4.26x10⁻⁵ atm-m3/mol, the volatilization half-life of acetone
from a model river 1 m deep, flowing at a current of 1 m/second with a wind velocity of 3 m/second
is about 18 hours. The mean volatilization coefficient for acetone in a model outdoor stream was in
the range of 7.15x10⁻⁴ to 14.8x10⁻⁴/minute (Rathbun et al. 1989, 1991). Therefore, the volatilization
half-life of acetone from the model stream is in the range of 7.8-16.2 hours. It was concluded that
volatilization will control the fate of acetone in water (Rathbun et al. 1989, 1991). Results of a
laboratory study (Rathbun et al. 1982) also concluded that volatilization. is one of the important fate
determining processes for acetone in streams.
The log Kow value of -0.24 (see Table 3-2) suggests that bioconcentration of acetone in aquatic
organisms is not significant. The measured bioconcentration factor for acetone in adult haddock
exposed to acetone under static conditions at 7-9°C was <l (Rustung et al. 1931). No data regarding
the biomagnification potential of acetone in aquatic organisms were located; however, the low Kow
value suggests that biomagnification of acetone from animals of lower to higher trophic level is
unlikely.
The two significant transport properties for acetone in soil are volatilization and leaching. Leaching
transports acetone from soil to groundwater. The rate of leaching from soil by rainwater depends on
the sorption characteristics of acetone in soil. Since acetone may be controlled by Koc in water-
saturated soil and has a low Koc value, sorption of acetone in such soil will be weak. The low
retention ability will permit acetone to leach into groundwater. A sorption study with moist clay soils
indicates that aqueous acetone causes swelling in these soils (Green et al. 1983), and this process may
allow the retention of a small fraction of acetone. Groundwater monitoring studies (see Section 5.4.2)
ACETONE 184
5. POTENTIAL FOR HUMAN EXPOSURE
at landfill sites provided evidence of the importance of acetone leaching from soil. Volatilization
transports acetone from soil to the atmosphere. The volatility rate of acetone from soil depends on the
soil characteristics (moisture content, soil porosity, etc.). Since the acetone is weakly sorbed to soil,
the volatility depends primarily on the moisture content of the soil. In dry soil, the volatilization rate
from soil surfaces is high due to the high vapor pressure of acetone. In moist soil, the rate of
volatilization is similar to acetone in water and depends on the Henry’s law constant. Acetone
volatilizes moderately under these conditions. The detection of acetone at higher concentrations in
downwind air of a landfill site, compared to upwind air (Militana and Mauch 1989), indicates the
importance of volatilization as a transport process in soil.
No data regarding the transport of acetone from soil to plants were located.
5.3.2 Transformation and Degradation
5.3.2.1 Air
The reactions of acetone vapor with nitrogen oxides, hydroxyl radicals (OH), singlet molecular oxygen
(1∆g, singlet atomic oxygen (O[3P]), and nitrate radicals have been studied. Given the second order
rate constants for the reactions of acetone with 1∆g (Datta and Rao 1979) and O(3P) (Lee and Timmons
1977), and the concentrations of singlet molecular and atomic oxygen in the atmosphere (Graedel
1978), these reactions are insignificant in determining the fate of acetone in the atmosphere. The
reaction of acetone with nitrate radicals in the atmosphere was also determined to be insignificant
(Boyd et al. 1991). Smog chamber studies with acetone and nitrogen oxides conclude that acetone has
low reactivity in terms of ozone and nitrogen dioxide formation and that the rate of disappearance of
acetone by this process is low (Altshuller and Cohen 1963; Dimitriades and Joshi 1977; Yanagihara et
al. 1977). The photochemical oxidation of acetone in the presence of nitrogen oxides produces small
amounts of peroxyacetic acid and peroxyacetyl nitrate (Hanst and Gay 1983).
The two significant processes in determining the fate of acetone in the atmosphere are reaction with
hydroxyl radicals and photolysis. The rate constant for the reaction of hydroxyl radicals with acetone
at 25°C is in the range of 2.2-5.0x10⁻¹³ cm3/molecule-second (Cox et al. 1980; Cox et al. 1981;
Meyrahn et al. 1986). The estimated average lifetime of acetone due to reaction with hydroxyl
radicals is 44.5 days (Meyrahn et al. 1986). The probable pathways for the reaction of acetone with

ACETONE 185
5. POTENTIAL FOR HUMAN EXPOSURE
hydroxyl radicals in the troposphere have been postulated, and methylglyoxal is the primary product of
this reaction (Altshuller 1991). Acetone underwent significant photolysis with an artificial light (cutoff
wavelength of 270 nm) with a maximum emission intensity of 300 nm (Fujiki et al. 1978). Besides
free radicals, the primary products of acetone photolysis in sunlight are carbon dioxide and
acetylperoxynitrate (Altshuller 1991). The lifetimes of acetone due to photolysis under cloudless
conditions at 40º N latitude, and at sea level during winter and summer are estimated to be 83 and
19 days, respectively (Martinez et al. 1992). Other investigators have estimated that the average
atmospheric lifetime of acetone due to photolysis at 40º N latitude is 115.7 days/year (Meyrahn et al.
1986). The estimated average lifetime of acetone at 40º N due to combined hydroxyl radical reaction
and photolysis is 32 days/year (Meyrahn et al. 1986), corresponding to a half-life of 22 days. Due to
the pressure dependence of the quantum yield, the rate of photodissociation will increase as altitude
increases, whereas the reaction rate with hydroxyl radicals will decrease because temperature decreases
at higher altitudes. Therefore, the lifetime of acetone in the atmosphere will remain approximately
constant with respect to altitude. However, the rate will show a pronounced dependence on latitude
with greater losses of acetone occurring near the equator, compared to the poles (Meyrahn et al. 1986).
5.3.2.2 Water
Based on the rate constant for the reaction of acetone with hydroxyl radicals in water at pH 7
(5.8-7.7x10⁷/M-second) (Anbar and Neta 1967) and the concentration of hydroxyl radicals in eutrophic
waters (3x10-17M) (Mill and Mabey 1985), this reaction will not be significant in water. When
distilled water or natural water containing acetone were exposed to sunlight for 2-3 days, no
photodecomposition of acetone was observed (Rathbun et al. 1982). Therefore, photolysis of acetone
in water is not an important process.
Many aerobic biodegradation screening studies with mixed microorganisms from waste-treatment plant
effluents, activated sludge, or sewage have examined the biodegradability of acetone (Babeu and
Vaishnav 1987; Bhattacharya et al. 1990; Bridie et al. 1979; Ettinger 1956; Gaudy et al. 1963; Hatfield
1957; Heukelekian and Rand 1955; Lamb and Jenkins 1952; Price et al. 1974; Stafford and Northup
1955; Thorn and Agg 1975; Urano and Kato 1986a, 1986b). These studies indicate that acetone is
easily biodegradable with acclimatized microorganisms or after a suitable lag period (≈ l day) (Urano
and Kato 1986a, 1986b), as long as the initial concentration of acetone is not at a toxic level. For
example, acetone at a concentration of 500 mg/L was toxic to microorganisms when biooxidation of

ACETONE 186
5. POTENTIAL FOR HUMAN EXPOSURE
acetone by activated sludge was attempted (Gerhold and Malaney 1966). Biodegradation of acetone
was much slower in seawater than in fresh water (Takemoto et al. 1981). After a suitable lag period
(5 days), acetone biodegraded quantitatively under anaerobic conditions with anaerobic acetate
enriched culture medium (Chou et al. 1979). A biodegradation study of acetone in natural water
collected from Lago Lake near Athens, Georgia, determined that the biodegradation kinetics is
multiphasic in nature and depends on the substrate concentration. The determined rate of degradation
was faster at higher initial concentrations (the maximum concentration used was 0.5 mg/L) (Hwang et
al. 1989).
In a laboratory experiment with natural stream water and sediment, no acetone was lost in 338 hours
under sterile conditions in closed flasks. However, with nonsterile natural sediment, 100% of the
acetone was lost in 500 hours following a lag period of 90 hours. (Rathbun et al. 1982). The authors
of this study concluded that biodegradation was one of the important processes for the loss of acetone
in streams. Significant loss of acetone due to biodegradation was not observed in a later study where
acetone was injected continuously in an outdoor model stream (Rathbun et al. 1988, 1989, 1991,
1993). Attempts to induce biodegradation by adding glucose and a nutrient solution containing
bacteria acclimated to acetone were unsuccessful. The authors concluded that the residence time of
acetone in the model stream (6 hours) was too short for the bacteria to become acclimated in the water
before initiation of biodegradation. However, this explanation may not be valid if attached bacteria,
rather than free-floating bacteria, dominate the biodegradation process. As an alternative explanation,
the authors indicated that the observed limitation in the nitrate concentration in the stream may be
responsible for the lack of acetone biodegradation.
5.3.2.3 Sediment and Soil
The biodegradation studies discussed in Section 5.3.2.2 indicate that biodegradation of acetone in
sediment and soil will be significant. However, laboratory or field data examining the biodegradability
of acetone in soil are lacking. No evidence was located to suggest that any degradation process other
than biodegradation is important in sediment and soil.

ACETONE 187
5. POTENTIAL FOR HUMAN EXPOSURE
5.4 LEVELS MONITORED OR ESTIMATED IN THE ENVIRONMENT
5.4.1 AirAcetone is a volatile compound and is stable in air. Therefore, some monitoring data for the levels of
acetone in air are available. The levels of acetone in urban, rural, and remote areas in the United
States and the level in the troposphere are shown in Table 5-2.
It is obvious from Table 5-2 that the concentration of acetone in the air around urban areas will be
higher than rural and remote areas because of higher emission rates from a larger number of sources.
Besides these data, air monitoring data from an urban area (Tulsa, Oklahoma), a rural area (Rio Blanco
County, Colorado), and a remote area (Smoky Mountain, Tennessee) are also available (Arnts and
Meeks 1981). These data are not presented in Table 5-2 because the samples were collected in Tedlar
bags that are known to contaminate air samples with acetone. As a result, the reported acetone
concentrations were consistently higher than the values given in Table 5-2. Table 5-2 also indicates
that the indoor concentration of acetone is generally higher than the outdoor concentration. Other
investigators reported similar results (Jarke et al. 1981). The reason for the higher indoor air
concentration is the use of acetone-containing consumer products inside homes. The potential for
intrusion of acetone present as soil gas into a house adjacent to a landfill by diffusive and advective
routes was found to be low (Hodgson et al. 1992). However, only a single house was studied, and the
ambient air in the basement of the house was estimated on two separate occasions and found to be 12
and 82 ppb (v/v).
5.4.2 Water
In a National Organics Reconnaissance Survey (NORS) by EPA involving drinking water supplies
from 10 cities in the United States, acetone was qualitatively detected in all 10 water samples. The 10
cities in this survey were Cincinnati, Ohio, Miami, Florida, Ottumwa, Indiana, Philadelphia,
Pennsylvania, Seattle, Washington, Grand Forks, North Dakota, Lawrence, Kansas, New York, New
York, Terrebonne Parrish, Louisiana, and Tucson, Arizona (Bedding et al. 1982; Coleman et al. 1976;
Keith et al. 1976). The determined concentration of acetone in one of the drinking water samples
(Seattle, Washington) was 1 ppb (Keith et al. 1976). Acetone has also been detected in water from
several artesian wells adjacent to a landfill in Wilmington, Delaware and at a concentration of 0.3 ppb


ACETONE 189
5. POTENTIAL FOR HUMAN EXPOSURE
in finished drinking water from one of the wells (DeWalle and Chian 1981). The concentration of
acetone was <3,000 ppb in a drinking water well in New Jersey (Burmaster 1982; Steelman and Ecker
1984).
The concentration of acetone in open ocean water (Tongue of the Ocean, Bahamas) was 6 nM (0.35
ppb) (Kieber and Mopper 1990) whereas the reported mean concentrations in seawater from Straits of
Florida and the Eastern Mediterranean were 20 and 30 ppb, respectively (Corwin 1969). The
concentration of acetone in the Potomac River, VA was below the detection limit of 40 ppb (Hall et
al. 1987). Acetone has been detected in the effluent from a textile plant (Gordon and Gordon 1981)
and in effluent water from a specialty chemicals manufacturing plant at a concentration of
200-230 ppm (Jungclaus et al. 1978). The compound has also been detected in groundwater, leachate,
and run-off waters from landfill sites (Brown and Donnelly 1988; DeWalle and Chian 1981; Gould et
al. 1983; Sawhney and Raabe 1986; Stonebraker and Smith 1980). The concentration of acetone in an
industrial landfill leachate in Michigan was in the range of 0.05 to 62.0 ppm (Brown and Donnelly
1988). However, the quality of the reported data is uncertain. Acetone was detected at a mean
concentration of 56 ppb in a landfill leachate in Orange County, Florida (Hallbourg et al. 1992).
5.4.3 Sediment and Soil
There are few data regarding the level of acetone in soil and sediment. Acetone has been detected in
43% of the soil samples in Superfund sites for which acetone determination has been made so far.
The maximum concentration of acetone in soils from Vega Alta Public Supply well sites in Puerto
Rico was 9,500 ppb (ATSDR 1988). The mean concentration of acetone in soil from Summit
National Site, Ohio, was 9,484 ppb (dry weight) (EPA 1988b). Acetone has been qualitatively
detected in river sediment that received effluents from a specialty chemicals manufacturing plant (Hites
and Lopez-Avila 1980). A concentration of 6 ppb µg/kg) acetone was detected in the sediment of a
creek adjacent to a landfill in Louisville, Kentucky (Stonebraker and Smith 1980). Because of its high
water solubility and low sediment adsorption coefficient, most acetone in an aquatic system will be
found in water, rather than in sediment.

ACETONE 190
5. POTENTIAL FOR HUMAN EXPOSURE
5.4.4 Other Environmental Media
Acetone has been qualitatively detected as a volatile component of a number of foods including blue
cheese (Day and Anderson 1965), baked potatoes (Coleman et al. 1981), roasted filbert nuts (Kinlin et
al. 1972), meat (Grey and Shrimpton 1967; Shahidi et al. 1986), and nectarines (Takeoka et al. 1988).
In a study carried out in Czechoslovakia, the concentrations of acetone in samples of milk and cream
culture were 79.5 and 0.11 mg/l00 kg, respectively (Palo and Ilkova 1970). Acetone also has been
qualitatively detected in breast milk of working mothers, although the study did not identify whether
the concentrations of acetone were higher than normal physiologic levels (Giroux et al. 1992).
Acetone has been qualitatively detected in 8 of 12 mothers’ milk samples collected from two locations
in New Jersey, Bridgeville, Pennsylvania, and Baton Rouge, Louisiana (Pellizzari et al. 1982). In kiwi
fruit, the acetone concentration comprised 0.2% of total volatile components (Bartley and Schwade
1989). The concentrations of acetone in dry legumes, such as beans (mean of several varieties), split
peas, and lentils were 880, 530, and 230 ppb, respectively (Lovegren et al. 1979). The level of
acetone in headspace volatiles of Bisbee Delicious apples ranged from 111 to 912 pL/kg-hour
(Mattheis et al. 1991). The percent of acetone (of the total) in commercial concentrated aqueous
orange essences ranged from 0.003 to 0.009 (Moshonas and Shaw 1990).
Acetone has been detected in occasional rain samples collected in Hanover, Germany (Levsen et al.
1990). The authors were not sure whether the detection of acetone in the rain water was due to
contamination of samples during analysis. The concentration of combined acetone and acrolein was
0.05 ppm in a rain water sample from Los Angeles, California (Grosjean and Wright 1983). The
investigators could not separate acetone from acrolein by the method used for the determination of
carbonyl compounds.
5.5 GENERAL POPULATION AND OCCUPATIONAL EXPOSURE
Acetone is endogenously produced by all humans. The general population is exposed to acetone by
inhaling ambient air, ingesting food, and drinking water containing acetone. Dermal exposure to
acetone may result from skin contact with certain consumer products (e.g., certain nail polish
removers, paint removers, and household cleaning and waxing products) (see Section 5.2.1). However,
no quantitative data for dermal exposure to acetone from consumer products were located. Assuming
concentrations of acetone are 8.0 ppb (18.99 µg/m3) in indoor air and 6.9 ppb (16.38 ug/m3) in outdoor

ACETONE 191
5. POTENTIAL FOR HUMAN EXPOSURE
air (Shah and Singh 1988) and that a person inhales 15 m3/day of indoor air and 5 m3/day of outdoor
air, the estimated inhalation rate of acetone is 0.37 mg/day. No experimental or estimated data were
located regarding the daily intake of acetone in the general population in the United States from
ingestion of drinking water and food. However, if the concentration of acetone in drinking water is <1
ppb (see Section 5.4.2), the daily intake for acetone (assuming a person consumes 2 L of drinking
water/day) from this source would be negligible.
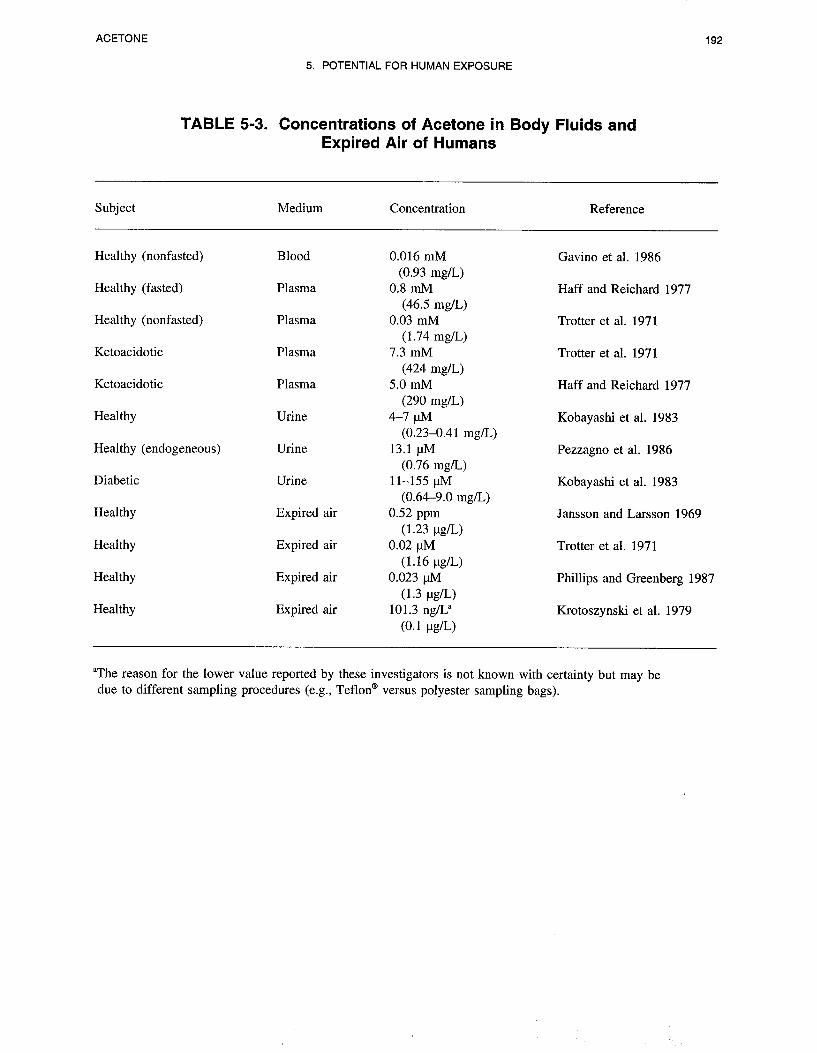
The acetone concentrations in body fluids and expired air of healthy and diabetic patients are given in
Table 5-3. The concentration of acetone in whole blood does not differ from that in plasma (Gavin0
et al. 1986). Even in healthy subjects, the level of acetone in blood/plasma varies with fasting or
nonfasting conditions and depends on the weight of the subject. Generally, the blood/plasma acetone
concentrations are higher in fasted than nonfasted subjects and higher in subjects who are not obese,
compared to obese subjects (Haff and Reichard 1977).
Workers in industries that manufacture and use acetone can be exposed to much higher concentrations
of acetone than the general population. For example, the concentrations of acetone in the breathing
zone air in a paint factory, a plastics factory, and an artificial fiber factory in Italy were >3.48 mg/m3
(Pezzagno et al. 1986). The concentration of acetone in the breathing zone air of a fiber-reinforced
plastic plant in Japan, where bathtubs were produced, was <108 mg/m3 (Kawai et al. 1990a). The
inhalation exposure for workers to acetone in a shoe factory in Finland ranged from 25.4 to
393.4 mg/m3 (Ahonen and Schimberg 1988). Concentrations of acetone in the breathing zone air in
shoe factories in Italy were also high (Brugnone et al. 1978). The concentration of acetone in the
breathing zone air of a solvent recycling plant in the United States ranged from not detected to
43 mg/m3 (Kupferachmid and Perkin 1986). High levels of acetone were detected in the occupational
air in other industries including chemical, plastic button, and paint manufacturing industries in Italy
(Ghittori et al. 1987). Isopropyl alcohol is known to oxidize in the liver and is converted to acetone
(Kawai et al. 1990b). Therefore, occupational exposure (printing plants) or accidental ingestion of
isopropyl alcohol also produce acetone in expired air, blood, and urine. The National Occupational
Exposure Survey (NOES) statistically estimated that 1.51 million workers were potentially exposed to
acetone in the United States in 1980 (NIOSH 1989). The NOES database does not contain data on the
frequency, duration, concentration, or route of exposure of workers to chemicals.
ACETONE 193
5. POTENTIAL FOR HUMAN EXPOSURE
5.6 POPULATIONS WITH POTENTIALLY HIGH EXPOSURES
Workers in industries that manufacture or use acetone are one segment of the population at an
especially high risk of acetone exposure compared to the general population (see Section 5.5).
Professional painters and commercial and household cleaners (certain detergents, cleansers, waxes, or
polishes contain acetone) are also likely to be exposed to acetone at higher concentrations than the
general population, although experimental data regarding the extent of exposures for this segment of
workers were not located. Among the general population, high exposure to acetone may occur among
several subgroups. Cigarette smoke contains <0.54 mg acetone/cigarette (Manning et al. 1983);
therefore, smokers are exposed to higher concentrations of acetone than nonsmokers. The content of
acetone in certain nail polish removers is high; therefore, individuals who frequently use nail polish
removers are exposed to higher levels of acetone than the general population. People who live near
landfill sites that emit acetone or those who live near industrial sources of emission (e.g., refinery,
incinerator, close to high vehicular traffic areas) are also susceptible to higher exposure concentrations
of acetone than the general population that does not reside near these sites. People who consume
contaminated well water (see Section 5.4.2) as drinking water are subject to high exposures. People
who consume food containing acetone excessively would also be subject to high exposure, especially
if associated with other risks.
5.7 ADEQUACY OF THE DATABASE
Section 104(i)(5) of CERCLA, as amended, directs the Administrator of ATSDR (in consultation with
the Administrator of EPA and agencies and programs of the Public Health Service) to assess whether
adequate information on the health effects of acetone is available. Where adequate information is not
available, ATSDR, in conjunction with the NTP, is required to assure the initiation of a program of
research designed to determine the health effects (and techniques for developing methods to determine
such health effects) of acetone.
The following categories of possible data needs have been identified by a joint team of scientists from
ATSDR, NTP, and EPA. They are defined as substance-specific informational needs that if met would
reduce the uncertainties of human health assessment. This definition should not be interpreted to mean
that all data needs discussed in this section must be filled. In the future, the identified data needs will
be evaluated and prioritized, and a substance-specific research agenda will be proposed.
ACETONE 194
5. POTENTIAL FOR HUMAN EXPOSURE
5.7.1 Identification of Data Needs
Physical and Chemical Properties. Information regarding the physical and chemical properties
of acetone necessary to predict its environmental fate and transport processes in the environment is
available (see Table 3-2). However, experimental determination of a value for the soil sorption
coefficient of acetone from water would be helpful in assessing the potential for leaching and volatility
of acetone in different soils.
Production, Import/Export, Use, Release, and Disposal. Data regarding the past and present
production volume for acetone and the projected future trend (increase/decrease) in the production
volume are known (CMR 1990). In 1990, the reported total production volume of acetone in the
United States was 2,330 million pounds (USITC 1991). Recent export and import data for acetone
would be helpful. The use pattern of acetone is known. Acetone is present in several household
consumer products, but by far a larger amount of acetone is used in industry. Acetone is naturally
present in many fruits and vegetables, and there is no information available to indicate that acetone is
present in food as a contaminant, due to food processing or packaging. Air is the most likely
environmental medium in which significant quantities of acetone contamination will occur during its
production and use (TRI90 1992). More data on the rate of acetone release from household consumer
products would be useful. The regulations governing the disposal of acetone are well defined.
However, more information about the proportion of discarded acetone recovered from recycling, and
the proportion lost due to evaporation, ground burial, and incineration would be useful in determining
the relative importance of the different routes of exposure.
According to the Emergency Planning and Community Right-to-Know Act of 1986, 42 U.S.C. Section
11023, industries are required to submit chemical release and off-site transfer information to the EPA.
The Toxics Release Inventory (TRI), which contains this information for 1988, became available in
May of 1990. This database will be updated yearly and should provide a list of industrial production
facilities and emissions.
Environmental Fate. The environmental fate of acetone, for the most part, has been well studied
(see Section 5.3). Acetone will undergo transport from one environmental medium to another
(Grosjean and Wright 1983; Rathbun et al. 1982). Due to its reasonably long half-life in air (22 days)
(Meyrahn et al. 1986) and restricted volatilization from groundwater, the atmosphere and groundwater

ACETONE 195
5. POTENTIAL FOR HUMAN EXPOSURE
may act as sinks for acetone. More experimental data regarding the rate of sorption and
biodegradation of acetone in soil and its biodegradability in groundwater would be useful to assess the
relative importance of the different fate processes.
Bioavailability from Environmental Media. Acetone is readily absorbed in the lung and
gastrointestinal tract following inhalation and ingestion. Acetone can also be absorbed from the skin
(see Section 2.3). The low value for Koc (see Table 3-2) and a moderate value for Henry’s law
constant (Rathbun and Tai 1987) suggest that bioavailability of acetone from contaminated water and
soil as a result of skin contact may be significant. However, quantitative data regarding the rate and
extent of dermal absorption of acetone from contaminated water and soil are lacking. The high water
solubility and low Koc value for acetone suggest that bioavailability from ingested soil (e.g., children
playing at or near contaminated sites) will be high, but quantitative absorption data are lacking. Data
on bioavailability of acetone from ingested plant food were not located but would be helpful.
Food Chain Bioaccumulation. Acetone does not bioaccumulate in aquatic organisms. There is no
indication of biomagnification of acetone along the aquatic food chain. Studies indicating the potential
for acetone transfer from soil and plants and biomagnification in terrestrial food chains would be
useful to confirm its potential for food chain bioaccumulation.
Exposure Levels in Environmental Media. Data regarding the level of acetone in ambient air
are available (Lagrone 1991; Shah and Singh 1988; Snider and Dawson 1985). There is a paucity of
data regarding the level of acetone in drinking water (Bedding et al. 1982; Coleman et al. 1976; Keith
et al. 1976). More comprehensive data on the levels of acetone in the air and water consumed by
people who live near acetone-containing hazardous waste sites would be useful in estimating the daily
intake from these sources. Although the levels of acetone in the volatile components of several fruits
and vegetables are available (see Section 5.4.4), development of data regarding the level of acetone in
the total diet would be useful. There are few data regarding the level of acetone in background soil
samples.
Reliable monitoring data for the levels of acetone in contaminated media at hazardous waste sites are
needed so that the information obtained on levels of acetone in the environment can be used in
combination with the known body burden of acetone to assess the potential risk of adverse health
effects in populations living in the vicinity of hazardous waste sites.
ACETONE 196
5. POTENTIAL FOR HUMAN EXPOSURE
Exposure Levels in Humans. The levels of acetone in blood/plasma and urine of healthy people,
occupationally exposed groups, and diabetic patients are available (see Table 5-3 and Section 5.5).
However, data on the levels of acetone in body fluids or tissues of general populations living near sites
with higher (than normal) exposure potential (e.g., hazardous waste sites) were not located. This
information is useful for assessing the need to conduct health studies on these populations.
Exposure Registries. No exposure registries for acetone were located. This substance is not
currently one of the compounds for which a subregistry has been established in the National Exposure
Registry. The substance will be considered in the future when chemical selection is made for
subregistries to be established. The information that is amassed in the National Exposure Registry
facilitates the epidemiological research needed to assess adverse health outcomes that may be related
to exposure to this substance.
5.7.2 On-going Studies
No on-going study that would fill the data gaps regarding the transport and fate of acetone in the
environment or that evaluates its exposure potential in general population groups susceptible to higher
levels of exposure was located.
As part of the Third National Health and Nutrition Evaluation Survey, the Environmental Health
Laboratory Sciences Division of the National Center for Environmental Health and Injury Control,
Centers for Disease Control, will be analyzing human blood samples for acetone and other volatile
organic compounds. These data will give an indication of the frequency of occurrence and
background levels of these compounds in the general population.


