
ulster.ac.uk
Accounting Quality and Accountability in Credit Unions in Northern Ireland
David McCullough&
Professor Anne Marie Ward (presenting today)25 June 2018

Project Background – CUs• Credit unions are unique financial institutions. They are co-
operatives that focus on providing credit and savings facilities fortheir membership.
• Northern Ireland Statistics (Bank of England, 2017):• 150 credit unions.• 561,001 persons with member (30.13% of relevant population).• Total assets of £1.6 bn• Member shares of £1.33 bn
• Regulation:• Prudential Regulatory Authority (PRA)• Financial Conduct Authority (FCA)• Credit Unions (Northern Ireland) Order 1985• Companies Act 2006

Project Background - accountability• Why is accountability important to the credit union sector?
• Volunteer members• One member one vote rule• No dominant shareholders or institutional investors• Not listed companies
• Effective discharge of accountability required to provide assuranceover the effective and efficient running of their union.
• “Production of an annual report seen as a major part of the processof discharging accountability by the credit union to those outside itsimmediate management, including members” (Hyndman et al. 2001,p.109).
• Accountability: transparency, equity, democracy, efficiency,responsiveness, and integrity. (Mulgan, 2000, p.555)
Overall aim of the research• Research question:
“Is the annual report effective in discharging accountability?”
• Addressed through 3 research objectives

Research ObjectivesRESEARCH OBJECTIVE ONE:
• Investigate the quality of information provided in the annual reportand financial statements of credit unions and whether the quality wasinfluenced by the financial crisis (year end 2008), transfer ofregulation (year end 2012), and the change of accounting standardsto FRS 102 (year end 2015).
• Two steps:• Design an instrument of quality.• Use of the instrument to measure the quality of the information.
Research ObjectivesRESEARCH OBJECTIVE TWO:
• To investigate the determinants of high quality annual reports in creditunions in Northern Ireland
RESEARCH OBJECTIVE THREE:
• Investigate whether stakeholder accountability requirements arecurrently being discharged by published annual reports and financialstatements or by other means.
• Requires:• Establish the key stakeholders of credit unions in NI.• Determine their accountability needs.• Investigate whether needs are currently being met by credit
unions/annual report.

Overview of key literatures• Research positioned within:
– Stakeholder Theory– Accountability– Accounting Quality

Stakeholder Theory• Hyndman et al. (2004) found that managers viewed members as the
primary stakeholder.
• Study was consistent with prevalent literature on charities(Hyndman, 1991; Connolly and Hyndman, 2013a) that conclude thatdonors/contributors were undoubtedly observed as the mostimportant stakeholder for charities and auditors alike.
Accountability• Accountability is the “requirement to provide evidence that autonomy is
responsibly used and is the price of autonomy”.
• Accountability is intrinsically linked to the requirements of those whodelegate the autonomy i.e. the stakeholders.
• Accountability is defined as “the means by which individuals andorganisations report to a recognised authority and are held responsiblefor their actions” (Edwards and Hulme, 1996, p 967).
• Multiple types of accountabilities for multiple stakeholders (Ebrahim,2003a) and therefore there is a need to account to all stakeholders.
• Multiple accountabilities can lead to “over accounting” to multipledemands of “under accounting” in that each stakeholder is assumingthat others are monitoring the actions and results. (Edwards and Hulme,1995).
Accounting Quality• Link to the requirement of quality: without quality the discharge of
accountability may be ineffective.
• Quality is subjective and often depends on the actors involved in thesituation.
• “Usefulness of financial statements to investors, creditors, managers,and all other parties contracting with the firm” (Ball and Shivakumar,2005).
• Usefulness: empowering users to make judgements aboutaccounting information (Power, 2013).

Accounting Quality• No general agreement as to how accounting quality should be
measured (Hribar et al., 2014).• Earnings management• Disclosure quality

Methodology• Influences on current financial statements – create an analytical
model – 3 layers of accountability.

Analytical modelDischarge of accountability in annual reports
Statutory requirements
Accounting standards
Other information
Predominately the Regulator – sets out legal Disclosure requirements (CA, CU Order, CREDS)
Typically focus on investors and loan Creditors (Framework)
Members and other stakeholders
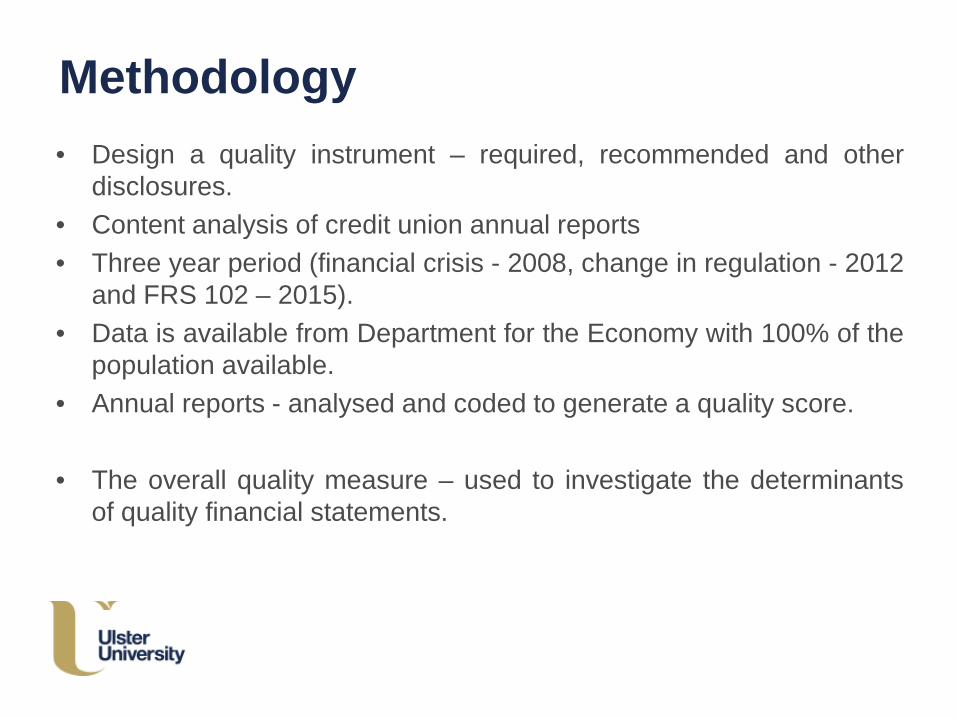
Methodology• Design a quality instrument – required, recommended and other
disclosures.• Content analysis of credit union annual reports• Three year period (financial crisis - 2008, change in regulation - 2012
and FRS 102 – 2015).• Data is available from Department for the Economy with 100% of the
population available.• Annual reports - analysed and coded to generate a quality score.
• The overall quality measure – used to investigate the determinantsof quality financial statements.
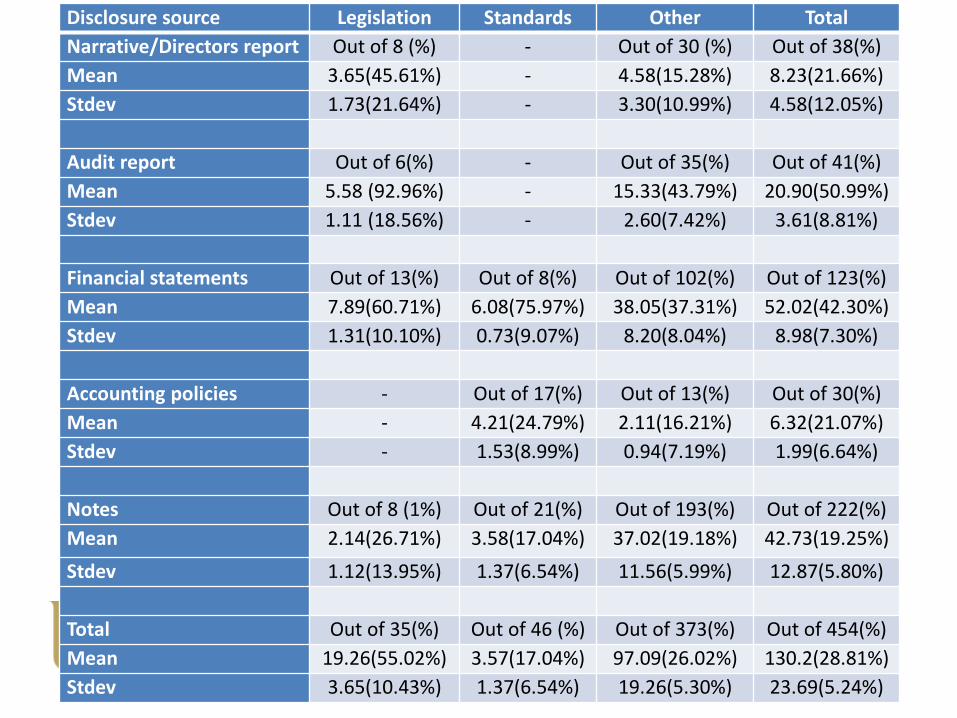
Disclosure source Legislation Standards Other TotalNarrative/Directors report Out of 8 (%) - Out of 30 (%) Out of 38(%)Mean 3.65(45.61%) - 4.58(15.28%) 8.23(21.66%)Stdev 1.73(21.64%) - 3.30(10.99%) 4.58(12.05%)
Audit report Out of 6(%) - Out of 35(%) Out of 41(%)Mean 5.58 (92.96%) - 15.33(43.79%) 20.90(50.99%)Stdev 1.11 (18.56%) - 2.60(7.42%) 3.61(8.81%)
Financial statements Out of 13(%) Out of 8(%) Out of 102(%) Out of 123(%)Mean 7.89(60.71%) 6.08(75.97%) 38.05(37.31%) 52.02(42.30%)Stdev 1.31(10.10%) 0.73(9.07%) 8.20(8.04%) 8.98(7.30%)
Accounting policies - Out of 17(%) Out of 13(%) Out of 30(%)Mean - 4.21(24.79%) 2.11(16.21%) 6.32(21.07%)Stdev - 1.53(8.99%) 0.94(7.19%) 1.99(6.64%)
Notes Out of 8 (1%) Out of 21(%) Out of 193(%) Out of 222(%)Mean 2.14(26.71%) 3.58(17.04%) 37.02(19.18%) 42.73(19.25%)Stdev 1.12(13.95%) 1.37(6.54%) 11.56(5.99%) 12.87(5.80%)
Total Out of 35(%) Out of 46 (%) Out of 373(%) Out of 454(%)Mean 19.26(55.02%) 3.57(17.04%) 97.09(26.02%) 130.2(28.81%)Stdev 3.65(10.43%) 1.37(6.54%) 19.26(5.30%) 23.69(5.24%)
Methodology
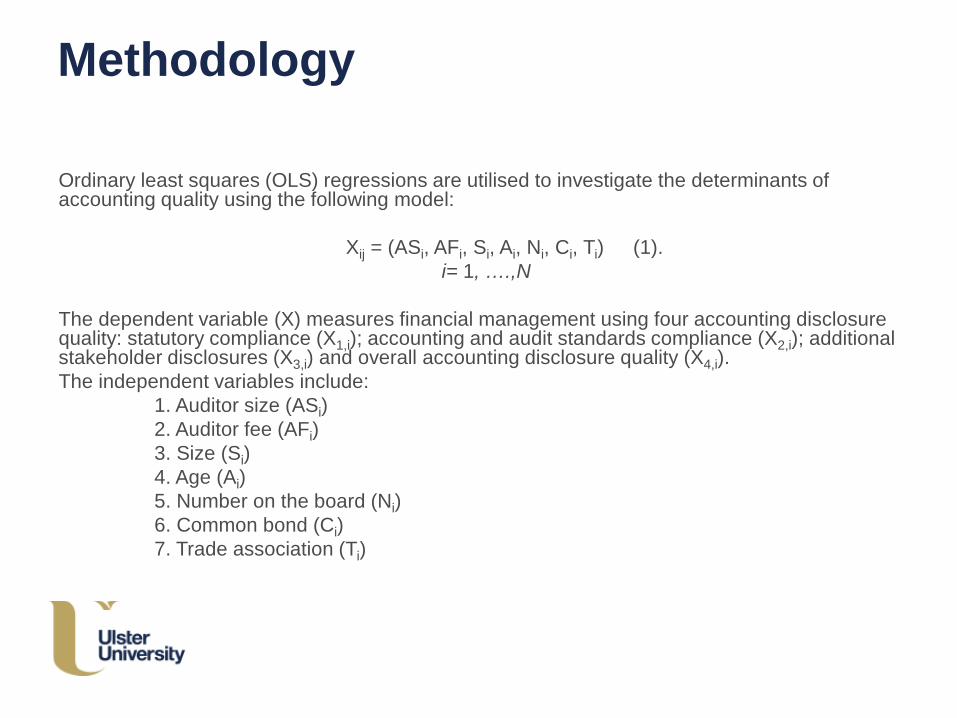
Ordinary least squares (OLS) regressions are utilised to investigate the determinants of accounting quality using the following model:
Xij = (ASi, AFi, Si, Ai, Ni, Ci, Ti) (1).i= 1, ….,N
The dependent variable (X) measures financial management using four accounting disclosure quality: statutory compliance (X1,i); accounting and audit standards compliance (X2,i); additional stakeholder disclosures (X3,i) and overall accounting disclosure quality (X4,i). The independent variables include:
1. Auditor size (ASi)2. Auditor fee (AFi) 3. Size (Si)4. Age (Ai)5. Number on the board (Ni)6. Common bond (Ci) 7. Trade association (Ti)

ulster.ac.uk
Results

Regression Legislation Standards Other Total
Observations 161 161 161 161Constant 21.85* 26.66** 3.29 6.96
(1.89) (4.17) (0.68) (1.44)Auditor (Medium) 1.27 1.67* 0.45 0.63
(0.78) (1.86) (0.67) (0.93)Auditor (Large) 1.91*** 8.21*** 1.62 2.97*
(2.97) (4.04) (1.06) (1.93)Audit fee (% of income) 0.30 -0.10 -0.05 -0.03
(1.28) (-0.78) (-0.57) (-0.33)Size (log of total assets) 2.14** 0.30 1.63*** 1.53***
(2.86) (0.73) (5.23) (4.88)Trade association (UFCU) 1.28 -0.34 -2.61*** -2.08***
(0.70) (-0.34) (-3.43) (-2.71)Trade association (Other) 3.49 1.99 0.64 0.99
(1.24) (1.27) (0.54) (0.83)R-squared –Within 0.11 0.13 0.46 0.42F-stat (Chi2) 4.31 4.89 23.75 19.93
(0.000) (0.000) (0.000) (0.000)
Robust t-statistics are in parentheses: * p<0.1; ** p<0.05; ***p<0.01

Regression Directors report
Audit report
Financial statements
Accounting policies
Notes
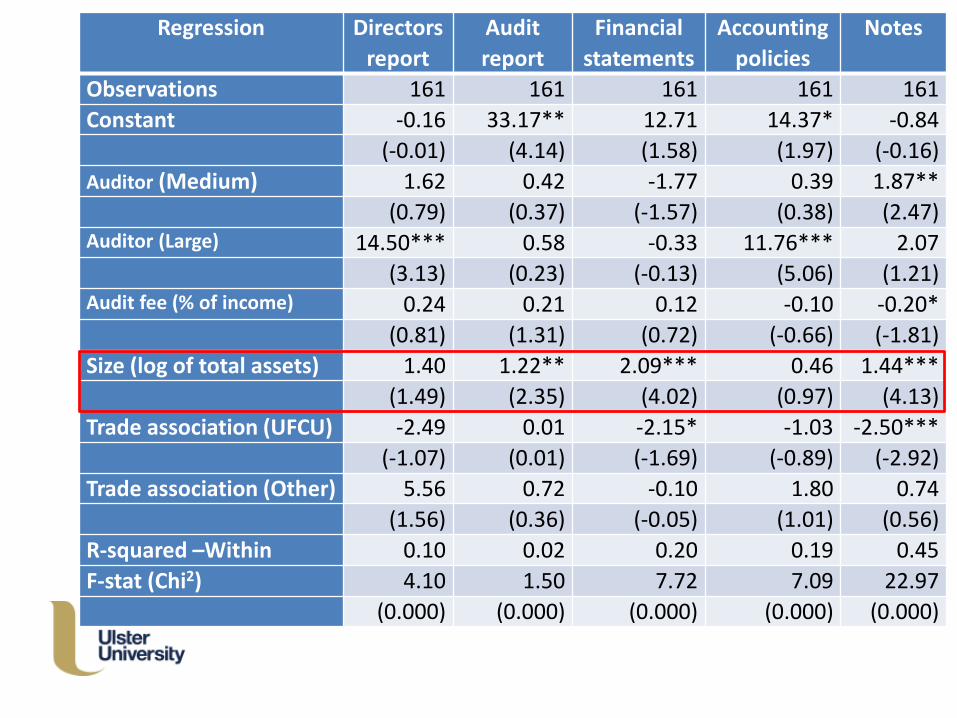
Observations 161 161 161 161 161Constant -0.16 33.17** 12.71 14.37* -0.84
(-0.01) (4.14) (1.58) (1.97) (-0.16)Auditor (Medium) 1.62 0.42 -1.77 0.39 1.87**
(0.79) (0.37) (-1.57) (0.38) (2.47)Auditor (Large) 14.50*** 0.58 -0.33 11.76*** 2.07
(3.13) (0.23) (-0.13) (5.06) (1.21)Audit fee (% of income) 0.24 0.21 0.12 -0.10 -0.20*
(0.81) (1.31) (0.72) (-0.66) (-1.81)Size (log of total assets) 1.40 1.22** 2.09*** 0.46 1.44***
(1.49) (2.35) (4.02) (0.97) (4.13)Trade association (UFCU) -2.49 0.01 -2.15* -1.03 -2.50***
(-1.07) (0.01) (-1.69) (-0.89) (-2.92)Trade association (Other) 5.56 0.72 -0.10 1.80 0.74
(1.56) (0.36) (-0.05) (1.01) (0.56)R-squared –Within 0.10 0.02 0.20 0.19 0.45F-stat (Chi2) 4.10 1.50 7.72 7.09 22.97
(0.000) (0.000) (0.000) (0.000) (0.000)
Regression Directors report
Audit report
Financial statements
Accounting policies
Notes
Observations 161 161 161 161 161Constant -0.16 33.17** 12.71 14.37* -0.84
(-0.01) (4.14) (1.58) (1.97) (-0.16)Auditor (Medium) 1.62 0.42 -1.77 0.39 1.87**
(0.79) (0.37) (-1.57) (0.38) (2.47)Auditor (Large) 14.50*** 0.58 -0.33 11.76*** 2.07
(3.13) (0.23) (-0.13) (5.06) (1.21)Audit fee (% of income) 0.24 0.21 0.12 -0.10 -0.20*
(0.81) (1.31) (0.72) (-0.66) (-1.81)Size (log of total assets) 1.40 1.22** 2.09*** 0.46 1.44***
(1.49) (2.35) (4.02) (0.97) (4.13)Trade association (UFCU) -2.49 0.01 -2.15* -1.03 -2.50***
(-1.07) (0.01) (-1.69) (-0.89) (-2.92)Trade association (Other) 5.56 0.72 -0.10 1.80 0.74
(1.56) (0.36) (-0.05) (1.01) (0.56)R-squared –Within 0.10 0.02 0.20 0.19 0.45F-stat (Chi2) 4.10 1.50 7.72 7.09 22.97
(0.000) (0.000) (0.000) (0.000) (0.000)
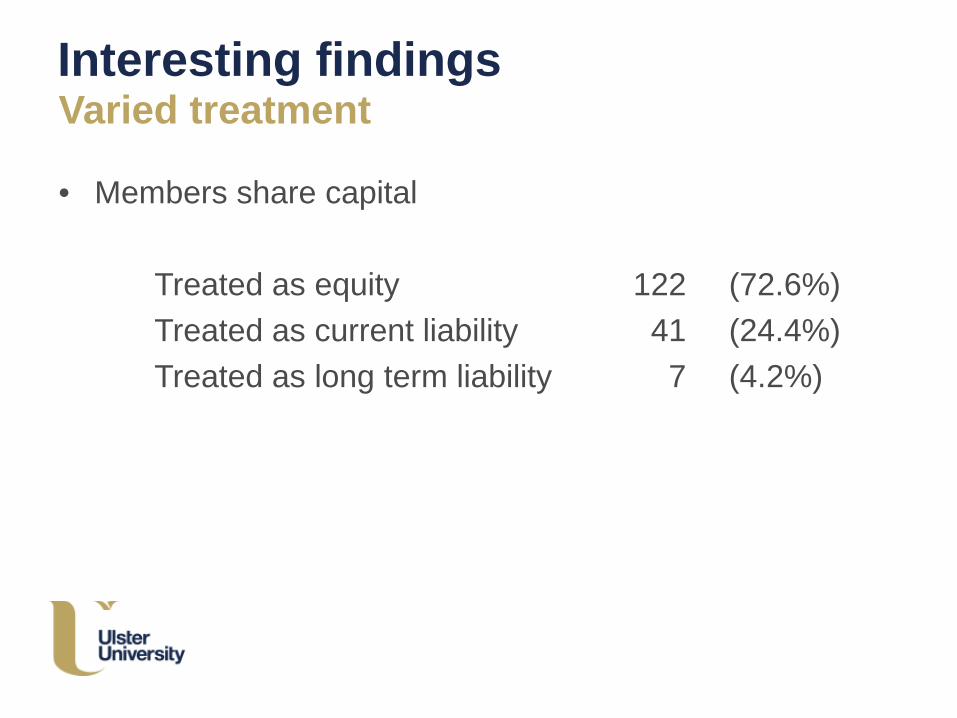
Interesting findingsVaried treatment
• Members share capital
Treated as equity 122 (72.6%)Treated as current liability 41 (24.4%)Treated as long term liability 7 (4.2%)
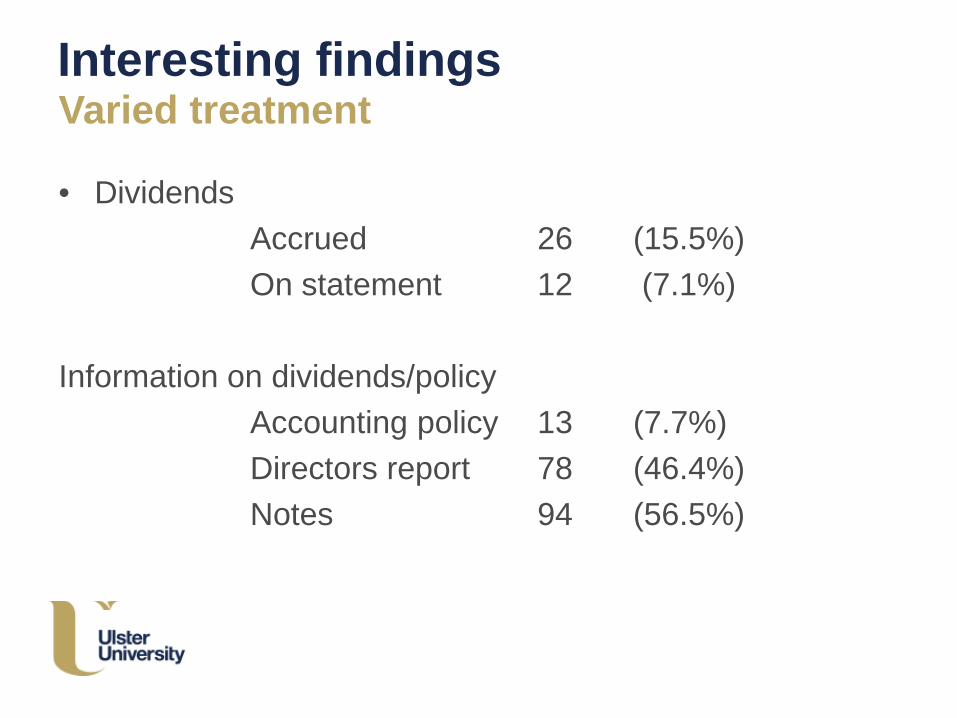
Interesting findingsVaried treatment
• DividendsAccrued 26 (15.5%)On statement 12 (7.1%)
Information on dividends/policyAccounting policy 13 (7.7%)Directors report 78 (46.4%)Notes 94 (56.5%)
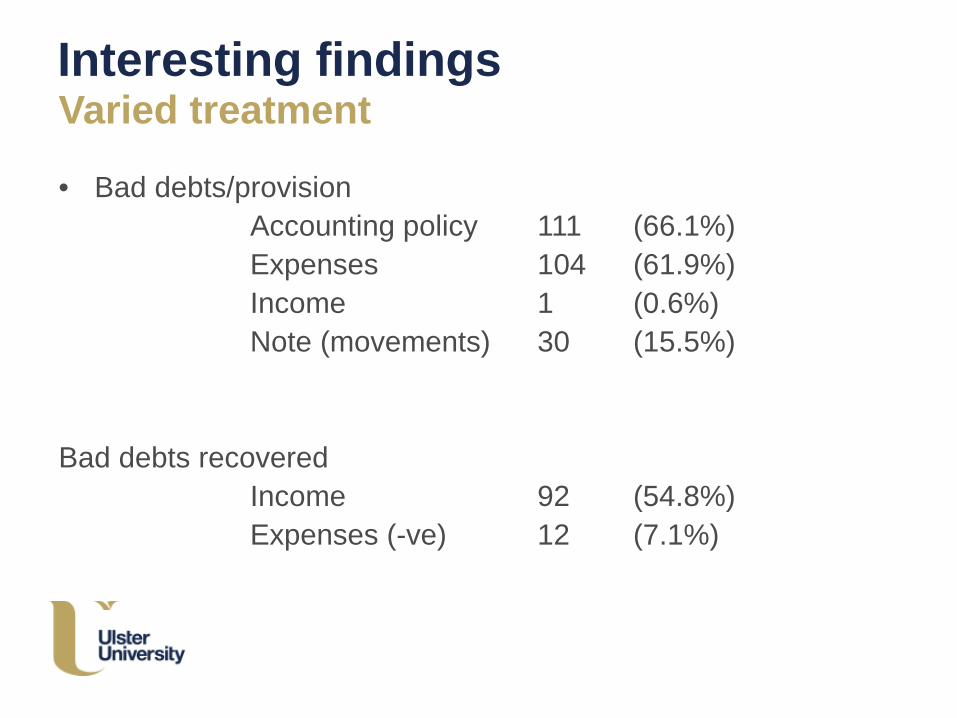
Interesting findingsVaried treatment
• Bad debts/provisionAccounting policy 111 (66.1%)Expenses 104 (61.9%)Income 1 (0.6%)Note (movements) 30 (15.5%)
Bad debts recoveredIncome 92 (54.8%)Expenses (-ve) 12 (7.1%)

Interesting findingsVaried treatment
• Other
• Audit fee 34 (20.2%)• Loans to member note 84 (50%)

Conclusion (preliminary)
• Auditor size is important (auditor quality)• Size – resources are important? (staff or budget)• Trade association is important (guidance/training/support)
• Some not complying with legislation • Variation in treatment
• Our view – SORP required – guidance required – aid preparers – improve comparability and usefulness of annual reports as stakeholders typically have an input to the process.

Questions


