
This report highlights results from the Fall 2010 Beginning of Grade New England Common Assessment Program (NECAP) tests. The NECAP tests are administered to students in Maine, New Hampshire, Rhode Island, and Vermont as part of each state’s statewide assessment program. NECAP test results are used primarily for school improvement and accountability. Achievement level results are used in the state accountability system required under No Child Left Behind (NCLB). More detailed school and district results are used by schools to help improve curriculum and instruction. Individual student results are used to support information gathered through classroom instruction and assessments.
NECAP tests in reading and mathematics are administered to students in grades 3 through 8 and writing tests are administered to students in grades 5 and 8. The NECAP tests are designed to measure student performance on grade level expectations (GLE) developed and adopted by the four states. Specifi cally, the tests are designed to measure the content and skills that students are expected to have as they begin the school year in their current grade—in other words, the content and skills that students have learned through the end of the previous grade.
Each test contains a mix of multiple-choice and constructed-response questions. Constructed-response questions require students to develop their own answers to
questions. On the mathematics test, students may be required
to provide the correct answer to a computation
or word problem, draw or interpret a chart or graph, or explain how they solved a problem. On the reading test, students may be
required to make a list or write a few paragraphs to
answer a question related to a literary or informational
passage. On the writing test, students are required to provide
a single extended response of 1–3 pages and three shorter responses to questions measuring different types of writing.
This report contains a variety of school- and/or district-, and state-level assessment results for the NECAP tests administered at a grade level. Achievement level distributions and mean scaled scores are provided for all students tested as well as for subgroups of students classifi ed by demographics or program participation. The report also contains comparative information on school and district performance on subtopics within each content area tested.
In addition to this report of grade level results, schools and districts will also receive Summary Reports, Item Analysis Reports, Released Item support materials, and student-level data fi les containing NECAP results. Together, these reports and data constitute a rich source of information to support local decisions in curriculum, instruction, assessment, and professional development. Over time, this information can also strengthen schools’ and districts’ evaluation of their ongoing improvement efforts.
About The New England Common Assessment Program
Fall 2010Beginning of Grade 7
NECAP Tests
Grade 7 Students in 2010-2011
School ResultsSchool: King Middle School
District: Portland Public Schools
Code: 1134-1353

Grade Level Summary Report
Fall 2010 - Beginning of Grade 7 NECAP TestsGrade 7 Students in 2010-2011
School: King Middle SchoolDistrict: Portland Public SchoolsState: MaineCode: 1134-1353
PARTICIPATION in NECAPNumber Percentage
School District State School District State
Students enrolled on or after October 1
184 518 14,420 100 100 100
Students testedWith an approved accommodation
Current LEP StudentsWith an approved accommodation
IEP StudentsWith an approved accommodation
Students not tested in NECAPState Approved
Alternate AssessmentFirst Year LEPWithdrew After October 1Enrolled After October 1Special Consideration
Other
Reading Math Writing Reading Math Writing Reading Math Writing Reading Math Writing Reading Math Writing Reading Math Writing
165 178 478 501 14,013 14,044 90 97 92 97 97 9756 69 122 144 2,161 2,197 34 39 26 29 15 16
37 50 103 126 316 361 22 28 22 25 2 329 42 57 79 149 188 78 84 55 63 47 52
20 20 79 79 2,139 2,129 12 11 17 16 15 1517 17 58 58 1,723 1,725 85 85 73 73 81 81
19 6 40 17 407 376 10 3 8 3 3 319 6 34 11 297 247 100 100 85 65 73 666 6 9 9 225 219 32 100 26 82 76 8913 0 23 0 46 0 68 0 68 0 15 00 0 0 0 0 0 0 0 0 0 0 00 0 0 0 0 0 0 0 0 0 0 00 0 2 2 26 28 0 0 6 18 9 110 0 6 6 110 129 0 0 15 35 27 34
Level 4 = Profi cient with Distinction; Level 3 = Profi cient; Level 2 = Partially Profi cient; Level 1 = Substantially Below Profi cient Note: Throughout this report, percentages may not total 100 since each percentage is rounded to the nearest whole number.Note: Some numbers may have been left blank because fewer than ten (10) students were tested.
School District State
Enrolled NT
Approved NT
Other Tested Level 4 Level 3 Level 2 Level 1 Mean
ScaledScore
TestedLevel
4Level
3Level
2Level
1MeanScaledScore
TestedLevel
4Level
3Level
2Level
1MeanScaledScore
N N N N N % N % N % N % N % % % % N % % % %
REA
DIN
G
184 19 0 165 47 28 79 48 19 12 20 12 751 478 17 50 20 13 746 14,013 11 55 24 10 745
MAT
H
184 6 0 178 41 23 72 40 28 16 37 21 743 501 15 38 20 27 740 14,044 16 42 21 20 742
WRI
TIN
G
NECAP RESULTS
Page 2 of 6
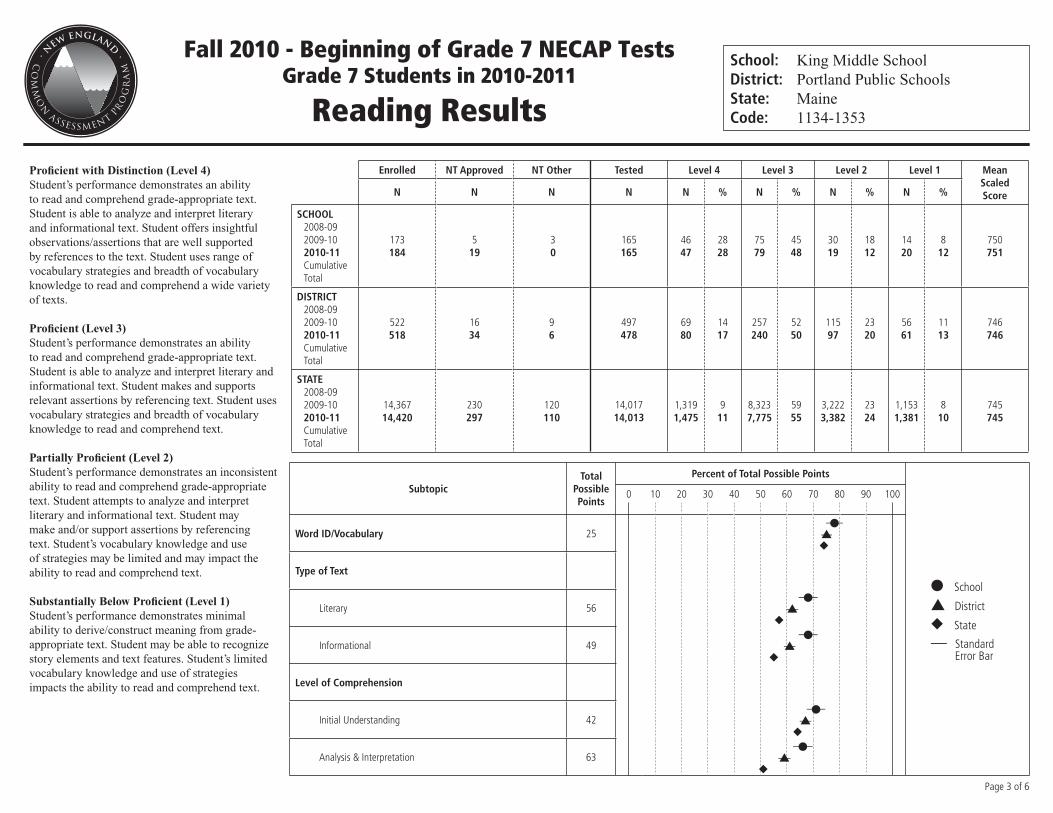
Reading Results
SubtopicTotal
Possible Points
Percent of Total Possible Points
● School
▲ District
◆ State
— Standard Error Bar
0 10 20 30 40 50 60 70 80 90 100
Word ID/Vocabulary 25
Type of Text
Literary 56
Informational 49
Level of Comprehension
Initial Understanding 42
Analysis & Interpretation 63
●▲◆
Profi cient with Distinction (Level 4)Student’s performance demonstrates an ability to read and comprehend grade-appropriate text. Student is able to analyze and interpret literary and informational text. Student offers insightful observations/assertions that are well supported by references to the text. Student uses range of vocabulary strategies and breadth of vocabulary knowledge to read and comprehend a wide variety of texts.
Profi cient (Level 3)Student’s performance demonstrates an ability to read and comprehend grade-appropriate text. Student is able to analyze and interpret literary and informational text. Student makes and supports relevant assertions by referencing text. Student uses vocabulary strategies and breadth of vocabulary knowledge to read and comprehend text.
Partially Profi cient (Level 2)Student’s performance demonstrates an inconsistent ability to read and comprehend grade-appropriate text. Student attempts to analyze and interpret literary and informational text. Student may make and/or support assertions by referencing text. Student’s vocabulary knowledge and use of strategies may be limited and may impact the ability to read and comprehend text.
Substantially Below Profi cient (Level 1)Student’s performance demonstrates minimal ability to derive/construct meaning from grade-appropriate text. Student may be able to recognize story elements and text features. Student’s limited vocabulary knowledge and use of strategies impacts the ability to read and comprehend text.
●▲
◆
●▲
◆
●▲
◆
●▲
◆
School: King Middle SchoolDistrict: Portland Public SchoolsState: MaineCode: 1134-1353
Fall 2010 - Beginning of Grade 7 NECAP TestsGrade 7 Students in 2010-2011
Page 3 of 6
Enrolled NT Approved NT Other Tested Level 4 Level 3 Level 2 Level 1 Mean Scaled ScoreN N N N N % N % N % N %
SCHOOL2008-092009-102010-11CumulativeTotal
173184
519
30
165165
4647
2828
7579
4548
3019
1812
1420
812
750751
DISTRICT2008-092009-102010-11CumulativeTotal
522518
1634
96
497478
6980
1417
257240
5250
11597
2320
5661
1113
746746
STATE2008-092009-102010-11CumulativeTotal
14,36714,420
230297
120110
14,01714,013
1,3191,475
911
8,3237,775
5955
3,2223,382
2324
1,1531,381
810
745745

Disaggregated Reading Results
REPORTING CATEGORIES
School District State
EnrolledNT
ApprovedNT
OtherTested Level 4 Level 3 Level 2 Level 1 Mean
ScaledScore
TestedLevel
4Level
3Level
2Level
1MeanScaledScore
TestedLevel
4Level
3Level
2Level
1MeanScaledScore
N N N N N % N % N % N % N % % % % N % % % %
All Students
GenderMaleFemaleNot Reported
Race/EthnicityHispanic or LatinoNot Hispanic or Latino
American Indian or Alaskan NativeAsianBlack or African AmericanNative Hawaiian or Pacifi c Islander WhiteTwo or more races
No Race/Ethnicity Reported
LEP StatusCurrent LEP studentFormer LEP student - monitoring year 1Former LEP student - monitoring year 2All Other Students
IEPStudents with an IEPAll Other Students
SESEconomically Disadvantaged StudentsAll Other Students
MigrantMigrant StudentsAll Other Students
Title IStudents Receiving Title I ServicesAll Other Students
504 PlanStudents with a 504 PlanAll Other Students
184
88960
10
127420
10400
5231
128
26158
10678
0184
1759
3181
19
1090
0
05100400
15004
613
181
019
181
019
0
000
0
0000000
0000
00
00
00
00
00
165
78870
10
122320
10000
3731
124
20145
8877
0165
1578
3162
47
1829
1
32
41
0
46
146
839
47
47
47
28
2333
10
146
41
0
37
532
951
28
30
29
79
3940
5
1313
47
17
59
376
4633
79
73
77
48
5046
50
5941
47
46
48
1552
5243
48
46
48
19
109
4
28
5
8
11
910
172
19
19
18
12
1310
40
925
5
22
9
457
193
12
12
11
20
119
0
49
7
12
8
713
173
20
18
20
12
1410
0
1828
7
32
6
359
194
12
11
12
751
749752
747
748738
756
736
755
733753
743759
751
751
751
478
2392390
20
153840
32000
10383
364
79399
253225
0478
192286
7471
17
1024
10
82
23
0
21
120
629
17
2412
17
50
5249
40
4933
55
33
54
2455
4160
50
4057
50
20
2317
40
2631
15
32
18
4715
328
20
2219
20
13
1510
10
1733
7
35
7
2810
223
13
1412
13
746
744749
743
743734
750
734
749
733749
740754
746
748745
746
14,013
7,0886,924
1
195
157180341
713,031
1011
3162512
13,660
2,13911,874
6,0167,997
614,007
1,43812,575
30913,704
11
615
7
10183
114
1164211
<112
415
11
411
711
55
5358
46
514639
5654
31805856
2062
4762
56
3957
5655
24
2820
36
222732
2428
364024
4121
3218
24
4222
2824
10
137
11
17926
914
32009
395
165
10
159
810
745
742747
741
743746737
745742
734753758745
732747
740748
745
739745
743745
Page 4 of 6
School: King Middle SchoolDistrict: Portland Public SchoolsState: MaineCode: 1134-1353
Fall 2010 - Beginning of Grade 7 NECAP TestsGrade 7 Students in 2010-2011
Level 4 = Profi cient with Distinction; Level 3 = Profi cient; Level 2 = Partially Profi cient; Level 1 = Substantially Below Profi cient
Note: Some numbers may have been left blank because fewer than ten (10) students were tested.

Mathematics Results
Page 5 of 6
Fall 2010 - Beginning of Grade 7 NECAP TestsGrade 7 Students in 2010-2011
SubtopicTotal
Possible Points
Percent of Total Possible Points
● School
▲ District
◆ State
— Standard Error Bar
0 10 20 30 40 50 60 70 80 90 100
Numbers & Operations 47
Geometry & Measurement 39
Functions & Algebra 48
Data, Statistics, & Probability 25
●▲
◆
●▲◆
●▲
◆
●▲◆
Profi cient with Distinction (Level 4)Student’s problem solving demonstrates logical reasoning with strong explanations that include both words and proper mathematical notation. Student’s work exhibits a high level of accuracy, effective use of a variety of strategies, and an understanding of mathematical concepts within and across grade level expectations. Student demonstrates the ability to move from concrete to abstract representations.
Profi cient (Level 3)Student’s problem solving demonstrates logical reasoning with appropriate explanations that include both words and proper mathematical notation. Student uses a variety of strategies that are often systematic. Computational errors do not interfere with communicating understanding. Student demonstrates conceptual understanding of most aspects of the grade level expectations.
Partially Profi cient (Level 2)Student’s problem solving demonstrates logical reasoning and conceptual understanding in some, but not all, aspects of the grade level expectations. Many problems are started correctly, but computational errors may get in the way of completing some aspects of the problem. Student uses some effective strategies. Student’s work demonstrates that he or she is generally stronger with concrete than abstract situations.
Substantially Below Profi cient (Level 1)Student’s problem solving is often incomplete, lacks logical reasoning and accuracy, and shows little conceptual understanding in most aspects of the grade level expectations. Student is able to start some problems but computational errors and lack of conceptual understanding interfere with solving problems successfully.
School: King Middle SchoolDistrict: Portland Public SchoolsState: MaineCode: 1134-1353
Enrolled NT Approved NT Other Tested Level 4 Level 3 Level 2 Level 1 Mean Scaled ScoreN N N N N % N % N % N %
SCHOOL2008-092009-102010-11CumulativeTotal
173184
36
00
170178
3441
2023
6672
3940
3728
2216
3337
1921
743743
DISTRICT2008-092009-102010-11CumulativeTotal
522518
1111
46
507501
8173
1615
184191
3638
105100
2120
137137
2727
741740
STATE2008-092009-102010-11CumulativeTotal
14,36714,420
212247
116129
14,03914,044
2,6032,310
1916
5,7255,892
4142
2,8222,990
2021
2,8892,852
2120
742742
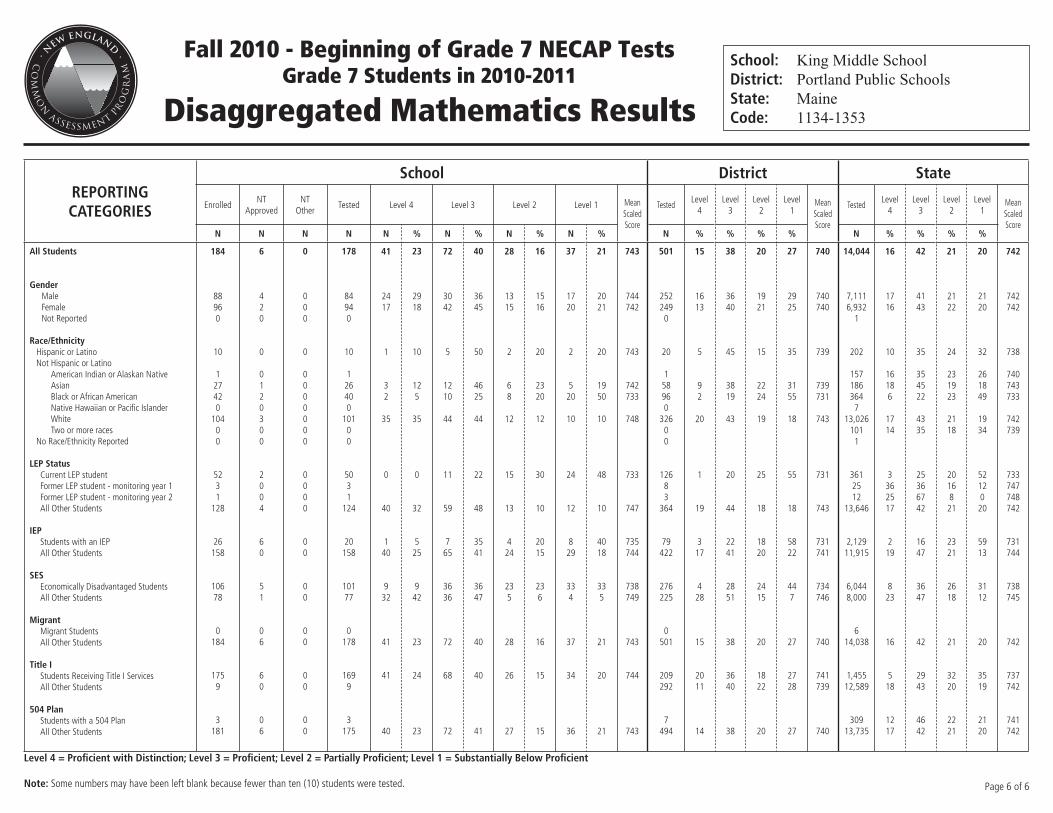
Disaggregated Mathematics Results
REPORTING CATEGORIES
School District State
EnrolledNT
ApprovedNT
OtherTested Level 4 Level 3 Level 2 Level 1 Mean
ScaledScore
TestedLevel
4Level
3Level
2Level
1MeanScaledScore
TestedLevel
4Level
3Level
2Level
1MeanScaledScore
N N N N N % N % N % N % N % % % % N % % % %
All Students
GenderMaleFemaleNot Reported
Race/EthnicityHispanic or LatinoNot Hispanic or Latino
American Indian or Alaskan NativeAsianBlack or African AmericanNative Hawaiian or Pacifi c Islander WhiteTwo or more races
No Race/Ethnicity Reported
LEP StatusCurrent LEP studentFormer LEP student - monitoring year 1Former LEP student - monitoring year 2All Other Students
IEPStudents with an IEPAll Other Students
SESEconomically Disadvantaged StudentsAll Other Students
MigrantMigrant StudentsAll Other Students
Title IStudents Receiving Title I ServicesAll Other Students
504 PlanStudents with a 504 PlanAll Other Students
184
88960
10
127420
10400
5231
128
26158
10678
0184
1759
3181
6
420
0
0120300
2004
60
51
06
60
06
0
000
0
0000000
0000
00
00
00
00
00
178
84940
10
126400
10100
5031
124
20158
10177
0178
1699
3175
41
2417
1
32
35
0
40
140
932
41
41
40
23
2918
10
125
35
0
32
525
942
23
24
23
72
3042
5
1210
44
11
59
765
3636
72
68
72
40
3645
50
4625
44
22
48
3541
3647
40
40
41
28
1315
2
68
12
15
13
424
235
28
26
27
16
1516
20
2320
12
30
10
2015
236
16
15
15
37
1720
2
520
10
24
12
829
334
37
34
36
21
2021
20
1950
10
48
10
4018
335
21
20
21
743
744742
743
742733
748
733
747
735744
738749
743
744
743
501
2522490
20
158960
32600
12683
364
79422
276225
0501
209292
7494
15
1613
5
92
20
1
19
317
428
15
2011
14
38
3640
45
3819
43
20
44
2241
2851
38
3640
38
20
1921
15
2224
19
25
18
1820
2415
20
1822
20
27
2925
35
3155
18
55
18
5822
447
27
2728
27
740
740740
739
739731
743
731
743
731741
734746
740
741739
740
14,044
7,1116,932
1
202
157186364
713,026
1011
3612512
13,646
2,12911,915
6,0448,000
614,038
1,45512,589
30913,735
16
1716
10
16186
1714
3362517
219
823
16
518
1217
42
4143
35
354522
4335
25366742
1647
3647
42
2943
4642
21
2122
24
231923
2118
2016821
2321
2618
21
3220
2221
20
2120
32
261849
1934
5212020
5913
3112
20
3519
2120
742
742742
738
740743733
742739
733747748742
731744
738745
742
737742
741742
Page 6 of 6
School: King Middle SchoolDistrict: Portland Public SchoolsState: MaineCode: 1134-1353
Fall 2010 - Beginning of Grade 7 NECAP TestsGrade 7 Students in 2010-2011
Level 4 = Profi cient with Distinction; Level 3 = Profi cient; Level 2 = Partially Profi cient; Level 1 = Substantially Below Profi cient
Note: Some numbers may have been left blank because fewer than ten (10) students were tested.


