About Textiles Intelligence
Business and market analysis for the global fibre,
textile and apparel industries

Spun-off from the Economist Intelligence Unit
in 1992

Textiles Intelligence Four publishes four regular titles:
Global Apparel MarketsPerformance Apparel Markets
Technical Textile MarketsTextile Outlook International

Textile fibres for a sustainable future: cotton,
synthetic or cellulosic?by Robin Anson
Managing Director, Textiles Intelligence
Tribute to Edelweiss, St Wolfgang, Austria, July 3, 2012

Textiles Intelligence www.textilesintelligence.com
The global economy

Textiles Intelligence www.textilesintelligence.com
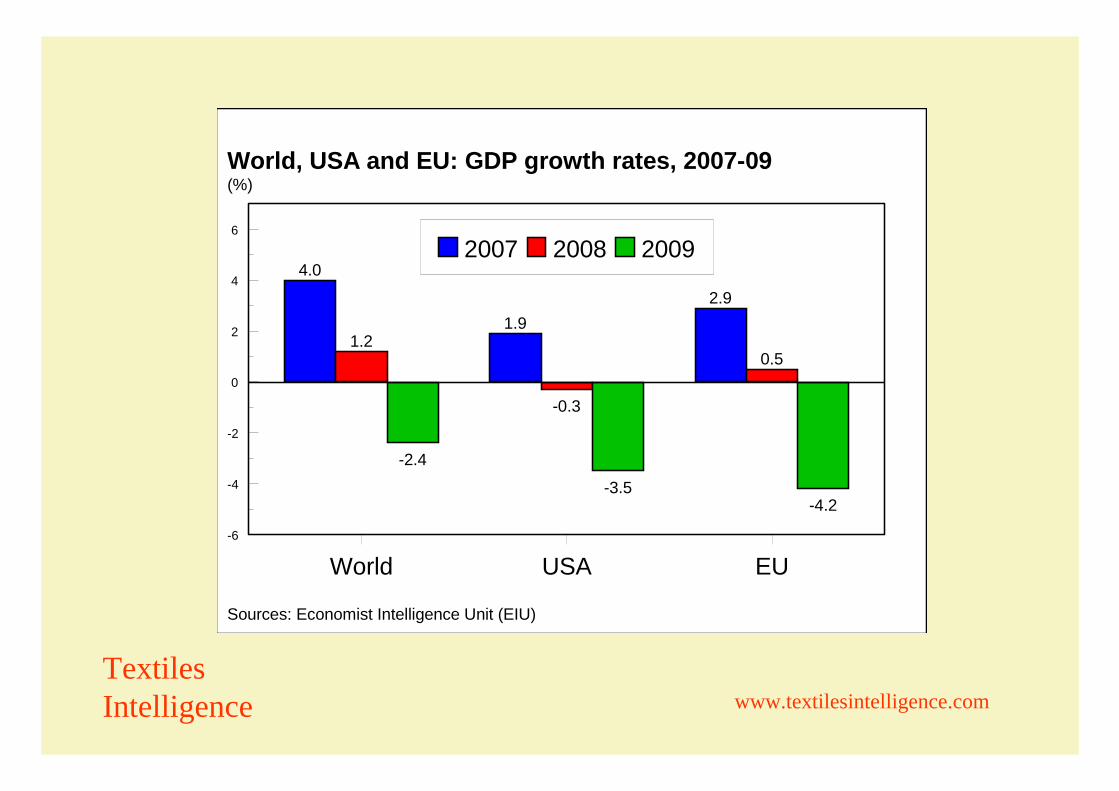
Recession ...
Textiles Intelligence www.textilesintelligence.com
World, USA and EU: GDP growth rates, 2007-09
Sources: Economist Intelligence Unit (EIU)
World USA EU-6
-4
-2
0
2
4
6
4.0
1.92.9
1.2
-0.3
0.5
-2.4
-3.5-4.2
(%)
2007 2008 2009

... followed by recovery ...
Textiles Intelligence www.textilesintelligence.com

Textiles Intelligence www.textilesintelligence.com
World, USA and EU: GDP growth rates, 2009 and 2010
Sources: Economist Intelligence Unit (EIU)
World USA EU-6
-4
-2
0
2
4
6
8
-2.4-3.5
-4.2
4.13.0
2.0
(%)
2009 2010

... but in the EU there will be a second dip in 2012 ...
Textiles Intelligence www.textilesintelligence.com

Textiles Intelligence www.textilesintelligence.com
World, USA and EU: GDP growth rates, 2010-12
Sources: Economist Intelligence Unit (EIU)
World USA EU-1
0
1
2
3
4
5
4.1
3.0
2.02.5
1.7 1.62.1 2.2
-0.5
(%)
2010 2011 2012

... and slow growth in 2013
Textiles Intelligence www.textilesintelligence.com

Textiles Intelligence www.textilesintelligence.com
World, USA and EU: GDP growth rates, 2010-13
Sources: Economist Intelligence Unit (EIU)
World USA EU-1
0
1
2
3
4
5
4.1
3.0
2.02.5
1.7 1.62.1 2.2
-0.5
2.62.1
0.8
(%)
2010 2011 2012 2013
Our industry also recovered in 2010
Textiles Intelligence www.textilesintelligence.com

Textiles Intelligence www.textilesintelligence.com
USA
China
Western Europe
World trade in textiles and clothing, 2000-10
Source: Textile Outlook International from WTO data
2000 2005 2006 2007 2008 2009 20100
100
200
300
400
500
600
700
352
478525
583 612
525602
US$ bn
ClothingTextiles

Textiles Intelligence www.textilesintelligence.com
World fibre demand, 2006-10
NB: Excluding olefins and acetate tow; cotton and wool data are consumption figSource: Fiber Organon
2006 2007 2008 2009 20100
20
40
60
80
100
65.1 69.3 64.2 65.473.6
mn tons
SilkWool CottonCellulosicSynthetic
ures to minimise impact of inventory swings

But the upturn helped to trigger a surge in raw material prices ...
Textiles Intelligence www.textilesintelligence.com

Textiles Intelligence www.textilesintelligence.com
Cotton prices, 1991-2011
Source: Cotton Outlook
Jan 1991 Jan 1996 Jan 2001 Jan 2006 Jan 20110
50
100
150
200
250
US$/lb, monthly averages
Mar 2011

... causing severe disruption to the market
Textiles Intelligence www.textilesintelligence.com

Impact on EU and US clothing imports
Textiles Intelligence www.textilesintelligence.com
Surge in clothing import prices......slow growth or decline in clothing import volume

Textiles Intelligence www.textilesintelligence.com
Growth (right hand
scale)
Size (left hand scale)
USA and EU: growth in clothing importvolume and price, 2011
Sources: Euratex; US official statistics
EU USA-10
-5
0
5
10
15
20
25
7.5
12.8
0.8
-3.6
(%)
Price Volume
EU USA
Price PriceVolume
Volume

But the trend in man-made fibre apparel was different – volumes and prices kept growing
Textiles Intelligence www.textilesintelligence.com

Textiles Intelligence www.textilesintelligence.com
Growth (right hand
scale)
Size (left hand scale)
USA: growth in clothing import volumeand price by fibre type, 2011
Source: US official statistics
Cotton apparel MMF apparel-15
-10
-5
0
5
10
15
2017.0
9.7
-11.8
8.3
(%)
Price Volume
Price Price
Volume
Volume
USA
MMFCotton

Textiles Intelligence www.textilesintelligence.com
Growth (right hand
scale)
Size (left hand scale)
USA: share of clothing imports in volume termsby fibre type, 1991-2011
Source: US official statistics
19911992
19931994
19951996
19971998
19992000
20012002
20032004
20052006
20072008
20092010
201130
35
40
45
50
55
60
65
(%)
Cotton apparel
Man-made fibre apparel
USA

Textiles Intelligence www.textilesintelligence.com
Growth (right hand
scale)
Size (left hand scale)
USA: growth in clothing import volume and priceby selected leading supplying country, 2011
Source: US official statistics
PakistanBangladesh
HondurasIndia
ChinaEl Salvador
IndonesiaVietnam
Cambodia
-10
0
10
20
30
23.619.7
16.5 15.012.1 11.2 10.2
8.1 6.5
-10.3
-4.1-7.0 -7.4 -6.2 -4.6
3.6 4.6
9.5
(%)
Price Volume
USA

Textiles Intelligence www.textilesintelligence.com
Growth (right hand
scale)
Size (left hand scale)
EU: growth in clothing import volume and priceby selected leading supplying country, 2011
Source: Euratex
BangladeshIndia
PakistanTurkey
IndonesiaVietnam
CambodiaChina
-20
-10
0
10
20
30
40
50
22.3 20.5 19.6
12.1 11.97.9 6.4
3.15.0
-9.1
5.4
-7.1
2.5
14.2
39.7
1.4
(%)
Price Volume
EU

Textiles Intelligence www.textilesintelligence.com
Since then the cotton price has fallen ...

Textiles Intelligence www.textilesintelligence.com
Cotton prices, 1991-Jun 2012
Source: Cotton Outlook
Jan
1991
Jan
1992
Jan
1993
Jan
1994
Jan
1995
Jan
1996
Jan
1997
Jan
1998
Jan
1999
Jan
2000
Jan
2001
Jan
2002
Jan
2003
Jan
2004
Jan
2005
Jan
2006
Jan
2007
Jan
2008
Jan
2009
Jan
2010
Jan
2011
Jan
2012
June
201
2
0
50
100
150
200
250
US$/lb

But there are few signs of a return to normality
Textiles Intelligence www.textilesintelligence.com

Textiles Intelligence www.textilesintelligence.com
USA and EU: growth in clothing importvolume and price, q1 2012
Sources: Euratex; US official statistics
EU USA-20
-10
0
10
20
8.7 7.6
-12.0
-3.9
(%)
Price Volume
Price Price
Volume
Volume
EU USA
Jan-Mar 2012

Textiles Intelligence www.textilesintelligence.com
USA: growth in clothing import volumeand price by fibre type, q1 2012
Source: US official statistics
Cotton apparel MMF apparel-15
-10
-5
0
5
10
15
20
9.57.9
-11.8
8.1
(%)
Price Volume
Price Price
Volume
Volume
Jan-Mar 2012 – USA
MMFCotton

Textiles Intelligence www.textilesintelligence.com
Impact of the cotton price hike downstream?

Textiles Intelligence www.textilesintelligence.com
Interesting work on “pass-through” by Jon Divine and Alejandro Plastina of ICAC...

Textiles Intelligence www.textilesintelligence.com

Textiles Intelligence www.textilesintelligence.com

Textiles Intelligence www.textilesintelligence.com

Textiles Intelligence www.textilesintelligence.com

Textiles Intelligence www.textilesintelligence.com
USAUSA
9 Asian countries

Isn’t this all in the past now?
Surely, the cotton price hike was a one-off ...
Textiles Intelligence www.textilesintelligence.com

ICAC press release July 2, 2012 ...
Textiles Intelligence www.textilesintelligence.com

World Cotton Trade to Decline Significantly in 2012/13After a 20% jump to 9.2 million tons in 2011/12, the volume of cotton traded internationally is expected to drop by 18% to 7.6 million tons in 2012/13.
The leap in global cotton trade in 2011/12 does not reflect improved demand for cotton. In fact, global cotton mill use is estimated down by 7% to 22.7 million tons, the smallest in eight years.
High and volatile prices and a slowing global economy drove demand for cotton yarn down. Increased cotton trade in 2011/12 is due to a neardoubling of shipments to China to 5.1 million tons.
Chinese mills have turned to imports to compensate for the shortage of domestic cotton caused by the rebuilding of the national reserve. In addition, large quantities of cotton were imported by the Chinese government specifically to help rebuild that national reserve.
Textiles Intelligence www.textilesintelligence.com

In fact raw material prices will climb again over time because there are long-term problems
Textiles Intelligence www.textilesintelligence.com

Textiles Intelligence www.textilesintelligence.com
Fibre demand per head is growing

Textiles Intelligence www.textilesintelligence.com
World end use consumption of textile fibresper head, 1960-2011
Source: International Cotton Advisory Committee (ICAC)
1960 1975 1990 2005 20110
2
4
6
8
10
12

Textiles Intelligence www.textilesintelligence.com
So is world population –1.4 bn more people by 2030

Textiles Intelligence www.textilesintelligence.com
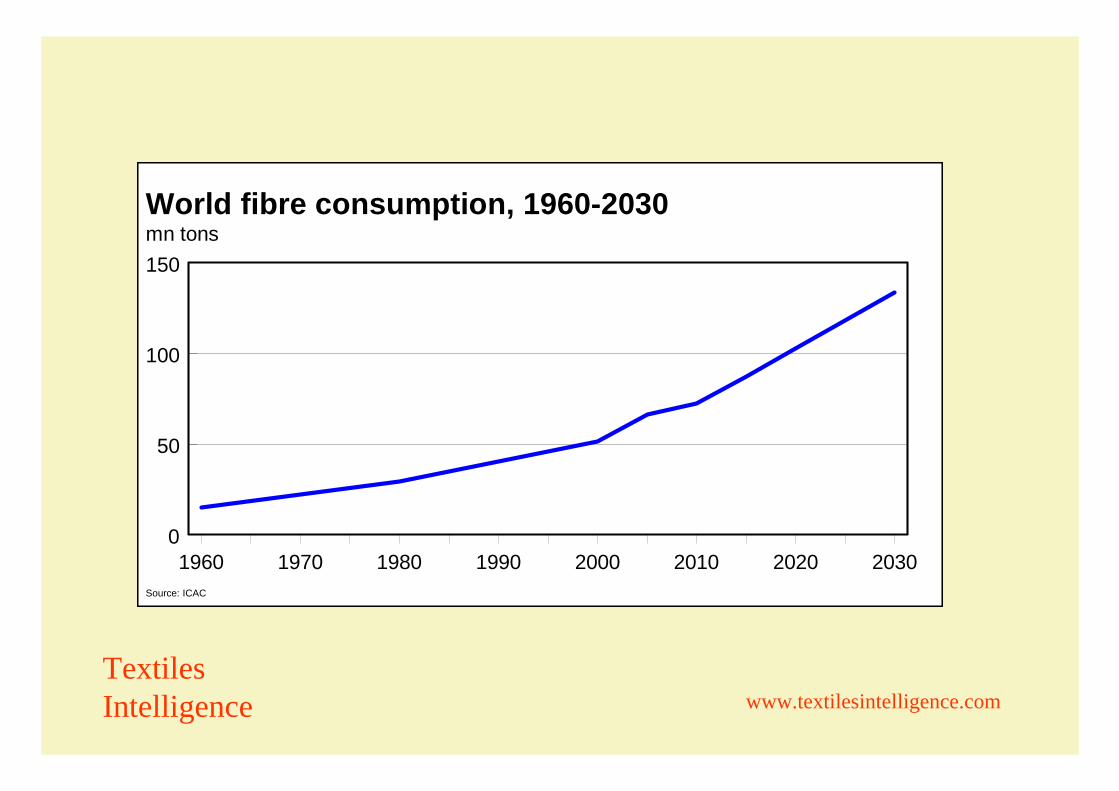
The result?
Textiles Intelligence www.textilesintelligence.com
World fibre consumption, 1960-2030
Source: ICAC
1960 1970 1980 1990 2000 2010 2020 20300
50
100
150mn tons

Textiles Intelligence www.textilesintelligence.com
That’s good news for the textile and clothing industry.
But where will the extra fibre come from?
Textiles Intelligence www.textilesintelligence.com
Sustainability issues

Textiles Intelligence www.textilesintelligence.com
Dilemma: food vs fibres?% change
Fibres
Food
Population
Arable land
Source: Franz Martin Haemmerle

Textiles Intelligence www.textilesintelligence.com
Harvested area of cotton range-bound
Source: Franz Martin Haemmerle

Textiles Intelligence www.textilesintelligence.com
So, to grow more cotton, yields must rise

Textiles Intelligence www.textilesintelligence.com
Yields are rising
Source: Franz Martin Haemmerle

Textiles Intelligence www.textilesintelligence.com
But there is a big cost to the environment:
• genetically modified (GM), Bt cotton
• more intensive farming – more fertilisers, more water

Textiles Intelligence www.textilesintelligence.com
And how long can yields keep rising?“India's cotton yield may fall to 5-year low... even as the area under Bt has grown to 93 per cent of the total area under the cash crop”
Business Standard, Wednesday, 26 October 2011

Textiles Intelligence www.textilesintelligence.com
“Cotton production based on irrigation requires 15-35 times more water than cellulose fibre production based on wood pulp”
“Only 45% of cotton growing is based on natural rains”
(Source: Franz Martin Haemmerle)
Water consumption

Textiles Intelligence www.textilesintelligence.com
Can the planet spare the amount of water needed?
Source: Franz Martin Haemmerle

Textiles Intelligence www.textilesintelligence.com
• Planted area down to 28 mn ha
Cotton production heading for a plateau
• Yield up to 925 kg/ha
• Maximum theoretical cotton production 26 mn tons a year

Textiles Intelligence www.textilesintelligence.com
If fibre consumption keeps rising, cotton’s share must fall

Textiles Intelligence www.textilesintelligence.com
Share of cotton in world fibre consumption, 1960-2020
Source: International Cotton Advisory Committee (ICAC)
1960 1975 1990 2005 20200
20
40
60
80
100
%

Textiles Intelligence www.textilesintelligence.com
Non-cotton fibres will have to fill the gap

Textiles Intelligence www.textilesintelligence.com
USA
China
Western Europe
World textile fibre consumption, 1960-2020
Source: International Cotton Advisory Committee (ICAC)
1960 1965 1970 1975 1980 1985 1990 1995 2000 2005 2010 2015 20200
20
40
60
80
100
120
mn tons
Cotton Non-cotton

Textiles Intelligence www.textilesintelligence.com
Question: what fibre type can fill the gap?

Textiles Intelligence www.textilesintelligence.com
Polyester?

Textiles Intelligence www.textilesintelligence.com
Problem: consumers want fibres with absorbency, moisture management etc33-37% has to be cellulose based, says Franz Martin Haemmerle

The cellulosic gap
Textiles Intelligence www.textilesintelligence.com
% shares
Synthetic
Cotton
The cellulosic
gap

Textiles Intelligence www.textilesintelligence.com
Where will the cellulosic gap be greatest?

Textiles Intelligence www.textilesintelligence.com
South Asia is the most dependent on cotton

Textiles Intelligence www.textilesintelligence.com
USA
China
Western Europe
Share of mill consumption by fibre type 2010
Japan, SK, Taiwan
China, HK
S East Asia
South Asia
All Asia
0 20 40 60 80 100
Wool Cotton Man-made fibre
More dependent on cotton

Textiles Intelligence www.textilesintelligence.com
But can it fill the gap?

Textiles Intelligence www.textilesintelligence.com
Cellulosic fibre output by leading producer2007-11
Source: Fiber Organon
China Western Europe Indonesia India0
1
2
3
1.6
0.40.3 0.3
1.4
0.40.3 0.3
1.6
0.4 0.3 0.3
1.7
0.4 0.4 0.4
1.9
0.4 0.4 0.4
mn tons
2007 2008 2009 2010 2011
India is no match for China
3 countries plus W.E. = 90% of global output

Textiles Intelligence www.textilesintelligence.com
Cellulosic fibre capacity and growth,Mar 2012 and Dec 2013
Source: Fiber Organon
ChinaIndia
IndonesiaWestern Europe
0
1
2
3
mn tonsMarch2012December2013
36.1%growth
6.7% growth
6.3%growth
0.0%growth
India capacity growing but no match for China

Textiles Intelligence www.textilesintelligence.com
Filling the cellulosic gap by 2030 will certainly be a challenge!

Textiles Intelligence www.textilesintelligence.com
Finally, something interesting for Lenzing planners to think about...

Textiles Intelligence www.textilesintelligence.com

Textiles Intelligence www.textilesintelligence.com
What are we looking at?

Textiles Intelligence www.textilesintelligence.com
A cellulosic material made from fermented wine ...

Textiles Intelligence www.textilesintelligence.com
… called Micro‘be’…from Bioalloy in Australia

Textiles Intelligence www.textilesintelligence.com
How is it made?

Textiles Intelligence www.textilesintelligence.com
You will wish you hadn’t asked!

Textiles Intelligence www.textilesintelligence.com
• acetobacter is added to vats of wine to turn it into vinegar• fibrous cellulose forms on the surface of the wine in the vats• the resulting fibrous cellulose is draped over a mannequin• the material shrinks to fit the mannequin’s shape• the mannequin is deflated and the garment remains

Textiles Intelligence www.textilesintelligence.com
Is this serious?

Textiles Intelligence www.textilesintelligence.com
Artist Donna Franklin hasdesigned a collection of stitchless dresses, T-shirts and swimwear

Textiles Intelligence www.textilesintelligence.com

Textiles Intelligence www.textilesintelligence.com
Wet strength?

Textiles Intelligence www.textilesintelligence.com
OK, it’s not perfect yet!More info at http://bioalloy.org/o/projects/micro-be.html

Thank you!www.textilesintelligence.com


