Greening the Global Logistics ChainThe Shipping Line’s Perspective
AAPA Greenport Americas 2010
May 6, 2010
Bill Williams
Vice President
Health, Safety & Environment

Slide no. 2MSTRS 5/4/2010
The A.P. Moller–Maersk Group
A.P. Moller-Maersk
Group
HQ: Copenhagen,
Denmark
2009 Revenue:
USD $48.5 b
in Shipping, Energy,
Retail
and Banking.
115,000 employees,
130 countries.

Slide no. 3MSTRS 5/4/2010
A.P. Moller-Maersk transportation businesses in North America
• Maersk Line Limited – US-flagged vessels
• Maersk Line North America – Sales, operations & inland
transportation contracting (rail & trucking)
• APM Terminals Americas – Marine terminals
• Maersk Equipment Services – Equipment and maintenance
• Direct ChassisLink – NEW Neutral chassis leasing business
• Bridge Terminal Transport – Trucking and drayage
• Maersk Distribution Services Inc. – Warehousing & logistics
• Gilbert -- Warehousing & logistics
• Damco – Third-party logistics

Slide no. 4MSTRS 5/4/2010
Maersk Line – Container Shipping
Operations
500+ vessels
Moves approx. 1.8 million containers
90% of all goods transported globally is
done by ship
Maersk Line represents approx. 4% of
worldwide shipping
16% of the container segment
Consumes over 10 M tonnes of
heavy fuel oil annually
Slide no. 5MSTRS 5/4/2010
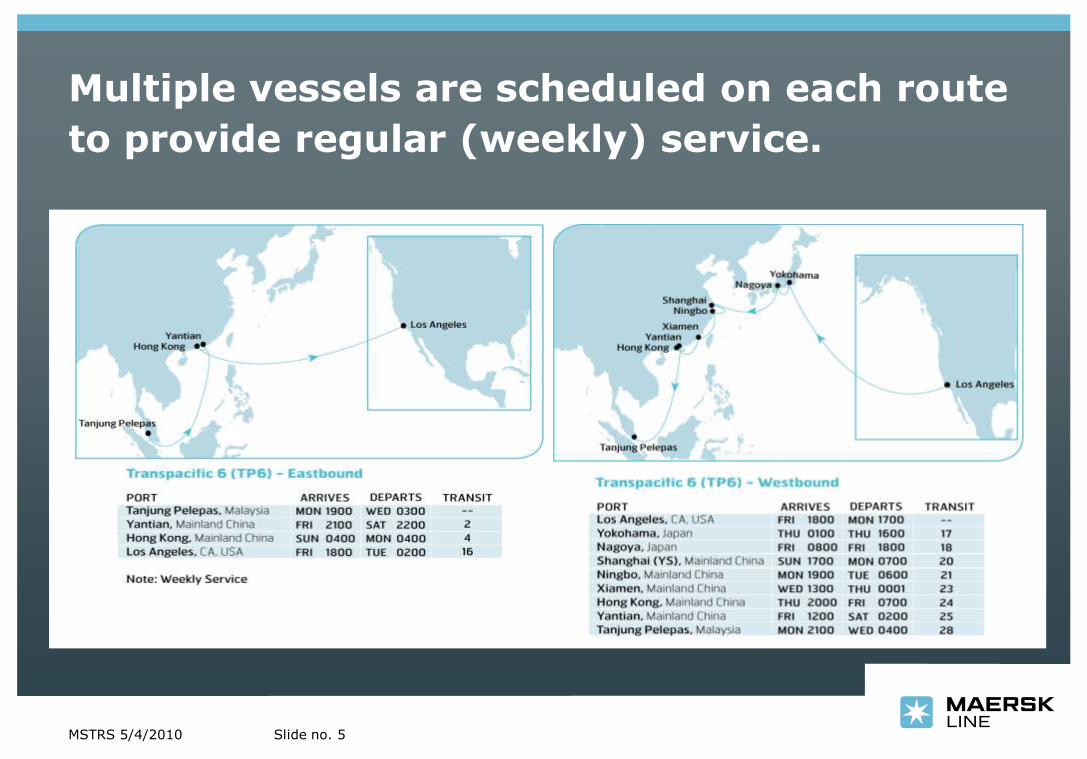
Multiple vessels are scheduled on each route
to provide regular (weekly) service.

Slide no. 6MSTRS 5/4/2010
Vessel schedule:Georg Maersk on TP-6
Hong Kong 18 Apr 2010 04:00 19 Apr 2010 04:00
Los Angeles 30 Apr 2010 18:00 03May 2010 17:00
Yokohama 20 May 2010 01:00 20 May 2010 16:00
Nagoya 21 May 2010 08:00 21May 2010 18:00
Shanghai 23 May 2010 17:00 24 May 2010 07:00
Ningbo 24 May 2010 19:00 25 May 2010 06:00
Xiamen 26 May 2010 13:00 27 May 2010 00:01
Hong Kong 27 May 2010 18:00 28 May 2010 11:00
Yantian 28 May 2010 17:00 29 May 2010 07:00
Tanjung Pelepas 01 Jun 2010 09:00 02 Jun 2010 16:00
Jeddah 11 Jun 2010 23:00 12 Jun 2010 23:00
Suez Canal 15 Jun 2010 01:00 15 Jun 2010 17:00
Barcelona 19 Jun 2010 08:00 20 Jun 2010 08:00
Valencia 21 Jun 2010 02:00 22 Jun 2010 08:00
Algeciras 23 Jun 2010 08:00 24 Jun 2010 14:00
Port Tangier Mediterranee 25 Jun 2010 00:01 26 Jun 2010 02:00
Suez Canal 01 Jul 2010 19:00 02 Jul 2010 17:00
Tanjung Pelepas 17 Jul 2010 02:30 18 Jul 2010 10:30
Vung Tau 20 Jul 2010 08:00 21 Jul 2010 08:00
Yantian 23 Jul 2010 15:00 24 Jul 2010 22:00
Hong Kong 25 Jul 2010 04:00 26 Jul 2010 04:00
Los Angeles 08 Aug 2010 18:00 12 Aug 2010 03:00
Port Name Arrival Date Departure Date
Slide no. 7MSTRS 5/4/2010
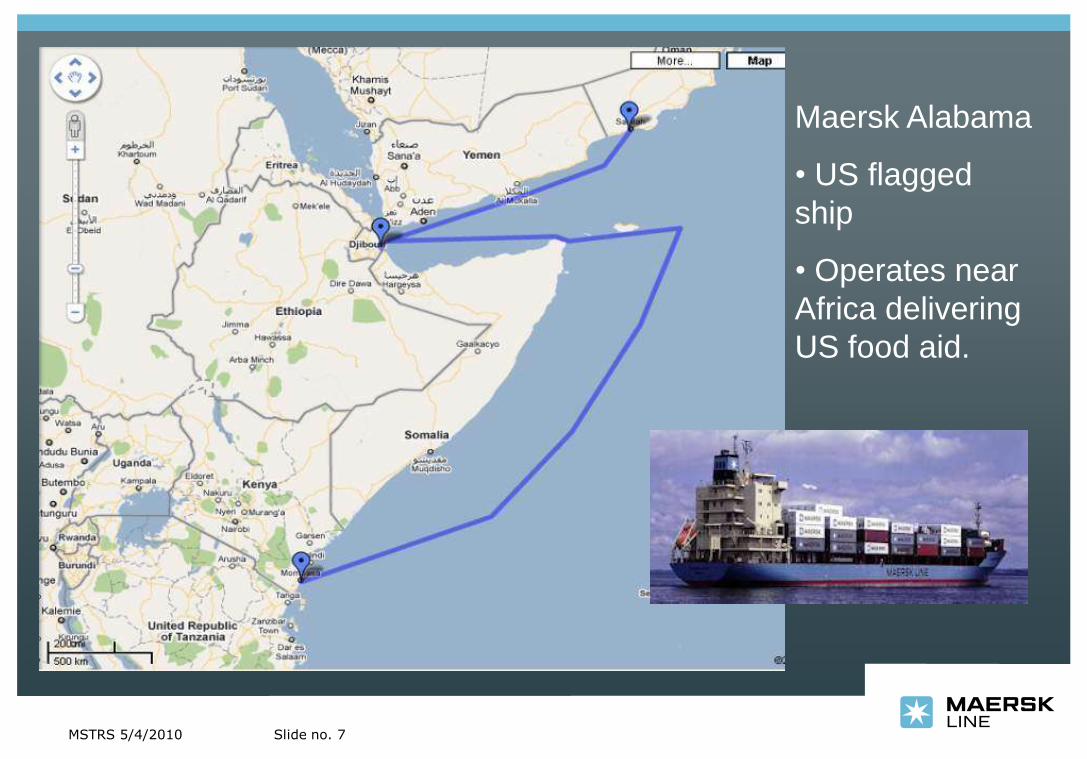
Maersk Alabama
• US flagged
ship
• Operates near
Africa delivering
US food aid.

Slide no. 8MSTRS 5/4/2010
CO2H2O
PM
NOx
Black
carbon
Burning hydrocarbon fuel
creates air emissions
SOx

Slide no. 9MSTRS 5/4/2010
Transportation does have a significant impact on the environment, but…
… we are doing
something about it.

Slide no. 10MSTRS 5/4/2010
Vessels change fuels:
From Bunker avg. 2.7% sulfur
To Distillate avg. 0.12% sulfur
Emissions reduction:
SOx: 95%
PM: 86%
NOx: 6 to 12%
Locations:
California – from 24nm
(1.5/0.5% required since 7/2009)
WA & BC – at dock
Houston – demo 11/09, DERA grant
Mærsk Mc-Kinney Møller stands on the dock at Pier 400 in Los Angeles with the Sine Maersk at berth behind him. The vessel was the first to perform a fuel switch as part of a Maersk Line pilot environmental initiative in California.
Fuel switching provides immediate air quality
improvement.
-- March 21, 2006

Slide no. 11MSTRS 5/4/2010
Typical Fuel Switch Map
Fuel Switch Locations:
1. Auxiliary Engine Entry
2. Main Engine Entry
3. Port of Los Angeles
4. Main Engine Exit
5. Auxiliary Engine Exit
Data by ENVIRON
Slide no. 12MSTRS 5/4/2010
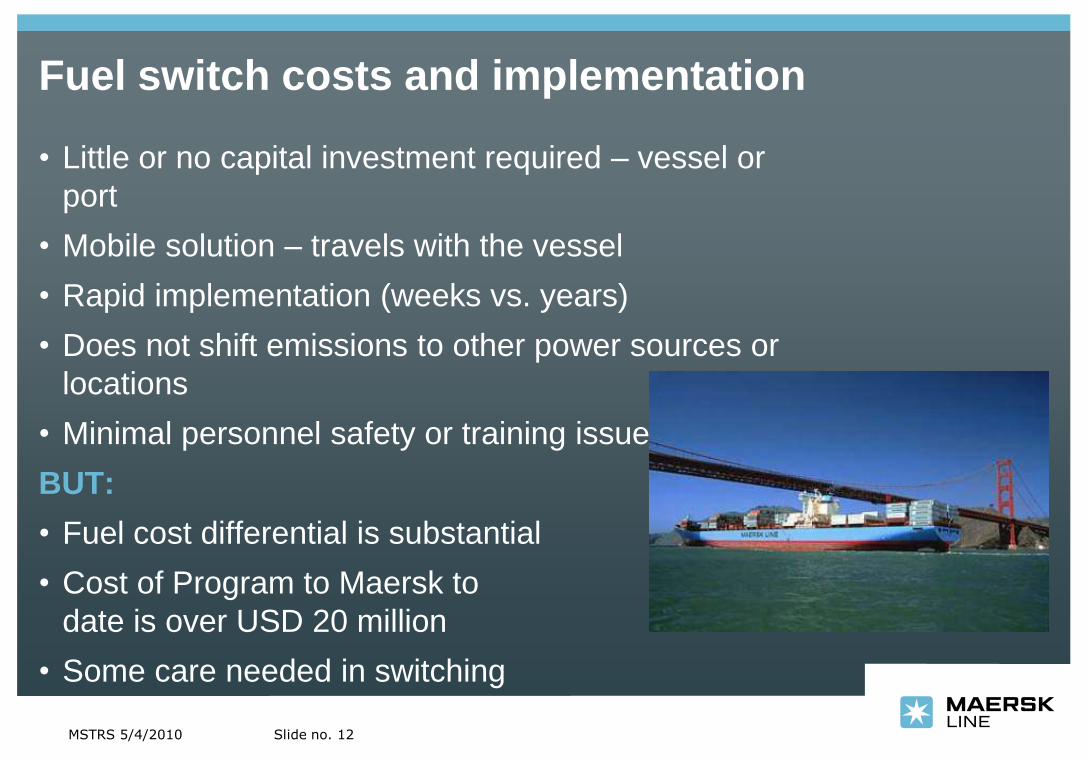
Fuel switch costs and implementation
• Little or no capital investment required – vessel or
port
• Mobile solution – travels with the vessel
• Rapid implementation (weeks vs. years)
• Does not shift emissions to other power sources or
locations
• Minimal personnel safety or training issues
BUT:
• Fuel cost differential is substantial
• Cost of Program to Maersk to
date is over USD 20 million
• Some care needed in switching
Slide no. 13MSTRS 5/4/2010
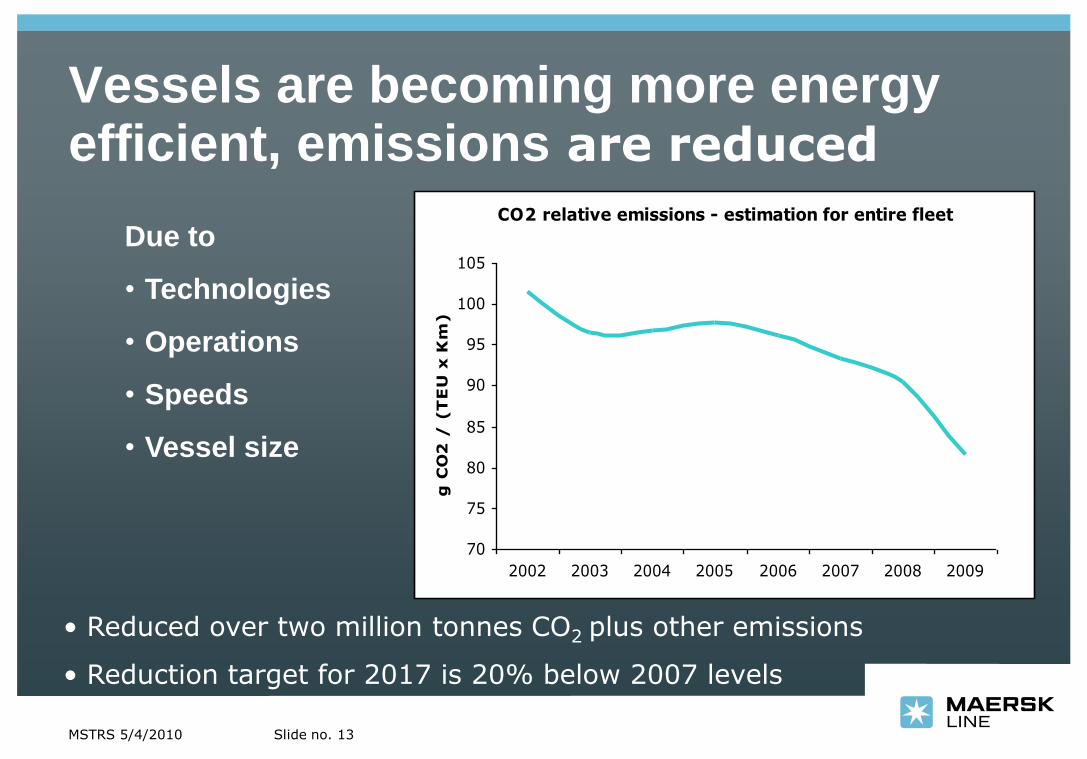
Vessels are becoming more energy efficient, emissions are reduced
CO2 relative emissions - estimation for entire fleet
70
75
80
85
90
95
100
105
2002 2003 2004 2005 2006 2007 2008 2009
g C
O2
/ (
TE
U x
Km
)
Due to
• Technologies
• Operations
• Speeds
• Vessel size
• Reduced over two million tonnes CO2 plus other emissions
• Reduction target for 2017 is 20% below 2007 levels
Slide no. 14MSTRS 5/4/2010
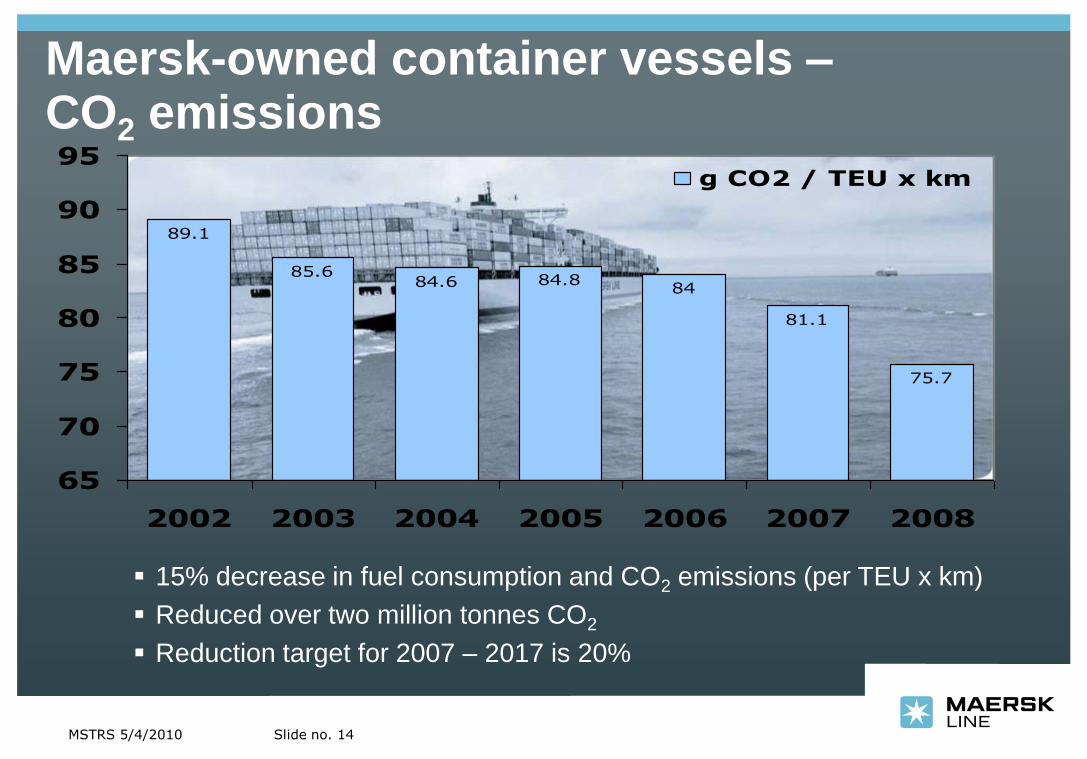
89.1
85.684.6 84.8
84
81.1
75.7
65
70
75
80
85
90
95
2002 2003 2004 2005 2006 2007 2008
g CO2 / TEU x km
Maersk-owned container vessels –CO2 emissions
15% decrease in fuel consumption and CO2 emissions (per TEU x km)
Reduced over two million tonnes CO2
Reduction target for 2007 – 2017 is 20%

Slide no. 15MSTRS 5/4/2010
Maersk Container Vessels -- NOx Emissions
2.42 2.39 2.34 2.33
2.14
1.97
2.53
0
0.5
1
1.5
2
2.5
3
2002 2003 2004 2005 2006 2007 2008
g N
Ox /
TEU
x k
m
Decrease in NOx largely due to reduced fuel consumption
Large and increasing number of vessels built after 2000, so NOx certified

Slide no. 16MSTRS 5/4/2010
Technical innovation is essential for sustainability
Antifouling paint and maintenance of hull and propeller(1.5%*)
Waste Heat Recovery System (10%*)Electronically controlled engine (0,5%*)Adjusting main engines (1%*)
Ballast water optimisation
Voyage Efficient System (VES) (1%*)
QUEST: Low energy reefer containers (0,5%*)
Trim tests for all classes of vessels (1%*)
*CO2 emission saving potential
Source: Maersk Line Sustainability Department

Slide no. 17MSTRS 5/4/2010
Fuel use and costs increase exponentially at higher speeds
• The speed/
fuel use curve
is exponential.
• Speeding up
will cost more
fuel than what
we save by
slowing down
• Lowest
constant
speed is best
Speed/Bunker curve example
0.0
50.0
100.0
150.0
200.0
250.0
300.0
0.00 5.00 10.00 15.00 20.00 25.00 30.00
200 mt @ 22 knot
160 mt @ 20 knot
260 mt @ 24 knot
60 mts
40 mts
2kn 2kn
figures indicative only
• Speed,
knots
• Bunker
tons

Slide no. 18MSTRS 5/4/2010
8 x 6,000 TEU vesselWeekly capacity: 6000 TEU
• Busan
• Kwangyang
Dalian ●
Xingang ●
• Qingdao
• Shanghai
• Gioia Tauro
• Rotterdam
• Bremerhaven
• Felixstowe
Speed 23.0 knots
Speed 22.5 knots
6 ports4 ports
35 days for ocean
crossings and 21 days
for Asia and Europe port
loops
• To create a weekly
schedule:
• 8 vessels means a full
rotation time of 56
days
Designing schedules to reduce consumption
• Busan
• Kwangyang
Dalian ●
Xingang ●
• Qingdao
• Shanghai
• Gioia Tauro
• Rotterdam
• Bremerhaven
• Felixstowe
Speed 20.0 knots
Speed 20 knots
6 ports4 ports
42 days for ocean
crossings and 21 days
for Asia and Europe port
loops
• To create a weekly
schedule:
• 9 vessels means a full
rotation time of 63
days
9 x 6,000 TEU vesselsWeekly capacity: 6000 TEU
Asia-Europe example

Slide no. 19MSTRS 5/4/2010
De-rating example
187
188
189
190
191
192
193
194
195
196
197
198
199
200
201
202
203
20 25 30 35 40 45 50 55 60 65 70 75 80 85 90 95 100
% Engine Capacity Used
Fuel g/kW
h
Full rated
De-rated
Adjusting main engines to economical speed
• Traditionally, vessels are
optimized for high speed
• Lower economical speed
allows for de-rating of the
main engine
• Maximum engine power is
restricted
• Significantly lower fuel
consumption at medium
power

Slide no. 20MSTRS 5/4/2010
Super Slow Steaming Initiative
• Study started in 2007, covered 110 vessels
• Maersk collaborated with engine manufacturers
• Results:
• OK to operate as low as 10% engine load
• Traditional range is 40 – 60%
• Manufacturers have changed recommendations
• Over 100 vessels used since 2007, resulting in
• More flexible voyage & schedule planning
• 10 – 30% fuel savings and reduced CO2
• Significant savings:
• Post panamax: 3500 MT fuel, 10,000 MT CO2
• $1 million
• Sustainable Shipping Operator of The Year - 2009
Slide no. 21MSTRS 5/4/2010
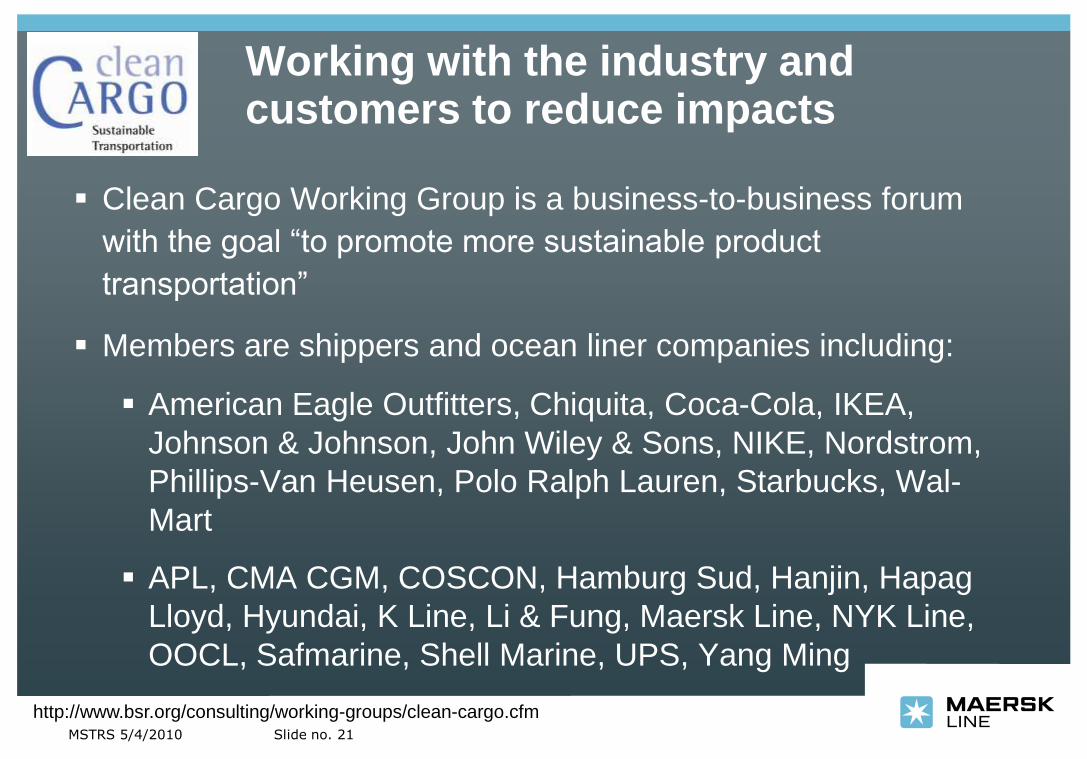
Working with the industry and customers to reduce impacts
Clean Cargo Working Group is a business-to-business forum
with the goal “to promote more sustainable product
transportation”
Members are shippers and ocean liner companies including:
American Eagle Outfitters, Chiquita, Coca-Cola, IKEA,
Johnson & Johnson, John Wiley & Sons, NIKE, Nordstrom,
Phillips-Van Heusen, Polo Ralph Lauren, Starbucks, Wal-
Mart
APL, CMA CGM, COSCON, Hamburg Sud, Hanjin, Hapag
Lloyd, Hyundai, K Line, Li & Fung, Maersk Line, NYK Line,
OOCL, Safmarine, Shell Marine, UPS, Yang Ming
Annual evaluation of member lines’ environmental
performance
http://www.bsr.org/consulting/working-groups/clean-cargo.cfm

Slide no. 22MSTRS 5/4/2010
Clean Cargo Working Group Environmental Performance Scorecard
Scorecard
Carrier Name:
TABLE 1 - OVERALL PERFORMANCE
Owned Time-Chartered
CO2 Emissions (across all trade lanes) -- -- 50 N/A N/A *Score not available until "CCWG Average" is calculated for each trade lane
SOx Emissions -- -- 15 -- --
NOx Emissions -- -- 15 -- --
Environmental management systems -- -- 10 -- --
Transparency -- -- 10 -- --
Overall Performance 100 N/A N/A
TABLE 2 - DETAILED CO2 PERFORMANCE
Owned Time-Chartered
Asia--Africa -- -- - - N/A - N/A
Asia--South America (EC/WC) -- -- - - N/A - N/A
Asia--Oceania -- -- - - N/A - N/A
Asia--North Europe -- -- - - N/A - N/A
Asia--Mediterranean -- -- - - N/A - N/A
Asia--North America EC -- -- - - N/A - N/A
Asia--North America WC -- -- - - N/A - N/A
CO2 Emissions - by trade Lane TEU-km grams CO2/
TEU-km
Score
Environmental Performance Assessment
Clean Cargo Working Group
Carrier Score Carrier Score
as % of Max
% of Fleet Reported On Max Score Possible
% of Fleet Reported On
DRY CONTAINERS REEFERS
grams CO2/
TEU-km
Score
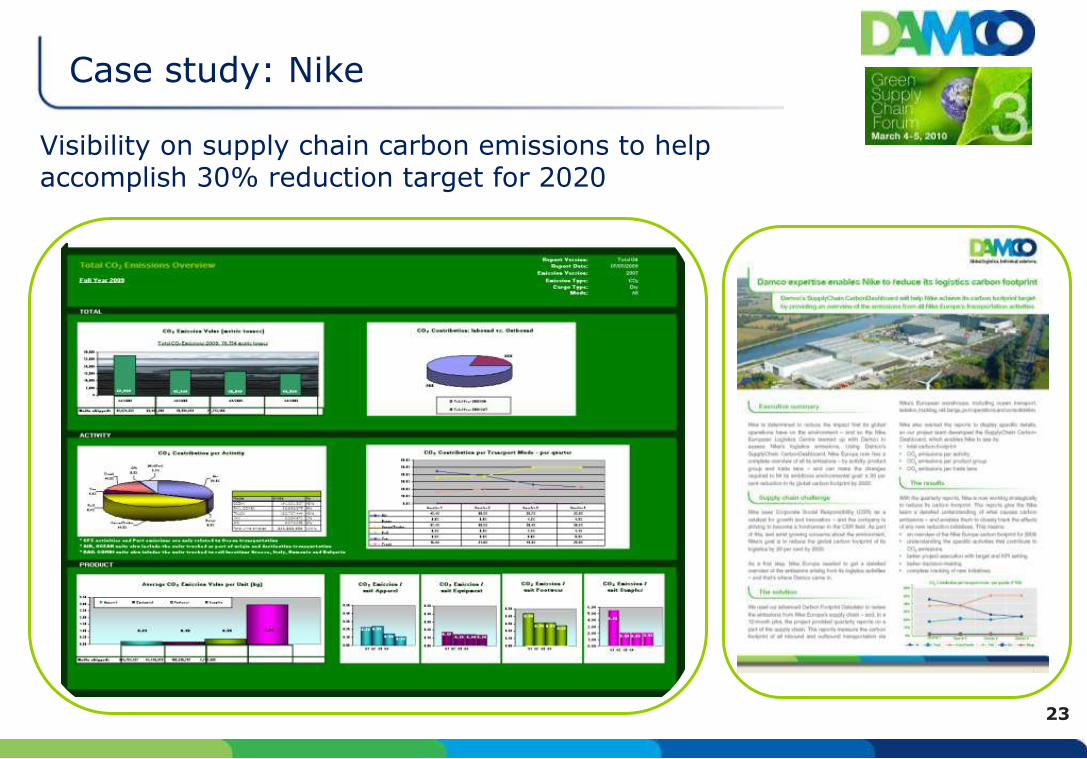
2323
Case study: Nike
Visibility on supply chain carbon emissions to help accomplish 30% reduction target for 2020

Slide no. 24MSTRS 5/4/2010
Case studies at www.damco.com
CarbonCheck projects with Boots, a leading international chain of
pharmacy and health and beauty stores.
Since 2004, focus on these analyses have enabled Boots to
reduce CO2 emissions by 29% and
reduce logistics costs by 21%
in their inbound supply chain from Asia to their distribution centre
in England.
”It goes to show that if you review and optimize your supply chain
end-to-end from a green perspective, great savings can be
made.”
-- Erling Johns Nielsen
Supply Chain Development Team
Maersk Logistics
Greener can also be cheaper

Slide no. 25MSTRS 5/4/2010
Thank you
Contact Information:
Bill Williams
Vice President, Health, Safety & Environment
704-571-2506


