A. Traffic Volume Trends
I-495 South of MD 190

This Page Intentionally Left Blank
I.A.1
SECTION HEADING GOES HERE
Traffic Volume TrendsTraffic volumes across the country are experiencing the largest increases in years. Nationwide, there was a 3.5% growth rate in 2015, which was approximately twice the growth rate of the previous year and represents the fourth straight year of increase in travel.
The following facts highlight trip patterns in Maryland:
• Maryland is second in the nation in terms of longest commuting times according to the American Community Survey with an average of 32.3 minutes. The District of Columbia which includes many Maryland commuters is fourth in the nation with commuting times averaging 29.3 minutes each way.
• Approximately 240,000 people commute from Maryland into Washington D.C based on AirSage data analysis. An additional 120,000 people commute to Montgomery and Prince George’s counties from out of state.
• There are almost 140,000 people commuting into Baltimore City each day, mainly from Baltimore, Anne Arundel, Howard and Harford counties.
A. TRAFFIC VOLUME TRENDS
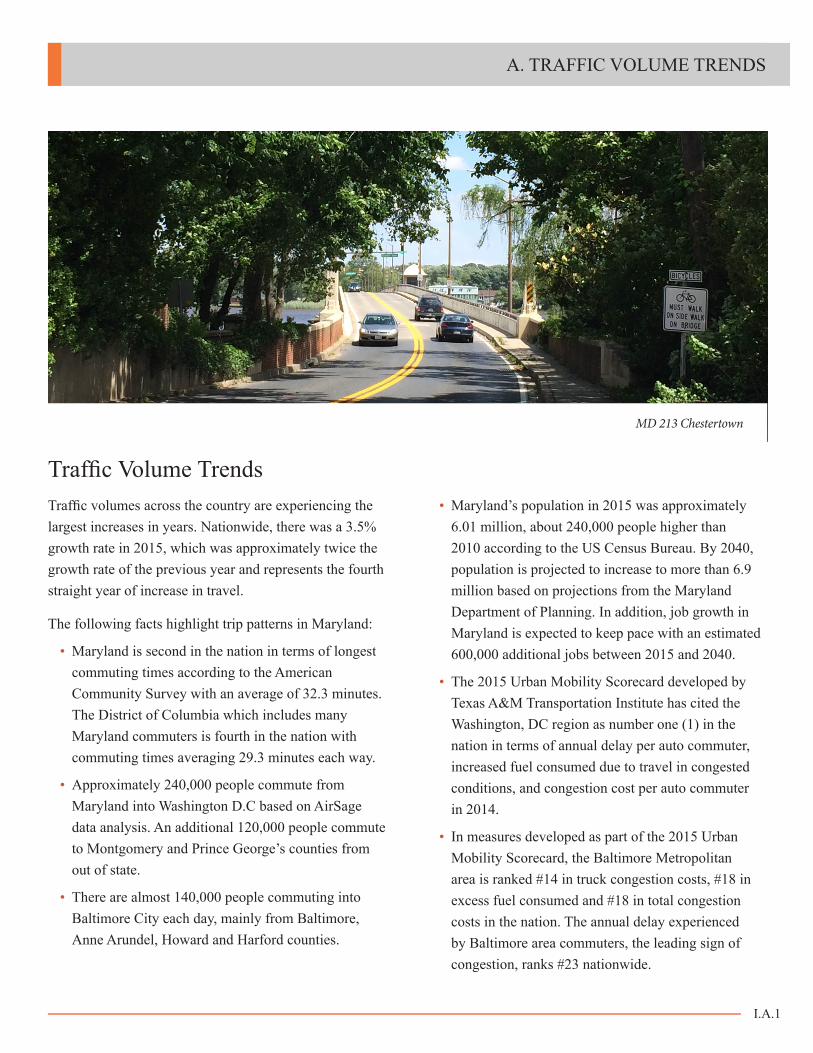
MD 213 Chestertown
• Maryland’s population in 2015 was approximately 6.01 million, about 240,000 people higher than 2010 according to the US Census Bureau. By 2040, population is projected to increase to more than 6.9 million based on projections from the Maryland Department of Planning. In addition, job growth in Maryland is expected to keep pace with an estimated 600,000 additional jobs between 2015 and 2040.
• The 2015 Urban Mobility Scorecard developed by Texas A&M Transportation Institute has cited the Washington, DC region as number one (1) in the nation in terms of annual delay per auto commuter, increased fuel consumed due to travel in congested conditions, and congestion cost per auto commuter in 2014.
• In measures developed as part of the 2015 Urban Mobility Scorecard, the Baltimore Metropolitan area is ranked #14 in truck congestion costs, #18 in excess fuel consumed and #18 in total congestion costs in the nation. The annual delay experienced by Baltimore area commuters, the leading sign of congestion, ranks #23 nationwide.
I.A.2
2016 M A RY L A N D STATE HIGHWAY MOBILITY REPORT
SHA owns and maintains the numbered, non-toll routes in Maryland’s 23 counties, a total of 14,800 lane-miles and 2,566 bridges representing the backbone of Maryland’s transportation system. This infrastructure forms the majority of the National Highway System (NHS) which includes interstate highways, freeways and major arterial roadways. The MDTA owns and operates all toll roads in the state including I-95 from the Baltimore City line (south side) to the Delaware State Line, I-895 including spurs to I-97 and MD 2, MD 695 from east of MD 10 to MD 151, the Hatem Bridge (US 40), the Chesapeake Bay Bridge (US 50/301), the Nice Bridge (US 301) and MD 200 (Intercounty Connector). The Key Bridge, Fort McHenry Tunnel, Harbor Tunnel, and Tydings Memorial Bridge are part of the system.
HISTORIC GROWTH ON MAJOR ROADWAYS
Location 1990 Average Daily Traffic (ADT)
2015 Average Daily Traffic
Average Annual Growth
MD 528 North of MD 90 31,000 48,000 1.8%
US 40 East of MD 272 23,000 32,000 1.3%
MD 5 South of MD 337 66,000 126,000 2.6%
I-70 West of I-695 58,000 101,000 2.3%
US 50 East of MD 2 56,000 97,000 2.2%
I-81 at West Virginia State Line 30,000 61,000 2.9%
US 15 South of MD 26 42,000 85,000 2.9%
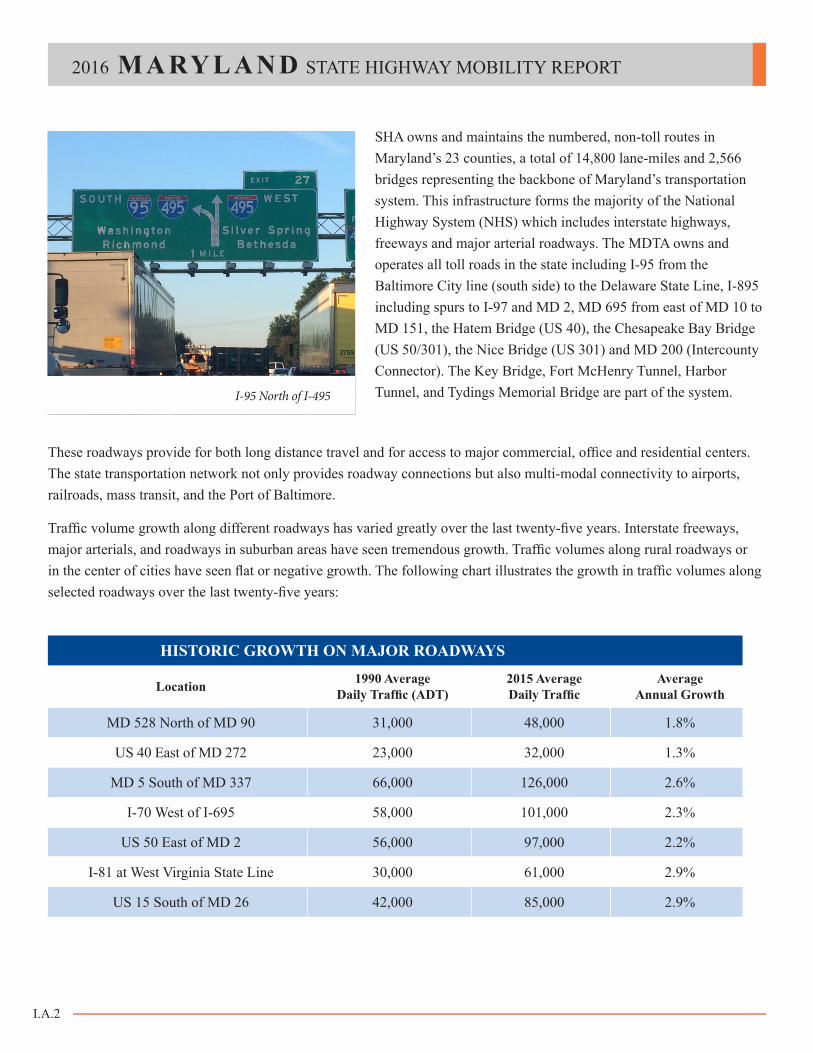
I-95 North of I-495
These roadways provide for both long distance travel and for access to major commercial, office and residential centers. The state transportation network not only provides roadway connections but also multi-modal connectivity to airports, railroads, mass transit, and the Port of Baltimore.
Traffic volume growth along different roadways has varied greatly over the last twenty-five years. Interstate freeways, major arterials, and roadways in suburban areas have seen tremendous growth. Traffic volumes along rural roadways or in the center of cities have seen flat or negative growth. The following chart illustrates the growth in traffic volumes along selected roadways over the last twenty-five years:

I.A.3
A. TRAFFIC VOLUME TRENDS
Vehicle Miles Traveled (VMT) is a standard performance measure of travel for various roadway classifications on a local, regional, state, and national level. VMT is defined as the number of vehicles times the distance traversed along the network. VMT has been measured for decades in each state including Maryland. Measuring VMT allows for a comparison in growth from month to month or year to year. Many areas in Maryland have seen growth in VMT outpacing population growth and SHA’s ability to expand the roadway network, particularly in the Baltimore - Washington region.
The highest volume SHA freeway, SHA arterial and MDTA toll facilities based on the SHA Traffic Volume maps include:
10
20
30
40
50
60
1980 1985 1990 1995 2000 2005 2010 2015
VMT
in B
illion
s
YEAR
MARYLAND ANNUAL VEHICLE MILES OF TRAVEL
STATEWIDE ANNUAL VEHICLE MILES OF TRAVEL
HIGHEST AVERAGE DAILY TRAFFIC VOLUMES
Freeway Section 2015 ADT
I-270 N of I-270 Split 255,000
I-495 E of MD 650 253,000
I-270 N of MD 189 251,000
I-495 S of I-270 West Leg 249,000
I-495 W of MD 97 228,000
Arterial Section
US 301/MD 5 N of Chadds Ford Road 88,000
MD 5 S of MD 223 83,000
MD 650 S of I-495 77,000
MD 175 E of MD 108 75,000
MD 210 S of I-95 74,000
MDTA Toll Facility Crossings
I-95 Ft. McHenry Tunnel 116,000
I-95 Tydings Bridge 83,000
I-895 Harbor Tunnel 77,000
US 50/301 Bay Bridge 72,000
Consistent with national trends, various economic and social conditions have impacted the amount of travel in Maryland since the 1980s. The annual VMT has remained relatively flat since 2005 as depicted in the following graph.
I.A.4
2016 M A RY L A N D STATE HIGHWAY MOBILITY REPORT
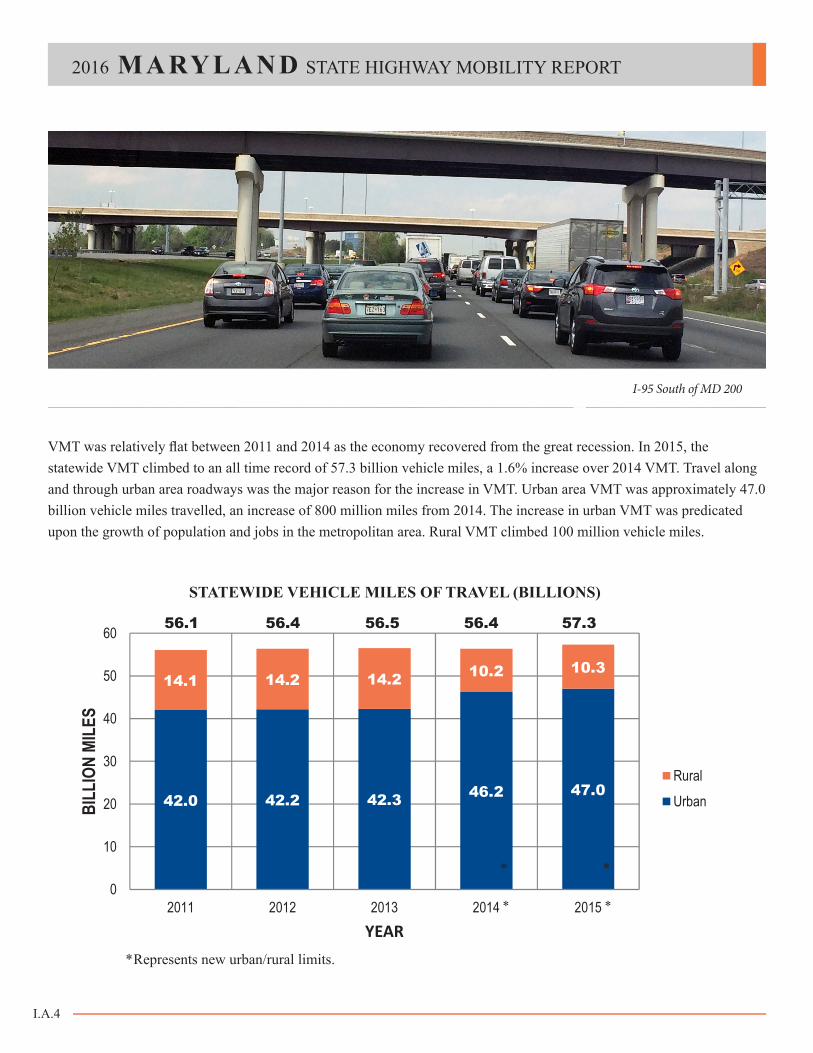
VMT was relatively flat between 2011 and 2014 as the economy recovered from the great recession. In 2015, the statewide VMT climbed to an all time record of 57.3 billion vehicle miles, a 1.6% increase over 2014 VMT. Travel along and through urban area roadways was the major reason for the increase in VMT. Urban area VMT was approximately 47.0 billion vehicle miles travelled, an increase of 800 million miles from 2014. The increase in urban VMT was predicated upon the growth of population and jobs in the metropolitan area. Rural VMT climbed 100 million vehicle miles.
42.0 42.2 42.3 46.2 47.0
14.1 14.2 14.2 10.2 10.3
0
10
20
30
40
50
60
2011 2012 2013 2014 2015
BILL
ION
MILE
S
YEAR
MARYLAND VEHICLE MILES OF TRAVEL (BILLIONS)
RuralUrban
56.4 56.5 56.4 57.356.1
STATEWIDE VEHICLE MILES OF TRAVEL (BILLIONS)
* Represents new urban/rural limits.
* *
I-95 South of MD 200
* *
I.A.5
A. TRAFFIC VOLUME TRENDS
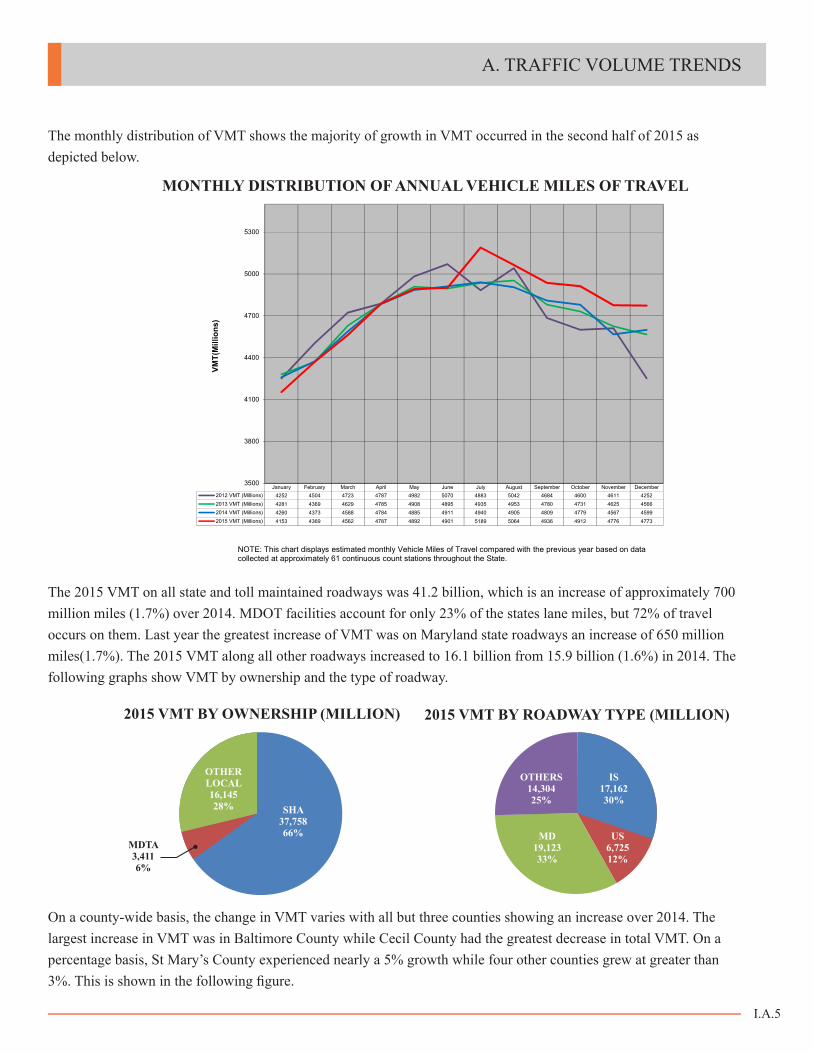
The monthly distribution of VMT shows the majority of growth in VMT occurred in the second half of 2015 as depicted below.
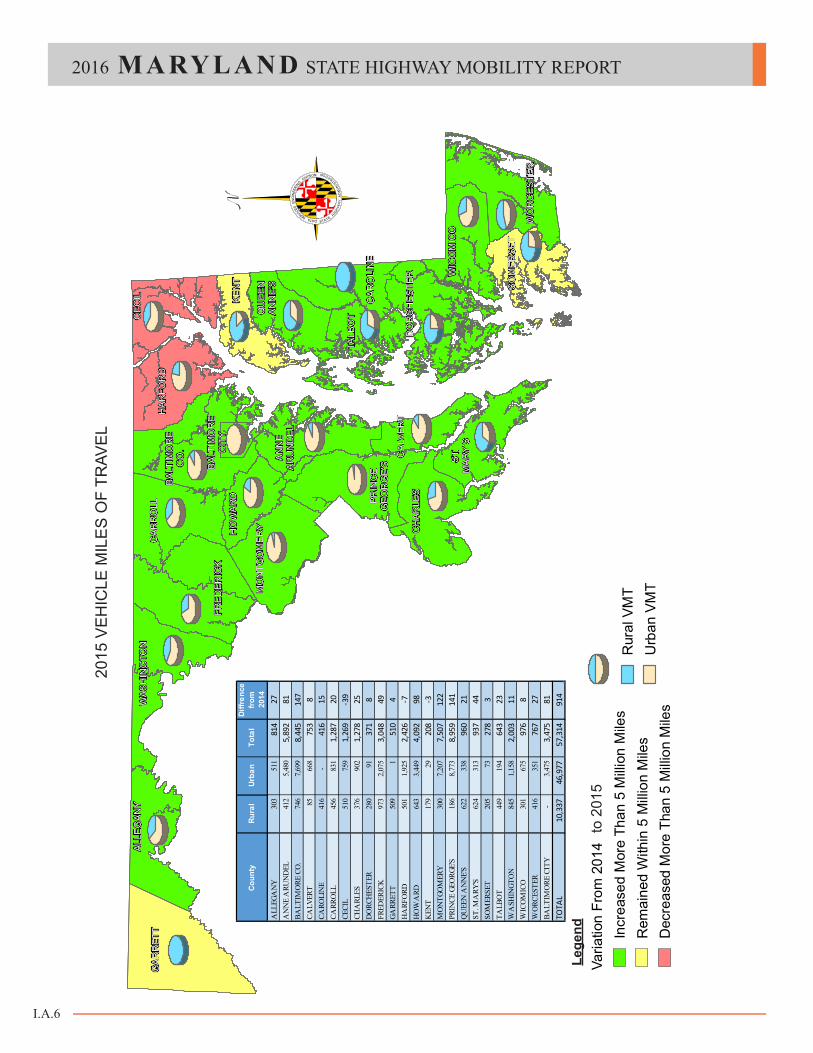
On a county-wide basis, the change in VMT varies with all but three counties showing an increase over 2014. The largest increase in VMT was in Baltimore County while Cecil County had the greatest decrease in total VMT. On a percentage basis, St Mary’s County experienced nearly a 5% growth while four other counties grew at greater than 3%. This is shown in the following figure.
January February March April May June July August September October November December2012 VMT (Millions) 4252 4504 4723 4787 4982 5070 4883 5042 4684 4600 4611 42522013 VMT (Millions) 4281 4369 4629 4785 4908 4895 4935 4953 4780 4731 4625 45662014 VMT (Millions) 4260 4373 4588 4784 4885 4911 4940 4905 4809 4779 4567 45992015 VMT (Millions) 4153 4369 4562 4787 4892 4901 5189 5064 4936 4912 4776 4773
3500
3800
4100
4400
4700
5000
5300
VMT(
Mill
ions
)
NOTE: This chart displays estimated monthly Vehicle Miles of Travel compared with the previous year based on data collected at approximately 61 continuous count stations throughout the State.
Estimated Monthly Distribution of Annual Vehicle Miles of TravelMONTHLY DISTRIBUTION OF ANNUAL VEHICLE MILES OF TRAVEL
The 2015 VMT on all state and toll maintained roadways was 41.2 billion, which is an increase of approximately 700 million miles (1.7%) over 2014. MDOT facilities account for only 23% of the states lane miles, but 72% of travel occurs on them. Last year the greatest increase of VMT was on Maryland state roadways an increase of 650 million miles(1.7%). The 2015 VMT along all other roadways increased to 16.1 billion from 15.9 billion (1.6%) in 2014. The following graphs show VMT by ownership and the type of roadway.
2015 VMT BY OWNERSHIP (MILLION) 2015 VMT BY ROADWAY TYPE (MILLION)
MDTA3,4116%
OTHER LOCAL16,14528% SHA
37,75866%
OTHERS14,30425%
MD19,12333%
IS17,16230%
US6,72512%
I.A.6
2016 M A RY L A N D STATE HIGHWAY MOBILITY REPORT
2015
VE
HIC
LE M
ILE
S O
F TR
AVE
L
ALL
EG
AN
Y
AN
NE
AR
UN
DE
L
BA
LTIM
OR
EC
O. CA
LVE
RT
CA
RO
LIN
E
CA
RR
OLL
CE
CIL
CH
AR
LES
DO
RC
HE
STE
R
FRE
DE
RIC
K
GA
RR
ETT
HA
RFO
RD
HO
WA
RD
KE
NT
MO
NTG
OM
ER
Y
PR
INC
EG
EO
RG
E'S
QU
EE
NA
NN
E'S
ST.
MA
RY
'S
SO
ME
RS
ET
TALB
OT
WA
SH
ING
TON
WIC
OM
ICO
WO
RC
ES
TER
BA
LTIM
OR
EC
ITY
VEH
ICLE
MIL
ES O
F TR
AVEL
- 2
015
DAT
A
Varia
tion
From
201
4In
crea
sed
Mor
e Th
an 5
Milli
on M
iles
Rem
aine
d W
ithin
5 M
illio
n M
iles
Dec
reas
ed M
ore
Than
5 M
illio
n M
iles
Rur
al V
MT
Urb
an V
MT
STATE H IGH
WA
Y
AD
MIN
IS
TRATION
DATA SERVICES
EN
GIN
EERI
NG DIVISION
Coun
ty
Rura
lUr
ban
Tota
lDi
ffren
ce
from
20
14
ALL
EGA
NY
303
511
814
27
AN
NE
ARU
ND
EL41
2
5,
480
5,
892
81BA
LTIM
ORE
CO
.74
6
7,
699
8,
445
147
CALV
ERT
85
668
753
8
CARO
LIN
E41
6
-
416
15
CARR
OLL
456
831
1,28
7
20
CECI
L51
0
75
9
1,
269
-39
CHA
RLES
376
902
1,27
8
25
DO
RCH
ESTE
R28
0
91
37
1
8FR
EDER
ICK
973
2,07
5
3,04
8
49
GARR
ETT
509
1
51
0
4H
ARF
ORD
501
1,92
5
2,42
6
-7
HO
WA
RD64
3
3,
449
4,
092
98K
ENT
179
29
208
-3
MO
NTG
OM
ERY
300
7,20
7
7,50
7
12
2PR
INCE
GEO
RGE'
S18
6
8,
773
8,
959
141
QU
EEN
AN
NE'
S62
2
33
8
96
0
21ST
. MA
RY'S
624
313
937
44
SOM
ERSE
T20
5
73
27
8
3TA
LBO
T44
9
19
4
64
3
23W
ASH
INGT
ON
845
1,15
8
2,00
3
11
WIC
OM
ICO
301
675
976
8
WO
RCES
TER
416
351
767
27
BALT
IMO
RE C
ITY
-
3,
475
3,
475
81TO
TAL
10,3
37
46,9
77
57,3
14
914
to 2
015
Lege
nd
I.A.7
A. TRAFFIC VOLUME TRENDS
ALLEGANY
ANNEARUNDEL
BALTIMORECO.
CALVERT
CAROLINE
CARROLL
CECIL
CHARLES DORCHESTER
FREDERICK
GARRETT HARFORD
HOWARDKENT
MONTGOMERY
PRINCEGEORGE'S
QUEENANNE'S
ST.MARY'S
SOMERSET
TALBOT
WASHINGTON
WICOMICO
WORCESTER
BALTIMORECITY
BALTIMORE METROPOLITAN REGIONWASHINGTON METROPOLITAN REGIONEASTERN SHORE REGIONWESTERN MARYLAND REGIONSOUTHERN MARYLAND REGION
ST
ATE H IGH W AY ADM I N IS
TRATIO
N
DAT
A SE
RVICES ENGINEERING DIVISION
BALTIMORE METROPOLITAN REGION
• Anne Arundel County
• Baltimore City
• Baltimore County
• Carroll County
• Harford County
• Howard County
WASHINGTON METROPOLITAN REGION (MARYLAND COUNTIES)
• Frederick County
• Montgomery County
• Prince George’s County
SOUTHERN MARYLAND
• Calvert County
• Charles County
• St. Mary’s County
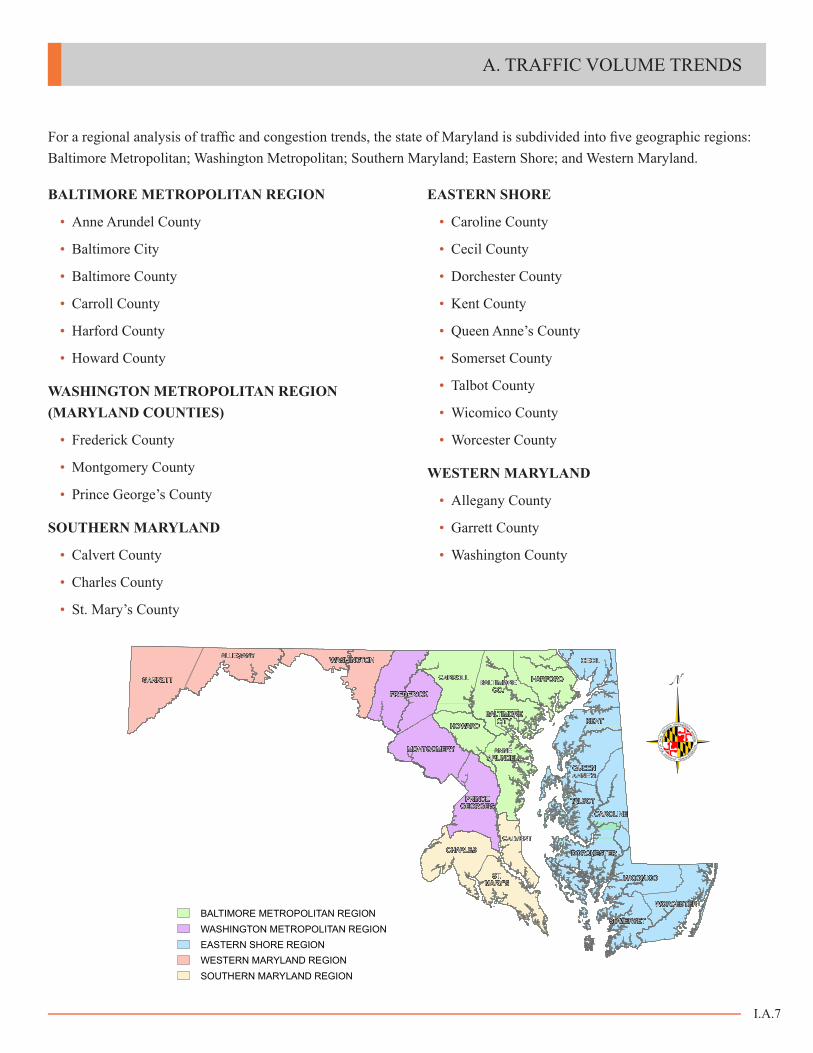
For a regional analysis of traffic and congestion trends, the state of Maryland is subdivided into five geographic regions: Baltimore Metropolitan; Washington Metropolitan; Southern Maryland; Eastern Shore; and Western Maryland.
EASTERN SHORE
• Caroline County
• Cecil County
• Dorchester County
• Kent County
• Queen Anne’s County
• Somerset County
• Talbot County
• Wicomico County
• Worcester County
WESTERN MARYLAND
• Allegany County
• Garrett County
• Washington County

I.A.8
2016 M A RY L A N D STATE HIGHWAY MOBILITY REPORT
The following chart shows that four of the five regions experienced a growth in VMT compared to 2014 with only Western Maryland remaining flat.
VMT 2011 2012 2013 2014 2015
Baltimore Region 25.0 25.2 25.2 25.2 25.6
Washington Region 19.1 19.1 19.2 19.2 19.5
Southern Region 2.8 2.8 2.9 2.9 3.0
Eastern Shore Region 5.8 5.9 5.8 5.8 5.9
Western Region 3.4 3.4 3.4 3.3 3.3
Total 56.1 56.4 56.5 56.4 57.3
VMT BY REGION


