
THE EFFECT OF MODIFIED ADP-GLUCOSE PYROPHOSPHORYLASE
ACTIVITY ON STARCH METABOLISM IN PLANTA
By
YASUKO NAGAI
A thesis submitted in partial fulfillment of
the requirements for the degree of
Master of Science in Molecular Plant Sciences
WASHINGTON STATE UNIVERSITY
Department of Molecular Plant Sciences
DECEMBER 2008

ii
To the Faculty of Washington State University:
The members of the Committee appointed to examine the thesis of
YASUKO NAGAI find it satisfactory and recommend that it be accepted.
___________________________________
Chair
___________________________________
___________________________________

iii
ACKNOWLEDGMENT
I would like to express my sincere thanks to my major professors, Dr. Thomas W.
Okita and Dr. Gerald E. Edwards, for their supports, advice, and most of all, their
patience. I would also like to thank my committee members, Drs. Mark Lange and David
M. Kramer, for their valuable suggestion and advice. Special thanks are extended to the
past and present members of the Okita and Edwards laboratories for technical assistances
and intellectual discussion.
In addition, I would like to acknowledge financial supports from my advisor Dr.
Thomas W. Okita and the Graduate Program in Molecular Plant Sciences.
Lastly, I wish to thank all my friends and family for their encouragements and
emotional support.

iv
THE EFFECT OF MODIFIED ADP-GLUCOSE PYROPHOSPHORYLASE
ACTIVITY ON STARCH METABOLISM IN PLANTA
Abstract
by Yasuko Nagai, M. S.
Washington State University
December 2008
Chair: Thomas W. Okita
Increasing plant productivity and crop yield depends on modification in the
capacity of source tissues and sink strength. Starch is not only a dominant reserve in
plants, but also the major carbohydrate in the human diet. Although starch metabolism in
source and sink organs is different, ADP-glucose pyrophosphorylase (AGPase) catalyzes
the rate-limiting step of starch biosynthesis in both tissues. In order to investigate the
effect of up-regulated AGPase, transgenic plants having enhanced AGPase activity were
examined in Arabidopsis leaves and rice seeds.
Source leaves play a crucial role as the site of CO2 fixation by photosynthesis as
well as a transient sink for accumulating starch to support plant growth. Up-regulated
transgenic Arabidopsis having single or double mutations in the ApL1 gene encoding the
AGPase large subunit were successfully transformed in a TL46 starch-deficient mutant
which lacks a functional large subunit. All up-regulated transgenic plants had two to
four-fold higher leaf AGPase activity and showed higher CO2 assimilation rates, greater
leaf starch turnover and larger plant biomass compared to wildtype, TL46 mutant and
T65 control having intact wildtype ApL1 gene. These results indicate that increased leaf
AGPase activity contributed to an enhancement of leaf starch accumulation and turnover
and increase plant development.

v
In rice, long-term starch storage accounts for 75-80% of the seed dry weight. Up-
regulated transgenic rice containing Escherichia coli glgC-triple mutant gene which
encodes a bacterial AGPase led to three to six-fold increase in AGPase activity and 7-
24% enhanced seed biomass compared to wildtype Kitaake. In order to obtain additional
understanding of these transformants, metabolite analysis of up-regulated transgenic lines
along with wildtype was performed. Increased levels of ADP-glucose, a product of
AGPase, and hexose pools such as glucose 1-phosphate and glucose 6-phosphate, were
observed in all up-regulated transgenic rice. The change in hexose-phosphate pools
indicates that some other factor besides AGPase limits starch biosynthesis in rice
endosperm. Transport of ADP-glucose into amyloplasts and/or restricted activities of
starch biosynthesis enzymes are the likely processes which may be limiting rice starch
production in these transgenic plants.

vi
TABLE OF CONTENTS
Page
ACKNOWLEDGEMENTS................................................................................................ iii
ABSTRACT.........................................................................................................................iv
LIST OF TABLES............................................................................................................ viii
LIST OF FIGURES ..............................................................................................................x
DEDICATION ....................................................................................................................xi
CHAPTER ONE
INTRODUCTION
1. GENERAL INTRODUCTION..............................................................................1
2. REFERENCES ......................................................................................................8
3. FIGURE LEGENDS............................................................................................12
CHAPTER TWO
Genetic modification of leaf ADP-glucose pyrophosphorylase in Arabidopsis
for enhanced leaf starch turnover and plant productivity
1. ABSTRACT.........................................................................................................15
2. INTRODUCTION ...............................................................................................17
3. MATERIALS AND METHODS.........................................................................19
4. RESULTS ............................................................................................................24
5. DISCUSSION......................................................................................................29
6. REFERENCES ....................................................................................................33

vii
7. FIGURE LEGENDS............................................................................................36
CHAPTER THREE
Control of starch synthesis in cereals: metabolite analysis of transgenic rice expressing
up-regulated cytoplasmic ADP-glucose pyrophosphorylase in developing seeds
1. ABSTRACT.........................................................................................................57
2. INTRODUCTION ...............................................................................................59
3. MATERIALS AND METHODS.........................................................................61
4. RESULTS ............................................................................................................63
5. DISCUSSION......................................................................................................66
6. ACKNOWLEDGEMENT ...................................................................................70
7. REFERENCES ....................................................................................................71
8. FIGURE LEGENDS............................................................................................75

viii
LIST OF TABLES
Page
1. AGPase activity of wildtype, TL46 mutant and backcrossed transgenic lines.............40
2. Photsynthesis of wildtype, TL46 mutant and backcrossed transgenic lines.................41
3. Stimulation of CO2 assimilation rate by 2% O2 in wildtype, TL46 mutant and
backcrossed transgenic lines .........................................................................................42
4. Leaf starch content of wildtype, TL46 mutant and backcrossed transgenic lines ........43
5. Biomass measurements of wildtype, TL46 mutant and backcrossed transgenic lines..44
6. Chlorophyll content of wildtype, TL46 mutant and backcrossed transgenic lines.......47
7. Normalized CO2 assimilation rate of wildtype, TL46 mutant and backcrossed
transgenic lines .............................................................................................................48
8. Normalized leaf starch content of wildtype, TL46 mutant and backcrossed transgenic
lines….... .......................................................................................................................49
9. Normalized biomass measurements of wildtype, TL46 mutant and backcrossed
transgenic lines .............................................................................................................50
10. Chlorophyll content of wildtype, TL46 mutant and wildtype-background transgenic
lines…….......................................................................................................................51
11. AGPase activity of wildtype, TL46 mutant and wildtype-background transgenic
lines…… ......................................................................................................................52
12. Photosynthesis of wildtype, TL46 mutant and wildtype-background transgenic line...53
13. Leaf starch content of wildtype, TL46 mutant and wildtype-background transgenic
lines…... .......................................................................................................................54
14. Biomass measurements of wildtype, TL46 mutant and wildtype-background

ix
transgenic lines..............................................................................................................55
15. The seed weights of wildtype and CS 8 rice.................................................................80
16. Grain size of wildtype and CS 8 rice ............................................................................81
17. Metabolic levels in 13-day-old developing seeds from wildtype and CS 8 rice ..........83

x
LIST OF FIGURES
Page
1. Carbon flow in leaf tissue and the biochemical basis of feedback ...............................13
2. Carbon metabolic pathway from sucrose to starch in cereal endosperm......................14
3. Structure of the ApL1 gene, which encodes the large subunit of AGPase, in the
Arabidopsis transgenic lines .........................................................................................38
4. Iodine staining of wildtype, TL46 mutant and backcrossed transgenic lines ...............39
5. Images of wildtype, TL46 mutant and backcrossed transgenic lines ...........................45
6. Leaf morphology of wildtype and TL46 mutant Arabidopsis ......................................46
7. Images of wildtype, TL46 mutant and wildtype-background transgenic lines.............56
8. Structure of rice transgenic lines in the region of glgC-TM gene in CS 8 rice ............77
9. AGPase activity of wildtype and CS 8 rice under no Pi and Pi-inhibitory conditions .78
10. Comparison of immature seed weight of wildtype and CS 8 rice ................................79
11. Seed morphology of wildtype and CS 8 rice ................................................................82

xi
DEDICATION
This thesis is dedicated to my dear husband Kenji Takizawa,
my lovely daughter Yuri Takizawa and my family
who supported and encouraged me during this difficult moment.

1
CHAPTER ONE
GENERAL INTRODUCTION
Due to an increasing world population, global improvement of plant productivity
and crop yield is a high priority. Plant productivity and yield are dependent on the
capacity of CO2 fixation by photosynthesis in leaves and on the capacity of sink organs to
convert fixed carbon into dry matter. Various approaches have been undertaken towards
enhancing yield such as increasing source capacity and/or sink strength as well as
modifying assimilate partitioning.
Starch is the dominant reserve in source and sink organs in many plants. During
the vegetative stage, plants accumulate sugars and starch by photosynthesis in source
leaves and utilize the photosynthates for plant development and growth. However,
during the reproductive stage, most of the photoassimilates synthesized in leaves are
transported to sink organs (e.g. seeds, tubers and fruits) for long-term storage in the form
of starch, lipids and proteins.
ADP-glucose pyrophosphorylase (AGPase) catalyzes the first committed step in
the starch biosynthesis pathway of plants. Recent studies [e.g. the modified bacterial
genes into potato (Stark et al. 1992), rice (Sakulsingharoj et al. 2004) and cassava
(Ihemerell et al. 2006); the maize genes into maize (Giroux et al. 1996), wheat
(Smidansky et al. 2002) and rice (Simidansky et al. 2003); and the Arabidopsis genes
into Arabidopsis (Gibson et al. 2003; Obana et al. 2006)] have utilized an engineered
AGPase to enhance plant productivity and yields. Gibson et al. (2003) and Obana et al.
(2006) demonstrated that transgenic Arabidopsis having higher leaf AGPase activity than

2
wildtype plants showed a greater turnover of transitory starch, higher capacity for starch
biosynthesis and elevated plant biomass (e.g. leaf area and seed weight) compared to
wildtype and a starch-deficient mutant, TL46. A similar approach was undertaken to
modify sink organs by the expression of a modified Escherichia coli glgC triple mutant
(glgC-TM) gene, which encodes a highly active and allosterically insensitive AGPase, in
rice endosperm (Sakulsingharoj et al. 2004). The glgC -TM lines exhibited higher
levels of AGPase activity, higher rates of conversion of 14
C-sucrose into starch, and
increased seed weight. These results demonstrated that AGPase is one of the limiting
factors in starch biosynthesis in both source and sink organs. It also suggests that starch
metabolism is an important process in influencing plant productivity.
Increasing plant productivity
In order to eliminate the hunger caused by the explosion of the world population
growth, especially in India, the green revolution was initiated at the International Maize
and Wheat Improvement Center (CIMMYT) in Mexico and the International Rice
Research Institute (IRRI) in the Philippines in the 1960s. High yielding varieties of rice
and wheat having semi-dwarf properties were created using traditional breeding
techniques as well as the introduction of new agricultural management practices using
nitrogen fertilizer, pesticides and irrigation. Global production of cereal crops has more
than doubled in developing countries over the thirty years since the start of the green
revolution (Surridge, 2002). Although the green revolution led to a dramatic increase in
cereal production, it also created problems such as land salinity which led to
desertification and the disappearance of genetic resources. While the global population

3
is still increasing, the amount of arable lands on the Earth is limited. In order to feed the
increasing world population in the future, enhancing the genetic yield potential of the
major crop plants for increased yields is the only feasible approach.
The genetic yield potential of crop plants depends on source-sink relationships.
The photoassimilates produced by photosynthesis in source leaves are transported into
sink tissues such as young leaves for growth and development or reserves such as tubers,
seeds and fruits for long-term storage. Increasing photosynthetic efficiency in leaves
leads to greater growth development and the export rate of photosynthates into the sink
and in turn, improvement of plant productivity.
Besides source capacity, sink strength is also a vital factor in determining yield.
In non-photosynthetic sink organs, transported sugars and photosynthates are converted
into reserve compounds (e.g. starch, lipids and proteins). Increased sink capacity will
enhance photosynthesis efficiency in source leaves (Smidansky et al. 2002, Smidansky et
al. 2003). Therefore, the improvement of source-sink relationships will result in
increases in plant productivity and crop yield.
The structure and regulation of plant AGPase
AGPase (EC 2.7.7.27) catalyzes a pivotal, reversible reaction [glucose-1-
phosphate + ATP ↔ADP-glucose + pyrophosphate] which controls carbon flux in the
starch/glycogen pathway in plants and bacteria. The bacterial AGPase is comprised of
four identical subunits (α4) of 48 kilodaltons (kDa) (Ballicora et al. 2003). The subunits
are encoded by a single gene locus, glgC (Leung and Preiss, 1987, Okita et al. 1981). In
contrast, higher plant AGPases are a heterotetramer (α2β2) consisting of two different

4
subunits, a regulatory large subunit of 51-60 kDa and a catalytic small subunit of 50-54
kDa, which share about 50% sequence identity (Nakata et al. 1991). Sequence
comparisons of the large subunit and small subunit genes from many plant species by
Smith-White and Preiss (1992) indicated that the primary sequences of the small subunits
are highly conserved (> 90% identity) while those of the large subunits have greater
diversity (< 85% identity). Georgelis et al. (2007) proposed that the small subunit is
less prone to mutation as it must assemble with different isoforms of the large subunit,
which display much more sequence diversity. In Arabidopsis, four genes for large
subunits (ApL1, ApL2, ApL3 and ApL4) and two genes for small subunits (ApS1 and
ApS2) were identified (Crevillen et al. 2003, Crevillen et al. 2005). Large subunit
isoforms have tissue-specific expression such as ApL1 for leaf and ApL3 for endosperm.
Like Arabidopsis, rice has the same number of AGPase encoding genes in the AGP gene
family (Ohdan et al. 2005, Lee et al. 2007). Based on mutant studies in Arabidopsis
(Lin et al. 1988a, Lin et al. 1988b) and maize (Tsai and Nelson, 1966, Nelson and Pan
1995), both subunits are required for maximum catalytic activity.
Despite their structural differences, the bacterial and plant AGPases are subject to
allosteric regulation by small effector molecules. The AGPases from enteric bacteria
are activated by fructose-1, 6-bisphosphate and inhibited by AMP, whereas the plant
AGPases are activated and inhibited by the major photoassimilates 3-phosphoglyceric
acid (3-PGA) and inorganic phosphate (Pi), respectively. Many of the higher plant
AGPases are also controlled by redox regulation where the pair of small subunits in
heterotetrameric enzyme is linked by a disulfide bond (Jin et al. 2005). Light and
sugars act as a trigger of the posttranslational redox modification via ferredoxin-

5
thioredoxin and via sugar signaling pathways involving SnRK1 (sucrose-non-fermenting-
1-related protein kinase) and hexokinase (Tiessen et al. 2003, Hendriks et al. 2003,
Geigenberger et al. 2005). It has also been found that trehalose-6-phosphate regulates
redox activation of AGPase via the involvement of 14-3-3 signal transduction proteins
(Huber et al. 2002, Kolbe et al. 2005, Lunn et al. 2006).
The regulation of starch biosynthesis in leaf tissues (Figure 1)
In leaves, AGPase is localized in the chloroplast, the site of starch synthesis.
ADP-glucose, the product of AGPase, is used as a substrate by starch synthases, which
add glucose units to the non-reducing end of α-1, 4-glucosidic polymer chains.
Branches in the chain are introduced by starch branching enzyme, which hydrolyzes α-1,
4-glucosidic bonds and creates an α-1, 6-glucosidic bond within the same or neighboring
chain. Though debranching enzyme is required for starch breakdown, the enzyme
activity also plays a role in the starch synthesis pathway by trimming (redesigning) long
side chains of glucosyl residues in amylopectin.
Plants synthesize triose-phosphates which are the initial product of
photosynthesis. The bulk of the triose-phosphate is exported to the cytoplasm where it
is metabolized to sucrose, which is exported to sink tissues to support growth and
development. When the levels of sucrose become saturated in the cytosol due to sink
limitations, the rate of export of triose-phosphate from the chloroplast is decreased via
the triose-phosphate/Pi transporter. Starch synthesis is then activated because of the
increased ratio of 3-PGA/Pi in the chloroplast which is required for activation of AGPase.
High level of Pi in chloroplast stroma is essential to maintain photophosphorylation,

6
which is the production of ATP using absorbed light energy, and the synthesis of ribulose-
1, 5-bisphosphate (RuBP), a substrate for Ribulose-1, 5-bisphosphate
carboxylase/oxygenase (Rubisco), in the Calvin cycle. Preventing the recycling of Pi
results in photosynthetic feedback because of the repression of photosynthetic efficiency
by decreased photophosphorylation and RuBP formation. Therefore, leaf starch serves
not only as a reserve of carbon and energy required for plant maintenance during the
night period, but also as a transient sink to recycle Pi.
Starch synthesis in sink tissue (Figure 2)
AGPase has two forms in developing cereal endosperm. In maize (Denyer et al.
1996), barley (Thorbjørnsen et al. 1996) and rice (Sikka et al. 2001), the dominant
isoform is localized in the cytoplasm while a minor form is in the amyloplast, a
specialized starch containing plastid in endosperm tissue. The main pathway for starch
synthesis from sucrose in rice endosperm consists of UDP-glucose, glucose-1-phosphate,
and ADP-glucose. Sucrose unloaded from the source tissue via phloem in the seed enters
the cytosol where it can be metabolized by two different routes. The main pathway for
sucrose metabolism is catalyzed by sucrose synthase which converts sucrose to UDP-
glucose and fructose as the initial step. UDP-glucose is then converted to glucose-1-
phosphate by UDP-glucose pyrophosphorylase. Cytoplasmic AGPase converts glucose-
1-phosphate to ADP-glucose. ADP-glucose is transported from the cytoplasm into
amyloplast via the ADP-glucose transporter (Brittle-1) in counter-exchange with ADP
which is a by-product of the starch synthase reaction in amyloplasts (Bowsher et al.
2007).

7
In order to gain further insight on the relationship between starch metabolism and
plant productivity at the physiological and metabolic levels, studies using transgenic
Arabidopsis and rice plants expressing up-regulated AGPase were performed. Chapter
two describes the physiological effects of up-regulated leaf AGPase on leaf starch
metabolism, photosynthesis and biomass. Transgenic Arabidopsis plants were
examined for the correlation between AGPase activity, leaf starch levels, CO2
assimilation rates and overall plant growth compared to wildtype and TL46 starch-
deficient mutant. In Chapter three, metabolite analysis of up-regulated cytoplasmic
AGPase in developing rice seeds was performed in an effort to understand how the up-
regulated AGPase contributes to increased seed weight. The results of this experiment
give an increased understanding of the regulation of starch biosynthesis and sink strength
in sink tissues.

8
References
Ballicora, M. A., A. A. Iglesias, et al. (2004). "ADP-Glucose pyrophosphorylase: a
regulatory enzyme for plant starch synthesis." Photosynth Res 79(1): 1-24.
Bowsher, C. G., E. F. Scrase-Field, et al. (2007). "Characterization of ADP-glucose
transport across the cereal endosperm amyloplast envelope." J Exp Bot 58(6):
1321-32.
Crevillén, P., M. A. Ballicora, et al. (2003). “The different large subunit isoforms of
Arabidopsis thaliana ADP-glucose pyrophosphorylase confer distinct kinetic and
regulatory properties to the heterotetrameric enzyme.” J Biol Chem 278(31):
28508-15.
Crevillén, P., T. Ventriglia et al. (2005) “Differential pattern of expression and sugar
regulation of Arabidopsis thaliana ADP-glucose pyrophosphorylase-encoding
genes.” J Biol Chem 280(9): 8143-9.
Denyer, K., F. Dunlap, et al. (1996). "The major form of ADP-glucose
pyrophosphorylase in maize endosperm is extra-plastidial." Plant Physiol 112(2):
779-85.
Geigenberger, P., A. Kolbe, et al. (2005). "Redox regulation of carbon storage and
partitioning in response to light and sugars." J Exp Bot 56(416): 1469-79.
Georgelis, N., E. L. Braun, et al. (2007). "The two AGPase subunits evolve at different
rates in angiosperms, yet they are equally sensitive to activity-altering amino acid
changes when expressed in bacteria." Plant Cell 19(5): 1458-72.
Gibson, K. M., S. K. Hwang, et al. (2003). "Metabolic engineering of starch for enhanced
plant productivity and yields." J Applied Glycoscience 50: 201-206.

9
Giroux, M. J., J. Shaw, et al. (1996). "A single mutation that increases maize seed
weight." Proc Natl Acad Sci U S A 93(12): 5824-9.
Hendriks, J. H., A. Kolbe, et al. (2003). "ADP-glucose pyrophosphorylase is activated by
posttranslational redox-modification in response to light and to sugars in leaves of
Arabidopsis and other plant species." Plant Physiol 133(2): 838-49.
Huber, S. C., C. MacKintosh, et al. (2002). "Metabolic enzymes as targets for 14-3-3
proteins." Plant Mol Biol 50(6): 1053-63.
Ihemere, U., D. Arias-Garzon, et al. (2006). "Genetic modification of cassava for
enhanced starch production." Plant Biotechnol J 4(4): 453-65.
Jin, X., M. A. Ballicora, et al. (2005). "Crystal structure of potato tuber ADP-glucose
pyrophosphorylase." Embo J 24(4): 694-704.
Kolbe, A., A. Tiessen, et al. (2005). "Trehalose 6-phosphate regulates starch synthesis via
posttranslational redox activation of ADP-glucose pyrophosphorylase." Proc Natl
Acad Sci U S A 102(31): 11118-23.
Leung, P. S. and J. Preiss (1987). "Cloning of the ADP-glucose pyrophosphorylase (glgC)
and glycogen synthase (glgA) structural genes from Salmonella typhimurium
LT2." J Bacteriol 169(9): 4349-54.
Lin, T. P., T. Caspar, et al. (1988a). "Isolation and characterization of a starchless mutant
of Arabidopsis thaliana (L.) Heynh lacking ADP-glucose pyrophosphorylase
activity." Plant Physiol 86: 1131-1135.
Lin, T. P., T. Caspar, et al. (1988b). "A starch deficient mutant of Arabidopsis thaliana
with low ADP-glucose pyrophosphorylase activity lacks one of the two subunits
of the enzyme." Plant Physiol 88: 1175-1181.

10
Lunn, J. E., R. Feil, et al. (2006). "Sugar-induced increases in trehalose 6-phosphate are
correlated with redox activation of ADP-glucose pyrophosphorylase and higher
rates of starch synthesis in Arabidopsis thaliana." Biochem J 397(1): 139-48.
Nakata, P. A., T. W. Greene, et al. (1991). "Comparison of the primary sequences of two
potato tuber ADP-glucose pyrophosphorylase subunits." Plant Mol Biol 17(5):
1089-93.
Nelson, O. and D. Pan (1995). "Starch synthesis in maize endosperms." Annu Rev Plant
Physiol Plant Mol Biol 46: 475-496.
Obana, Y., D. Omoto, et al. (2005). "Enhanced turnover of transitory starch by expression
of up-regulated ADP-glucose pyrophosphorylases in Arabidopsis thaliana." Plant
Sci 170: 1-11.
Ohdan, T., P. B. Jr Francisco, et al. (2005). “Expression profiling of genes involved in
starch synthesis in sink and source organs of rice.” J Exp Bot 56(422): 3229-44.
Okita, T. W., R. L. Rodriguez, et al. (1981). "Biosynthesis of bacterial glycogen. Cloning
of the glycogen biosynthetic enzyme structural genes of Escherichia coli." J Biol
Chem 256(13): 6944-52.
Sakulsingharoj, C., S.-B. Choi, et al. (2004). "Engineering starch biosynthesis for
enhanced rice yields: the role of the cytoplasmic ADP-glucose
pyrophosphorylase." Plant Sci 167: 1323-1333.
Sikka, V. K., S. B. Choi, et al. (2001). "Subcellular compartmentation and allosteric
regulation of the rice endosperm ADP-glucose pyrophosphorylase." Plant Sci 161:
461-468.
Smidansky, E. D., M. Clancy, et al. (2002). "Enhanced ADP-glucose pyrophosphorylase

11
activity in wheat endosperm increases seed yield." Proc Natl Acad Sci U S A
99(3): 1724-9.
Smidansky, E. D., J. M. Martin, et al. (2003). "Seed yield and plant biomass increases in
rice are conferred by deregulation of endosperm ADP-glucose
pyrophosphorylase." Planta 216(4): 656-64.
Smith-White, B. J. and J. Preiss (1992). "Comparison of proteins of ADP-glucose
pyrophosphorylase from diverse sources." J Mol Evol 34(5): 449-64.
Stark, D. M., K. P. Timmerman, et al. (1992). "Regulation of the amount of starch in
plant tissues by ADP-glucose pyrophosphorylase." Science 258: 287–292.
Surridge, C. (2002). "The rice squad." Nature 416: 576-578.
Thorbjørnsen, T., P. Villand, et al. (1996). "A single gene encodes two different
transcripts for the ADP-glucose pyrophosphorylase small subunit from barley
(Hordeum vulgare)." Biochem J 313 (Pt 1): 149-54.
Tiessen, A., K. Prescha, et al. (2003). "Evidence that SNF1-related kinase and hexokinase
are involved in separate sugar-signalling pathways modulating post-translational
redox activation of ADP-glucose pyrophosphorylase in potato tubers." Plant J
35(4): 490-500.
Tsai, C. Y. and O. E. Nelson (1966). "Starch-deficient maize mutant lacking adenosine
dephosphate glucose pyrophosphorylase activity." Science 151(708): 341-3.

12
Figure Legends
Figure 1. Carbon flow in leaf tissue and the biochemical basis of feedback. At
the beginning of light period, photoassimilates are transported into cytosol and utilized
for sucrose synthesis. After saturation of sucrose synthesis by sink limitation, starch
synthesis in chloroplasts becomes active because of the high ratio of triose-phosphate/Pi
in the stroma. Released Pi by plastidial AGPase is recycled for RuBP formation and
ATP production to avoid photosynthetic feedback, thereby maintaining continuous starch
biosynthesis. Black box: Triose-phosphate/Pi transporter
Figure 2. Carbon metabolic pathway from sucrose to starch in cereal
endosperm. In the major pathway of starch synthesis, ADP-glucose is synthesized in
the cytoplasm by cytosolic AGPase and transported into amyloplasts via Brittle-1
transporter. 1. Cell wall invertase, 2. Cytoplasmic invertase, 3. Sucrose synthase, 4.
Hexokinase, 5. Phosphohexose isomerase, 6. UDP-glucose pyrophosphorylase, 7.
Cytoplasmic phosphoglucomutase, 8. Cytoplasmic AGPase, 9. Plastidial AGPase, 10.
Plastidial phosphoglucomutase, Black box on amyloplast membrane: ADP-glucose
transporter (Brittle-1)

13
Figure 1
CYTOSOL CHLOROPLAST
ADP ATP
F - bis - P
RuBP
ADP
Starch
ADP - Glu
G - 1 - P
G - 6 - P
F - 6 - P
Triose - P
Pi
CO 2
3 - PGA
ATP PPi
F - bis - P
Sucrose
UDP - Glu
G - 1 - P
G - 6 - P
F - 6 - P
Triose - P
Pi
Phloem Transport
C 3 Cycle
Pi
Pi
AGPase
CYTOSOL CHLOROPLAST
ADP ATP
F - bis - P
RuBP
ADP Starch
ADP - Glu
G - 1 - P
G - 6 - P
F - 6 - P
Triose - P
Pi
CO 2
3 - PGA
ATP PPi
F - bis - P
Sucrose
UDP - Glu
G - 1 - P
G - 6 - P
F - 6 - P
Triose - P
Pi
Phloem Transport
C 3 Cycle
Pi
Pi
AGPase

14
Figure 2
StarchSucrose
Phloem
CytoplasmAmyloplast
Sucrose
Glc Fruc
UDP-glc
Glc-6-P
ADP-glc
Glc-1-P
Glc-6-P
Glc-1-PFruc-6-P
12
48
57
6
9ATP
PPiATP
PPi
PPi
UTP
ATP
ADP
+ Pi
ATP
ADP
+ Pi
3
ADP-glc
Glycolysis
UDP
Glc
+
Fruc
4
10
StarchSucrose
Phloem
CytoplasmAmyloplast
Sucrose
Glc Fruc
UDP-glc
Glc-6-P
ADP-glc
Glc-1-P
Glc-6-P
Glc-1-PFruc-6-P
12
48
57
6
9ATP
PPiATP
PPi
PPi
UTP
ATP
ADP
+ Pi
ATP
ADP
+ Pi
3
ADP-glc
Glycolysis
UDP
Glc
+
Fruc
4
10
15
CHAPTER TWO
Genetic modification of leaf ADP-glucose pyrophosphorylase in Arabidopsis
for enhanced leaf starch turnover and plant productivity
Abstract
Increasing photosynthetic capacity in source leaves and enhancement of sink
strength in storage organs are major considerations for improvement of plant
productivity. Results from previous studies from the Edwards’ and Okita’s laboratories
showed a correlation between photosynthetic capacity, plant growth and leaf starch levels
in Arabidopsis mutants restricted in starch biosynthesis (Sun et al. 1999a, Sun et al.
2002). Leaf starch may act as a transient sink to accommodate excess photosynthate
and thereby diminish the potential reduction in photosynthetic capacity due to feedback
effects. In order to test this hypothesis, I analyzed transgenic Arabidopsis expressing an
up-regulated AGPase, a key enzyme in starch biosynthesis in source leaves, along with
wildtype and the parent TL46 starch-deficient mutant in terms of enzyme activity, leaf
starch metabolism and plant biomass.
Backcrossed (TL46-background) transgenic lines having up-regulated forms of
AGPase large subunit ApL1 genes successfully showed higher AGPase activity, greater
leaf starch turnover and increased biomass than wildtype and the parent TL46 mutant.
Among these transgenic lines, there were two leaf types with different chlorophyll levels
observed. To eliminate the potential effect of leaf phenotype, all transgenic lines were
crossed to wildtype. The experiments using wildtype-background up-regulated
transgenic Arabidopsis provides evidence that manipulation of starch biosynthesis via

16
expression of up-regulated AGPase enhances CO2 assimilation by increasing sink
capacity for starch biosynthesis in up-regulated transgenic lines. The combination of
increased photosynthetic capacity and transitory starch turnover contributed to increased
plant biomass. Thus, manipulation of AGPase activity has high potential for increasing
plant productivity.

17
Introduction
Efforts at increasing plant productivity and crop yields center on the manipulation
of source-sink relationships. Improvement of source-sink relationships is not a simple
process because it involves the interaction of multiple plant organs and tissues and
complicated metabolic pathways. Plant tissues can be briefly divided into two types;
source (e.g. photosynthetic tissues such as leaves and stems) and sink (e.g. developing
seeds and young leaves). Organs such as seeds are a storage sink which accumulates
long-term reserves for future carbon and energy resource. Leaves, which serving as a
source, are also a transient sink which store and utilize reserve compounds on a diurnal
basis. The balance of influx and efflux of carbon reserves in both source and sink
tissues is a key concept for improvement of plant productivity.
Plant leaves, especially mature green leaves, play an important role as a transient
sink. Transitory starch accumulates gradually after the light regime starts and maximum
starch level is attained at the end of day (Fondy and Geiger, 1982). It is totally
dependent on the capacity of photosynthesis in leaves and the conditions of the
surrounding environment such as temperature. In experimental model systems such as
spinach and Arabidopsis, most of the starch accumulated during the day is degraded
during the following night (Gerhardt et al. 1987, Lin et al. 1988, Zeeman et al. 1998).
Exported carbon assimilates from mature leaves are utilized for maintenance of plant
growth and development of young leaves and roots. Thus, plant leaves work not only as
a source tissue but also as a transient sink organ during the day.
Starch is a major carbohydrate reserve in both source and sink tissues in many
plants. It consists of two forms of polysaccharides. One is amylose which is mainly a
18
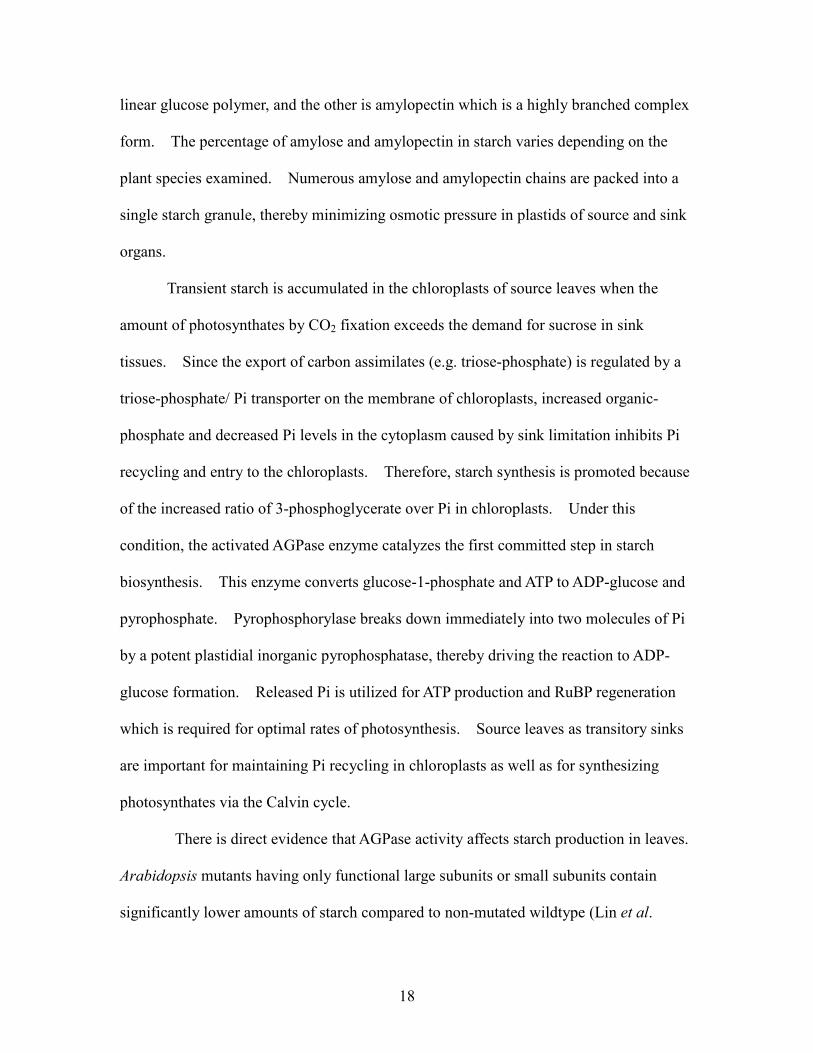
linear glucose polymer, and the other is amylopectin which is a highly branched complex
form. The percentage of amylose and amylopectin in starch varies depending on the
plant species examined. Numerous amylose and amylopectin chains are packed into a
single starch granule, thereby minimizing osmotic pressure in plastids of source and sink
organs.
Transient starch is accumulated in the chloroplasts of source leaves when the
amount of photosynthates by CO2 fixation exceeds the demand for sucrose in sink
tissues. Since the export of carbon assimilates (e.g. triose-phosphate) is regulated by a
triose-phosphate/ Pi transporter on the membrane of chloroplasts, increased organic-
phosphate and decreased Pi levels in the cytoplasm caused by sink limitation inhibits Pi
recycling and entry to the chloroplasts. Therefore, starch synthesis is promoted because
of the increased ratio of 3-phosphoglycerate over Pi in chloroplasts. Under this
condition, the activated AGPase enzyme catalyzes the first committed step in starch
biosynthesis. This enzyme converts glucose-1-phosphate and ATP to ADP-glucose and
pyrophosphate. Pyrophosphorylase breaks down immediately into two molecules of Pi
by a potent plastidial inorganic pyrophosphatase, thereby driving the reaction to ADP-
glucose formation. Released Pi is utilized for ATP production and RuBP regeneration
which is required for optimal rates of photosynthesis. Source leaves as transitory sinks
are important for maintaining Pi recycling in chloroplasts as well as for synthesizing
photosynthates via the Calvin cycle.
There is direct evidence that AGPase activity affects starch production in leaves.
Arabidopsis mutants having only functional large subunits or small subunits contain
significantly lower amounts of starch compared to non-mutated wildtype (Lin et al.
19
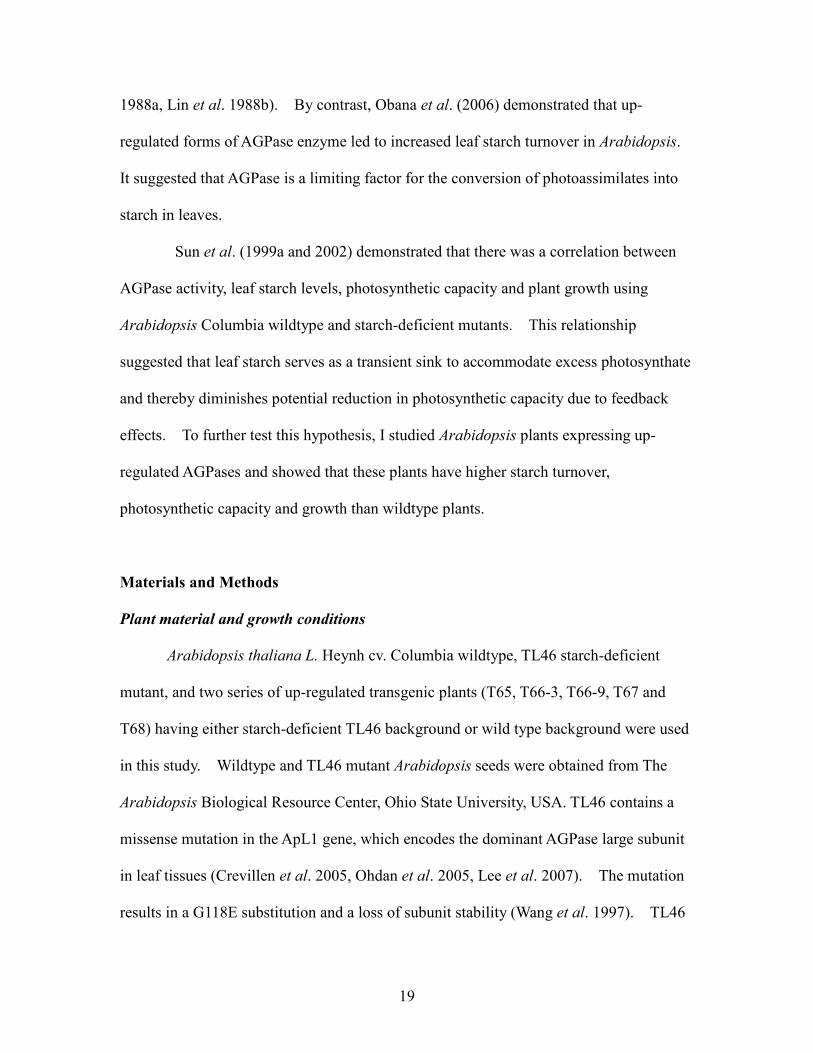
1988a, Lin et al. 1988b). By contrast, Obana et al. (2006) demonstrated that up-
regulated forms of AGPase enzyme led to increased leaf starch turnover in Arabidopsis.
It suggested that AGPase is a limiting factor for the conversion of photoassimilates into
starch in leaves.
Sun et al. (1999a and 2002) demonstrated that there was a correlation between
AGPase activity, leaf starch levels, photosynthetic capacity and plant growth using
Arabidopsis Columbia wildtype and starch-deficient mutants. This relationship
suggested that leaf starch serves as a transient sink to accommodate excess photosynthate
and thereby diminishes potential reduction in photosynthetic capacity due to feedback
effects. To further test this hypothesis, I studied Arabidopsis plants expressing up-
regulated AGPases and showed that these plants have higher starch turnover,
photosynthetic capacity and growth than wildtype plants.
Materials and Methods
Plant material and growth conditions
Arabidopsis thaliana L. Heynh cv. Columbia wildtype, TL46 starch-deficient
mutant, and two series of up-regulated transgenic plants (T65, T66-3, T66-9, T67 and
T68) having either starch-deficient TL46 background or wild type background were used
in this study. Wildtype and TL46 mutant Arabidopsis seeds were obtained from The
Arabidopsis Biological Resource Center, Ohio State University, USA. TL46 contains a
missense mutation in the ApL1 gene, which encodes the dominant AGPase large subunit
in leaf tissues (Crevillen et al. 2005, Ohdan et al. 2005, Lee et al. 2007). The mutation
results in a G118E substitution and a loss of subunit stability (Wang et al. 1997). TL46

20
has only about 5% of AGPase activity and accumulates 40% of starch levels compared to
wildtype (Lin et al. 1988b). Arabidopsis ApL1 versions of the potato large subunit
Upreg-1 (E38K) and Upreg-2 (G101N) genes (Greene et al. 1998) as well as a wildtype
gene were introduced into the starch-deficient TL46 mutant which contains a defective
large subunit gene (Gibson et al. 2003, Obana et al. 2006). Four up-regulated
transgenic Arabidopsis lines along with one T65 control line having an intact wildtype
AGPase were selected at the F3 generation for further analysis (Figure 3). These
backcrossed lines are called “TL46-background” transgenic plants. After crosses between
wildtype Columbia and all TL46-background lines, the generated Arabidopsis lines are
called “wildtype-background” transgenic lines. During the selection for homozygous
plants, F1 and F2 candidates were grown under Okita lab's growth cabinet or the semi-
controlled environmental greenhouse of the Institute of Biological Chemistry. The growth
conditions of the greenhouse were 16-h photoperiod with natural light and/or
supplemental high pressure sodium light, and 26/22oC day/night temperatures. Fertilizer
comprised of a solution containing Peter's 20-20-20, iron chelate, trace elements,
magnesium sulfate and micronutrients was applied three times per week.
Sterilized seeds of F3 plants were germinated on 1/2 Murashige-Skoog medium
(1/2 MS mineral salts, 3% (w/v) sucrose, 3 mg/L Thiamine Hydrochloride, 5 mg/L
Nicotinic acid, 0.5 mg/L Pyridoxine, 0.7% agarose, pH 5.8) for 7 days and then
transplanted to potting soil in one gallon pots (one plant per pot). These plants were
grown in controlled environmental growth chambers with a 12 h photoperiod and an
incident photosynthetic quantum flux density (PPFD) of 450 µmol m-2
s-1
. Day and
night temperatures were 23oC and 18
oC, respectively, with 70% humidity in the growth

21
chambers. Peter’s fertilizer 20-20-20 was applied to the plants twice a week.
Iodine staining for early selection
During the initial selection for up-regulated transgenic lines, all candidate
Arabidopsis were grown in the Okita lab’s growth cabinet at 100 PPFD with 18 h/6 h
photoperiod and 23oC/19
oC day/night temperatures. Rosette leaves at the same age
were harvested at the end of light regime. The leaf samples were treated with 99.5% of
ethanol for removal of carotenoids and chlorophylls, and then stained with iodine
solution (0.06% I2, 0.1% KI and 4 mM HCl).
AGPase enzyme assay
Leaf samples were collected at the end of the light period about 30-40 days after
germination and stored at -20oC freezer until used. The frozen tissues consisting of 0.35
cm2 leaf discs harvested from young leaves (about 5 cm in length) for TL46-background
and 0.1g leaf powders derived from whole plant leaves for wildtype-background lines,
were homogenized in the presence of liquid nitrogen. The powdered tissue was
incubated on ice for 30 min with extraction buffer (50 mM Hepes-NaOH pH 7.5, 5 mM
MgCl2, 5 mM DTT, 1 mM EDTA pH 8.0, 10% (v/v) Glycerol, 1 mM PMSF, 0.5 mM
Leupeptin, 0.5 mM Pepstatin and 0.5 mM Benzamidine). The homogenate was
centrifuged at 13,000 x g for 10 min at 4oC and the supernatant collected and examined
for enzyme activity. Protein concentrations were measured by a spectrophotometer at 595
nm using the Advanced Protein Assay reagent (5x concentrated, Cytoskelton Inc., USA).
AGPase activity was determined in the reverse (pyrophosphorylysis) direction in the
presence of 5 mM 3-PGA with/without 5 mM Pi using 32
PPi and ADP-glucose as

22
substrates as described previously (Hwang et al. 2007). One unit of activity is defined
as the amount of enzyme that produced 1µmol of [32
P]ATP per minute.
Chlorophyll content
0.35 cm2 frozen leaf discs collected from young leaves were harvested at the end
of the light regime from plants about 35-40 days old. The leaf tissue was homogenized
in 80% (v/v) acetone, centrifuged at 13,000 x g for 10 min at 4oC and the resulting
supernatant collected. After diluting with 80% (v/v) acetone, chlorophyll content was
assessed by measuring the absorbance at 646.8 nm and 663.2 nm (HP 8452A Diode Array
Spectrophotometer with HP 845x UV-visible system software, HP Chemstation or Smart
SpecTM Plus spectrophotometer, Bio-Rad) and then the amount calculated using the
equation described in Lichtenthaler and Wellburn (1983).
Starch determination
Whole plants were collected at the end of light and dark periods, respectively,
weighed and ground to a fine powder under liquid nitrogen. 0.1 g of leaf powder was
used for the measurement of leaf starch content. After removal of chlorophyll by
repeated extraction with 80% (v/v) acetone, the starch-containing pellets were then
washed with 50% (v/v) acetone, followed by dH2O. The pellets were dried under
vacuum. Dried pellets were boiled for 40 min at 90-95oC in 1 ml acetate buffer (0.1 M
sodium acetate and 0.1 N acetic acid). Starch was hydrolyzed and converted into glucose
by overnight incubation at 40oC using 3 units of α-amylase and 0.25 units of
amyloglucosidase suspended in 200 ul of the acetate buffer. The concentration of
glucose was determined with the Amplex-Red glucose assay kit (Molecular Probes,
catalogue No. A22189). For leaf starch measurements, 4 to 5 individual plants per line

23
were used. Starch turnover was calculated from the average of starch levels at the end
of the day and night periods.
Leaf gas exchange assay
Around 30-40 days after germination, the rate of CO2 assimilation was measured
with the FastEst gas system (Tartu, Estonia) using one of the youngest fully-expanded
leaves (around 5 cm) as described in detail in Laisk and Edwards (1997). The
measurement conditions of TL46- or wildtype-background Arabidopsis were slightly
different. The light density in the leaf sample cuvette was 1400 PPFD for lines studied in
the TL46-background Arabidopsis experiment, whereas it was 800 PPFD for lines
studied in the wildtype-background experiment. The temperature during the
measurements was 23-24oC and humidity was 25%. Measurements were made at two
levels of CO2 (380 ppm and 800 ppm) and at 2% and 21% O2 to investigate the effect of
varying the sink capacity for starch synthesis. The gas exchange measurements were
performed under steady-state conditions after illumination for 1 hour at maximum light
density. After leaf gas exchange analysis, the leaf area was measured with a leaf area
meter (Li-cor, LI-3000, Lambda Instrument. Corporation, USA). The percent
stimulation of CO2 assimilation by reduction from 21 to 2% O2 was calculated from the
rates of CO2 assimilation at 21% (AO21%) versus 2% O2 (AO2%) using the equation
[(AO2%/AO21%-1) x 100].
Biomass measurements
Total leaf area was measured using a leaf area meter for TL46-background
Arabidopsis lines or by imaging the leaves and then analyzing the image using image-J
software (NIH, USA) for wildtype-background lines. Leaf dry weights were obtained

24
after drying the plants at 60°C for two weeks.
Statistical analysis
Analysis of variance (ANOVA) was done with the MINITAB software (Minitab
Inc.). Tukey’s multiple comparison tests were used to compare values between
wildtype, TL46 mutant and up-regulated transgenic lines. All analyses were performed
at p≤ 0.05 significance level.
Results
TL46-Background Transgenic Lines
Greater starch pool in TL46-background transgenic lines than wildtype and the parent
TL46 mutant Under low light (100 PPFD) conditions, all TL46-background
transgenic leaves including T65 were darkly stained by iodine solution (Figure 4). By
contrast, wildtype and the parent TL46 mutant showed weaker staining and showed a
light-brownish to tan color.
Increased AGPase activity by introduction of up-regulated AGPase ApL1 genes in the
TL46 mutant In order to investigate changes due to introduction of the modified
AGPases, the enzyme activities of five TL46-background transgenic lines along with
wildtype and the parent TL46 mutant were determined using leaf samples collected at the
initial bolting stage of plant development. When assayed in the presence of 3-PGA, an
activator of AGPase, the enzyme activity in the transgenic lines was 1.8-3.5 fold higher
than wildtype and more than 100-fold higher than the parent TL46 mutant (Table 1).
Wildtype showed a significant reduction by Pi, an inhibitor of AGPase, (22% activity

25
remained), while transgenic lines had 28-43% remaining activity or 3-5 fold higher
activity than wildtype. Contrary to my expectations, the T65 line containing a wildtype
ApL1 gene showed similar stimulated enzyme activity by 3-PGA and high residual
activity in the presence of Pi similar to that seen in the up-regulated transgenic lines.
Similar CO2 assimilation rates in wildtype, TL46 mutant, and TL46-backgound
transgenic Arabidopsis CO2 fixation depends on the intercellular concentration of
CO2 and O2 around the Rubisco enzyme which catalyzes the first major step of the Calvin
cycle. The CO2 assimilation rates of wildtype, TL46 mutant and five TL46-background
transgenic lines were determined under two levels of CO2 (380 ppm and 800 ppm) and
O2 (2% and 21%) using 35-40 days old plants (Table 2). At ambient conditions (380
ppm CO2 and 21% O2), TL46 mutant showed a lower CO2 assimilation rate (A = 8.9)
than wildtype (A = 12.3). Despite the increased AGPase activity, CO2 assimilation rates
of up-regulated transgenic lines had a broad range between those of the parent TL46
mutant and wildtype (A = 8.9 to 12.3). Transgenic lines may be divided into two
groups. CO2 assimilation rates of T65, T66-9 and T68 lines were similar to that of
wildtype, while T66-3 and T67 lines were similar to the parent TL46 mutant. Such a
trend was also evident when CO2 assimilation rates were measured at 800 ppm CO2 and
2% O2 conditions. To assess the relationship between the extent of feedback limitation
on photosynthesis and the capacity for starch synthesis, the % stimulation of CO2
assimilation rate by reducing O2 levels from 21% to 2% between wildtype, TL46 mutant
and transgenic lines were compared (Table 3). The parent TL46 mutant and T65 control
had a slightly lesser enhancement compared to wildtype and up-regulated transgenic lines
at the low CO2 concentration. At the high CO2 concentration, there is a significant
26
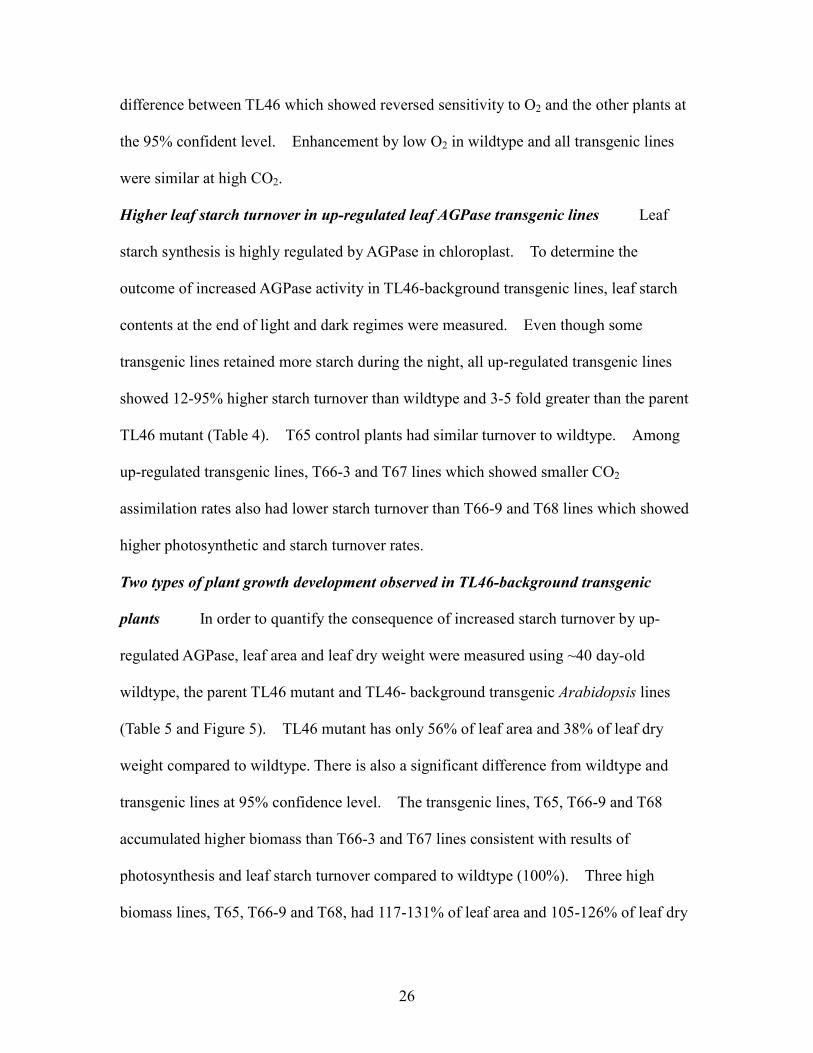
difference between TL46 which showed reversed sensitivity to O2 and the other plants at
the 95% confident level. Enhancement by low O2 in wildtype and all transgenic lines
were similar at high CO2.
Higher leaf starch turnover in up-regulated leaf AGPase transgenic lines Leaf
starch synthesis is highly regulated by AGPase in chloroplast. To determine the
outcome of increased AGPase activity in TL46-background transgenic lines, leaf starch
contents at the end of light and dark regimes were measured. Even though some
transgenic lines retained more starch during the night, all up-regulated transgenic lines
showed 12-95% higher starch turnover than wildtype and 3-5 fold greater than the parent
TL46 mutant (Table 4). T65 control plants had similar turnover to wildtype. Among
up-regulated transgenic lines, T66-3 and T67 lines which showed smaller CO2
assimilation rates also had lower starch turnover than T66-9 and T68 lines which showed
higher photosynthetic and starch turnover rates.
Two types of plant growth development observed in TL46-background transgenic
plants In order to quantify the consequence of increased starch turnover by up-
regulated AGPase, leaf area and leaf dry weight were measured using ~40 day-old
wildtype, the parent TL46 mutant and TL46- background transgenic Arabidopsis lines
(Table 5 and Figure 5). TL46 mutant has only 56% of leaf area and 38% of leaf dry
weight compared to wildtype. There is also a significant difference from wildtype and
transgenic lines at 95% confidence level. The transgenic lines, T65, T66-9 and T68
accumulated higher biomass than T66-3 and T67 lines consistent with results of
photosynthesis and leaf starch turnover compared to wildtype (100%). Three high
biomass lines, T65, T66-9 and T68, had 117-131% of leaf area and 105-126% of leaf dry

27
weight, while two low biomass strains, T66-3 and T67, were 87-100% and 82-90%,
respectively.
Leaf type differentiation of TL46-background transgenic Arabidopsis Two leaf
phenotypes were observed among TL46-background transgenic lines (Figure 6). T65,
T66-9 and T68 showed a wildtype leaf phenotype where the leaves were thick and dark-
green, whereas T66-3 and T67 had TL46 type leaves which were thinner and paler in
color. The latter was due to the lower amounts of chlorophyll which was about 80% of
wildtype (Table 6). Chlorophyll levels for T65, T66-9 and T68 were significantly
higher than T66-3 and T67 at 95% confident level. TL46 and two transgenic lines had
significantly less chlorophyll than wildtype.
Normalized data with chlorophyll content for TL46-background Arabidopsis
Results obtained using TL46-backgrond Arabidopsis might be affected by the difference
of chlorophyll levels. Therefore, I normalized the data of gas exchange, leaf starch
content, and biomass with the chlorophyll content. After normalization, all transgenic
lines except T66-3 showed 10-20% higher CO2 assimilation rate than wildtype, while the
parent TL46 mutant had 8% lower rate of photosynthesis compared to wildtype (Table 7).
With respect starch, the parent TL46 mutant has significantly less starch at both the end
of day and end of night resulting only about 70% of leaf starch turnover compared to
wildtype (Table 8). All up-regulated transgenic lines have 1.5-2.0 fold higher starch
turnover, whereas T65 control plants showed similar turnover to wildtype. In addition,
all transgenic lines including T65 had 17-58% greater leaf area and 10-43% higher leaf
dry weight than wildtype (Table 9). In both measures of biomass, T66-9 and T68 lines
were significantly greater than wildtype at 95% significant level. The parent TL46

28
mutant has only 72% of leaf area and 49% of leaf dry weight compared to wildtype.
Elimination of leaf type and chlorophyll differences In order to eliminate the
differences in leaf type morphology, I crossed all transgenic lines to wildtype plants and
selected homogeneous transgenic lines having the wildtype leaf type morphology.
Newly generated wildtype-background transgenic F3 lines had chlorophyll levels similar
to that of wildtype (Table 10). The TL46 mutant with 76% of wildtype chlorophyll was
significantly different compared to wildtype and transgenic lines at 95% confident level.
Wildtype-Background Transgenic Lines
Up-regulated AGPase activities in wildtype-background Arabidopsis AGPase
activities of wildtype-background transgenic lines (T65, T66-3, T66-9, T67 and T68)
along with wildtype and TL46 mutant, were determined using 30-35 day-old plants.
AGPase activity of transgenic lines in the presence of 5 mM 3-PGA showed about 1.9-
2.9 fold higher activities than that of wildtype (Table 11). TL46 has only 10% activity
of wildtype. In contrast, AGPase activity of transgenic lines in the presence of 5 mM 3-
PGA and 5 mM Pi showed a much higher activity (about 2.7-6.6 fold) than that of
wildtype and up to 110 fold higher than TL46 mutant. Although AGPase activity of the
T65 control lines was higher than wildtype and TL46 mutant under both effector
conditions, T65 had a similar reduction in activity by Pi. About 40% of the enzyme
activity was retained in the presence of Pi for enzyme both T65 and wildtype, while the
up-regulated transgenic lines, T66-3, T66-9, T67 and T68, showed similar levels of
activity in the presence or absence of Pi.

29
Increased AGPase activity leads to enhanced photosynthesis, leaf starch turnover and
biomass without interrupting chlorophyll discrimination Gas exchange, leaf starch
contents, leaf area and leaf dry weight of wildtype, TL46 mutant and wildtype-
background transgenic lines were assayed just at the beginning of the bolting stage (30-
35 days old). TL46 starch-deficient mutant had the lowest CO2 assimilation rate (84%,
Table 12), the lowest leaf starch turnover (72%, Table 13) and the smallest biomass (74%
in leaf area and 59% in leaf dry weight, Table 14 and Figure 7). There was significant
difference between TL46 mutant and other lines including wildtype in leaf starch and
plant biomass. By contrast, the up-regulated transgenic plants having higher AGPase
activities showed 5-11% enhanced CO2 fixation, 16-46% increased starch turnover and
29-61% greater biomass compared to wildtype. T66-9 plants in rate of CO2 fixation,
T67 and T68 lines in leaf area, and T68 plants in leaf dry weight were significantly
greater than wildtype and the TL46 mutant at 95% significant level, respectively. There
was no significant difference between wildtype and T65 control line in all the parameters
measured.
Discussion
The effects on enzyme activity, leaf starch metabolism, photosynthesis and
biomass by introduction of up-regulated AGPase were investigated in this study.
Transgenic plants expressing up-regulated large subunit ApL1 gene showed higher
AGPase activity compared to wildtype and TL46 mutant forms under 3-PGA activation
and/or Pi-inhibitory conditions. A positive control transgenic line expressing wildtype
ApL1 gene demonstrated similar inhibitor sensitivity to wildtype under Pi-inhibitory

30
conditions even if increased AGPase activity was observed as high as up-regulated
transgenic plants in the presence of 3-PGA.
The response of photosynthesis to introduction of up-regulated AGPase was a
relatively small effect compared to enzyme activity. CO2 fixation is tightly regulated by
multiple aspects including the levels of intercellular CO2 and O2, the activity of Rubisco
enzyme and the amount of reducing power (e. g. NADPH and ferredoxin) in the
chloroplast, and the capacity for synthesizing and utilizing sucrose. Almost all up-
regulated transgenic lines except for TL46-background T66-3 line revealed up to 120%
higher CO2 assimilation rate compared to wildtype.
At the same time, enhancement of leaf starch turnover was observed in all up-
regulated lines in both TL46- and wildtype-background Arabidopsis. Since AGPase is
known to catalyze the rate-limiting step of starch biosynthesis, the increase leaf starch
turnover among all up-regulated transgenic lines was expected.
During accumulation of transitory starch, pyrophosphate is generated from the
synthesis of ADP-glucose via AGPase. Thus, increased starch synthesis in the up-
regulated transgenic lines is expected to result in faster rate of pyrophosphate release
which is then broken down to generate two Pi in the chloroplast stroma. The released Pi
can then be utilized for photophosphorylation and RuBP formation. Triose-phosphate
utilization is necessary for continuous plastidial Pi recycling and function of the Calvin
cycle. In studies using the wildtype-background transgenic lines, high starch turnover
lines such as T66-9 had an increased rate of CO2 assimilation because of higher starch
synthesis and higher rate of Pi recycling. By contrast, TL46 mutant having restricted
AGPase activity and starch turnover have reduced capacity to utilize triose-phosphate,

31
lower rate of Pi recycling in the chloroplast stroma, lower rate of RuBP and ATP
synthesis and decreased rate of photosynthesis. The latter is documented by the
reversed sensitivity of photosynthesis of low O2, a property symptomatic of feedback
limitation (Sun et al. 1999b)(Table 3).
In addition to the regulation of photosynthesis, transitory starch plays an
important role for plant development. Most of the leaf starch accumulated during the
day is degraded the following night and utilized for maintenance of plant growth during
the night. Thus, transgenic lines with up-regulated AGPase having higher leaf starch
turnover exhibited greater leaf biomass than wildtype, TL46 mutant and T65 positive
control Arabidopsis.
Unexpectedly, the TL46-background transgenic plants showed two leaf types,
wildtype- versus TL46-leaf types. This difference was difficult to detect during the
early selection under low light conditions, however it was very obvious when plants were
grown under high light conditions. Photosynthesis, leaf starch turnover and biomass of
TL46-background T66-3 and T67 lines seem to be substantially influenced by having a
low chlorophyll level with TL46-leaf type.
The next possible limiting factor in TL46-leaf type plants is Rubisco in Calvin
cycle which is the enzyme responsible for CO2 fixation. Under hydroponic conditions
with 300 PPFD, TL46 mutant has slightly less Rubisco activity and less protein than
wildtype with ambient CO2 and high nitrogen fertilizer treatment (Sun et al. 2002).
Since the difference of leaf thickness were observed between wildtype and TL46 leaves
in this experiment, smaller total leaf mass of TL46 mutant would also affect the contents
of Rubisco and chlorophyll. Sun et al. (2002) and Obana et al. (2006) did not report on

32
different leaf types, so this phenotype difference may be induced by high light, greater
than 450 PPFD. Initial studies with the two leaf types showed all up-regulated
transgenic plants but T66-3 had higher CO2 assimilation rates than wildtype and TL46
mutant when normalized on a chlorophyll basis (Table 7). However, the results showed
it is important to work with the same leaf type in order to study the consequence of
increasing capacity for AGPase and starch biosynthesis on photosynthesis and growth.
The results of this experiment support to the hypothesis that increased synthesis
and turnover of starch by introduction of up-regulated AGPase enzyme contributed to
enhance photosynthesis and increase plant biomass. This research assessed only the
effect on vegetative tissue. As the next assignment, the influence on reproductive
organs such as seeds should be analyzed in order to obtain more depth-insight in the role
of transitory starch on plant growth and reproductive development.

33
References
Crevillén, P., M. A. Ballicora, et al. (2003). “The different large subunit isoforms of
Arabidopsis thaliana ADP-glucose pyrophosphorylase confer distinct kinetic and
regulatory properties to the heterotetrameric enzyme.” J Biol Chem 278(31):
28508-15.
Crevillén, P., T. Ventriglia et al. (2005). “Differential pattern of expression and sugar
regulation of Arabidopsis thaliana ADP-glucose pyrophosphorylase-encoding
genes.” J Biol Chem 280(9): 8143-9.
Fondy, B. R., and D. R. Geiger (1982) “Diurnal pattern of translocation and carbohydrate
metabolism in source leaves of Beta vulgaris L.” Plant Physiol 70:671-676
Gerhardt, R., M. Stitt, et al. (1987). “Subcellular metabolite levels in spinach leaves. ”
Plant Physiol. 83: 399-407.
Gibson, K. M., S. K. Hwang, et al. (2003). "Metabolic engineering of starch for enhanced
plant productivity and yields." J Applied Glycoscience 50: 201-206.
Greene, T. W., I. H. Kavakli, et al. (1998). "Generation of up-regulated allosteric variants
of potato ADP-glucose pyrophosphorylase by reversion genetics." Proc Natl Acad
Sci U S A 95(17): 10322-7.
Hwang, S. K., S. Hamada, et al. (2007) “Catalytic implications of the higher plant ADP-
glucose pyrophosphorylase large subunit.” Hytochemistry 68(4):464-77
Laisk, A. and G. E. Edwards (1997). "CO2 and temperature-dependent induction in C4
photosynthesis: An approach to the hierarchy of rate-limiting processes." Aust J
Plant Physiol 24: 505-516.
Lee, S. K., S. K. Hwang, et al. (2007). “Identification of the ADP-glucose

34
pyrophosphorylase isoforms essential for starch synthesis in the leaf and seed
endosperm of rice (Oryza sativa L.).” Plant Mol Biol. 65(4): 531-46.
Lichtenthaler, H. K. and A. R. Wellburn (1983). "Determination of total carotenoids and
chlorophylls a and b of leaf extracts in different solvents." Biochem Soc Trans 11:
591–592.
Lin, T. P., T. Caspar, et al. (1988a). "Isolation and characterization of a starchless mutant
of Arabidopsis thaliana (L.) Heynh lacking ADP-glucose pyrophosphorylase
activity." Plant Physiol 86: 1131-1135.
Lin, T. P., T. Caspar, et al. (1988b). "A starch deficient mutant of Arabidopsis thaliana
with low ADP-glucose pyrophosphorylase activity lacks one of the two subunits
of the enzyme." Plant Physiol 88: 1175-1181.
Obana, Y., D. Omoto, et al. (2006). "Enhanced turnover of transitory starch by expression
of up-regulated ADP-glucose pyrophosphorylases in Arabidopsis thaliana." Plant
Science 170: 1-11.
Ohdan, T., P. B. Jr Francisco, et al. (2005). “Expression profiling of genes involved in
starch synthesis in sink and source organs of rice.” J Exp Bot 56(422): 3229-44.
Sun, J., K. M. Gibson, et al. (2002). "Interactions of nitrate and CO2 enrichment on
growth, carbohydrates, and rubisco in Arabidopsis starch mutants. Significance of
starch and hexose." Plant Physiol 130(3): 1573-83.
Sun, J., T. W. Okita, et al. (1999a). "Modification of carbon partitioning, photosynthetic
capacity, and O2 sensitivity in Arabidopsis plants with low ADP-glucose
pyrophosphorylase activity." Plant Physiol 119(1): 267-76.

35
Sun, J., G. E. Edwards, et al. (1999b). “Feedback inhibition of photosynthesis in rice
measured by O2 dependent transients”. Photosynthesis Res 59(2-3): 187-200.
Wang, S. M., B. Chu, et al. (1997). "adg2-1 represents a missense mutation in the ADPG
pyrophosphorylase large subunit gene of Arabidopsis thaliana." Plant J 11(5):
1121-6.
Zeeman, S. C., F. Northrop, et al. (1998) “A starch-accumulating mutant of Arabidopsis
thaliana deficient in a chloroplastic starch-hydrolysing enzyme.” Plant J. 15(3):
357-65.

36
Figure Legends
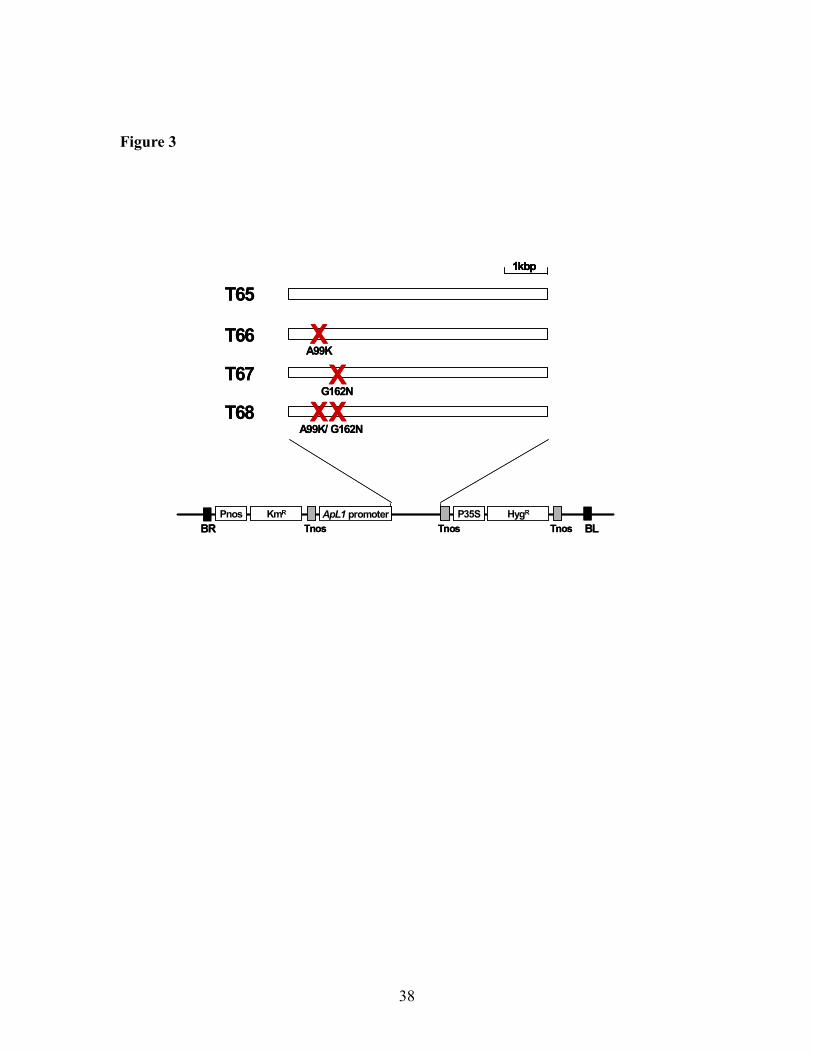
Figure 3. Structure of the ApL1 gene, which encodes the large subunit of
AGPase, in the Arabidopsis transgenic lines. The ApL1 gene was engineered by site-
directed mutagenesis and transformed into the Arabidopsis starch-deficient TL46 mutant.
T65 line was TL46 transformed with wildtype ApL1 gene. T66 and T67 lines had single
mutations replacing Ala99 with Lys, and Gly162 with Asn, respectively, in ApL1. T68
expresses an ApL1 gene containing a double mutation A99K and G162N. Pnos:
promoter of nopaline synthase gene, KmR: kanamycin resistance gene, Tnos: terminator
of nopaline synthase gene, P35S: 35S mRNA promoter of cauliflower mosaic virus,
HygR: hygromycin resistance gene, BR and BL: right and left border, respectively.
Figure 4. Iodine staining of wildtype, TL46 mutant and backcrossed transgenic
lines. Rosetta leaves of wildtype, TL46 mutant and up-regulated leaf AGPase (TL46-
background) transgenic lines grown under low light conditions were stained by iodine
solution after removal of color pigments. All transgenic lines showed darker iodine
staining compared to wildtype and TL46.
Figure 5. Images of wildtype, TL46 mutant and backcrossed transgenic lines.
Images of about 35 day-old plants were taken for wildtype, TL46 mutant and up-
regulated leaf AGPase (TL46-background) transgenic lines.

37
Figure 6. Leaf morphology of wildtype and TL46 mutant Arabidopsis. Images
of fully expanded mature leaves were taken for wildtype and TL46 mutant.
Figure 7. Images of wildtype, TL46 mutant and wildtype-background
transgenic lines. Images of about 30 day-old plants were taken for wildtype, TL46
mutant and up-regulated leaf AGPase transgenic lines.
38
Figure 3
Pnos KmR P35S HygR
Tnos Tnos Tnos BLBR
ApL1 promoter
T65
T66
T67
T68
A99K
G162N
1kbp
X
X
XXA99K/ G162N
Pnos KmR P35S HygR
Tnos Tnos Tnos BLBR
ApL1 promoter
T65
T66
T67
T68
A99K
G162N
1kbp1kbp
X
X
XXA99K/ G162N

39
Figure 4
WT TL46 T65 T66-3 T66-9 T67 T68

40
Table 1. AGPase activity of wildtype, TL46 mutant and backcrossed transgenic
lines. AGPase activity under 3-PGA activation and Pi-inhibitory conditions was
determined using leaf crude extracts prepared from about 40 day-old wildtype, TL46
mutant and up-regulated leaf AGPase (TL46-background) transgenic lines. Mean
values ±SE were calculated from five plants per lines. * and ** denote a significant
statistical difference at the 95% confidence level compared to wildtype.
% %
WT 0.035 ± 0.009 100 0.008 ± 0.001 100
TL46 0.001 ± 0 ** 2 0.001 ± 0.001 14
T65 0.080 ± 0.005 * 227 0.028 ± 0.003 * 354
T66-3 0.064 ± 0.006 183 0.025 ± 0.003 * 316
T66-9 0.090 ± 0.009 * 257 0.039 ± 0.004 * 495
T67 0.124 ± 0.003 * 354 0.035 ± 0.002 * 449
T68 0.107 ± 0.012 * 306 0.037 ± 0.005 * 468
Lines3-PGA 3-PGA, Pi
µmol min-1 mg
-1µmol min
-1 mg
-1

41
%%
%%
WT
12.3
± 0.6
100
15.0
± 0.8
100
18.4
± 0.8
100
20.2
± 0.5
100
TL46
8.9
± 0.5 **
72
10.1
± 0.6 **
67
12.3
± 0.6 **
67
10.6
± 0.1 **
53
T65
12.5
± 0.5
101
14.5
± 0.7
97
18.0
± 0.5
98
19.8
± 0.6
98
T66-3
8.9
± 0.4 **
72
11.1
± 0.6 **
74
14.5
± 0.5 **
79
15.6
± 0.7 **
77
T66-9
12.3
± 0.2
100
15.4
± 0.5
103
19.8
± 0.3
107
21.3
± 0.5
105
T67
10.0
± 0.7
81
12.8
± 0.6
85
15.7
± 0.4 **
85
17.3
± 0.5
85
T68
11.4
± 0.6
92
13.7
± 0.7
91
17.5
± 0.6
95
19.1
± 0.5
95
µmol m
-2 s
-1µmol m
-2 s
-1µmol m
-2 s
-1µmol m
-2 s
-1
21% O
22% O
221% O
22% O
2
380 ppm CO
2800 ppm CO
2
Lines
Tab
le 2
. P
hoto
syn
thes
is o
f w
ild
typ
e, T
L46 m
uta
nt
an
d b
ack
cross
ed t
ran
sgen
ic lin
es.
C
O2 a
ssim
ilat
ion r
ate
was
mea
sure
d i
n 3
5 t
o 4
0 d
ay-o
ld w
ild
typ
e, T
L4
6 m
uta
nt
and
up
-reg
ula
ted
lea
f A
GP
ase
(TL
46
-bac
kg
rou
nd
) tr
ansg
enic
lin
es.
Mea
sure
men
t w
as p
erfo
rmed
un
der
tw
o l
evel
s o
f C
O2 (
38
0p
pm
an
d 8
00
pp
m)
and
O2 (
2%
an
d 2
1%
) at
23
-24
oC
wit
h 1
40
0
PP
FD
sat
ura
tin
g l
igh
t co
nd
itio
ns.
Mea
n v
alu
es ±
SE
wer
e ca
lcu
late
d f
rom
th
ree
to s
ix p
lan
ts p
er l
ines
.
**
den
ote
s a
sig
nif
ican
t st
atis
tica
l d
iffe
ren
ce a
t th
e 9
5%
co
nfi
den
ce l
evel
co
mp
ared
to
wil
dty
pe.

42
Table 3. Stimulation of CO2 assimilation by 2% O2 in wildtype, TL46 mutant
and backcrossed transgenic lines. The sensitivity of photosynthesis when O2 was
reduced from 21% to 2% was calculated from CO2 assimilation rates of wildtype, TL46
mutant and up-regulated leaf AGPase (TL46-background) transgenic lines. The percent
stimulation was calculated from the rates of CO2 assimilation at 21% (AO21%) versus 2%
O2 (AO2%) using the equation [(AO2%/AO21%-1) x 100]. Mean values ±SE were
calculated from three to six plants per lines. ** denotes a significant statistical
difference at the 95% confidence level compared to wildtype.
Lines
WT 22.0 ± 5.5 9.9 ± 2
TL46 13.9 ± 2.7 -13.3 ± 2.7 **
T65 16.7 ± 2.6 9.7 ± 2
T66-3 25.6 ± 4.3 7.8 ± 2.5
T66-9 25.7 ± 3 7.5 ± 2.9
T67 28.4 ± 3.5 10.0 ± 1.9
T68 20.5 ± 2.3 9.3 ± 1.7
800 ppm CO2380 ppm CO2

43
Table 4. Leaf starch content of wildtype, TL46 mutant and backcrossed
transgenic lines. The amount of leaf starch at end of day/night was measured in 30
day-old wildtype, TL46 mutant and up-regulated leaf AGPase (TL46-background)
transgenic lines. Mean values ±SE were calculated from four to five plants per lines.
* and ** denote a significant statistical difference at the 95% confidence level compared
to wildtype.
%
WT 17 ± 3 103 ± 13 86 100
TL46 5 ± 1 ** 40 ± 3 ** 35 41
T65 13 ± 1 94 ± 9 81 94
T66-3 25 ± 4 121 ± 11 96 112
T66-9 22 ± 2 163 ± 9 * 141 164
T67 13 ± 2 117 ± 4 104 121
T68 42 ± 4 * 210 ± 14 * 168 195
End of day Turnover
µmol glc. plant-1Lines
End of night

44
Table 5. Biomass measurements of wildtype, TL46 mutant and backcrossed
transgenic lines. Leaf area and leaf dry weight were determined from about 40 day-old
wildtype, TL46 mutant and up-regulated leaf AGPase (TL46-background) transgenic
lines. Mean values ±SE were calculated from four to five plants per lines. ** denotes
a significant statistical difference at the 95% confidence level compared to wildtype.
% %
WT 124 ± 8 100 373 ± 19 100
TL46 70 ± 7 ** 56 143 ± 14 ** 38
T65 145 ± 12 117 391 ± 38 105
T66-3 124 ± 9 100 336 ± 19 90
T66-9 157 ± 14 127 470 ± 42 126
T67 108 ± 8 87 305 ± 23 82
T68 162 ± 9 131 440 ± 17 118
LinesLeaf area Leaf dry weight
cm2 plant-1 mg plant-1

45
Fig
ure
5
WT TL46 T65 T66-3 T66-9 T67 T68

46
Figure 6
WT TL46

47
Table 6. Chlorophyll content of wildtype, TL46 mutant and backcrossed
transgenic lines. The amount of chlorophyll in leaves was measured from about 40
day-old wildtype, TL46 mutant and up-regulated leaf AGPase (TL46-background)
transgenic lines. Mean values ±SE were calculated from three to four plants per lines.
** denotes a significant statistical difference at the 95% confidence level compared to
wildtype.
Lines %
WT 763 ± 32 100
TL46 597 ± 37 ** 78
T65 651 ± 20 85
T66-3 564 ± 28 ** 74
T66-9 635 ± 42 83
T67 565 ± 45 ** 74
T68 631 ± 4 83
mg Chl m-2

48
Table 7. Normalized CO2 assimilation rate of wildtype, TL46 mutant and
backcrossed transgenic lines.
%
WT 16.2 ± 0.8 100
TL46 14.9 ± 0.8 92
T65 19.1 ± 0.8 118
T66-3 15.7 ± 0.8 97
T66-9 19.3 ± 0.3 120
T67 17.8 ± 1.2 110
T68 18.0 ± 0.9 111
Lines21% O2, 380 ppm CO2
µmol s-1 g-1 Chl

49
Table 8. Normalized leaf starch content of wildtype, TL46 mutant and
backcrossed transgenic lines. The statistical analysis was performed using the values
of end of night/day. * and ** denote a significant statistical difference at the 95%
confidence level compared to wildtype. Turnover of the leaf starch was subtracted from
the average value of day to that of night.
%
WT 3.5 ± 0.4 22.2 ± 0.9 18.7 100
TL46 1.3 ± 0.2 ** 13.5 ± 0.7 ** 12.3 66
T65 2.6 ± 0.1 22.2 ± 1.4 19.6 105
T66-3 5.6 ± 0.6 * 38.1 ± 1.0 * 32.5 173
T66-9 5.1 ± 0.3 * 34.6 ± 1.5 * 29.5 158
T67 3.3 ± 0.2 31.8 ± 1.2 * 28.5 152
T68 7.4 ± 0.3 * 44.7 ± 2.5 * 37.3 199
Linesmmol glc. g
-1 Chl
TurnoverEnd of dayEnd of night
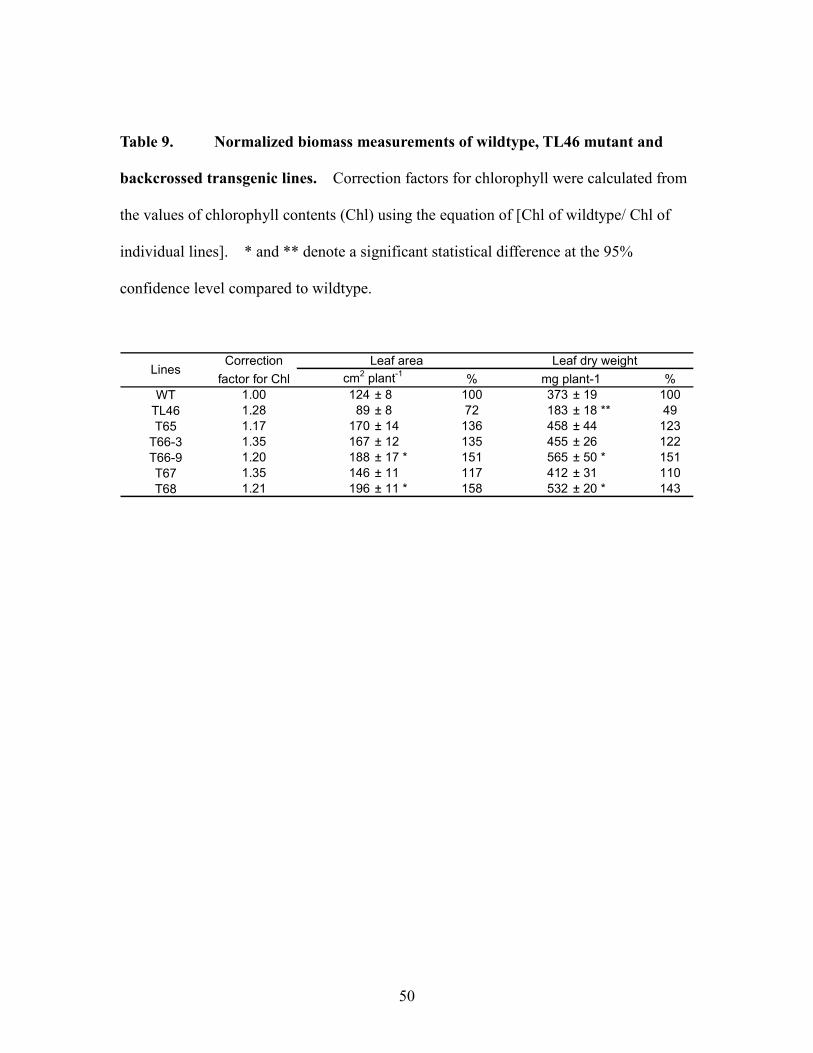
50
Table 9. Normalized biomass measurements of wildtype, TL46 mutant and
backcrossed transgenic lines. Correction factors for chlorophyll were calculated from
the values of chlorophyll contents (Chl) using the equation of [Chl of wildtype/ Chl of
individual lines]. * and ** denote a significant statistical difference at the 95%
confidence level compared to wildtype.
Correction
factor for Chl % %
WT 1.00 124 ± 8 100 373 ± 19 100
TL46 1.28 89 ± 8 72 183 ± 18 ** 49
T65 1.17 170 ± 14 136 458 ± 44 123
T66-3 1.35 167 ± 12 135 455 ± 26 122
T66-9 1.20 188 ± 17 * 151 565 ± 50 * 151
T67 1.35 146 ± 11 117 412 ± 31 110
T68 1.21 196 ± 11 * 158 532 ± 20 * 143
LinesLeaf area Leaf dry weight
cm2 plant
-1mg plant-1

51
Table 10. Chlorophyll content of wildtype, TL46 mutant and wildtype-
background transgenic lines. The amount of chlorophyll in leaves was measured from
about 35 day-old wildtype, TL46 mutant and up-regulated leaf AGPase transgenic lines.
Mean values ±SE were calculated from three to five plants per lines. ** shows that
there is a significant statistical difference at the 95% confidence level compared to
wildtype.
Lines %
WT 812 ± 44 100
TL46 619 ± 11 ** 76
T65 787 ± 25 97
T66-3 790 ± 44 97
T66-9 817 ± 27 101
T67 764 ± 59 94
T68 829 ± 57 102
mg Chl m-2

52
Table 11. AGPase activity of wildtype, TL46 mutant and wildtype-background
transgenic lines. AGPase activity under 3-PGA activation and Pi-inhibitory conditions
was determined using leaf crude extracts prepared from about 30 day-old wildtype, TL46
mutant and up-regulated leaf AGPase transgenic lines. Mean values ±SE were
calculated from five plants per lines. * and ** denote a significant statistical difference
at the 95% confidence level compared to wildtype.
% %
WT 0.055 ± 0.004 100 0.023 ± 0.003 100
TL46 0.005 ± 0.005 ** 10 0.001 ± 0 6
T65 0.159 ± 0.012 * 291 0.062 ± 0.017 268
T66-3 0.128 ± 0.003 * 234 0.120 ± 0.018 * 517
T66-9 0.131 ± 0.006 * 240 0.136 ± 0.004 * 587
T67 0.104 ± 0.013 * 190 0.102 ± 0.012 * 441
T68 0.123 ± 0.013 * 223 0.154 ± 0.016 * 661
µmol min-1 mg-1 µmol min-1 mg-1Lines
3-PGA 3-PGA, Pi

53
%%
%%
WT
9.9
± 0.3
100
14.0
± 0.2
100
17.5
± 0.3
100
19.0
± 0.6
100
TL46
8.3
± 0.5
84
9.9
± 0.6 **
71
10.9
± 0.7 **
62
9.4
± 0.8 **
49
T65
10.3
± 0.5
104
13.0
± 0.6
93
16.2
± 0.7
93
18.3
± 1.1
96
T66-3
11.0
± 0.2
111
14.1
± 0.4
101
16.9
± 0.5
97
18.3
± 0.3
96
T66-9
11.9
± 0.4 *
120
15.3
± 0.6
109
18.1
± 0.8
103
19.4
± 0.8
102
T67
10.4
± 0.2
105
13.8
± 0.3
99
16.7
± 0.3
95
19.0
± 0.5
100
T68
10.5
± 0.5
106
13.8
± 0.5
99
16.5
± 0.8
94
17.9
± 0.8
94
µmol m
-2 s
-1
Lines
380 ppm CO
2800 ppm CO
2
21% O
22% O
221% O
22% O
2
µmol m
-2 s
-1µmol m
-2 s
-1µmol m
-2 s
-1
Tab
le 1
2.
Ph
oto
syn
thes
is o
f w
ild
typ
e, T
L46 m
uta
nt
an
d w
ild
typ
e-b
ack
gro
un
d t
ran
sgen
ic lin
es.
C
O2 a
ssim
ilat
ion
rate
was
mea
sure
d i
n 3
0 t
o 3
5 d
ay-o
ld w
ild
typ
e, T
L46
mu
tan
t an
d u
p-r
egu
late
d l
eaf
AG
Pas
e tr
ansg
enic
lin
es.
Mea
sure
men
ts w
ere
per
form
ed u
nd
er t
wo
lev
els
of
CO
2 (
38
0p
pm
an
d 8
00
pp
m)
and
O2 (
2%
an
d 2
1%
) at
23
-24
oC
wit
h 8
00
PP
FD
sat
ura
tin
g l
igh
t co
nd
itio
ns.
Mea
n v
alu
es ±
SE
wer
e ca
lcu
late
d f
rom
sev
en p
lan
ts p
er l
ines
. *
* d
eno
tes
a si
gn
ific
ant
stat
isti
cal
dif
fere
nce
at
the
95
% c
on
fid
ence
lev
el c
om
par
ed t
o w
ild
typ
e.
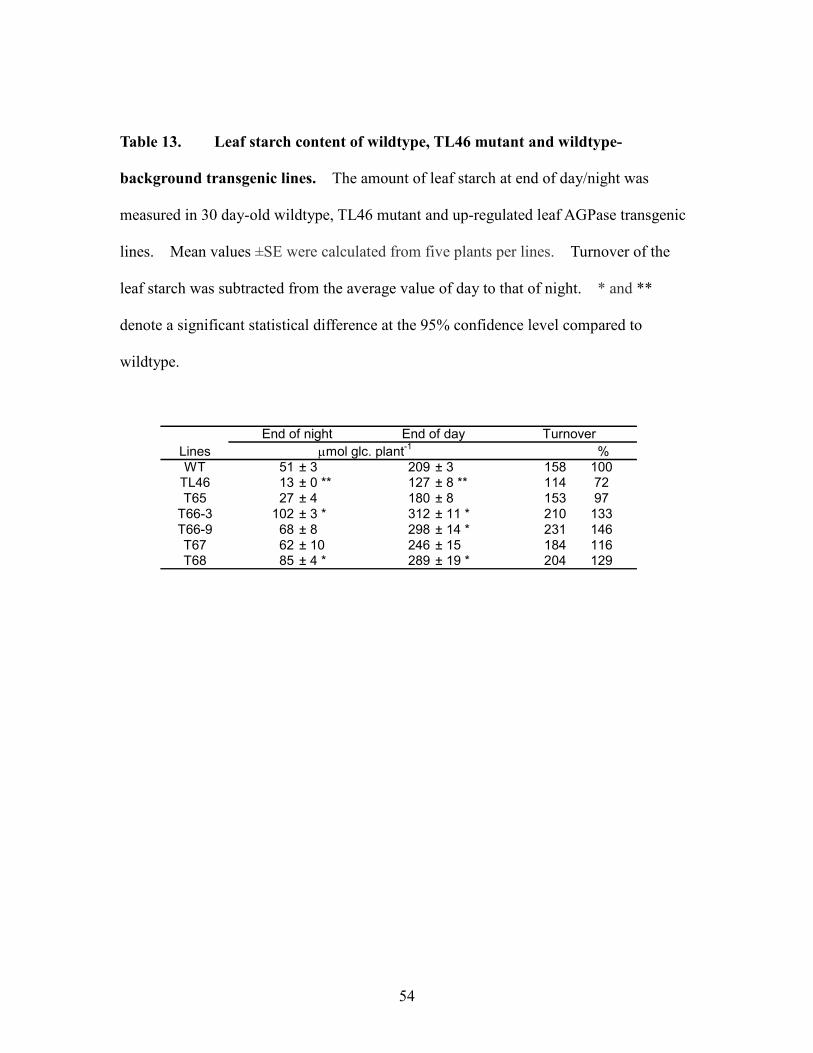
54
Table 13. Leaf starch content of wildtype, TL46 mutant and wildtype-
background transgenic lines. The amount of leaf starch at end of day/night was
measured in 30 day-old wildtype, TL46 mutant and up-regulated leaf AGPase transgenic
lines. Mean values ±SE were calculated from five plants per lines. Turnover of the
leaf starch was subtracted from the average value of day to that of night. * and **
denote a significant statistical difference at the 95% confidence level compared to
wildtype.
%
WT 51 ± 3 209 ± 3 158 100TL46 13 ± 0 ** 127 ± 8 ** 114 72
T65 27 ± 4 180 ± 8 153 97
T66-3 102 ± 3 * 312 ± 11 * 210 133
T66-9 68 ± 8 298 ± 14 * 231 146
T67 62 ± 10 246 ± 15 184 116T68 85 ± 4 * 289 ± 19 * 204 129
Lines
End of night End of day Turnover
µmol glc. plant-1

55
Table 14. Biomass measurements of wildtype, TL46 mutant and wildtype-
background transgenic lines. Leaf area and leaf dry weight were determined from
about 35 day-old wildtype, TL46 mutant and up-regulated leaf AGPase transgenic lines.
Mean values ±SE were calculated from three to five plants per lines. * and ** denote a
significant statistical difference at the 95% confidence level compared to wildtype.
% %
WT 160 ± 8 100 360 ± 21 100
TL46 90 ± 4 ** 57 164 ± 12 ** 46
T65 148 ± 11 93 328 ± 35 91
T66-3 204 ± 16 128 454 ± 41 126
T66-9 223 ± 18 140 495 ± 49 138
T67 242 ± 14 * 151 498 ± 26 138
T68 258 ± 12 * 162 545 ± 27 * 151
cm2 plant-1Leaf dry weight
mg plant-1Lines
Leaf area

56
Fig
ure
7
WT TL46 T65 T66-3 T66-9 T67 T68

57
CHAPTER THREE
Control of starch synthesis in cereals: metabolite analysis of transgenic rice expressing
up-regulated cytoplasmic ADP-glucose pyrophosphorylase in developing seeds
Abstract
We have previously demonstrated that expression of a cytoplasmic-localized (but
not a plastid-localized) ADP-glucose pyrophosphorylase (AGPase) mutant gene from
Escherichia coli in rice endosperm resulted in enhanced starch synthesis and, in turn,
higher seed weights (Sakulsingharoj et al. 2004). In this study, the levels of the major
primary carbon metabolites were assessed for wildtype and four transgenic CS 8 rice
lines expressing 3- to 6-fold higher AGPase activity when measured under inorganic
phosphate (Pi)-inhibitory conditions. As seen earlier for mature seeds, developing seeds
from the various CS 8 lines showed a 7 to 24% increase in grain weight compared to
wildtype control. Consistent with the increase in AGPase activity, all four transgenic
CS 8 lines showed elevated levels of ADP-glucose although the extent of increases in this
metabolite were much higher than the extent of increases in starch as measured by seed
weight. Surprisingly, the levels of several other key intermediates were significantly
altered. Glucose 1-phosphate, a substrate of the AGPase reaction, as well as UDP-
glucose and glucose 6-phosphate were also elevated in the transgenic lines, and analysis
of metabolite ratios indicated reactions were near equilibrium. Moreover, glucose and
fructose levels were also elevated in three transgenic lines that showed the largest
differences in metabolites and seed weight over wildtype suggesting the induction of
invertase. Overall, the results indicate that the AGPase catalyzed reaction is no longer

58
limiting in the transgenic lines, and constraints on carbon flux into starch are downstream
of ADP-glucose formation, resulting in an elevation of precursors upstream of ADP-
glucose formation.

59
Introduction
Global improvement of plant productivity and crop yield is a high priority to meet
the challenge of feeding the world’s growing population which is expected to reach 8
billion by the year 2020 (Choi et al. 1998). Crop yield is dependent on many factors
including environmental conditions, nutritional inputs, and the genetic potential for plant
growth and development. The latter is controlled by source-sink relationships where
sugars and amino acids generated by the photochemical and dark reactions of
photosynthesis and nitrogen metabolism in source leaves are transported and assimilated
by heterotrophic sink organs (Edwards et al. 2000, Okita et al. 2001, Tegeder and Weber
2006). During the vegetative stage, most of the photoassimilates (e.g. sucrose and
amino acids) are utilized for plant growth and development. However, during the
reproductive stage, plants convert the bulk of the photosynthate into storage reserves as
proteins, carbohydrates and lipids. Therefore, the capacity for synthesis of starch,
proteins, and lipids in seeds of staple economic crops, like rice, maize and wheat, is an
important consideration for enhancing yield.
In cereals, the principal storage reserve is starch which constitutes ~78% of the dry
weight of the grain (Singh and Juliano 1977). One key regulatory step that controls the
flux of carbon into starch is catalyzed by ADP-glucose pyrophosphorylase (Hannah 1997,
Preiss et al. 1991, Sakulsingharoj et al. 2004, Slattery et al. 2000, Smith et al. 1997). In
photosynthetic tissues, the catalytic activity of this enzyme is controlled by its allosteric
regulatory responses to the activator 3-PGA and inhibitor Pi. Several of the AGPase
isoforms are also finely regulated by redox control where the catalytic activity of the
oxidized form is suppressed compared to the reduced form of the enzyme at low 3-PGA

60
levels (Tiessen et al. 2002). In most tissues where starch is synthesized, AGPase is
localized in the chloroplast or amyloplast, the site of starch synthesis and accumulation.
The exception is in starch synthesis in amyloplasts of the cereal endosperm where two
forms of the enzyme are present: a major cytoplasmic form and a minor plastidal form
(Denyer et al. 1996, Sikka et al. 2001, Thorbjornsen et al. 1996).
In previous studies from our laboratories, we introduced the E. coli glgC triple
mutant (glgC-TM) gene into rice and targeted expression to either the cytoplasm or
amyloplasts of developing endosperm (Sakulsingharoj et al. 2004). This mutant
AGPase contains three amino acid replacements, R67K, P295D, and G366D which
renders the enzyme essentially independent of allosteric regulation, i.e. does not require
any activators for catalytic activity and is insensitive to the inhibitor Pi (Preiss et al.
1994). When assessed under Pi-inhibitory conditions to suppress the activity of the
endogenous AGPase catalytic activity, the transgenic plants showed up to 13-fold higher
AGPase activity. However, only transgenic plants expressing the glgC-TM in the
cytoplasm (CS 8 lines) and not the amyloplast had a higher rate of conversion of sucrose
into starch, and bore seeds having up to 11% increase grain weight compared to the
wildtype control (Sakulsingharoj et al. 2004). These results demonstrate that the
AGPase reaction is one of the limiting factors of starch biosynthesis and that the carbon
flux into starch can be enhanced by increasing the net catalytic activity of this enzyme.
Moreover, the results also supported the view that the major pathway leading to ADP-
glucose synthesis and, in turn, starch biosynthesis, is cytoplasmic.
Results from CO2 enrichment experiments suggested that ADP-glucose formation
in the CS 8 transgenic rice plants was no longer a limitation in starch synthesis and that

61
one or more other steps was limiting (Sakulsingharoj et al. 2001). To gain further
insight on this process, we analyzed the levels of the major carbon metabolites in selected
transgenic CS 8 transgenic lines and wildtype. As expected, ADP-glucose levels were
elevated in the transgenic lines, which accounted for the increase in grain weights of mid-
developing and mature seeds. Interestingly, the precursor metabolites, glucose 1-
phosphate and UDP-glucose, that lead to ADP-glucose, were also elevated to the same
extent, indicating that ADP-glucose may be reaching saturating levels and that the
transport or utilization of this sugar nucleotide is the major downstream limitation in
starch synthesis.
Materials and Methods
Plant materials and growth conditions
Wildtype rice (Oryza sativa L. cv Kitaake) and four CS 8 T5 rice (CS 8-3, CS 8-
13, CS 8-18 and CS 8-29) having up-regulated cytoplasm-targeted E. coli glgC-TM gene
(Figure 3-1) were grown in a controlled environmental growth chamber with 12h-
photoperiods, at 26oC during the day and 22
oC during the night. Photosynthetic photon
flux density of the growth chambers was 1000 µmol m-2
s-1
and relative humidity was
80%. Rice plants were germinated in water for 10 days after sterilizing seeds with 50%
bleach, and then transplanted one plant per 2 gallon pot. Fertilizer [1 part Calcium Nitrate
(15.5-0-0), 2 parts Hi Phos Special (15-30-15), ½ part Magnitrate (10-0-0 + Magnesium),
½ part Chelated Iron (Fe 330), ¼ part Soluble trace element mix (all micronutrients)] was
applied twice per week. In addition, 1 mM potassium phosphate was applied once per
week to prevent phosphate deficiency.

62
AGPase activity assay
Approximately 13 days after flowering, 10 immature rice seeds were selected and
ground in the presence of liquid nitrogen, and then 1 ml of the extraction buffer [20%
(w/v) sucrose, 50 mM Hepes-NaOH, pH 7.5, 5 mM MgCl2, 1 mM EDTA, 5 mM DTT, 1
mM PMSF, 1 µg/ml pepstatin, and 1 µg/ml leupeptin] was added. The homogenate was
centrifuged at 12,000 x g for 15 min at 4oC and the supernatant was immediately used for
assay of AGPase activity.
AGPase activity was assayed in the pyrophosphorolysis direction, which
measures the formation of [32
P] ATP from 32
PPi. The reaction mixture contained 100
mM Hepes-NaOH, pH 7.5, 5 mM DTT, 7 mM MgCl2, 10 mM NaF, 1 mM ADP-glucose,
0.4 mg/ml BSA, 1.5 mM NaPPi and 2000-2500 cpm/ml 32
PPi in the presence or absence
of 10 mM potassium phosphate. The reaction was initiated by adding 5 µl crude protein
extract and then incubated for 10 min at 37oC. The amount of ATP formed was
measured as described in Laughlin et al. (1998). Protein concentrations were
determinated using Advanced protein assay reagent (5x concentrated, Cytoskelton Inc.,
USA).
Determination of biomass and seed morphology
During the developing reproductive stage (about 13 days after anthesis), 25
immature seeds per plant were weighed and stored for metabolite analysis. At maturity,
all panicles of individual plants were harvested and air-dried at room temperature. From
the first 3 to 5 panicles to flower, 100 seeds were obtained per panicle, and weighed in
order to calculate the average seed weight of each line. The weight of intact grains,
seeds with the seed coats removed, hulls (seed coats), and the height, width and thickness

63
of intact grains and seeds were measured. Images of wildtype and CS 8 rice seeds
without seed coat were taken using ProgRes® C12 Plus
Camera and ProgRes® Capture
Pro (Version 2.0) software (Germany).
LC-MS/MS metabolite analysis
Twenty-five developing seeds (about 13 days after anthesis) were collected from
each plant, frozen in liquid nitrogen and then stored at -80oC. Seed samples were
ground to a fine powder in liquid nitrogen, and then lyophilized for 2.5 days (Virtis,
Gardener, NY).
The samples were processed and analyzed by LC-MS/MS performed on an
Agilent 1100 liquid chromatograph interfaced to an Applied Biosystems SciexTM
3000
triple quadrapole tandem mass spectrometer equipped with a TurboIonTM
Spray inlet as
described by Smidansky et al. (2006). Quantitation was achieved by creating a
calibration curve for each targeted metabolite and using linear regression analysis on each
extract.
Statistical analysis
Analysis of variance (ANOVA) was done with the MINITAB software (Minitab
Inc.). Dunnet’s multiple comparison tests were used to compare between wildtype and
CS 8 transgenic lines. All analyses were performed at p≤ 0.05 significance level.
Results
AGPase activity of wildtype and CS 8 rice
Four independent, homozygous transgenic CS 8 lines expressing a cytoplasmic E.
coli AGPase TM enzyme as well as wildtype plants were grown to maturity under

64
controlled environmental conditions. Samples of mid-developing seeds from three
plants of each line were collected and assayed for AGPase activity. When assayed
under fully activating conditions in the absence of Pi, the transgenic lines showed a 1.7 to
2.8 fold increase in activity. When measured in the presence of Pi to suppress the
catalytic activity of the endogenous endosperm AGPase, the various CS 8 lines showed a
3- to 6-fold increase in AGPase activity compared to wildtype plants (Figure 9). As
these transgenic plants were fifth generation progeny from the initial transformation
event, expression of the integrated transgene in each of these CS 8 lines was stable and
not subjected to gene silencing.
Comparison of seed weight and seed morphology with wildtype and CS 8 rice
The effect of enhanced cytoplasmic AGPase activity on starch synthesis during
seed maturation was evaluated by measuring the weights of developing and mature
grains. From analysis during the developing stage (13 days after flowering), all of the
CS 8 rice lines showed an increase in total seed weight varying from 7 to 24% as
compared to wildtype (Figure 10). Likewise, mature seeds from the various transgenic
lines showed a significant increase in grain weight (7 to 15%) compared to wildtype
(Table 15). The increase in grain weight observed for the transgenic plant lines was
accompanied by an increase in grain size (Table 16) and volume (Figure 11).
Interestingly, these increases were reflected not only in the seed themselves, but also in
the seed coat, where the weight of the outer seed hulls was observed to be elevated in the
transgenic lines.
Carbon metabolism in upregulated cytoplasmic AGPase rice
The major primary carbon metabolites were analyzed in developing seeds of

65
wildtype and the four independent CS 8 transgenic rice lines (Table 17). Each
metabolite value was an average of the quantities measured from samples of developing
seeds derived from three plants of each CS 8 transgenic line. As expected ADP-
glucose, the product of AGPase activity, showed a significant increase in all of the
transgenic lines, CS 8-3, CS 8-13, CS 8-18 and CS 8-29, compared to wildtype. This
increase in ADP-glucose levels, however, was not proportional to the increase in levels of
AGPase activity measured in the various transgenic lines. Although CS 8-18 had nearly
twice the levels of AGPase activity than CS 8-29, it had lower levels of ADP-glucose,
and as noted earlier, lower seed weight than other transgenic lines. In general, higher
ADP-glucose levels corresponded to higher seed weight. The lowest (29%) and highest
(46%) increases in ADP-glucose levels were seen for CS 8-18 and CS 8-29, respectively.
Surprisingly, there were significant increases in nearly all of the other metabolites
measured. With the exception of GDP-glucose and sucrose, the levels of the major
primary carbon metabolites, glucose 6-phosphate, glucose 1-phosphate and UDP-glucose,
were significantly elevated compared to the wildtype control. As seen earlier for ADP-
glucose, CS 8-18 showed the smallest increase in the levels of these metabolites while the
other three transgenic lines showing significantly larger increases.
Interestingly, three of the transgenic lines showed significant increases in fructose
and glucose levels. The increases in hexoses suggest a more active invertase activity in
these transgenic plants as reflected by the apparent equilibrium values (Glc)(Fru)/(Suc)
for CS 8-3, CS 8-13 and CS 8-29 (Table 17). The fourth transgenic line, CS 8-18,
appeared to have somewhat increased glucose levels (though not significant at p = 0.05)
while fructose levels were essentially unchanged from that of the wildtype.

66
Discussion
Crop yields are governed by source-sink relationships. As starch comprises
~78% of dry weight of rice seed, the rate and capacity for carbon flux into this storage
product has a large impact on sink strength in rice (Singh and Juliano 1977). A key
regulatory step in starch biosynthesis is catalyzed by AGPase whose activity is governed
by the relative amounts of the activator 3-PGA to inhibitor Pi. As Pi is a potent
inhibitor of the enzyme even in the presence of equimolar amounts of the activator 3-
PGA, it is likely that this reaction is one of the rate-limiting steps of starch biosynthesis.
Indeed, the expression of a highly active, allosteric-insensitive bacterial AGPase results
in a higher flux of carbon into starch in potato tubers (Stark et al. 1992, Sweetlove et al.
1996) and in developing rice seeds (Sakulsingharoj et al. 2004). A similar situation was
observed in maize where expression of a naturally occurring Pi-insensitive AGPase coded
by Shrunken 2 rev6 resulted in increase starch content and, in turn, kernel weight (Giroux
et al. 1996).
Our studies showed that the cytoplasmic-localized, but not plastid-localized,
AGPase catalyzed reaction is a limiting step in starch biosynthesis in developing rice
seed. Further efforts to enhance starch synthesis in developing rice seeds by growing
the transgenic CS 8 plants under elevated CO2, however, did not further increase grain
weight (Sakulsingharoj et al. 2004). Since elevated CO2 enhances photosynthesis and
increases sucrose levels to the developing seed (Chen and Sung 1994, Rowland-Bamford
et al. 1996), the lack of CO2 stimulated starch synthesis suggested that the AGPase
catalyzed step was no longer limiting in rice and that one or more other processes became
more important (Okita et al. 2001).

67
To further characterize these rice transgenic lines, we conducted a more in-depth
study of their biochemical properties and traits. All four transgenic CS 8 lines exhibited
higher AGPase activity levels than wildtype and showed higher seed weights during mid-
development and at final maturation.
Although all of the CS 8 transgenic lines produced seeds of higher weight, there
was no obvious correlation between the increase in AGPase activity (3 to 6 fold higher
than wildtype) and extent of increases in seed weight. This suggests a 3 fold increase in
AGPase activity is sufficient to overcome limitations in this step in starch synthesis.
The lack of correlation between AGPase activity and starch biosynthesis was clearly
apparent for CS 8-18 line which had the highest AGPase activity but the lowest increase
in grain weight of the four CS 8 lines studied. This lack of correlation may infer an
inhibition of starch synthesis when AGPase activity becomes excessively high. Also,
sucrose levels in developing seeds of CS 8-18 were the lowest of the four transgenic
lines, possibly suggesting that this line may not transport sucrose as efficiently as the
others. Further studies with CS 8-18 will be required to clarify why its enhancement of
seed weight is lower than that of other lines.
Interestingly, in addition to increases in grain weight, the weight of the outer seed
hull of the four CS 8 transgenic rice lines was also elevated compared to the wildtype.
Seed hull weights were found to increase from 6 to 24% with CS 8-18 showing the
smallest increase and CS 8-29 showing the highest increase. It has been suggested that
the rigid hull of rice limits the grain size (Yoshida, 1981). These increases in seed coat
indicate that the growth of the outer hull is not rigidly set. Instead, the growth of the
seed hull is elastic and can accommodate the increases in seed volume (Figure 11)

68
mediated by increase starch synthesis.
All of the transgenic CS 8 lines had significantly higher levels of ADP-glucose than
wildtype plants which resulted in these CS 8 transgenic lines producing seeds of higher
weight. The extent of increase of ADP-glucose levels, however, did not translate to the
same increases in starch as reflected by grain weight. For example, ADP-glucose levels
were elevated from 29-46% among the four transgenic lines, whereas increases in seed
weight were much lower and ranged from 7-15%. These results, together with the
absence of any further increase in grain weight in transgenic rice plants grown under
elevated CO2, indicate that ADP-glucose biosynthesis is no longer a limiting step in
starch biosynthesis and that one or more other reactions now constrains carbon flux into
starch. Analysis of the other major carbon metabolites in these transgenic lines provides
important insights in this process.
The principal pathway leading to starch synthesis in cereal endosperm is the
breakdown of sucrose into UDP-glucose and fructose followed by the metabolism of
UDP-glucose into glucose 1-phosphate. The resulting glucose 1-phosphate together
with ATP is then converted into ADP-glucose (Figure 2). The cytoplasmic produced
ADP-glucose is then transported into the amyloplast where it serves as a substrate for
various starch synthase activities. Analysis of the major metabolites formed from
sucrose metabolism showed that they were also elevated compared to the wildtype. The
largest increases were seen for glucose 1-phosphate (32-61%) followed by glucose 6-
phosphate (18-50%), and, in turn, followed by UDP-glucose (15-39%). In all instances,
the smallest increases in these metabolites were displayed by CS 8-18 which also showed
the smallest increases in seed weight compared to the wildtype.

69
Despite the range of increases, these metabolites are apparently in near equilibrium
as indicated when the relative ratios of these metabolites are calculated. This is best
illustrated by the ratio of glucose 6-phosphate/glucose 1-phosphate which is 17.9 in the
wildtype and 15.9 to 16.7 in the various CS 8 transgenic lines. The wildtype
equilibrium constant (Keq) value is very close to the Keq of 19-20 for this reaction. The
ratios of ADP-glucose/glucose 1-phosphate, ADP-glucose/UDP-glucose and glucose 1-
phosphate/UDP-glucose were nearly constant among the four CS 8 transgenic and
wildtype lines. These constant metabolite ratios indicate that the metabolites, although
elevated in the CS 8 transgenic lines, are in equilibrium at a higher steady state level.
What accounts for the increases in the upstream metabolite precursors that lead to
ADP-glucose synthesis? The simplest explanation is that the higher net catalytic
activity of the E. coli AGPase mutant enzyme increases the synthesis and, hence, the
levels of ADP-glucose in the cytoplasm. However, since the AGPase reaction has a Keq
of about 1.0, the reverse reaction also occurs resulting in the elevation of glucose 1-
phosphate and, in turn, glucose 6-phosphate via the reversible phosphoglucomutase.
The elevated glucose 1-phosphate levels would also increase UDP-glucose levels, as the
UDP-glucose pyrophosphorylase reaction is also reversible. The increase in ADP-
glucose as well as the upstream precursor metabolites, along with the extent of these
increases which are much higher than the increases in grain weight, indicate that
downstream processes in ADP-glucose utilization are now limiting. These downstream
steps include the transport of ADP-glucose from the cytoplasm to the amyloplast where it
is utilized by starch synthase activities. Of these two processes, the transport of ADP-
glucose may be the more important limiting factor given that there are multiple forms of

70
starch synthase.
Our results differ substantially from those reported by Smidansky et al. (2002,
2003) who showed that transgenic rice and wheat lines expressing a maize AGPase large
subunit Sh2r6hs gene displayed higher yields stemming mainly from a higher number of
seeds per panicle and enhanced number of reproductive organs, and not from increase
seed weight. The larger number of seeds per rice panicle or wheat head suggests a
reduction in seed abortion by expression of the variant AGPase large subunit gene.
Moreover, unlike the condition observed in this study, ADP-glucose, UDP-glucose,
glucose 1-phosphate and glucose 6-phosphate levels remained essentially unchanged
between the wheat transgenic and a segregating non-transgenic sibling (Smidansky et al.
2007).
Overall, our results show that the sink strength of developing rice seeds can be
increased by enhancing the net catalytic activity of the cytoplasmic-localized AGPase
activity. Analysis of the major metabolites in the transgenic rice lines showed that the
catalytic reactions leading to ADP-glucose are no longer limiting and that further
improvements in increasing carbon flux into starch are situated downstream of ADP-
glucose formation and occur at the transport of this sugar nucleotide into the amyloplast
or its utilization by starch synthases.
Acknowledgement
I thank for Dr. Thomas W. Greene (Dow Agroscience LLC, Indianapolis, Indiana
46268, USA) for LC-MS/MS analysis.

71
References
Chen, C. L., and J. M. Sung (1994). "Carbohydrate metabolism enzymes in CO2-enriched
developing rice grains varying in grain size." Physiol Plant 90: 79-85.
Choi, S.B., Y. Zhang, et al. (1998). "Increasing rice productivity by manipulation of
starch biosynthesis during seed development." In Feeding a World Population of
More Than Eight Billion People: A Challenge to Science. Edited by Waterford,
J. , Armstrong, D. , Fowden, L. and Riley, R. pp. 137-149. Oxford University
Press, New York.
Denyer, K., F. Dunlap, et al. (1996). "The major form of ADP-glucose
pyrophosphorylase in maize endosperm is extra-plastidial." Plant Physiol 112:
779-785.
Edwards, G., O. Kiirats, et al. (2000). "Requirements for CO2 concentrating mechanism
in C4 plants relative to limitations on carbon assimilation in rice." In Redesigning
rice photosynthesis to increase yield: Proceedings of the Workshop to Reduce
World Hunger: Redesigning Rice Photosynthesis. Edited by Sheedy, J.E. ,
Mitchell, P.L. and Hardy, B. pp. 99-112. Elsevier Science B.V, The Netherlands.
Giroux, M.J., J. Shaw, et al. (1996). "A single gene mutation that increases maize seed
weight." Proc Natl Acad Sci USA 93: 5824-5829.
Hannah, L.C. (1997). "Starch synthesis in the maize seed." In Cellular and Molecular
Biology of Plant Seed Development. Edited by Larkins, B.A. and Vasil, I.K. pp.
375-405. Kluwer Academic Publishers, Netherlands.
Okita, T.W., J. Sun, et al. (2001). "Increasing rice productivity and yield by manipulation
of starch synthesis." Novartis Found Symp 236: 135-46.
72
Preiss, J., K. Ball, et al. (1991). "Starch biosynthesis and its regulation." Biochem Soc
Trans 19: 539-547.
Preiss, J., D. Stark, et al. (1994). "Prospects for the production of cereals with improved
starch properties." In Proceedings of the Improvement of Cereal Quality by
Genetic Engineering. Edited by Henry, R. and Ronalds, J.A. pp. 115-127.
Plenum Press.
Rowland-Bamford, A.J., J. T. Baker, et al. (1996). "Interactions of CO2 enrichment and
temperature on carbohydrate accumulation and partitioning in rice." Environ Exp
Bot 36: 111-124.
Sakulsingharoj, C., S.-B. Hwang, et al. (2004). "Engineering starch biosynthesis for
enhanced rice yields: the role of the cytoplasmic ADP-glucose
pyrophosphorylase." Plant Sci 167: 1323-1333.
Sakulsingharoj, C., S.-B.Choi, et al. (2001). "Manipulation of ADP-glucose
pyrophosphorylase in starch biosynthesis during rice seed development." In "Rice
Genetics IV. Proceedings of the Fourth International Rice Genetics Symposium.
Edited International Rice Research Institute, P.O. Box 933, Manila, Philippines.
Sikka, V.K., S.-B. Choi, et al. (2001). "Subcellular compartmentation and allosteric
regulation of the rice endosperm ADPglucose pyrophosphorylase." Plant Sci 161:
461-468.
Singh, R. and B.O. Juliano (1977). "Free Sugars in Relation to Starch Accumulation in
Developing Rice Grain." Plant Physiol 59: 417-421.
Slattery, C.J., I. H. Kavakli, et al. (2000). "Engineering starch for increased quantity and
quality." Trends Plant Sci 5: 291-8.

73
Smidansky, E., F. Meyer, et al. (2007). "Expression of a modified ADP-glucose
pyrophosphorylase large subunit in wheat seeds stimulates photosynthesis and
carbon metabolism." Planta 225: 965-976.
Smidansky, E.D., M. Clancy, et al. (2002). "Enhanced ADP-glucose pyrophosphorylase
activity in wheat endosperm increases seed yield." Proc Natl Acad Sci U S A 99:
1724-1729.
Smidansky, E.D., J. M. Martin, et al. (2003). "Seed yield and plant biomass increases in
rice are conferred by deregulation of endosperm ADP-glucose
pyrophosphorylase." Planta 216: 656-64.
Smith, A.M., K. Denyer (1997). "The synthesis of the starch granule." Annu Rev Plant
Physiol 48: 65-87.
Stark, D.M., K. P. Timmerman, et al. (1992). "Regulation of the amount of starch in plant
tissues by ADP glucose pyrophosphorylase." Science 258: 287-292.
Sweetlove, L.J., M. M. Burrell, et al. (1996). "Starch metabolism in tubers of transgenic
potato (Solanum tuberosum) with increased ADPglucose pyrophosphorylase."
Biochem J 320: 493-498.
Tegeder, M. and A. P. M. Weber (2006). "Metabolite transporters in the control of plant
primary metabolism." In Annu. Plant Rev. 22, 85-120. vol. 22 Edited by Plaxton,
W. and McManus, M. pp. 85-120. Blackwell Publishing, Oxford.
Thorbjornsen, T., P. Villand, et al. (1996). "Distinct isoforms of ADPglucose
pyrophosphorylase occur inside and outside the amyloplasts in barley
endosperm." Plant J 10: 243-250.
Tiessen, A., H. J. Hendriks, et al. (2002). "Starch synthesis in potato tubers is regulated

74
by post-translational redox modification of ADP-glucose pyrophosphorylase: a
novel regulatory mechanism linking starch synthesis to the sucrose supply." Plant
Cell 14: 2191-213.
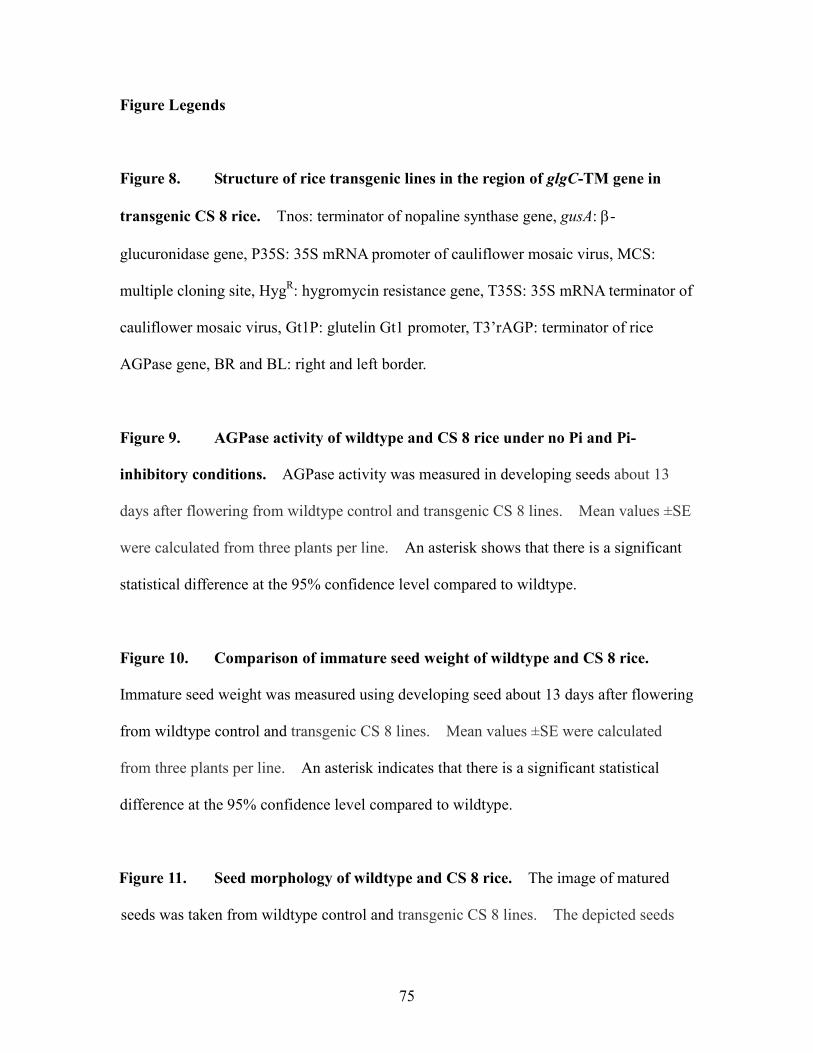
75
Figure Legends
Figure 8. Structure of rice transgenic lines in the region of glgC-TM gene in
transgenic CS 8 rice. Tnos: terminator of nopaline synthase gene, gusA: β-
glucuronidase gene, P35S: 35S mRNA promoter of cauliflower mosaic virus, MCS:
multiple cloning site, HygR: hygromycin resistance gene, T35S: 35S mRNA terminator of
cauliflower mosaic virus, Gt1P: glutelin Gt1 promoter, T3’rAGP: terminator of rice
AGPase gene, BR and BL: right and left border.
Figure 9. AGPase activity of wildtype and CS 8 rice under no Pi and Pi-
inhibitory conditions. AGPase activity was measured in developing seeds about 13
days after flowering from wildtype control and transgenic CS 8 lines. Mean values ±SE
were calculated from three plants per line. An asterisk shows that there is a significant
statistical difference at the 95% confidence level compared to wildtype.
Figure 10. Comparison of immature seed weight of wildtype and CS 8 rice.
Immature seed weight was measured using developing seed about 13 days after flowering
from wildtype control and transgenic CS 8 lines. Mean values ±SE were calculated
from three plants per line. An asterisk indicates that there is a significant statistical
difference at the 95% confidence level compared to wildtype.
Figure 11. Seed morphology of wildtype and CS 8 rice. The image of matured
seeds was taken from wildtype control and transgenic CS 8 lines. The depicted seeds

76
for each line were selected based on their weight which was identical to the mean weight
for each of the rice lines. The white bar is 1mm.
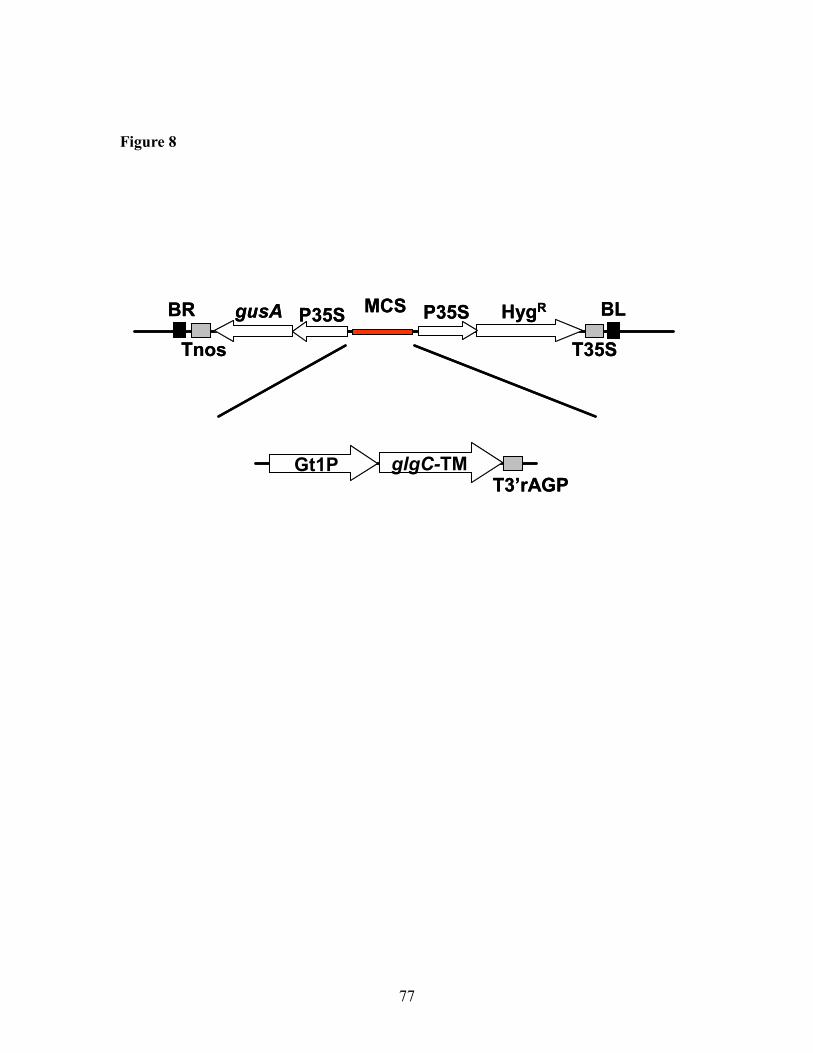
77
Figure 8
HygRBR BL
T35STnos
P35S P35SgusA MCS
glgC-TMGt1PT3’rAGP
HygRBR BL
T35STnos
P35S P35SgusA MCS
glgC-TMGt1PT3’rAGP

78
Figure 9
0.00
0.05
0.10
0.15
0.20
0.25
0.30
0.35
Wildtype CS 8-3 CS 8-13 CS 8-18 CS 8-29
Lines
AG
Pas
e ac
tivit
y, u
nits
mg
-1
No Pi 10mM Pi
No Pi 100 275* 165 252 199
10mM Pi 100 550* 289 621* 329
Number of samples 3 3 3 3 3
0.00
0.05
0.10
0.15
0.20
0.25
0.30
0.35
Wildtype CS 8-3 CS 8-13 CS 8-18 CS 8-29
Lines
AG
Pas
e ac
tivit
y, u
nits
mg
-1
No Pi 10mM Pi
No Pi 100 275* 165 252 199
10mM Pi 100 550* 289 621* 329
Number of samples 3 3 3 3 3

79
Figure 10
Standard error 0.80 0.96 0.48 0.48 0.13
% compared to wildtype 100 118* 115* 107 124*
Number of samples 3 3 3 3 3
0
5
10
15
20
25
30
35
Wildtype CS8-3 CS8-13 CS8-18 CS8-29
Lines
See
d w
eigh
t, m
g s
eed-1
Standard error 0.80 0.96 0.48 0.48 0.13
% compared to wildtype 100 118* 115* 107 124*
Number of samples 3 3 3 3 3
0
5
10
15
20
25
30
35
Wildtype CS8-3 CS8-13 CS8-18 CS8-29
Lines
See
d w
eigh
t, m
g s
eed-1

80
Table 15 The seed weights of wildtype and CS 8 rice. Matured seed weights of
intact grain (seed and hull), seed, and seed hull were measured from wildtype control and
transgenic CS 8 lines. Mean values ±SE were calculated from six or seven plants per
lines. Parentheses indicate percentage of seed weight compared to wildtype. An
asterisk indicates that there is a significant statistical difference at the 95% confidence
level compared to wildtype.
N
Wildtype 7 26.7 ± 0.6 (100) 22.4 ± 0.5 (100) 4.3 ± 0.1 (100)
CS 8-3 7 29.8 ± 0.2* (111) 24.9 ± 0.2* (111) 4.9 ± 0.1* (114)
CS 8-13 6 30.1 ± 0.2* (113) 25.3 ± 0.2* (113) 4.8 ± 0.1* (111)
CS 8-18 7 28.5 ± 0.3* (107) 23.9 ± 0.3* (107) 4.6 ± 0.1 (106)
CS 8-29 7 30.6 ± 0.2* (115) 25.3 ± 0.2* (113) 5.4 ± 0.1* (124)
HullIntact grain
Line
Seed
mg seed-1
% mg seed-1
% mg seed-1
%

81
N
Wil
dty
pe
77
.09
± 0
.04
3
.58
± 0
.04
2.5
0±
0.0
2
4.8
3±
0.0
5
3.0
3±
0.0
3
2.2
5±
0.0
3
CS
8-3
77
.78
± 0
.08
*
3
.80
± 0
.04
*
2.5
9±
0.0
2 *
5
.30
± 0
.04
*
3.1
8±
0.0
3 *
2
.28
± 0
.02
CS
8-1
36
7.8
3±
0.0
7 *
3
.81
± 0
.03
*
2.5
8±
0.0
1 *
5
.30
± 0
.03
*
3.2
4±
0.0
2 *
2.2
8±
0.0
1
CS
8-1
87
7.4
1±
0.0
5 *
3
.75
± 0
.02
*
2
.60
± 0
.02
*
5
.04
± 0
.03
*
3.1
5±
0.0
2 *
2.3
2±
0.0
2 *
CS
8-2
97
8.0
2±
0.0
6 *
3
.87
± 0
.01
*
2.6
3±
0.0
2 *
5.4
2±
0.0
4 *
3
.24
± 0
.01
*
2.3
1±
0.0
1
Inta
ct g
rain
, m
mS
eed
, m
m
Heig
ht
Wid
thT
hic
knes
sH
eight
Wid
thT
hic
knes
sL
ine
Tab
le 1
6.
Gra
in s
ize
of
wil
dty
pe
an
d C
S 8
ric
e.
Hei
gh
t, w
idth
an
d t
hic
kn
ess
of
mat
ure
d i
nta
ct g
rain
(se
ed a
nd
hu
ll)
and
see
d w
ere
mea
sure
d f
rom
wil
dty
pe
con
tro
l an
d t
ran
sgen
ic C
S 8
lin
es.
M
ean
val
ues
±S
E w
ere
calc
ula
ted
fro
m s
ix o
r
sev
en p
lan
ts p
er l
ine.
Par
enth
eses
in
dic
ate
per
cen
tag
e o
f se
ed w
eig
ht
com
par
ed t
o w
ild
typ
e.
A
n a
ster
isk
in
dic
ates
th
at
ther
e is
a s
ign
ific
ant
stat
isti
cal
dif
fere
nce
at
the
95
% c
on
fid
ence
lev
el c
om
par
ed t
o w
ild
typ
e.
82
Figure 11
WT CS 8-3 CS 8-13 CS 8-18 CS 8-29WT CS 8-3 CS 8-13 CS 8-18 CS 8-29

83
%%
%%
%
G6
P4
1.3
± 0
.5(1
00
)5
6.6
± 2
.7*
(13
7)
54.5
± 1
.9*
(13
2)
48
.5±
2.2
(11
8)
61
.9±
1.0
*(1
50
)
G1
P2
.31
± 0
.05
(10
0)
3.4
5±
0.1
8*
(14
9)
3.3
0±
0.1
7*
(14
3)
3.0
6±
0.1
7*
(13
2)
3.7
1±
0.1
*(1
61
)
AD
Pglc
0.7
2±
0.0
1(1
00
)1
.02
± 0
.04
*(1
42
)1
.02
± 0
.06
*(1
42
)0
.93
± 0
.06
*(1
29
)1
.05
± 0
.05
*(1
46
)
GD
Pglc
0.0
28
± 0
.00
1(1
00
)0
.03
0±
0.0
04
(10
7)
0.0
29
± 0
.00
3(1
04
)0
.03
5±
0.0
02
(12
5)
0.0
26
± 0
.00
3(9
3)
UD
Pglc
3.8
2±
0.0
1(1
00
)5
.21
± 0
.38
*(1
36
)4
.69
± 0
.18
(12
3)
4.4
0±
0.2
1(1
15
)5
.31
± 0
.12
*(1
39
)
Fru
cto
se1
64
9±
51
(10
0)
19
48
± 1
82
(11
8)
17
86
± 5
2(1
08
)1
62
1±
65
(98
)1
959
± 6
2(1
19
)
Glu
cose
155
8±
22
(10
0)
20
89
± 1
88
*(1
34
)1
77
1±
19
(11
4)
16
50
± 6
(10
6)
20
23
± 6
2*
(13
0)
Sucr
ose
740
9±
23
4(1
00
)7
61
8±
59
1(1
03
)7
32
3±
26
8(9
9)
71
69
± 3
20
(97
)8
189
± 1
41
(11
1)
G6
P+
G1
P4
3.6
± 0
.5(1
00
)6
0.1
± 2
.8*
(13
8)
57.8
± 1
.9*
(13
3)
51
.6±
2.3
*(1
18
)6
5.6
± 0
.9*
(15
1)
AD
Pglc
+U
DP
glc
4.5
4±
0.0
2(1
00
)6
.23
± 0
.42
*(1
37
)5
.71
± 0
.24
*(1
26
)5
.34
± 0
.27
(11
8)
6.3
6±
0.1
5*
(14
0)
To
tal
sugar
s1
061
7±
18
8(1
00
)1
16
54
± 9
61
(11
0)
10
88
1±
32
1(1
03
)1
04
40
± 2
64
(98
)1
21
71
± 4
7(1
15
)
(Glc
)(F
ruc)
/Suc
34
8±
22
(10
0)
53
4±
57
(15
3)
43
2±
5(1
24
)3
76
± 3
2(1
08
)4
86
± 3
9(1
40
)
(Fru
c)(U
DP
glc
)/S
uc
0.8
6±
0.0
5(1
00
)1
.33
± 0
.11
(15
5)
1.1
4±
0.0
4(1
33
)1
.01
± 0
.14
(11
7)
1.2
7±
0.0
9(1
48
)
G6
P/G
lc0
.02
7±
0.0
00
(10
0)
0.0
27
± 0
.00
2(1
00
)0
.03
1±
0.0
01
(11
5)
0.0
29
± 0
.00
1(1
07
)0
.031
± 0
.00
1(1
15
)
G1
P/U
DP
glc
0.6
0±
0.0
1(1
00
)0
.66
± 0
.02
(11
0)
0.7
1±
0.0
4(1
18
)0
.69
± 0
.02
(11
5)
0.7
0±
0.0
2(1
17
)
G6
P/G
1P
17
.9±
0.6
(10
0)
16
.4±
0.2
(92
)1
6.6
± 1
.0(9
3)
15
.9±
0.4
(89
)1
6.7
± 0
.7(9
3)
AD
Pglc
/G1
P0
.31
± 0
.01
(10
0)
0.3
0±
0.0
1(9
7)
0.3
1±
0.0
2(1
00
)0
.30
± 0
.01
(97
)0
.28
± 0
.02
(90
)
AD
Pglc
/UD
Pglc
0.1
9±
0.0
0(1
00
)0
.20
± 0
.01
(10
5)
0.2
2±
0.0
0*
(11
6)
0.2
1±
0.0
0*
(11
1)
0.2
0±
0.0
1(1
05
)
Rat
io o
f m
etab
oli
tes
Met
abo
lite
s
Wil
dty
pe
CS
8-3
CS
8-1
3C
S 8
-18
CS
8-2
9
nm
ol
seed
-1
Tab
le 1
7.
Met
ab
oli
te lev
els
in 1
3-d
ay-o
ld d
evel
op
ing s
eed
s fr
om
wil
dty
pe
an
d C
S 8
ric
e.
Met
abo
lite
an
aly
sis
was
mea
sure
d f
rom
wil
dty
pe
con
tro
l an
d t
ran
sgen
ic C
S 8
lin
es.
M
ean
val
ues
or
rati
o ±
SE
wer
e ca
lcu
late
d f
rom
th
ree
pla
nts
per
lin
e.
P
aren
thes
es i
nd
icat
e p
erce
nta
ge
of
met
abo
lite
co
nte
nt
com
par
ed t
o w
ild
typ
e.
A
n a
ster
isk
in
dic
ates
th
at t
her
e is
a si
gn
ific
ant
stat
isti
cal
dif
fere
nce
at
the
95
% c
onfi
den
ce l
evel
co
mp
ared
to
wil
dty
pe.


