
A Study of High-chroma Inks for Expanding CMYK Color Gamut
August 2017
Graduate Student: Sanyukta Hiremath
Advisors: Prof. Elena Fedorovskaya and Prof. Robert Chung

Table of Contents
• Introduction and statement of the problem
• Theoretical basis and literature review
• Research objectives
• Methodology
• Results
• Conclusion and Further Research
2

Introduction
• There have been many research and development activities over the past 30 years to expand color gamut. This includes
1. Printing with higher ink film thickness2. Printing with more-than-CMYK inks, e.g., hexachrome, CMYKOGV,
etc.
• There is limited research that uses high-chroma inks to expand the CMYK color gamut. This presents an opportunity to conduct a research on expanding color gamut for the offset using high-chroma inks.
3

Background & Literature Review
IFT, density, and Tollenaar and Ernst equation
Press calibration using G7 methodology
CRPCs and color gamut
XCMYK, SID, and color gamut
Pigment concentration
4

IFT, Density, and Tollenaar Equation
• Printing is putting an ink layer on paper.
• The relation between ink film thickness and density was modeled in the work of Tollenaar and Ernst (IARIGAI, 1961).
• Tollenaar and Ernst Equation: d = SD [1-exp (-mw)]
• SD is the density of an infinitely thick ink film (Saturation Density)• m is the rate at which the Saturation Density is approached• w is the ink layer thickness• d is the density of the print
5

IFT, Density, and Tollenaar Equation
• The beginning of the plateau is termed “Saturation” Density (SD).
• Solid ink densities cannot be increased indefinitely.
• In other words, when contemplating to expand color gamut by increasing ink film thickness, the first thingis to find out Saturation Density of the inks used.
D
Density (d) vs. ink film thickness (w) on the paper. SD is the Saturation Density
d = SD [1-exp(-mw)]
SD
d
w
6

Press Calibration Using G7
• Press calibration is the process of adjusting a press’s current printing condition to match a set of printing aims (Chung, 2017).
• Traditional printing aim points were based on a specified paper color, e.g., ISO 12647-2.
• Dataset-based printing aims are derived from a reference print condition, e.g., ISO/PAS 15339.
• G7 is the press calibration procedure, the commercial implementation of which is described in TR015 (David McDowell, 2013).
7

• CRPC (Characterized Reference Printing Condition) describes the relationship between tonal values and CIELAB values of a reference CMYK device (ISO/PAS 15339-2, 2015)
• ICC profile is generated from CRPC with the use of ICC-based profiling software.
• Color gamut volume of a CMYK device is generated from profile inspection software.
CRPC and Color Gamut8
CRPC1 CRPC2 CRPC3 CRPC4 CRPC5 CRPC6 CRPC7
Volume
(Cubic Lab) 84,280 151,311 165,764 253,711 331,416 389,023 525,551
Ratio 0.22 0.39 0.43 0.65 0.85 1.00 1.35

XCMYK, SID, and Color Gamut
• IDEAlliance XCMYK Expanded -Gamut CMYK Beta Program
• XCMYK implies increasing C, M, Y, K solid ink densities above traditional levels without unwanted side effects. (IDEAlliance, 2016).
• Goal - to identify practical solid CIELAB target values so that a new dataset could be developed
• There is no explanation how to achieve the XCMYK solid ink density aims and specifically in relation to Saturation Density (SD)
SIDCRPC6
SIDXCMYK
C 1.4 1.85
M 1.4 1.85
Y 1.0 1.20
K 1.7 2.0
9

XCMYK, SID, and Color Gamut
• If obtainable, the comparison between color gamuts of CRPC6 and CRPC7 to XCMYK2017 are shown below (ColorThink Pro 3.0).
• XCMYK gamut is 46% larger than CRPC6 gamut.• CRPC7 gamut is 35% larger than CRPC6 gamut.
10
Color Gamut Gamut Volume Ratio
CRPC6 389,309 1.0
XCMYK2017 569,984 1.46
CRPC7 525,551 1.35

Pigment Concentration
• Gravure color gamut can be extended by adjusting pigment concentrations of the working ink (Chung and Hsu, 2006).
• C* of CMY solids is used to signify the optimized gamut corner.
• Red and green regions of the gamut are extended.
• Colorfulness of pictorial color reproduction is significantly improved.
11

Pigment Concentration
• Toyo Kaleido ink• High-chroma inks are specially formulated inks with higher pigment
concentration.
12

Summary of Background & Lit Review
• G7 is a press calibration method that provides common neutral appearance across different printing devices and color gamuts.
• Expanding color gamut by printing with four inks can be done by printing at higher SIDs and printing with high-chroma inks. IDEAlliance explored the use of higher SID to expand color gamut.This research explores expanding color gamut by printing with high-
chroma inks.
• Saturation Density is the limiting factor of ink film thickness for reaching higher density values.This study uses Tollenaar and Ernst model to explore the influence
of pigment on solid ink density and its resulting color gamut under G7 calibrated press conditions.
13

Research Questions
• There are two research questions in this research:1. Is the Saturation Density of high-chroma inks significantly larger than
that of standard inks?2. Is the color gamut of the high-chroma inks significantly larger than
the color gamut of the standard inks?
• Two printing conditions will help to evaluate color gamut and density are:
1. Printing with Toyo OSF inks (standard)2. Printing with Toyo Kaleido inks (high-chroma)
14
Variables
Independent Ink pigment condition (OSF, Kaleido)
Dependent Saturation Density and color gamut volume
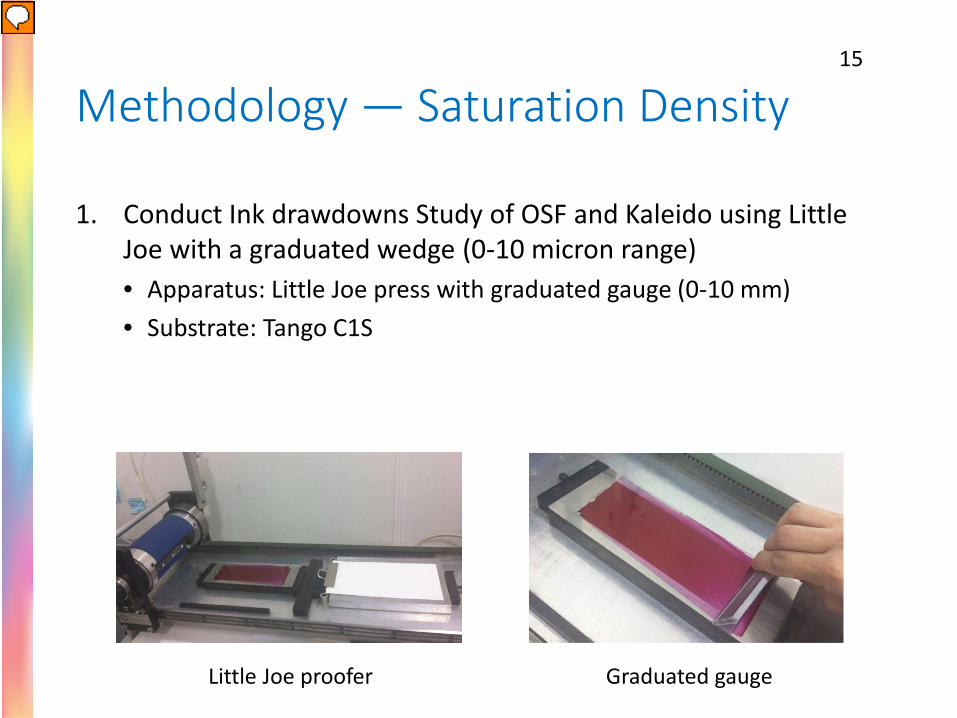
Methodology — Saturation Density
1. Conduct Ink drawdowns Study of OSF and Kaleido using Little Joe with a graduated wedge (0-10 micron range)• Apparatus: Little Joe press with graduated gauge (0-10 mm)• Substrate: Tango C1S
Graduated gaugeLittle Joe proofer
15

Methodology — Saturation Density
2. Measure and analyze Spectral Reflectance Curves (SRC) of CMYK ink at various IFT.• Raw data table of Relative IFT vs. spectral reflectance values
3. Determine SID based on the analysis of Relative IFT vs. SID of CMYK.
4. Use JMP, a statistical analysis s/w, to determine saturation densities.
5. Hypothesis testing and data analysis
16

Results: Cyan Ink Drawdown• Kaliedo cyan has more ink strength or chroma than OSF cyan.
• The cyan ink’s maximum absorption is in the long wavelength (red) region.
17

Results (Part 1): Cyan Ink Film Thickness & Saturation Density• For a given IFT, the Kaleido SID
is higher than the OSF SID.
• Based on the Tollenaar and Ernst model,
• The Saturation Density of OSF cyan ink is 1.68.
• The Saturation Density of Kaleido cyan ink is 2.35.
18
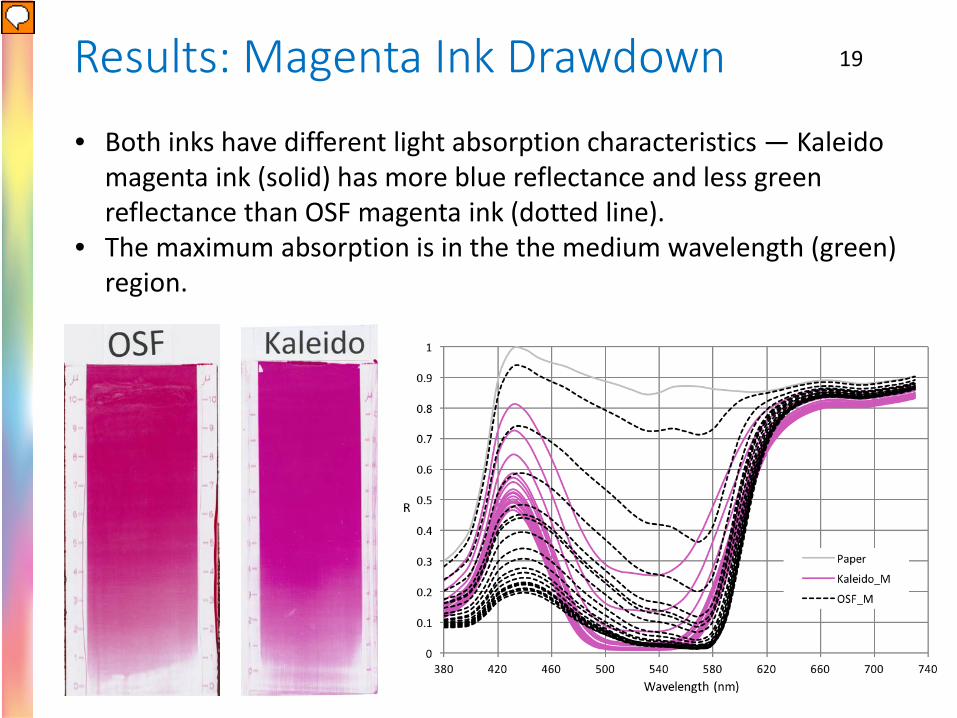
Results: Magenta Ink Drawdown 19
• Both inks have different light absorption characteristics — Kaleido magenta ink (solid) has more blue reflectance and less green reflectance than OSF magenta ink (dotted line).
• The maximum absorption is in the the medium wavelength (green) region.

Results: Magenta IFT & Sat_D
20
• For a given IFT, the Kaleido SID is higher than the OSF SID.
• Based on the Tollenaar and Ernst model,
• The Saturation Density of OSF magenta ink is 1.66.
• The Saturation Density of Kaleido magenta ink is 1.77.

Results: Yellow Ink Drawdown 21
• Both inks have similar light absorption characteristics. Kaleido yellow ink has more ink strength than OSF yellow ink.
• The maximum absorption is in the the short wavelength (blue) region.
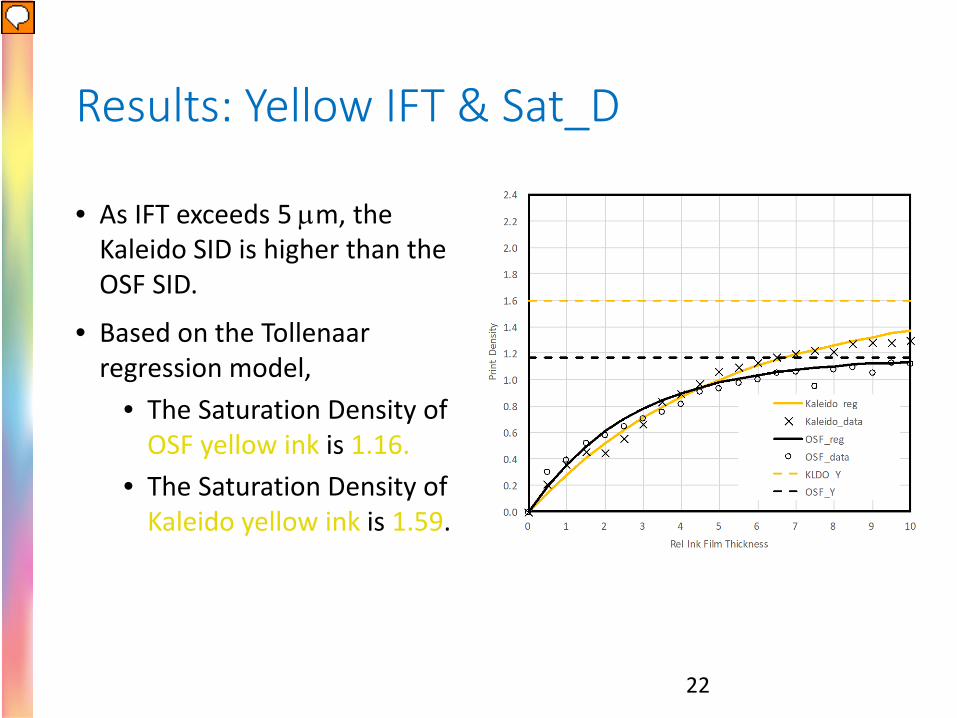
Results: Yellow IFT & Sat_D
22
• As IFT exceeds 5 µm, the Kaleido SID is higher than the OSF SID.
• Based on the Tollenaar regression model,
• The Saturation Density of OSF yellow ink is 1.16.
• The Saturation Density of Kaleido yellow ink is 1.59.

Results: Black Ink Drawdown 23
• Both inks have similar light absorption characteristics. Kaleido black ink and the OSF black ink show no visual difference.
• The maximum absorption is in all regions of visible spectrum.

Results: Black IFT & Sat_D
• Based on the Tollenaar regression model,
• The Saturation Density of OSF black ink is 2.12.
• The Saturation Density of Kaleido cyan ink is 1.84.
• For a given IFT, the Kaleido SID is surprisingly lower than the OSF SID.
24

Results: Hypothesis #1 Testing
• The Saturation Density values for both ink sets were calculated using the Tollenaar regression model and JMP software.
• Statistical significance was calculated using t-test.
• The low p-value indicates significant difference between OSF and Kaleido saturation densities.
• Note: OSF Black ink was used in the Kaleido press run.
25
Sat_DOSF
Sat_DKaleido P-value
C 1.68 2.35 <0.0001
M 1.66 1.77 <0.05
Y 1.16 1.59 <0.0001
K 2.12 1.84 <0.0001

Discussion — SID Determination
• For the OSF press run, the starting solid ink densities are the same as CRPC6.
• For the Kaleido press run, the following procedure is used to determine the starting SIDs.
1) Start from the regression lines for OSF and Kaleido inks.
2) Use the GRACoL Cyan SID (1.40) to locate the intersection with the OSF regression line.
3) Bounce to the Kaleido regression line to locate the corresponding KaleidoSID (1.82).
4) Repeat steps 2-3 to determine other SIDs.
26

Discussion — SID Determination
• Using the ray-tracing techniques, the Kaleido SIDs, having the same ink film thickness as the OSF inks, are determined.
GRACoL OSF SID Kaleido SID
C 1.40 1.40 1.82
M 1.40 1.40 1.62
Y 1.00 1.00 1.06
K 1.70 1.70 1.52
27

Methodology — Gamut Volume
1. G7_OSF press calibrationa) Run 1, starting with the SID aims (Slide #27)b) 1-D curve generationc) Run 2, including SID adjustment to meet G7 requirementsd) G7 conformance verification
2. G7_Kaleido press calibrationa) Run 1, starting with the SID aims (Slide #27)b) 1-D curve generationc) Run 2, including SID adjustment to meet G7 requirementsd) G7 conformance verification
3. Compare differences in gamut volume, SID, and chroma between OSF and Kaleido inks
4. Hypothesis testing and data analysis
28

Resources• Printing conditions
• Toyo OSF and Toyo Kaleido• Paper: Endurance Gloss• RIP: Harlequin FM RIP• Offset press: Presstek 52DI
• Waterless plate• On press imaging• Common impression
cylinder• Ink sequence: KCMY
• Test form• TC1617 (a variation of
IT8.7/4)• P2P51
29

Resources
• Color measurement instruments• i1 Pro 2 (M1 measurement conditions)• i1 ISis 2 (M1 measurement conditions)
• Software• Adobe InDesign (used to create test
form)• Curve3 (to create adjustment curves
and analyze G7 conformance)• ChroMIX ColorThink Pro 3 (data
analysis and graphing)
30

Results — G7 Calibration OSF inks
• Run 1 gamut corners show conformance to CRPC6 solids.
• Run 1 tone reproduction is out of conformance.
• Run 1 gray balance is in conformance.
• Four 1-D adjustment curves are generated using Curve 3.
31

Results — G7 Calibration OSF inks
• Based on P2P measurement• Run 2 conforms to G7 Gray.• Gamut projection shows similar
results.
32

Results — G7 Calibration Kaleido inks
• Run 1 — Solid ink densities aims were from ink drawdowns. Instead of printing with linear plates, four OSF 1-D adjustment curves were applied.
• Background tinting (in cyan and yellow) observed. An ink additive from Toray was used as a fix.
• Two distinct “bents” in the green and red overprint ramps.
• Tone reproduction and gray balance are out of conformance.
• Four 1-D adjustment curves, applied in Run 2.
33
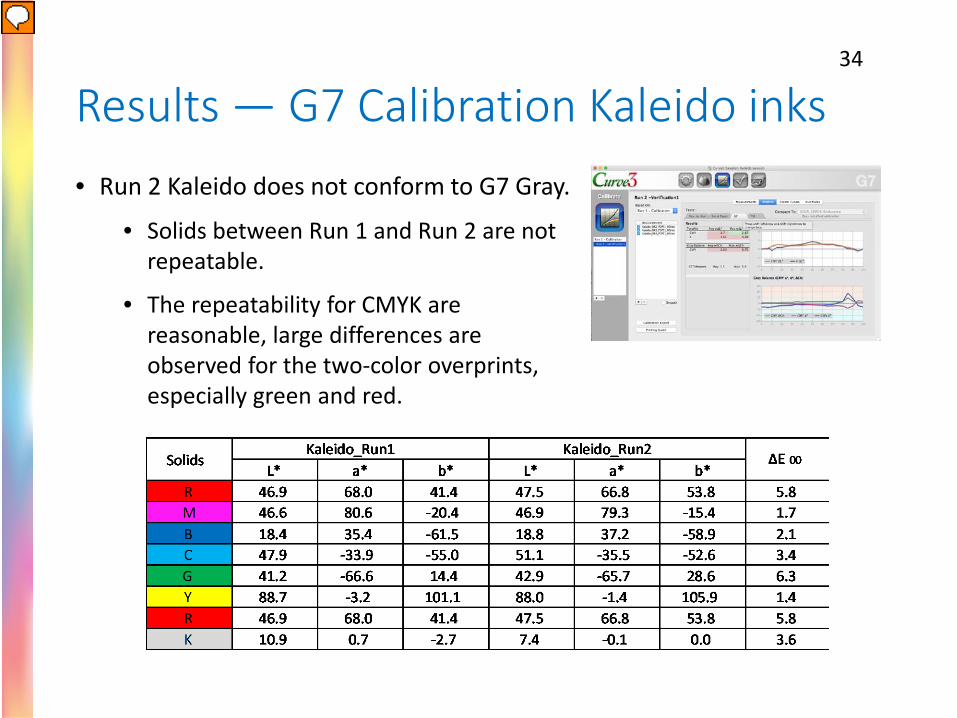
Results — G7 Calibration Kaleido inks• Run 2 Kaleido does not conform to G7 Gray.
• Solids between Run 1 and Run 2 are not repeatable.
• The repeatability for CMYK are reasonable, large differences are observed for the two-color overprints, especially green and red.
34

Results — Gamut Volume of Kaleido
• When comparing with Run 2 OSF inks, the color gamut of Run 2 Kaleido is 20% larger than OSF inks.
• Blue section of the gamut is increased.• The gamut volume is not optimized
and is limited due to the bents, i.e., poor ink trapping, in reds and greens.
35

Results: Hypothesis #2 Testing• It is not possible to decide if there is significant gamut volume
differences between the OSF inks and the Kaleido inks based on one data (volume) point.
• Therefore, metric chroma of CMYRGB of the two inks are used in the hypothesis testing.
• The p-value, <0.0001, indicates that there is significant chroma difference between Toyo OSF and Kaleido CMYRGB ramp colors.
36
Value
LAB_C Kaleido 45.91
LAB_C OSF 42.639
Mean Difference 3.27
Standard Error 0.755
N 72
Correlation 0.98
Value
t-Ratio 4.3376
DF 71
Prob >|t| <0.0001
Prob > t <0.0001
Prob < t 1.000

Conclusions
• Ink film thickness and density are not linear. Saturation Density dictates how much solid ink densities can be pushed for color gamut expansion. If Saturation Density is not taken into consideration, valuable time and resources can be wasted.
• High saturation densities of high-chroma inks will result in higher solid ink densities (SIDs), thus, expand its color gamut compared to standard inks.
• In this research, gamut volume expansion using high-chroma inks was not optimized due to ink trapping of two-color overprints and printing repeatability of waterless offset process.
37

Further Research
• The calibration of Kaleido inks for G7 was not successful due to repeatability problems and poor ink trapping. Future experiments can be focused on achieving printing stability.
• A practical and important future study will need to address the cost vs. performance evaluation and comparison of printing conditions for standard inks and high-chroma with various levels of solid ink densities and ink film thickness.
38

Acknowledgments
• My advisors – Prof. Elena Fedorovskaya, Prof. Robert Chung, Prof. Christine Heusner and all SMS faculty and staff
• My parents, my sister and friends at RIT and in India
• RIT HUB – Mary Ellen Gauntlett, Mark Soman, Christian Argentieri
• RIT PAL – Dan Clark, Margaret Hyman, Jeffrey Wang
• Industry experts – Ron Ellis, Don Hutcheson
• INX – Javier Robles
• Toyo – Venessa Lamount of Mark Andy Supplies
• RIPs – For providing the RIPs
39

ANY QUESTIONS?
40


