
A Retailer's Guide:
POS Software for Hardgoods RetailersAnalysts :Sean Alexander, Jerry Sheldon, Greg Buzek
P u b l i c a t i o n D a t e : S e p t e m b e r 1 6 , 2 0 1 0
1064 Cedarview Lane | Franklin, TN 37067 | +1 615-591-2955 Phone | www.ihlservices.com
IHL Group License and Fair Use Agreement
All of IHL Group’s generally available research products and databases are electronic licenses and can be shared freely within the purchasing organization and wholly owned subsidiaries. We only ask that this information not be shared with partners or others outside the purchasing company without authorization from IHL Group. The license does not extend to joint ventures or other partnerships. If the relationship is not a wholly owned subsidiary, then both parties would need a license.
Practically, this implies the following:
1. The purchasing company can use the reports worldwide internally as long as the international organizations are wholly owned subsidiaries of the purchasing company.
2. The research reports and databases cannot be distributed in whole or in part to partners or customers without express written approval from IHL Group.
3. The purchasing company may quote components of the data (limited use) in presentations to customers such as specific charts. This is limited to percentage components, not individual unit information. Unit data cannot be shared externally without express written approval from IHL Group. All references to the data in presentations should include credit to IHL Group for the data.
4. The purchasing company can reference qualitative quotes in printed material with written approval from IHL Group.
5. All requests requiring written approval should be submitted to [email protected] and will be reviewed within one business day.
For any questions regarding this policy, please contact us at 615-591-2955 or email us at [email protected].
1064 Cedarview Lane | Franklin, TN 37067 | +1 615-591-2955 Phone | www.ihlservices.com
©

Who We Are IHL Group is a global research and advisory firm specializing in technologies for the retail and hospitality industries. The company, based in Franklin, Tenn., generates timely data reports, offers advisory services and serves as the leading retail technology spokesperson for industry and vendor events.
What We Do IHL provides customized business intelligence for retailers and retail technology vendors, with particular expertise in supply chain and store level systems. Our customers are retailers and retail technology providers who want to better understand what is going on in the overall technology market, or wish to identify specific equipment needs for the retail market.
When We Started Greg Buzek served as Product Development Manager for two Fortune 500 retail technology suppliers for 6 years. Faced with making recommendations to senior management with spotty reports stuffed with technical jargon and unsubstantiated data, in 1996 he left to form IHL Group as an arms length consulting firm that delivers exacting research to corporate managers.
How We Work Reliable market analysis is essential for corporations to accelerate revenue and expand their market share. Most research providers do not disclose data sources or statistically defend the validity of their assumptions. We do. We disclose in precise detail exactly how and why we reached our conclusions so that our customers can be comfortable with the data they are using.
What We Know Our associates and advisors have over 100 years combined years of retail technology experience. Our associates have worked as product managers, sales representatives and executives in the retail market. We have the relationships, tools, and experience to meet your research and consulting needs.
1064 Cedarview Lane | Franklin, TN 37067 | +1 615-591-2955 Phone | www.ihlservices.com
A b o u t I H L G r o u p
Retail Point-of-Sale Systems in North America
Table of Contents
Top POS Software for Hardgoods Retailers .............................................................. 1
IHL Consulting Group License and Fair Use Agreement ............................................ 2
Introduction ..................................................................................................................... 6
Background and Objectives .............................................................................................. 6
Core Functionality Seen in POS Software ...................................................................... 6
Report Methodology .......................................................................................................... 7
Report Limitations ............................................................................................................. 8
Specialty Hard Goods Overview ................................................................................. 9
Generalized Overview of Segment Conditions ............................................................. 9
Key Players........................................................................................................................ 10
Tier 1 Summary ................................................................................................................ 10
Tier 2 Summary ................................................................................................................ 11
Tier 3 Summary ................................................................................................................ 11
Key Economic Trends Affecting Retailers ............................................................... 13
General Economic Conditions ........................................................................................ 13
Price Pressure.................................................................................................................... 14
Rising Labor Costs ........................................................................................................... 14
Union vs. Non-Union Labor ........................................................................................... 15
Lack of Available Workforce .......................................................................................... 15
Lack of Workforce Loyalty ............................................................................................. 16
Customer Loyalty/Wallet Share is King ....................................................................... 16
Terrorism Concerns ......................................................................................................... 16
ROI and POS Software .................................................................................................... 17
Store System Trends ..................................................................................................... 18
Store System Priorities ..................................................................................................... 18
Software Leads Hardware .............................................................................................. 19
Key POS Functions Under Consideration .................................................................... 19
POS Standards .................................................................................................................. 19
ARTS Standards ............................................................................................................... 19
PCI DSS Compliance ....................................................................................................... 21
Browser-Based Design ..................................................................................................... 22
Multi-Channel Shopping ................................................................................................ 22
Out of Stocks ..................................................................................................................... 22
Embedded Operating Systems – Thin Clients ............................................................. 25
Future POS Client Operating Systems .......................................................................... 25
What about 2010 and Beyond? ....................................................................................... 26
Shameless Plug ................................................................................................................. 27
The Top 5 Suppliers ..................................................................................................... 28

Retail Point-of-Sale Systems in North America
Vendor Accounts .............................................................................................................. 28
Estimated Number of POS Licenses .............................................................................. 29
Retail Revenue Represented By Vendor Accounts ..................................................... 30
Ranking Determination ................................................................................................... 31
Historical Rankings .......................................................................................................... 31
Table of Figures
Figure 1 – Union vs Non-Union Benefit Comparison ........................................................... 15
Figure 2 – 2010 Top Store System Priorities ............................................................................ 18
Figure 3 – POS Functions for the Next POS Upgrade ........................................................... 19
Figure 4 – Blame for Out of Stocks ........................................................................................... 23
Figure 5 – Increase in SSS if Out of Stock Problem is Fixed ................................................. 24
Figure 6 – POS Operating Systems Under Consideration .................................................... 25
Figure 7 – POS Software Purchase Intention .......................................................................... 26
Figure 8 – POS Client Base System Purchase Intention ........................................................ 26
Figure 9 – Vendor Account Share of the Top 250 Hardgoods Retailers ............................. 28
Figure 10 – Vendor POS License Share of the Top 250 Hardgoods Retailers .................... 29
Figure 11 – Vendor Revenue Share of the Top 250 Hardgoods Retailers ........................... 30
Figure 12 – Ranking Determination ......................................................................................... 31
Figure 13 – Historical Vendor Rankings ................................................................................. 32

Retail Point-of-Sale Systems in North America
INTRODUCTION
Background and Objectives
This report addresses the specific aspects of POS software as applied to North American
Specialty Hardgoods retailers. First, we provide a summary of the background subject
matter, which includes a discussion about the common core functionality of POS
software packages and the report methodology. We then take a look at the key economic
and technological trends that impact the retail landscape and competitive atmosphere.
Following this, we provide a discussion of the market share for vendors in the Specialty
Hardgoods POS space, as well as a look at the rankings developed for the vendors in the
top 250 Specialty Hardgoods accounts. Finally, we include a summary description of the
Top 5 POS software vendors and their applications as they pertain to Hardgoods
retailers.
Retailers in the early 21st century face many challenges, not the least of which is
competition. Mass Merchants in general (and Walmart in particular) are responsible for
the margin pressure every retailer feels. Walmart’s supply chain system efficiency,
coupled with their data warehousing capabilities and sheer size (economies of scale), has
afforded them the ability to pressure their suppliers and their competitors with both
margins and technology implementation. In an effort to not just grow but to compete
with Walmart, retailers are responding in different ways based on their competitive
position within the marketplace; some with mergers or divestitures, others with
targeting key demographics and focusing on increased service, and still others using
technology. This report attempts to bring a finer focus to this last point; that is, the use of
technology to effectively compete.
Along with the retail business trends there are key technology trends that continue to
impact retailers as we move forward. Customers are increasingly more informed on
options and alternatives as their use of the Internet increases. Security has been boosted
at physical locations as well as over the Internet due to terrorism, virus, and hacking
fears. Finally, we see the continuing consolidation of the retail software market.
Core Functionality Seen in POS Software
As we surveyed the Top 5 vendors of POS software in the Specialty Hardgoods space,
we observed some unique functionality within the various applications. That said, there
are also some core features that are generally standard within the leading POS software
offerings. These core features include the following:
1. A user interface and architecture designed to maximize customer throughput

Retail Point-of-Sale Systems in North America
2. Integration with:
a. Workforce Management (Labor Scheduling, Time & Attendance, and
Task Management) applications
b. (or incorporation of) Loss Prevention
c. Multiple Sales Channels; “Save the sale” capability; tightly integrated
with ecommerce channel
d. Corporate enterprise systems including financial, supply chain, and
merchandise planning
3. Support for company loyalty program initiatives
4. Full training mode
5. Interactive help menus to assist cashiers at each stage of the transaction
process
6. Adherence to ARTS (Association for Retail Technology Standards)
requirements
7. Ability to provide home store or other local store inventories by item
8. Perform Gift/Phone card activations
9. Returns management capability
10. Architected to be highly secure
11. Employee portal for accessing schedule, company email, etc.
Report Methodology
For the past twelve years, IHL has scoured public sources of information from trade
shows, press releases, and customer lists to build our IHL Retail Technology Database,
Sophia. For this report, our first step was to query this database to determine which
vendors of POS software were installed in the leading 250 North American Hardgoods
Retailers. Using this information, we contacted the ten leading vendors to verify our
data against their customer lists. We are very grateful to those vendors that were willing
to assist in the customer verification effort for this report.
Retail Point-of-Sale Systems in North America
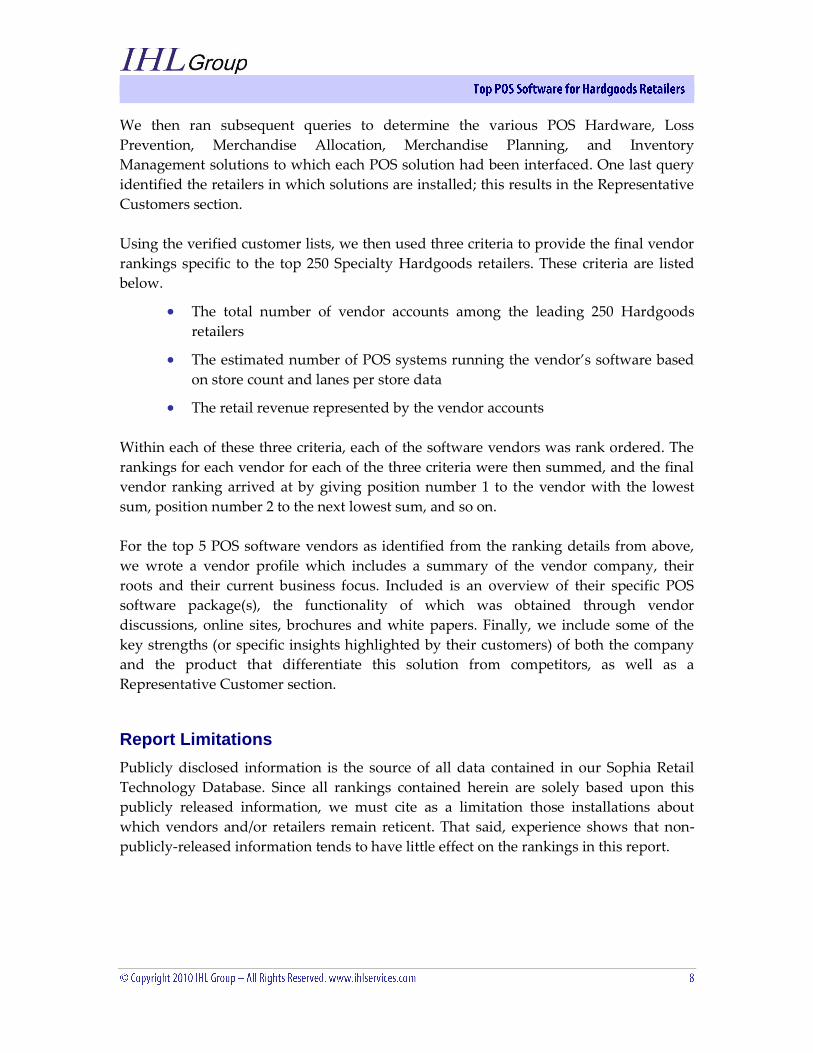
We then ran subsequent queries to determine the various POS Hardware, Loss
Prevention, Merchandise Allocation, Merchandise Planning, and Inventory
Management solutions to which each POS solution had been interfaced. One last query
identified the retailers in which solutions are installed; this results in the Representative
Customers section.
Using the verified customer lists, we then used three criteria to provide the final vendor
rankings specific to the top 250 Specialty Hardgoods retailers. These criteria are listed
below.
The total number of vendor accounts among the leading 250 Hardgoods
retailers
The estimated number of POS systems running the vendor’s software based
on store count and lanes per store data
The retail revenue represented by the vendor accounts
Within each of these three criteria, each of the software vendors was rank ordered. The
rankings for each vendor for each of the three criteria were then summed, and the final
vendor ranking arrived at by giving position number 1 to the vendor with the lowest
sum, position number 2 to the next lowest sum, and so on.
For the top 5 POS software vendors as identified from the ranking details from above,
we wrote a vendor profile which includes a summary of the vendor company, their
roots and their current business focus. Included is an overview of their specific POS
software package(s), the functionality of which was obtained through vendor
discussions, online sites, brochures and white papers. Finally, we include some of the
key strengths (or specific insights highlighted by their customers) of both the company
and the product that differentiate this solution from competitors, as well as a
Representative Customer section.
Report Limitations
Publicly disclosed information is the source of all data contained in our Sophia Retail
Technology Database. Since all rankings contained herein are solely based upon this
publicly released information, we must cite as a limitation those installations about
which vendors and/or retailers remain reticent. That said, experience shows that non-
publicly-released information tends to have little effect on the rankings in this report.
Retail Point-of-Sale Systems in North America
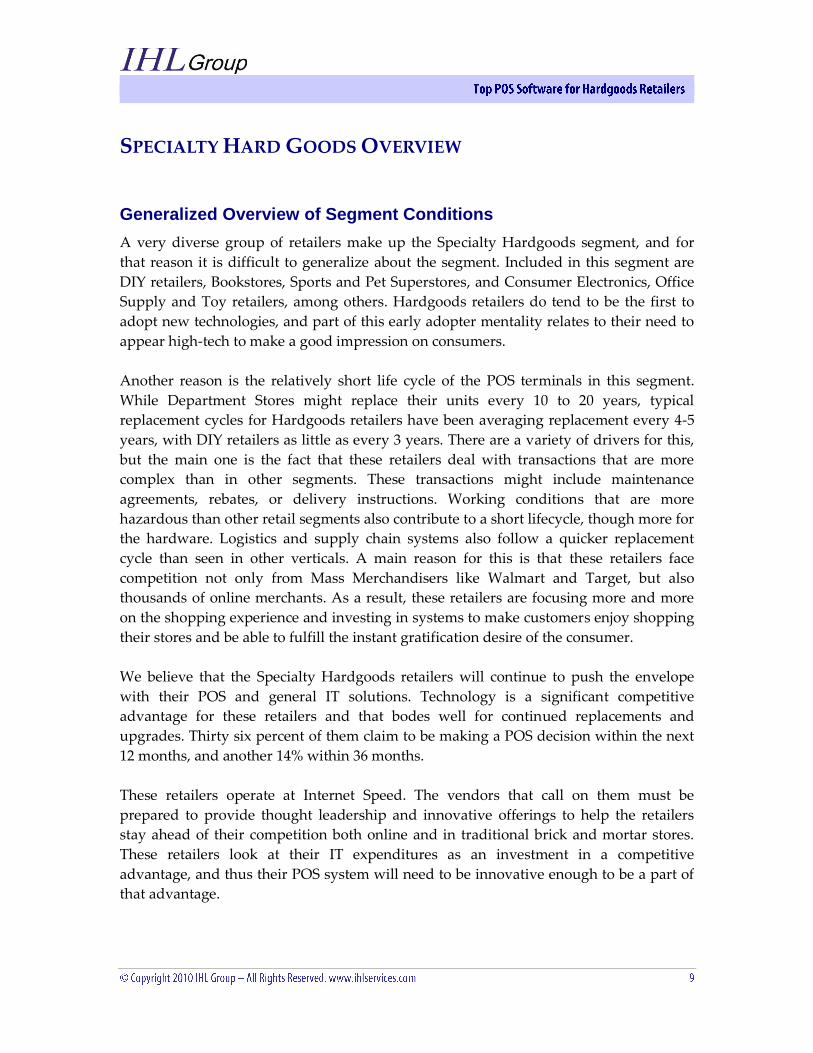
SPECIALTY HARD GOODS OVERVIEW
Generalized Overview of Segment Conditions
A very diverse group of retailers make up the Specialty Hardgoods segment, and for
that reason it is difficult to generalize about the segment. Included in this segment are
DIY retailers, Bookstores, Sports and Pet Superstores, and Consumer Electronics, Office
Supply and Toy retailers, among others. Hardgoods retailers do tend to be the first to
adopt new technologies, and part of this early adopter mentality relates to their need to
appear high-tech to make a good impression on consumers.
Another reason is the relatively short life cycle of the POS terminals in this segment.
While Department Stores might replace their units every 10 to 20 years, typical
replacement cycles for Hardgoods retailers have been averaging replacement every 4-5
years, with DIY retailers as little as every 3 years. There are a variety of drivers for this,
but the main one is the fact that these retailers deal with transactions that are more
complex than in other segments. These transactions might include maintenance
agreements, rebates, or delivery instructions. Working conditions that are more
hazardous than other retail segments also contribute to a short lifecycle, though more for
the hardware. Logistics and supply chain systems also follow a quicker replacement
cycle than seen in other verticals. A main reason for this is that these retailers face
competition not only from Mass Merchandisers like Walmart and Target, but also
thousands of online merchants. As a result, these retailers are focusing more and more
on the shopping experience and investing in systems to make customers enjoy shopping
their stores and be able to fulfill the instant gratification desire of the consumer.
We believe that the Specialty Hardgoods retailers will continue to push the envelope
with their POS and general IT solutions. Technology is a significant competitive
advantage for these retailers and that bodes well for continued replacements and
upgrades. Thirty six percent of them claim to be making a POS decision within the next
12 months, and another 14% within 36 months.
These retailers operate at Internet Speed. The vendors that call on them must be
prepared to provide thought leadership and innovative offerings to help the retailers
stay ahead of their competition both online and in traditional brick and mortar stores.
These retailers look at their IT expenditures as an investment in a competitive
advantage, and thus their POS system will need to be innovative enough to be a part of
that advantage.
Retail Point-of-Sale Systems in North America
The final word we have on the subject of competition has to do with the partnerships
that are being established between some mobile phone providers and the likes of
Froogle (Google Product Search) and Amazon’s TextBuyIt service. Simply, a consumer
with a properly-equipped mobile phone can capture the image of a barcode and access a
shopping-engine website that will return the best price and location for that particular
SKU. The end result is that the bricks-and-mortar retailer is at a distinct disadvantage;
he spends overhead dollars so that consumers can walk in the door and see-taste-touch
the product they want, and then walk out the door to their competitor down the block
who has the identical item for less money.
Key Players
This segment is among the most diverse and most accommodating to new vendors
entering. There are hundreds of retailers in this space and each is looking for a technical
advantage or system that allows them to react quickly. The key store systems vendors
that are successful in this space have strong multi-channel and/or multi-discipline
offerings. Retailers in this segment look to partner with vendors that can help them
grow, often buying several applications from the same vendor rather than integrating a
best-of-breed approach. It is this segment that has driven many of the acquisitions
among vendors and where Oracle and SAP have focused their attention. Other vendors
that have significant software share include JDA, Epicor/CRS/NSB, IBM,
Datavantage/MICROS, Fujitsu, Activant, NCR, PCMS Datafit, and Torex.
Tier 1 Summary
The Specialty Hardgoods segment includes some of the largest and most technically
advanced retailers in the world. That said, due to the size of the opportunity and the
push towards open systems, this segment has one of the lowest barriers to entry in terms
of incumbent competition. As noted before, the segment is very broad and thus it is
difficult to provide a solution that meets the specific needs of every type of retailer that
competes in this segment. Vendors that are successful in this space have solutions which
can be easily tailored to a wide array of requirements and tend to be at or very near the
leading edge of technology offerings. Here, technology is often seen as a mode of
differentiation among very similar offerings and thus it is more quickly embraced as a
means to attract and retain customers.
Retailers in this space face pressure from mass merchants and discounters as well as a
slew of online offerings. Multi-channel sales, though not necessarily a large percentage
of overall sales, are paramount in maintaining customer loyalty and reflecting a
consistent brand image regardless of the channel in which their customer prefers to
shop.
Retail Point-of-Sale Systems in North America
The successful vendors in this space generally do over $100 million dollars in revenue.
Key POS players are Datavantage (MICROS), Escalate, IBM, JDA, SAP, NSB Group, and
Oracle. They are generally broad solution providers, and most have grown over the past
few years through acquisition to take advantage of the growth of the Category Killers.
Tier 2 Summary
Similar to what we noted in the Tier 1 discussion, there is some opportunity here due to
the varying sub-industries found within this vertical, though the opportunity is not as
strong as one would see in, say, the Specialty Hardgoods or Convenience/Gas segments.
Retailers in the mid-market tend to make software purchase decisions based either on
integrated packages offered by the larger players or best-of-breed solutions. As noted
earlier, larger vendors have purchased many small niche players over the last three year
buying frenzy. This has opened the door for some smaller players, who still offer a very
robust functional solution yet do so at prices considerably south of what the larger
players seek. The vendors with the largest footprint in this space are Datavantage
(MICROS), Escalate, JDA, NSB Group, Oracle, and SAP.
SAP is worth mentioning because over the past couple of years they have introduced
solution offerings specifically targeted at mid-markets across many industries. Retail is
of particular interest, as it has experienced the largest percentage growth within SAP in
recent years. SAP services a wide number of industries than most other vendors, and
their dominant ERP position (within manufacturing they have an 80% share) coupled
with strong logistics and supply chain solutions, offers synergy opportunities for
retailers and manufacturers.
Tier 3 Summary
Tier 3 and smaller retailers are plentiful but widespread. Outside of DIY and Auto
Aftermarket, there are typically no franchisee or co-operative buying frameworks that
allow these smaller retailers to gain economies of scale in purchasing power. In most
cases, these retailers are on their own when competing against the Category Killers and
Mass Merchandisers that offer similar merchandise. Retailers in this space will most
often select integrated packages because they do not have the time or IT staff to take a
best-of-breed approach. Tomax and Escalate offer nice integrated solutions that have
been successful in this space. Other Key players in this revenue category include
Datavantage (MICROS), Island Pacific, JDA, and NSB Group.
Retailers in the Tier 3 Specialty Hardgoods market are plentiful, but they are very hard
to get to since there are few buying co-operatives. They have to be sold one retailer at a
time. The greatest challenge is that many of these retailers start out by making a
Retail Point-of-Sale Systems in North America
technology decision even before they hang out their shingle. Simply put, it’s extremely
difficult to identify who they are and market to them before they make a technology
decision.

Retail Point-of-Sale Systems in North America
KEY ECONOMIC TRENDS AFFECTING RETAILERS
General Economic Conditions
Last year we wrote in detail about the causes and potential effects of the downward
direction of the North American economy. Since that time, we have seen double-digit
unemployment in the US, record foreclosures, raised debt ceilings, record stimulus
spending passed and so much more. One’s economic outlook for 2010 really depends
upon who one wants to believe. One camp believes that a recovery is right around the
corner in mid-2010. Another camp believes that, in the words of Richard Hastings
(Consumer Strategist, Global Hunter Securities LLC), “<we do not expect a recovery in
any traditional form during 2010.” For ourselves, we’ll reserve judgment for the time
being.
Regardless of which way one chooses to view the current economic situation, retailers,
in general, have chosen to move forward. A recent survey by IHL reveals that store-level
IT spend is anticipated to be up 3.2% from 2009. For the rest of the enterprise, IT spend is
expected to be up 3.9%. This is great news for vendors, especially since 37% of those
retailers responding indicated that they would be making a POS hardware decision (and
28% indicated a POS software decision) during 2010.
The impact of these economic issues on retail has been very clear. Walmart was among
the very first to recognize the tough times ahead, slowing their domestic expansion back
in early 2008 and instead focusing upon their international markets. Other retailers
weren’t quite so prepared, as the only course of action left to them was to either go out
of business or begin closing stores and laying off workers thus exacerbating the
problem. Retailers who have vanished forever include Circuit City, Gottschalks,
Mervyns, Wickes, Whitehall and J.Jill. More recent store closures belong to the likes of
Borders (200 stores), Blockbuster (439, with another 250 in 2010), Starbucks (676), Ann
Taylor (33), Charming Shoppes (86), Dillards (3), Foot Locker (26), and even Home
Depot (33).
On the flip side, there are some retailers who have shown a penchant for store count
growth during these tough times. Among them are Walmart (144 new Supercenters,
offsetting the closing of 102 discount format stores), Dollar General (374 stores opened,
with another 600 scheduled for 2010), Walgreen (513 stores opened, with another 570 in
2010), Subway (385), Dollar Tree (231), Family Dollar (94), CVS (611), and Publix (17), to
name a few.

Retail Point-of-Sale Systems in North America
Overall, the effect this has on POS shipments is interesting. Store closings place some
POS in the secondary market, which are therefore available to retailers who need POS to
support either expansion or POS replacement. Those POS that make their way into the
secondary market and on to another retailer cannibalize sales of new POS. This in turn
reduces overall hardware shipments from vendors, but it has the potential for increased
service revenues for those vendors. We have seen POS shipments decline the past two
years, but the rumblings we have heard lately indicate the potential for positive
shipment growth in 2010. Retailers have done the same thing that we have seen
consumers do with their automobiles; hold onto them longer and wring every bit of use
out of them they can.
Price Pressure
Hardgoods retailers, especially electronics and media/audio/video retailers, face fierce
competition from both inside and outside the segment, most notably from the likes of
Walmart and Target. Granted, the competition in this area is not yet to the same extent
as that experienced by the toy or grocery industries. That said, Target and Walmart are
both continuing to enhance their home furnishings and housewares options.
Additionally, Walmart has put a significant emphasis on consumer electronics, and any
recent visitor to Target can attest to an apparently wider array of electronics there as
well. Hardgoods retailers will readily admit that those who once shopped regularly at
the mall and specialty stores are now buying home goods and electronics at the same
time they are purchasing toys, food and clothing. This is helping to drive the expected
price that shoppers are willing to pay. Certainly, there will always be a luxury segment
that is not sensitive to price, but generally there are downward pricing pressures on all
of the retailers in this segment caused in large part to the increasing quality and
branding of discounters.
Rising Labor Costs
Labor costs, primarily driven by increases in employee benefits, are rising at a much
faster rate than revenue and gross margin. Given the resulting significant wage pressure
(for labor costs to remain stable with rising benefits costs, wages must decline), the
retailer is driven to make hard decisions: “Do I cut benefits?”, “Do I suspend raises?”,
“Do I reduce employees and cut service, potentially alienating customers?”, or “Do I try
to trim out waste from the operation to maintain margin, or use some other technique?”
Obviously, labor is needed to keep the operation going, but more importantly to create
that human relationship and interaction that so many customers desire. It is necessary to
create a positive shopping experience whereby the customer wants to return. Given the
growing number of shopping alternatives, any negative experience can quickly lead to
lost customers.

Retail Point-of-Sale Systems in North America
Union vs. Non-Union Labor
According to June 2010 data from the Bureau of Labor Statistics, there is a significant
disparity between average salaries of union versus non-union employees. For 2009,
union members had median hourly earnings (salary) of $22.90 (down $2.57 from 2008),
compared with a median of $19.21 (up $0.15 from 2008) for workers who were not
represented by unions1. This trend can be carried further when reviewing benefits. By
those same statistics when looking at total compensation (including paid leave,
supplemental pay, insurance, retirement, etc.) the difference is even more striking at the
numbers jump to $37.16 for union, and $26.67 for non-union, a difference of 39%. It is
noteworthy that while hourly wages for union members decreased, total compensation
increased. The retirement and health benefits that unions provide are continuing to cost
companies more and more money, while take home pay for those union members is
declining. As the cost of benefits continues to add to the total cost of labor, there is a
disparity in the benefits enjoyed by the non-unionized population. For the retailer, the
obvious preference is to minimize the costs of labor and use non-unionized employees.
Comparison of union versus non-union can be viewed across market segments,
highlighting the obvious conclusion that the playing field is not level if you have a
unionized workforce competing against retailers who are non-unionized. When you are
the largest retailer, like Walmart, it is quite easy to understand why you do not want a
unionized workforce.
Figure 1 – Union vs Non-Union Benefit Comparison
Lack of Available Workforce
Tied closely to rising labor costs is the fact that at the retail level in North America we
are facing a labor crisis in many regions. Although there are opportunities to grow the
number of stores and outlets due to consumer purchases, the number of people available
to staff these positions from legal US and Canadian citizens is very finite. Even in the
highly-charged immigration atmosphere of the last three years there have been plenty of
1 http://www.bls.gov/news.release/ecec.t05.htm
2 http://www.bls.gov/news.release/pdf/ebs2.pdf
3 This is for single coverage, not family coverage

Retail Point-of-Sale Systems in North America
positions available at the retail stores in nearly every region. General population
changes have led to these challenges, as couples are generally choosing smaller families.
This lack of available workforce limits the speed and effectiveness of a retailer’s growth
plans. .
Lack of Workforce Loyalty
Tied to the lack of available workforce is also a lack of loyalty to the retailer. Although in
some European countries it is common to have store level personnel (non-management)
stay with the same retailer for years, this has become a rarity in the North American
retail market. Turnover in some segments among front-end employees now approaches
200-300% a year. It is very common for these employees to simply work until something
happens in the workplace that they don’t like and they simply go across the mall or
across the street. The plentiful options make it very difficult for retailers to retain
workers, particularly at the store level. The generation entering the workforce today has
never known an environment where employees work for a company for life. The
concept of a pension has never been a part of their nomenclature. As such, the career
option of starting low and working your way up in an organization is simply not
something they consider. Retailers really have their work cut out for them in trying to
recruit, motivate and maintain employees as they grow. The selection of POS software
(with easy-to-use interfaces, training modules, etc) then becomes a critical component of
the retailer’s success.
Customer Loyalty/Wallet Share is King
Hardgoods retailers are now becoming some of the most innovative of all retailers in the
use of CRM/Loyalty systems. They realize that profitable growth is more a factor of
getting a larger share of their existing customers’ wallets than necessarily getting more
customers. Not only is the cost of acquisition for these additional margin dollars far less,
but the rewards in loyalty are much greater.
A key component of the customer loyalty/wallet share is the ability of customers to
purchase from the retailer through multiple channels. Studies are now being released
that show that customers that buy through more than one shopping channel will spend
on average 40-100% more per year than customers that only shop through one channel.
The more retailers can integrate catalogue and web operations to their stores the higher
margins they can achieve.
Terrorism Concerns
Surprisingly tied to the Customer Loyalty issue is fear of a terrorist attack on a shopping
mall. We often challenge retailers with the following questions: Do you know your top
10-20% of your customers by name? If the mall was shut down, do you have a way to

Retail Point-of-Sale Systems in North America
reach your customers? Do they have a way of reaching you and buying from you?
Many retailers have not thought through this scenario but it is a very real risk to their
business.
ROI and POS Software
In days of old, the purchase of POS software was viewed differently than today. Much
like the POS unit, POS software was a business necessity or a cost of doing business just
like the building or the lighting may be viewed. With advancements in technology,
hardware interconnectivity and enterprise software, the purchase of POS software can
be viewed through an ROI perspective. Due to the high employee turnover that we have
outlined, training is a significant aspect. Issues such as average training time and the
availability of a training mode impact the ROI calculation. Additional considerations
such as the speed of calculation, and enhanced functionality (such as the processing of
gift cards, employee scheduling, email, cross channel integration, speed of changes,
architecture, employee communication, voids, return processing, and loss prevention
integration, to name a few) impact the payback time for the investment. A general
business requirement for capital purchases suggests payback should be achieved in 3
years, though the current economic conditions and feedback from the vendor
community suggest this number is getting smaller. The leading vendors will generally
be able to achieve ROI in 3 years or less.

Retail Point-of-Sale Systems in North America
STORE SYSTEM TRENDS
Store System Priorities
Each year, IHL Group partners with RIS News to publish the Store Systems Study. This is
typically published in January of each year to coincide with NRF. With this year’s study
we queried our respondents to determine where store level software spending would be
targeted over the coming year. We have asked this question before, and this year’s study
saw a new leader as Advanced CRM/Loyalty (displacing PCI) was cited by 67% of
respondents identifying it as a priority.
Figure 2 – 2010 Top Store System Priorities
The fact that PCI Compliance continues to show a significant number of respondents,
since most every retailer in the survey was already supposed to be PCI compliant, shows
that a significant share of the budget and focus will remain on PCI for quite some time.
A big reason for this is that PCI compliance is a moving target. Standards and best
practices are changing all the time, and it seems that a month doesn’t go by without us
hearing about a new and ingenious way the bad guys have broken into a retailer’s
systems. What makes the entire exercise even more troubling for retailers is that we have
heard reports of retailers that were certified PCI compliant yet were still compromised.
This is a bit disheartening as PCI on its own is inadequate for overall security, and the
heavy focus here precludes spending on more innovative technologies that can make the
retailer both more secure and more efficient.
Providing associates with better tools as a key priority brings up an important
observation that should not go without comment. The retail IT community clearly
recognizes that a successful store experience goes beyond having great tools. There is a
critical relationship between the tools themselves and the ability for them to be both
accessed and utilized properly. Databases full of information can be great, but they are
absolutely useless without the correct insight into how to make the information
contained within them actionable.

Retail Point-of-Sale Systems in North America
Software Leads Hardware
A few years ago we could argue that the POS hardware decision typically determined
the software that was going to be deployed in a retailer. This is no longer true. Today
our research indicates that in over 80% of the cases for new POS installations (where
hardware and software are purchased at the same time), it is the software decision that
is made first which then determines the hardware choice. As vendors have moved to
open standards, this trend to a software first choice has further accelerated.
Key POS Functions Under Consideration
Figure 3 – POS Functions for the Next POS Upgrade
When we look at specific POS functions it is not hard to imagine there being a great deal
of variability in what is important compared to other retail formats. Hardgoods retailers
stick pretty close to the Overall averages with a few notable exceptions. Both
Returns/Returns Management and Training are significantly higher in terms of desired
functionality than the Overall response rate.
POS Standards
OPOS and UPOS are the primary standards for POS interfaces. OPOS is a standard for
DOS and Windows-based POS devices, and UPOS incorporates OPOS as well as the
recently-introduced JPOS drivers for web-based POS devices. Most vendors will be
writing to UPOS for the future. These standards are becoming increasingly important as
retailers begin to look at cross channel retailing.
ARTS Standards
ARTS XML – This is the new name for IXRetail, and is a development process
that uses XML (Extensive Markup Language) to help identify standard data
types in the retail transaction so that this data can be utilized more effectively

Retail Point-of-Sale Systems in North America
throughout the enterprise. The benefit of XML is that it allows for data points to
be given tags or identifiers that allow other systems to recognize what type of
data this is so it can add it to executive information systems, search engines, and
data warehouses. ARTS has released nineteen different schemata, as follows:
CSE (Shopping Data Feeds) – This enables online retailers, comparative
shopping engines and third party service providers to communicate and
confirm product information and advertising performance metrics.
Customer V2.0 – Provides for a way to manipulate customer data
information.
Digital Receipt – Provides for a standard way of archiving and managing
a customer’s receipt in digital format rather than through a paper copy.
This allows the opportunity for a customer to receive their receipt
digitally at the POS, for a customer to recall a receipt they need for return,
or for credit card companies to investigate in chargeback situations. The
digital format will greatly reduce the cost and enhance the usability of
receipt data.
Fresh Item Management – Standard support for traceability of perishable
items.
Inventory – Provides for a way to support transactions between systems
that query, reserve and record real time store level units and financial
value of inventory.
ItemMaintenance – This provides a framework for dealing with item
attributes across the enterprise and across retail segments.
Notification Event Architecture for Retail (NEAR) – This schema defines a
framework for sending and receiving XML formatted asynchronous
notification event messages.
POSlog V2.2 – Once designated TLOG, this defines the set of all possible
transactions and events that can be sent by a POS system to another
system within the retail enterprise.
POSLog for Food Services – Provides a set of consistent data messaging
standards that enables POS data to easily flow to back-end financial
systems for better sales reporting and inventory management.
Price V2.0 – Allows for pricing data to be uniform across platforms within
the retailer’s systems or even retailers in a wide area network.
ProCon Converter – Provides standards to turn data from foodservice
equipment into actionable information for use by applications within the
foodservice environment.
Product Content Management (PCM) – Provides standards to enable
authoring, locating, acquiring, managing, sharing and publishing product
content.
REMC – Short for Remote Equipment Monitoring and Control, REMC
provides retailers with a standardized set of messages that allow

Retail Point-of-Sale Systems in North America
equipment from different suppliers to be monitored, managed and
integrated into existing information and control systems.
Retail Transaction Interface – Standard which allows existing POS sales
functions to be used by other customer service solutions such as self
checkout, fueling points, kiosks, line buster and others.
StoredValue – This describes a closed financial system where value is
collected by a retailer from a customer, retained as a liability by the
retailer, and redeemed by the customer for goods or services.
TimePunch – Provides standards for time and attendance data.
Transaction Tax – Provides a new standard that will link information
from transaction tax providers to a retailer’s POS system.
Video Analytics – Standardize how computers describe surveillance
video for image analysis for loss prevention purposes.
WorkerManagement – This describes the schema for store-based
workforce related data; labor scheduling, time and attendance, task
management and labor demand forecasting.
Standard RFP – Currently, ARTS has standard RFP’s for Business Intelligence,
Loss Prevention Exception Reporting, Master Data Management, POS, Price
Optimization, Signature Capture, Warehouse Management and WFM.
We believe these standards represent great enhancements to retail technology and will
greatly lower operating and development costs for vendors and retailers alike. Also,
since Microsoft’s release of Office 2003 with XML authoring ability, we believe the
technology and people who can use it will greatly increase moving forward.
PCI DSS Compliance
In last year’s report, we detailed the origin of the Payment Card Industry (PCI) Security
Standards Council and the creation of the Payment Card Industry Data Security
Standard (DSS), which was issued in December 2004. We addressed the compliance due
dates, data breaches, and some of the ancillary details of the effort. Since that time, as
part of our various research efforts, we took the opportunity to survey retailers
concerning their participation in PCI. Our most recent data show that approximately
60% of retailers are currently fully compliant with PCI/DSS. That said, PCI/DSS
compliance has served as a major disrupter in the area of IT spend. Billions of dollars
have already been spent to ostensibly ensure security, yet retailers are still spending
months and years after their deadlines have passed. The fact that there are documented
breaches where the retailers in question were certified as being “PCI compliant” serves
to confirm the words of Dave Hogan (SVP and CIO for NRF), who said “it may be that
the PCI mandate will never be an effective deterrent to professional hackers.”

Retail Point-of-Sale Systems in North America
This disruption in IT spend has other effects. Just as with Y2K, retailers have and will
continue to look to vendors to incorporate features in their POS to ease the compliance
issues, though this will tend to be on the software side. This will hopefully lead to
innovation at the POS. At the same time, retail IT departments have been and will
continue to be overtaxed in terms of time and budget to reach the mandatory
compliance levels and dates. This will result in the delay of certain IT projects, many of
which were delayed as a result of Y2K and SOX. Long story short, PCI/DSS may be
declining in priority among some retailers, but it’s not going away anytime soon.
Browser-Based Design
One of the most significant trends to develop in recent years has been the emergence of
browser-based design for POS applications. Using Java and designing the application to
operate through a web-page, software providers have developed solutions that have
much greater cross-platform functionality than in years past. It is has also provided
retailers with some fundamental options as to where the applications should be hosted.
Multi-Channel Shopping
Specialty Hardgoods retailers face competition from all sides. From discounters and
department stores adding inventory that encroaches on their stores to online merchants
that directly compete with cut-rate prices, they understand completely that those
consumers they can get to shop online or through a catalogue in addition to the stores
will spend on average 40-100% more than a customer who only shops at the store. This
knowledge is driving retailers to demand integration of their POS applications with
their websites for returns and order lookup. Additionally, they are demanding
functionality to allow cashiers to tap into the online store to have items shipped to a
customer that are out of stock at the store level. All of these desires are driving changes
in the architecture and design of POS software.
Out of Stocks
When consumers are routinely asked about things that bug them most about shopping,
the number one item on the list is standing in line. The second highest item is frustration
caused by not being able to purchase a product the store is expected to have or has
promoted in an advertisement.
Based on research released in the 2008 IHL/RIS News Store Systems Study, data suggests
that many retailers are in denial about the extent of this problem and the impact it has
on the consumer’s experience. For the most part, retailers judge out of stocks through
the eyes of paid personnel and reports from inventory systems. It is commonly believed

Retail Point-of-Sale Systems in North America
the typical retailer will be out of stock on about 8% of items. For promotional items,
research suggests the rate is 15%. That’s the accepted view in retailing.
A recent study by the Wharton School of Business found that among consumers
researched for a single chain, the perceived out-of-stock rate by shoppers was closer to
24%! What the study discovered is that customers count something as being out of stock
for a variety of reasons. Retailers, on the other hand, only look at low counts in the
inventory system or at an empty shelf. The discrepancy arises because customers
include such factors as not being able to find someone in the store to help them locate an
item, or failing to get assistance in getting the item from a locked compartment or high
shelf.
To dig deeper into this problem, we asked retail executives about their own shopping
experiences and to quantify the average item price and total transaction sizes at their
own chains. We used this data to get industry averages for each retail segment. Finally,
we weighted the data against overall retail sales in the United States and Canada to
quantify the entire effect.
It is important to note that lost sales for out of stocks are not lost to the industry as a
whole (although it’s possible a portion may be lost if the consumer never buys the item).
Typically, lost sales move from one retailer to another that has the product in-stock.
Therefore, the intent is to show, in tangible metrics, the cost retailers pay for out-of-stock
inefficiency so they can understand and attack it with hard data.
Figure 4 – Blame for Out of Stocks

Retail Point-of-Sale Systems in North America
While the following numbers may pop off the page, the real numbers are likely to be 1.5
to 2 times higher than the figures mentioned here. We can say this for two reasons. First,
this was a survey of retail executives. Most retail executives shop less at stores outside
their own chain than the typical consumer because they spend so much time at their
jobs. And second, we asked about how many shopping trips were made in September
and early October. This was not a survey done during the busy Christmas season when
the percentage of shopping trips with perceived out of stocks is typically double or triple
the non-holiday season level.
Figure 5 – Increase in SSS if Out of Stock Problem is Fixed
That said, the out of stock problem is very real and very large in retailing. In fact, the
actual loss of sales to competitors during the year measures approximately $93 billion
when extrapolated from annual retail sales!
We also asked respondents to apportion the blame for out of stocks in their own chains.
We then matched this data against the retail sales for that segment to quantify actual
cost figures. We found there is plenty of blame to go around. Inadequate Planning by
Buyers was listed as the largest cause for inefficiency, with 17.6% getting the blame. This
amounts to an annual cost of $16.4 billion. Store Execution problems shared nearly equal
blame at 17.5% and amounting to a $16.2 billion loss. Suppliers are next and responsible
for 13.8% of the problem or $12.9 billion in lost sales. Poor forecasting came next at
13.1%, costing retailers $12.2 billion annually.
Retail Point-of-Sale Systems in North America
Embedded Operating Systems – Thin Clients
We have watched the embedded operating systems trend over the past handful of years,
with the introduction of Windows CE (1997), Embedded Linux (1998), Embedded NT
(1999), Windows XPe (2001) and then WEPOS (2005). Target is still the single largest
retailer using embedded systems with XPe, but others that have moved in this direction
include Radio Shack (with 21,000 XPe terminals) and Speedway SuperAmerica (3,500
XPe). WEPOS, Microsoft’s first ever vertical-specific OS, appears to be gaining traction,
with rollouts at Hollywood Video (15,000 POS), Brown Shoe (2,600) and Best Buy
(2,000). We believe WEPOS acceptance would have been greater, but XPe is priced at $10
less per POS, causing many retailers to embrace XPe instead.
Rather than using a disk drive to boot, the otherwise fully-complete PC system boots
from a ROM-based operating system. A key feature of the more recent embedded
operating systems is the ability to separate out components so a retailer can pick and
choose which parts to use for their situation. Regardless of the flavor, embedded
operating systems eliminate the need for persistent storage such as a hard drive, which
not only drives down the initial cost of the POS, it also eliminates one of the most
significant maintenance issues. As long as the operating systems can be upgraded
remotely we see this as a trend that will continue to grow in acceptance among vendors
and retailers, particularly as retailers further accept thin-client computing.
Future POS Client Operating Systems
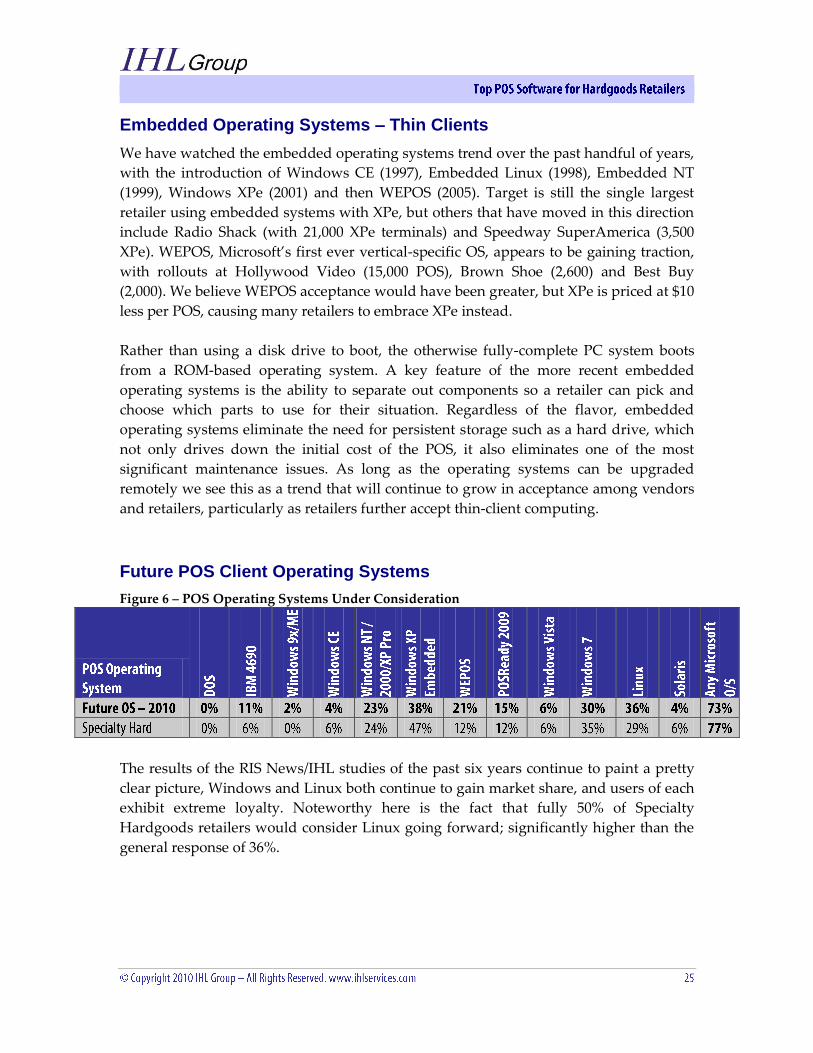
Figure 6 – POS Operating Systems Under Consideration
The results of the RIS News/IHL studies of the past six years continue to paint a pretty
clear picture, Windows and Linux both continue to gain market share, and users of each
exhibit extreme loyalty. Noteworthy here is the fact that fully 50% of Specialty
Hardgoods retailers would consider Linux going forward; significantly higher than the
general response of 36%.

Retail Point-of-Sale Systems in North America
What about 2010 and Beyond?
What does the future hold? Retailers will continue to adapt to a more widely diverse
workforce; more diverse in culture, education and expectations. Immigration will ensure
more and more of the world’s culture is represented in retail as well. And retail workers
will continue to have differing expectations about where they work (type of retailer,
mall location, etc), when they work (shift choice, flexible hours, etc) and why they work
(benefits, potential for advancement, etc). In retail today, those retailers that succeed are
those that are most adaptable to change. Technology is a big part of that equation, but it
is not the only part. Labor will continue to be a major part of the cost structure.
From the RIS News/IHL Group Store Systems Study published in January 2010, we also
looked at purchase decisions as they relate to the POS client and software. Specialty
Hardgoods retailers tend to refresh their POS systems at a rate comparable to other retail
verticals. Replacement of once every 5 years is a good metric to use equating to a yearly
rate of 20%. When comparing the normal yearly rate of 20% to the respondent rate of
35%, we suggest the survey results yielded a much higher than actual rate, especially
given the current slow and uncertain pace of economic recovery. When actual
replacement rates are factored in, which is what differentiates survey responses to actual
purchases, the reality is that the market will probably not see 20%. The key take away
from this chart is that while Specialty Hardgoods retailers will not be replacing their
software at a blistering pace, they are expected to be doing so at an above average rate.
Figure 7 – POS Software Purchase Intention
Figure 8 – POS Client Base System Purchase Intention
With regards to anticipated purchases of POS client hardware and software, the
predominant trend is that hardware and software be replaced at the same time. As you
compare the responses for software and hardware they are close as we would anticipate.
Retail Point-of-Sale Systems in North America
Of course one must also consider the actual percentage of these that are funded and the
actual chance of any appropriated funding being spent
Shameless Plug
Making the decision for a wholesale replacement of a retailer’s POS can actually be
pretty simple; bringing that decision to fruition is another matter entirely. Typically,
enough time has elapsed since the last POS replacement that the team responsible for
crafting the requirements, selecting the respondents, issuing the RFP and grading the
responses simply is not around anymore; they have been promoted, transferred or have
moved on. Not only is the original team missing, so too are any records of the
undocumented features that have crept into the current system that need to be included
in any new system. The lack of personnel and documentation combines to force retailers
to re-invent the wheel when they seek to replace their POS. To solve this problem, IHL
and C-Core Consulting offer the RAPID POS Project Toolkit. RAPID POS is a
methodology to facilitate POS hardware and/or software replacement for retailers. It
consists of templates and tools for RAPID scope definition of a project, development of
an RFP, vendor selection and project execution, resulting in a typical 12 week reduction
in the RFP process while ensuring all functional requirements and vendor selection
occurs via a comprehensive and thorough process.
Retail Point-of-Sale Systems in North America
THE TOP 5 SUPPLIERS
As we discussed in the section on Methodology, we looked at the top 250 Hardgoods
retailers in terms of the POS software vendors they were using in their stores. We then
ranked each of the vendors according to three criteria, and combined these rankings to
arrive at a final rank order for the POS Vendors. Again, those three criteria were the total
number of vendor accounts, the total number of POS licenses, and the total retail
revenue represented by the vendor accounts. Each of these is addressed individually in
the following sections.
Vendor Accounts
The first of the three criteria that we want to address is the number of accounts that each
vendor has in the top 250. Querying our database, we obtained this information, which
is summarized in the figure below.
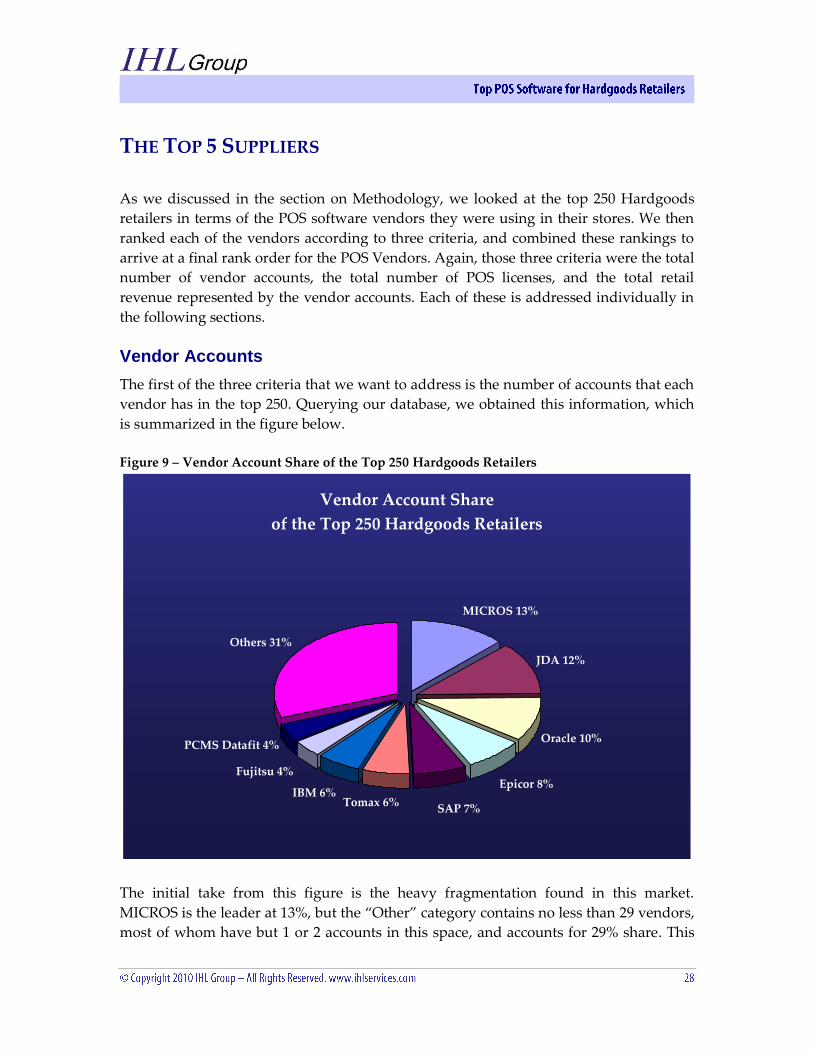
Figure 9 – Vendor Account Share of the Top 250 Hardgoods Retailers
Vendor Account Share
of the Top 250 Hardgoods Retailers
MICROS 13%
JDA 12%
Oracle 10%
Epicor 8%
Tomax 6%IBM 6%
Others 31%
Fujitsu 4%
PCMS Datafit 4%
SAP 7%
The initial take from this figure is the heavy fragmentation found in this market.
MICROS is the leader at 13%, but the “Other” category contains no less than 29 vendors,
most of whom have but 1 or 2 accounts in this space, and accounts for 29% share. This

Retail Point-of-Sale Systems in North America
chart becomes more interesting when we look at it in conjunction with the portion of the
Top 250 Hardgoods retailer’s sales represented by these particular vendors.
Estimated Number of POS Licenses
For this section, we once again queried our database to determine the number of
software licenses ascribed to each vendor among the leading 250 Specialty Hardgoods
retailers. As noted in the section describing the Report Methodology, this is but one of the
three criteria combined to complete our overall rankings. This should be duly noted
when comparing this market share plot to our overall rankings to help understand
differences in rankings.
Figure 10 – Vendor POS License Share of the Top 250 Hardgoods Retailers
Vendor License Share of the Top 250 Hardgoods Retailers
Oracle 21%
Fujitsu 15%
Activant 9%
JDA 8%
NCR 6%
MICROS 4%
Others 16%
Epicor 6%
SAP 7%
IBM 8%
While there are vendors with a significant presence in this space, one cannot help but
notice that “Other” vendors have 16% of the market share. For our analysis we defined
“Other” vendors as any vendor with 14,000 or fewer lanes among the top 250 retailers.
Our analysis showed there to be approximately 30 vendors in this grouping. By some
estimates there are well over 1,000 vendors that produce POS software designed for
various retail segments. The individual vendors cited in this report have clearly
distinguished themselves among a very crowded group.
Retail Point-of-Sale Systems in North America
The marriage of a retailer with a POS software vendor can easily last 12 years, and it is
not uncommon for this to last much longer. While it is impossible to predict who will be
able to develop a business strategy that is able to maintain or even grow their software
business, momentum breeds growth, and that tends to lead to even further success. In a
recent discussion with a specialty apparel retailer who is in the process of replacing both
their POS software and hardware, beyond functionality and platform considerations,
they specifically noted the importance of making a decision based on a vendor they
could be confident would be around to support them over the life of the product. To
highlight this point even further, they have been with their current supplier for over 14
years with the software requiring numerous upgrades over that period.
Retail Revenue Represented By Vendor Accounts
As we have seen in previous studies, some vendors focus only upon the top few dozen
accounts in a space, while the focus of other vendors may be well down the list. This
section addresses this issue, since we want to provide the highest degree of visibility to
where a vendor truly stands. Having dozens of accounts is not necessarily better or
worse than having just a handful.
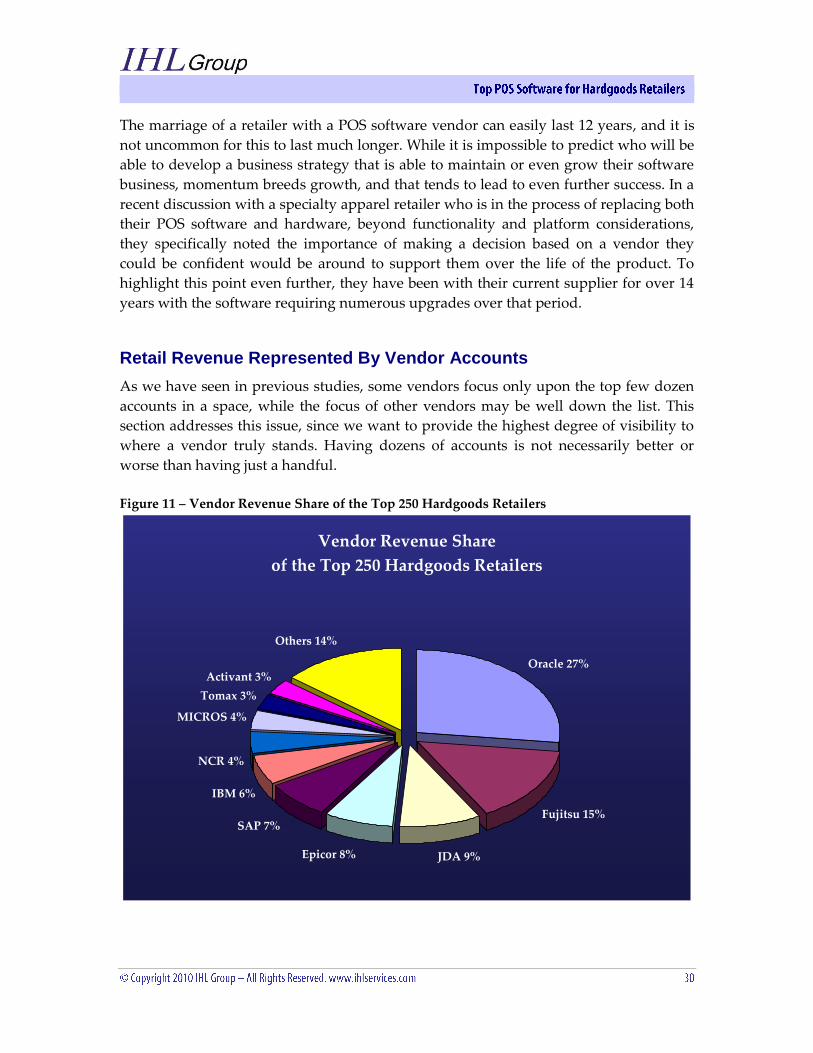
Figure 11 – Vendor Revenue Share of the Top 250 Hardgoods Retailers
Vendor Revenue Share
of the Top 250 Hardgoods Retailers
Oracle 27%
Fujitsu 15%
JDA 9%Epicor 8%
IBM 6%
NCR 4%
MICROS 4%
Tomax 3%
Activant 3%
Others 14%
SAP 7%
Retail Point-of-Sale Systems in North America
Note that Oracle currently represents the POS presence of 27% of the sales of the Top
250 Hardgoods retailers, yet they only claim 10% of the Top 250 as customers. By
contrast, MICROS claims 13% of the Top 250 as customers, yet represent only 4% of the
sales by this group. These figures could change drastically if, for instance, a company
like Microsoft were to acquire a company like JDA.
Ranking Determination
From the results of the previous three sections, we obtain the following table.
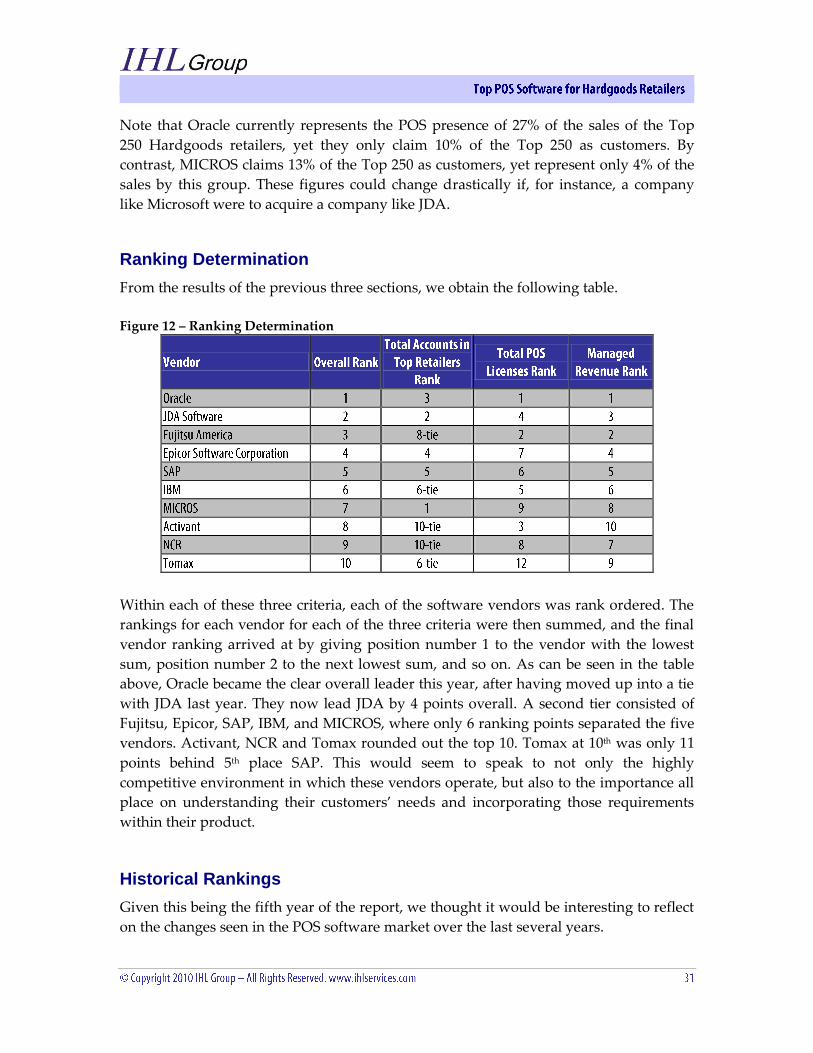
Figure 12 – Ranking Determination
Within each of these three criteria, each of the software vendors was rank ordered. The
rankings for each vendor for each of the three criteria were then summed, and the final
vendor ranking arrived at by giving position number 1 to the vendor with the lowest
sum, position number 2 to the next lowest sum, and so on. As can be seen in the table
above, Oracle became the clear overall leader this year, after having moved up into a tie
with JDA last year. They now lead JDA by 4 points overall. A second tier consisted of
Fujitsu, Epicor, SAP, IBM, and MICROS, where only 6 ranking points separated the five
vendors. Activant, NCR and Tomax rounded out the top 10. Tomax at 10th was only 11
points behind 5th place SAP. This would seem to speak to not only the highly
competitive environment in which these vendors operate, but also to the importance all
place on understanding their customers’ needs and incorporating those requirements
within their product.
Historical Rankings
Given this being the fifth year of the report, we thought it would be interesting to reflect
on the changes seen in the POS software market over the last several years.

Retail Point-of-Sale Systems in North America
Figure 13 – Historical Vendor Rankings
Historical Vendor Rank: POS SW for Hardgoods Retailers
1
2
3
4
5
6
7
8
9
10
2006 2007 2008 2009 2010
Oracle
JDA
Fujitsu
SAP
Epicor
MICROS
IBM
Activant
NCR
Tomax
Rank
The chart provides a clear depiction of how Oracle and JDA have separated themselves
from the pack. Epicor likewise has shown a significant jump from being ranked 10th in
2007 to be a consistent top 5 vendor. Noteworthy of course is the significant decrease
that IBM has seen over the last 5 years, from the number one position to having been
ranked 7th and 6th over the last 2 years respectively.
This is a summary of the complete report. The full report includes profiles on
each of the vendors including strengths, weaknesses, and a list of customers.
To purchase the complete report for $795, please go to the following link:
http://www.ihlservices.com/ihl/product_detail.cfm?page=StoreAutomation&Pr
oductID=10
Retail Point-of-Sale Systems in North America
POS Software for Softgoods Retailers - $795
POS Software for Hardgoods Retailers - $795
North American Retail POS Terminal Market Study - $2,995
Europe/Middle East/Africa POS Terminal Market Study - $2,995
Asia/Pacific POS Terminal Market Study - $2,995
Latin/South American POS Terminal Market Study - $2,995 Retail Self-Checkout Systems in North America - $1,995
North American Self-Service Kiosk Study - $995
North American POS Printer Report - $2,695
IT and the North American Supermarket - $1,495
Small/Medium POS Sizing - $4,000
What’s the Deal with Out-of-Stocks - $1,995
North America Hospitality POS Terminal Study - $1,695
RIS News/IHL Store Systems Study - $3,500
Going Mobile – Retailers and Consumers Embrace Mobility - $2,995
All pricing contained herein is valid as of the publication date and supersedes any pricing from previous price lists.
For details and free market summaries, please see our website or see below for more contact information.
Retail Technology Data Services Include:
Sophia is the most comprehensive review of retail technology in our industry, providing the
key performance, technology, and contact information on 7,200 Retailers, Restaurants, and
Manufacturers and 2.5 Million records. It is the only Subscription data service that takes an
enterprise view of the technology that retailers are deploying AND the performance that
they are achieving with the use of these technologies. For Details and a Free Report, visit our
website at www.ihlservices.com
Prepared by:
For Questions or Information:
Phone: +1 615.591.2955
http://www.ihlservices.com


