
A probabilistic model for the high cycle fatigue behaviour of
cast aluminium alloys subject to complex loads
Imade Koutiri, Daniel Bellett , , Franck Morel, Etienne Pessard
Arts et Métiers ParisTech, CER Angers, Laboratoire LAMPA, 2 Bd du Ronceray, 49035 Angers Cedex 1, France
Abstract
This article is dedicated to the high cycle fatigue behaviour of cast hypo-eutectic Al–Si alloys and in
particular the AlSi7Cu05Mg03 alloy. In a vast experimental campaign undertaken to investigate the
fatigue damage mechanisms operating in this alloy, subject to complex loading conditions, it was
shown that two different coexisting fatigue damage mechanisms occur in this materials, depending on
the presence of different microstructural heterogeneities (i.e. micro-shrinkage pores, Si particles, Fe-
rich intermetallic phases, DAS of the Al-matrix, etc.). In order to take into account both of these
damage mechanisms, a probabilistic approach using the weakest link concept is introduced to model
the competition between the two mechanisms. This approach leads naturally to a probabilistic
Kitagawa type diagram, which explains the relationship between the fatigue behaviour of the material
and the different casting processes or post-treatments (e.g. gravity casting and HIP).
It is shown that the sensitivity to the different loading modes (i.e. uniaxial with and without mean
stress, torsion and equibiaxial tension) depends on the microstructural heterogeneities responsible for
crack initiation. For a porosity-free alloy, the predictions are very good for combined tension–torsion
loading modes. When pores are present and control the fatigue strength, the predictions are very
satisfactory for the uniaxial loads with different R-ratios and slightly conservative for multiaxial loads
(i.e. torsion and equibiaxial tension). Never-the-less, they are much better than the predictions of the
Dang Van criterion [1].
Highlights
► High cycle fatigue modelling of AlSi7Cu05Mg03 for complex loading conditions. ► Modelling of two
coexisting fatigue damage mechanisms. ► A probabilistic approach is proposed to model the
competition between these mechanisms. ► The approach leads naturally to a probabilistic Kitagawa
type diagram.
Keywords
High cycle fatigue; AlSi7Cu05Mg03-T7; Multiaxial loads; Probabilistic model; Fatigue damage
mechanisms
hal-0
0821
800,
ver
sion
1 -

1. Introduction
The fatigue design of mechanical components subjected to complex loading conditions, including high
mean stress and a high degree of stress triaxiality (or a high hydrostatic stress), is still the subject of
much scientific debate. Most often, the fatigue damage mechanisms as well as the fatigue strength are
completely unknown for such complex loading conditions. Moreover, existing fatigue models have
difficulties predicting the mechanical response under these loading conditions and the fatigue data
necessary to identify the criterion parameters are practically non-existent.
An example of this type of problem is the fatigue design of cast aluminium diesel engine cylinder
heads used in the automotive industry. These gravity sand cast components have a very complicated
geometry but are essential to the correct operation of the engine. The combination of the
manufacturing process, the assembly loads and the in-service conditions result in fatigue critical zones
that are characterised by a cyclic stress state with a high degree of biaxiality and very high mean
stresses. The object of this work is to develop an appropriate high cycle fatigue criterion for this
application.
It has been demonstrated [2] and [3] that the degree of microstructural heterogeneity of metallic
materials is directly responsible for the sensitivity of the material to the loading mode and path in high
cycle fatigue. In other words, good knowledge of the microstructure is crucial to establishing reliable
fatigue strength predictions under complex loading conditions. For the cast aluminium material
investigated here (AlSi7Cu05Mg03) this is a crucial point. The microstructural heterogeneities present
in this type of material include: micro-shrinkage porosity, gas porosity, oxides, intermetallic phases,
eutectic silicon particles and intermetallic phases. Furthermore, the casting process used to fabricate
the components has a very strong influence on the type of heterogeneities present.
Much research has been reported in the scientific literature concerning the fatigue behaviour of cast
aluminium–silicon alloys [4], [5], [6], [7], [8], [9], [10], [11], [12], [13], [14], [15], [16], [17] and [18]. This
body of work is generally related to uniaxial loads at low R-ratios (i.e. R = −1 or 0.1). This research
makes it clear that the different microstructural heterogeneities present in the material have a
detrimental effect on the average fatigue life and increase the scatter in the fatigue data. Also, it can
be noted that different fatigue damage mechanism occur in these materials depending on which
microstuctural heterogeneities are present.
It is generally accepted that when micro-shrinkage pores are present they play a fundamental role in
controlling the fatigue behaviour. Their size, position, distribution, etc., have a large impact on the
fatigue resistance of the material. This relationship between the fatigue behaviour and the degree of
porosity present in the microstructure has been well documented in the literature [14] and [15].
However, when specific casting processes or post-casting treatments, such as HIP (Hot Isostatic
Pressing), are used to obtain a microstructure in which the porosity is practically eliminated, crack
initiation occurs at other microstructural heterogeneities, such as oxide inclusions, eutectic silicon
particles and intermetallic phases [4], [9],[10] and [11].
hal-0
0821
800,
ver
sion
1 -

In the experimental part of this work,1 numerous fatigue damage observations have been undertaken
using specimens extracted from gravity sand cast cylinder heads produced by the French automotive
manufacturer PSA (Peugeot–Citroën). These observations show that the fatigue crack, resulting in
final failure of the specimens, almost always initiates at micro-shrinkage pores. However, it is very
important to note, that in the same specimens, micro-cracks are also observed to initiate at silicon
particles in the eutectic zones or at intermetallic phases. For the material and loading conditions in
question, this type of damage is not generally responsible for the final failure of the specimen, but it
does co-exist with the damage that occurs at the shrinkage pores.
As part of the experimental campaign, various cyclic loading conditions were investigated (i.e. uniaxial
loads with different mean values, torsional loads, and a loading condition resulting in an equibiaxial
stress state). The experimentally determined fatigue strengths at 2 × 10⁶ cycles, are summarised
in Table 1. It was also shown, that the damage mechanisms occurring in plane bending and
equibiaxial tension are very similar, except there is no preferential crack growth direction in the latter
case. It has also been demonstrated that although the elastic shakedown concept is valid at the
macroscopic scale, Dang Van type criteria [1],[19] and [20] are unable to explain the experimentally
observed tendencies for the different loading conditions applied to this cast aluminium alloy.
Table 1. Experimental values for the fatigue strength of the AlSi7Cu05Mg03 cast aluminium alloys at
2 × 10⁶ cycles for different loading conditions.
σmean (MPa) σamp (MPa) Load ratio Standard deviation (MPa)
Plane bending
0 83 −1 18
77 63 0.1 –
196 45 0.62 –
251 15 0.88 –
284 12 0.92 –
Uniaxial tension
83 51 0.25 –
172 26 0.73 –
Torsion
τmean (MPa) τamp (MPa) Load ratio Standard deviation (MPa)
0 92 −1 14
Axisymmetrical bending σ11(t) = σ22(t)
σ11,mean = σ22,mean (MPa) σ11,amp = σ11,amp (MPa) Load ratio Standard deviation (MPa)
77 63 0.1 –
From a high cycle fatigue modelling point of view, many approaches have been proposed in the
literature to take into account the fatigue behaviour of cast aluminium alloys. A review of the relevant
literature leads to the following conclusions:
• When present, shrinkage pores and their size distribution are generally considered to be the
principal factors influencing the fatigue behaviour. High cycle fatigue models proposed to predict
the fatigue behaviour of cast aluminium alloys are very often based on fracture mechanics
hal-0
0821
800,
ver
sion
1 -

concepts, whereby these defects are treated as being equivalent to cracks with an initial
length [13], [15] and [16].
• Effective stress intensity factors, ΔKeff are often used to take into account the means stress
effect, via the phenomenon of crack closure. For the material investigated here, the value of the
effective stress intensity threshold cited in the literature is between 0.6
and [13], [15], [16] and [17].
• For alloys elaborated using a HIP process (in which the porosity is practically eliminated) certain
authors consider that the fatigue damage process is controlled by localised cyclic plasticity
occurring due to other microstructural heterogeneities (i.e. silicon particles in the eutectic zones,
intermetallic phases or oxides) [6], [4] and [5]. The concept of elastic shakedown at the
mesoscopic scale is then sometimes used to evaluate the fatigue life, as per certain multiaxial
fatigue criteria like the Dang Van[1], [19] and [20], Papadopoulos [21] or the Huyen and
Morel [2] and [3] criteria.
• The total fatigue life is often divided into at least two parts, the first is associated with crack
initiation and the second is due to crack propagation. Special considerations for the propagation
of short cracks are also often included in the criteria [5] and [18].
There are however certain aspects that have had very little attention from the scientific community.
The most notable is the fact that most criteria proposed in the literature are typically only based on
uniaxial loading conditions. Multiaxial loads, such as torsional loads, combined tension/torsion and
biaxial tensile loads are rarely discussed.
In the following a new fatigue model is proposed using a probabilistic framework which is able to take
into account the two experimentally observed co-existing fatigue damage mechanisms. It is shown that
this criterion is able to take into account certain effects, in particular those due to the loading mode
and the mean stress.
2. A new probabilistic high cycle multiaxial fatigue model for cast
aluminium alloys
2.1. Modelling strategy to account for the effects of different microstructural
heterogeneities
The adopted modelling approach was first proposed by Pessard et al. [22] to reflect experimental
observations highlighting a state of competition between two very different fatigue crack initiation
mechanisms in a bainitic steel [22], [23] and [24]. These authors showed that fatigue anisotropy could
be explained by a change in the fatigue damage mechanism. They observed that when the fibering
direction of the hot rolled material was parallel with the loading axis, fatigue crack initiation occurred in
the bainitic material matrix on planes of maximum shear stress. That is, cracks were initiated via
hal-0
0821
800,
ver
sion
1 -

localised plasticity occurring at the mesoscopic scale. This first mechanism, was modelled by a two-
scale mulitaxial fatigue model, used to estimate the elastic shakedown state at the mesoscopic scale.
These authors also observed a second damage mechanism, which became more active when the
specimen fibering direction was orientated perpendicular to the loading axis. In this case, fatigue
cracks initiated at clusters of elongated MnS inclusions. This second mechanism was modelled using
linear elastic fracture mechanics concepts, in which these pre-existing microstructural heterogeneities
were considered to be pre-existing cracks.
From the probability of failure in the material matrix, referred to as PF1, and the probability of a crack
propagating from elongated MnS inclusion clusters, referred to as PF2, the weakest link hypothesis is
used to obtain the overall probability of survival of the component:
(1) 1-PF=(1-PF1)(1-PF2)
In the following this approach is applied to cast aluminium alloys in which two distinct fatigue damage
mechanisms have also been observed. The Huyen and Morel [2] and [3] criterion is used to estimate
the probability of crack initiation in the material matrix. That is, crack initiation due to localised plasticity
typically occurring in the eutectic zone of the material at either silicon particles or intermetallic phases.
A linear elastic fracture mechanics approach is then used to estimate the probability of failure from the
shrinkage pores.
The first term (1 − PF1) of Eq. (1) is used to reflect the effects of micro-plasticity for the case where the
material is defect free. The second term (1 − PF2) takes into account influence of the porosity on the
fatigue behaviour. Eq. (1) is therefore capable of simultaneously take into account the effect of the
microstructure and the loading mode.
2.2. Multiaxial fatigue behaviour of porosity-free cast aluminium alloys
2.2.1. Experimental behaviour under different loading modes
The aluminium alloy AlSi7Cu05Mg03 investigated in the experimental part of this work (See
Footnote 1), was gravity sand cast. For this combination of material and forming process the porosity
has a large influence on the fatigue behaviour.
In order to establish a multiaxial fatigue model, capable of reflecting the crack initiation mechanisms
that occur in an alloy without porosity, fatigue data from the literature is used. Data for tensile and
combined tension/torsion loading modes, of the A356-T6 alloy are taken from the work of Fan et
al. [6]. The material studied by these authors was subject to a HIP treatment and by consequence
contains a very low porosity volume fraction (<0.01%). To compare the fatigue results obtained for a
load ratio of R = −1, the von Mises effective strain amplitude, defined by Eq. (2), was used by the
authors.
(2)
hal-0
0821
800,
ver
sion
1 -

where Δε and Δγ are the axial strain range and the engineering shear strain range in an axial–torsional
test of a thin-walled tubular specimen.
Fully reversed torsion tests, fully reversed uniaxial tests, and combined tension–torsion tests were
done for different strain levels . The authors highlight the low
scatter in the results, due to the low level of porosity, thanks to the HIP treatment. For high effective
strain amplitudes, a difference between the three loading modes was noted. This is not the case for
low strain amplitudes, for which only a small difference is observed. In order to facilitate its use in the
proposed probabilistic multiaxial fatigue model, this data [6] has been transformed to stress-life values
using the typical linear elastic constitutive equation, for the three loading modes.
For a fatigue life of 2 × 10⁶ cycles, the fully reversed tensile and torsional fatigue strengths are
approximatelys−1 = 112 MPa and t−1 = 75 MPa. For the fully reversed combined tension–torsion loading
mode the fatigue strength is given by s−1 = 76 MPa and t−1 = 53 MPa.
With respect to the uniaxial tensile fatigue strength and the experimental data reported in Table 1,
these results from the literature are logical, as the presence of porosity has a detrimental effect. The
fatigue strength is 112 MPa for the HIP treated material [6] and 83 MPa for the sand cast material.
However, a surprising result concerns the ratio of the uniaxial tensile (or plane bending) fatigue limit to
the torsional fatigue limit. For the sand cast alloy extracted from the cylinder heads, the plane bending
fatigue strength and the torsional fatigue strength are very similar. This is in contrast to the alloy
treated using the HIP process [6], for which a greater difference between these two fatigue limits is
observed. Table 2summarises this data. It can be seen that the ratio of the torsional fatigue strength t−
1 to the plane bendingf−1 (or tensile s−1) fatigue strength goes from 1.1 to 0.71 if the porosity is
eliminated from the material. The latter is typical of the ratio often observed for steels.
Table 2. Experimental values for the fatigue strength of the cast aluminium alloys.
Fatigue strength at
2 × 10⁶cycles (R = −1)
Plane bending or traction-
compressions−1 or f−1 (MPa)
Fully reversed
torsiont−1 (MPa)
Fatigue strength
ratio
AlSi7Cu05Mg03-T7 83 92 1.1
Sand cast (PSA)
A356-T6 (HIP treatment) 112 75 0.7
[6]
The comparison shown in Table 2 clearly highlights that the porosity has much greater influence on
uniaxial loads than on torsional loading modes.
2.2.2. Crack initiation modelling
The preceding discussion highlights the fact that a HIP treatment results in fatigue crack initiation that
generally occur at either the silicon particles in the eutectic zones or at intermetallic phases. Fig. 1a
shows an example of this type of fatigue damage and Fig. 1b schematically presents the important
features of the micro-plasticity approach used to model fatigue crack initiation in a porosity-free
material. As per the Huyen and Morel criterion [2] and [3] it is assumed here that the crack initiation
hal-0
0821
800,
ver
sion
1 -

zone can be modelled using an elastoplastic inclusion surrounded by an elastic matrix (see Fig. 1b).
This is very similar to the “micro-cell” model proposed by [4].
Fig. 1. (a) An SEM image showing fatigue damage in the material matrix and (b) a schematic illustration of the
micro-mechanical model.
In the model developed by Pessard and Morel [23], [24] and [22], it is assumed that when a condition
of plastic shakedown is achieved in one (or more) grains, fatigue failure is inevitable. To calculate the
global probability of failure of the structure, it is sufficient to sum the failure probabilities for each of the
grains contained in the loaded volume. By introducing a Weibull
distribution [25], [26], [27], [28] and [29] to describe the elastic shakedown threshold at the
mesoscopic scale and by using the weakest link hypothesis to consider all possible directions and the
total stressed volume, the failure probability is described by:
(3)
where Ta is the amplitude of the macroscopic resolved shear stress acting on a slip system. The
spherical coordinates (θ, ϕ) are used to describe the slip plane normal vector and a third angle, ψ, is
used to define the shear direction in the plane. T01 is the scale factor of the Weibull distribution, m1 is
the Weibull exponent and V01 is a reference volume.
It is generally accepted that both the mean and the amplitude of the stress, normal to the slip plane,
have an influence on crack initiation. In order to take into account both of these loading parameters, in
terms of crack initiation, the following scale factor, T01, is used:
(4)
where σm(ϕ, θ) and σa(ϕ, θ) are the mean and the amplitude of the normal stress on the slip
plane. γ andα are the normal stress sensitivity coefficients. The ratio is used to define the
degree of triaxiality and has the effect of reducing the scale factor.
In order to simplify the notation, the parameter Im1 is introduced and is given by:
(5)
hal-0
0821
800,
ver
sion
1 -
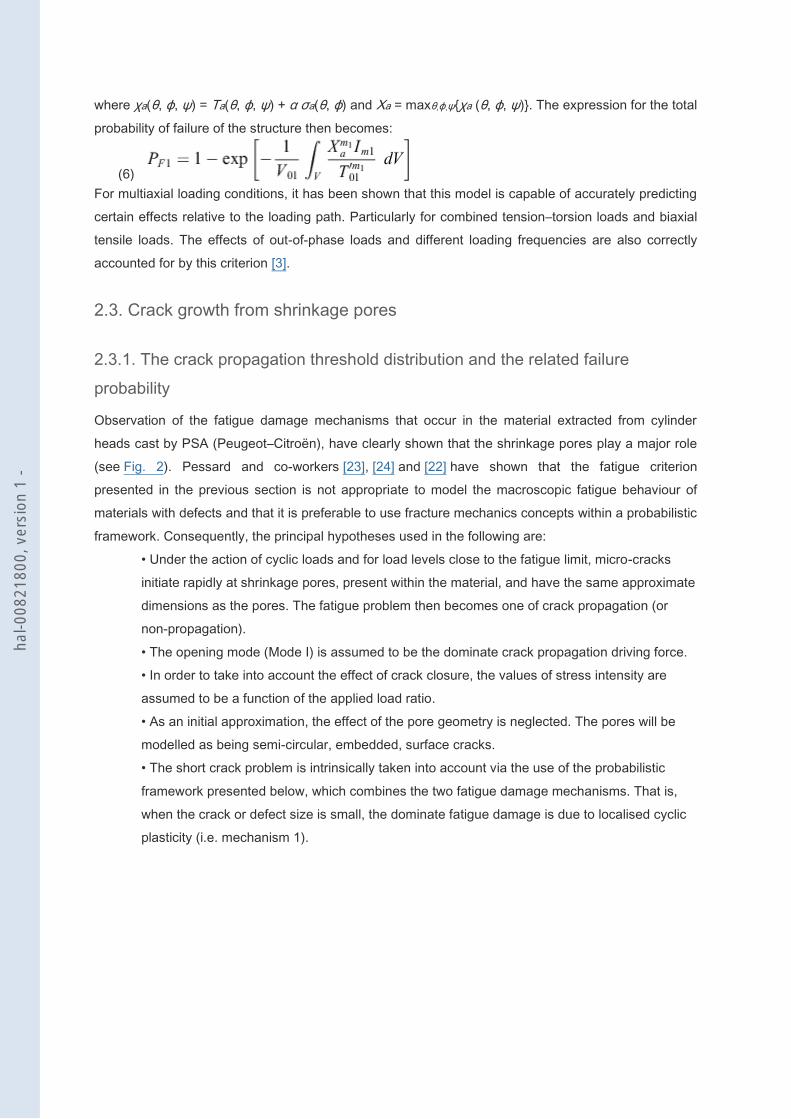
where χa(θ, ϕ, ψ) = Ta(θ, ϕ, ψ) + α σa(θ, ϕ) and Xa = maxθ,ϕ,ψ{χa (θ, ϕ, ψ)}. The expression for the total
probability of failure of the structure then becomes:
(6)
For multiaxial loading conditions, it has been shown that this model is capable of accurately predicting
certain effects relative to the loading path. Particularly for combined tension–torsion loads and biaxial
tensile loads. The effects of out-of-phase loads and different loading frequencies are also correctly
accounted for by this criterion [3].
2.3. Crack growth from shrinkage pores
2.3.1. The crack propagation threshold distribution and the related failure
probability
Observation of the fatigue damage mechanisms that occur in the material extracted from cylinder
heads cast by PSA (Peugeot–Citroën), have clearly shown that the shrinkage pores play a major role
(see Fig. 2). Pessard and co-workers [23], [24] and [22] have shown that the fatigue criterion
presented in the previous section is not appropriate to model the macroscopic fatigue behaviour of
materials with defects and that it is preferable to use fracture mechanics concepts within a probabilistic
framework. Consequently, the principal hypotheses used in the following are:
• Under the action of cyclic loads and for load levels close to the fatigue limit, micro-cracks
initiate rapidly at shrinkage pores, present within the material, and have the same approximate
dimensions as the pores. The fatigue problem then becomes one of crack propagation (or
non-propagation).
• The opening mode (Mode I) is assumed to be the dominate crack propagation driving force.
• In order to take into account the effect of crack closure, the values of stress intensity are
assumed to be a function of the applied load ratio.
• As an initial approximation, the effect of the pore geometry is neglected. The pores will be
modelled as being semi-circular, embedded, surface cracks.
• The short crack problem is intrinsically taken into account via the use of the probabilistic
framework presented below, which combines the two fatigue damage mechanisms. That is,
when the crack or defect size is small, the dominate fatigue damage is due to localised cyclic
plasticity (i.e. mechanism 1).
hal-0
0821
800,
ver
sion
1 -

Fig. 2. (a) Crack growth from a micro-shrinkage pore. Note that the presence of intermetallic phases acting as
microstructural barriers to crack propagation and (b) a schematic representation of the micro-mechanical
model.
The classical approach to predict fatigue behaviour using linear elastic fracture mechanics is given by
the condition:
(7) ΔK<ΔKth
That is, a crack will not propagate if its stress intensity range, ΔK, is less than the crack propagation
threshold, ΔKth.
Certain authors [22], [25] and [26] have discussed the possibility of linking the defect size distribution
to the experimentally observed scatter in the fatigue strength. This option is not chosen here, as the
work by [22]has shown that the link between these two distributions cannot always be made. It is
certain that defect size has an influence on the fatigue strength but it is not only these microstructural
heterogeneities that have an influence on the conditions of crack propagation. In the following, the
random character of the propagation threshold is introduced via a Weibull
distribution [28] and [29] that takes into account both the variation in the pore size and the variations in
the microstructure around the pores. That is, the presence of silicon particles, or intermetallic phases
and the orientation of the α-Al phase. These heterogeneities can be more or less favourable to the
propagation of cracks that initiate at pores.
As per the previous approach based on microplasticity, all potential cracks are taken into account via
the calculation of ΔK(θ, ϕ) for each possible propagation plane, defined by the angles (θ, ϕ).
The total probability of failure for the complete structure can be obtained by applying the weakest link
theory over all the potential crack planes and over the total stressed volume. This then leads to:
(8)
where the Weibull exponent, m2, governs the scatter and ΔKth02 is the scale factor associated with the
second fatigue damage mechanism. The stress intensity factor associated with plane (θ, ϕ) can be
written in terms of a crack or defect size, a, and the normal stress applied to the plane, Δσ(θ, ϕ):
(9)
hal-0
0821
800,
ver
sion
1 -

By using this expression the total probability of failure of the total structure is:
(10)
It is possible to simplify the expression for PF2 by introducing the factor Jm2, which is defined by:
(11)
where ΔΣ = maxθ,ϕ{Δσ(θ, ϕ)}
Finally, the total probability of failure can be written as:
(12)
where
(13)
The spatial integration takes into account all possible crack propagation sites and gives better results
for multiaxial loading conditions.
The model, presented above, was developed by Pessard et al. [22]. However, it is not well suited to
take into account the mean stress effect. An appropriate modification is proposed in the following
section.
2.3.2. Modelling of the mean stress effect for the second damage mechanism
The mean stress effect is taken into account in the model dedicated to the first fatigue damage
mechanism (i.e. meso-plasticity in the material matrix) via the mean value of the normal stress. In
order to take into account the mean stress effect, within the model dedicated to the second fatigue
damage mechanism (i.e. crack growth from shrinkage pores), the concept of crack closure will be
used.
Several authors have been proposed relationships to reflect this effect [30], [31] and [32]. The
influence of the load ratio can be observed via its influence on crack propagation rate curves. When
the load ratio increases the curves are shifted to the left, or for a given crack propagation rate (da/dN)
the corresponding value of ΔK is reduced.
Many authors explain the mean stress effect by the phenomenon of crack closure, initially introduced
by Elber [33], whereby a fatigue crack can remain closed during a fraction of the load cycle, close to
the minimum load, even when loaded via fully tensile cyclic loads (e.g. R > 0). If it is accepted that a
crack can only propagate while it is open, only the corresponding part of the loading cycle effectively
contributes to the propagation of the crack. Different mechanisms, resulting in crack closure, have
been identified. These include, but are not limited to: plasticity induced crack closure, oxide-induced
crack closure, roughness-induced crack closure and viscous fluid-induced crack closure.
hal-0
0821
800,
ver
sion
1 -
For the majority of materials the value of ΔKth decreases with an increase in the load
ratio [34], [35],[37] and [14]. However, two different types of behaviour can be observed for very high
load ratios. For certain materials, the value of ΔKth achieves a stable value for load ratios going from
0.5 to 0.7. For others this stabilisation does not occur. Suresh and Ritchie [34] have shown that for
SA542 steel the threshold stress intensity value continues to decrease up to a value of R = 0.75.
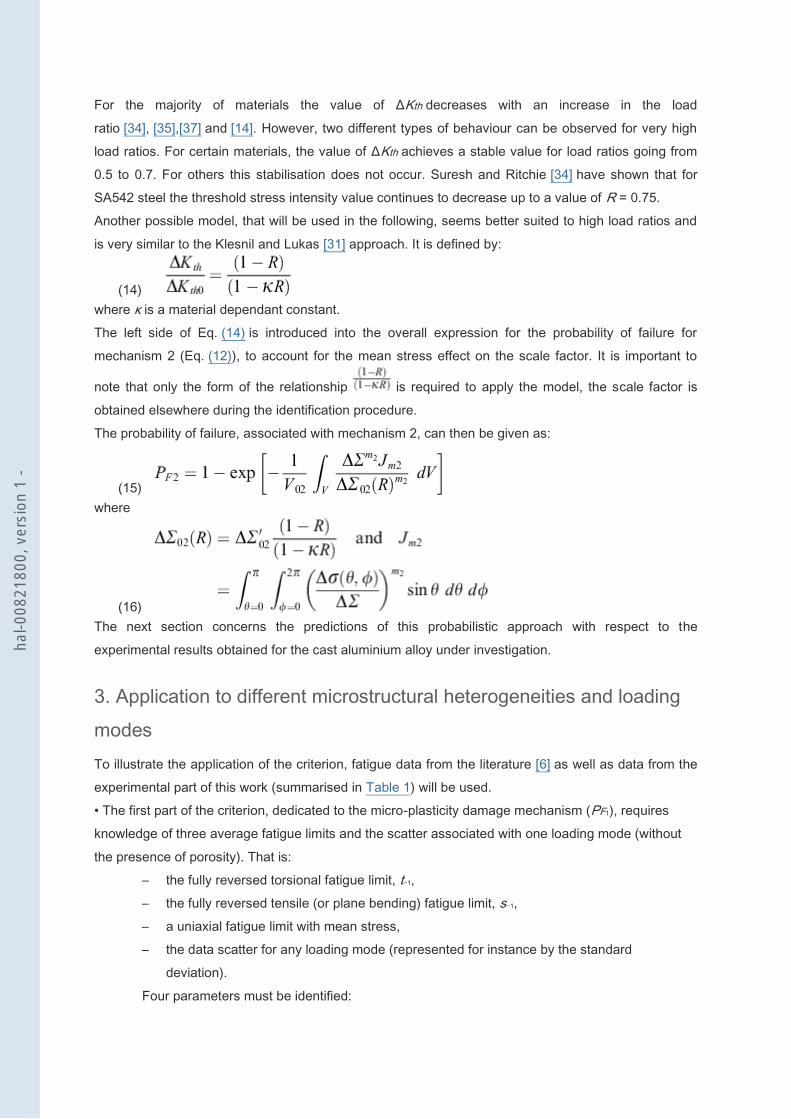
Another possible model, that will be used in the following, seems better suited to high load ratios and
is very similar to the Klesnil and Lukas [31] approach. It is defined by:
(14)
where κ is a material dependant constant.
The left side of Eq. (14) is introduced into the overall expression for the probability of failure for
mechanism 2 (Eq. (12)), to account for the mean stress effect on the scale factor. It is important to
note that only the form of the relationship is required to apply the model, the scale factor is
obtained elsewhere during the identification procedure.
The probability of failure, associated with mechanism 2, can then be given as:
(15)
where
(16)
The next section concerns the predictions of this probabilistic approach with respect to the
experimental results obtained for the cast aluminium alloy under investigation.
3. Application to different microstructural heterogeneities and loading
modes
To illustrate the application of the criterion, fatigue data from the literature [6] as well as data from the
experimental part of this work (summarised in Table 1) will be used.
• The first part of the criterion, dedicated to the micro-plasticity damage mechanism (PF1), requires
knowledge of three average fatigue limits and the scatter associated with one loading mode (without
the presence of porosity). That is:
– the fully reversed torsional fatigue limit, t−1,
– the fully reversed tensile (or plane bending) fatigue limit, s−1,
– a uniaxial fatigue limit with mean stress,
– the data scatter for any loading mode (represented for instance by the standard
deviation).
Four parameters must be identified:
hal-0
0821
800,
ver
sion
1 -

– the biaxiality parameter, α ,
– the mean stress parameter, γ ,
– the Weibull exponent, m1,
– the scale factor, .
• The second part of the criterion, for the mechanisms related to crack propagation and fracture
mechanics (PF2), requires knowledge of two average fatigue limits of the material (with the presence of
porosity) and the scatter under one loading mode:
– the fully reversed tensile (or plane bending) fatigue limit, s−1,
– a uniaxial fatigue limit with mean stress,
– the data scatter for the tensile loading condition (represented for instance by the standard
deviation).
Three parameters must be identified:
– the mean stress (or load ratio) parameter, κ,
– the Weibull exponent, m2,
– the scale factor, .
The parameters α, γ and κ are identified numerically. The complete procedure is discussed by Huyen
et al.[3]. For a material with a HIP treatment, without the presence of porosity, the data obtained by
Fan et al. [6]will be used. The mean uniaxial tensile fatigue limit of the material for a load ratio of R = −
1 is equal to 112 MPa. The torsional fatigue limit for a load ratio of R = −1 is 75 MPa. However, the
associated standard deviations were not reported. Therefore in the following the Weibull
exponent m1 is arbitrary set to 20, as Fan et al. [6] specifically highlighted the low scatter in their
results, due to the low level of porosity. The influence of this exponent on the criterion predictions will
however be investigated.
The fatigue data obtained via testing of the material extracted from the cylinder heads, will be used to
identify the Weibull exponent, m2, describing the scatter associated with the crack propagation
mechanism. The mean uniaxial fatigue strength at 2 × 10⁶ cycles for a load ratio of R = −1 is equal
to . In addition, the standard deviation determined via the staircase
method, carried out with 20 specimens, is used to calculate the exponent of the Weibull
distribution, m2. Its identification is done using Eq. (17) and leads to a value of m2 = 5.
(17)
1 3.1. Probabilistic Kitagawa type diagrams
One of the advantages of this modelling framework is the ability to take into account two different
fatigue damage mechanisms using a single relationship for different loading modes and mean stress
hal-0
0821
800,
ver
sion
1 -

values. If the reference volumes related to the two mechanisms are assumed to be the same
(i.e. V01 = V02) the probability of failure of the complete structure, PF, can be written as:
(18)
Eq. (18) is simply a bimodal Weibull model. For uniaxial tensile loads with a load ratio of R = −1, it is
possible to determine the evolution of the fatigue limit based on the size of the porosity present in the
material. Fig. 3shows that Eq. (18) results in a Kitagawa type diagram and that the predictions are
dependent on the two exponents m1 and m2.
Fig. 3. (a) Kitagawa type diagram for different failure probabilities and (b) the effect of the Weibull
exponent, m2.
This diagram has been plotted by assuming that the stress intensity threshold range is equal
to . This corresponds to the value reported by Couper et al. [36] for a similar
material. If the fully reversed bending fatigue limit is used (ΔΣ02 = 2 × 83 = 166 MPa – see Table 1) and
it is assumed that the casting defects can be modelled as penny shaped surface cracks (with a crack
shape correction factor of β = 0.65). Then from Eq. (13) it can be seen that this corresponds to a
defect size of:
(19)
However, it must keep in mind that the defect or crack size used in the model does not correspond to
the size of the micro-shrinkage pores present in the material. It includes the size of the shrinkage
pores plus the size of non-propagating cracks initiated from the pores. Hence, by definition must be
greater than the largest micro-shrinkage pores present in the material (assuming that it is the largest
shrinkage pores that control the fatigue behaviour).
A detailed investigation of the micro-shrinkage pore size present in the material using the X-ray
tomography technique is presented in the companion paper. In this investigation it was seen that the
largest defect found in a scanned volume of 3.546.5 mm3 was of the order of 230 μm. It was therefore
concluded that the value of is consistent with the experimental fatigue data.
hal-0
0821
800,
ver
sion
1 -

For smaller porosity (or defect) sizes, the behaviour is principally controlled by crack initiation from the
matrix, while for larger defects, there is a decrease in the fatigue limit with increasing size. Between
these two zones there is a transition zone where there exists a competition between the two possible
mechanisms.
In order to accurately describe the behaviour of this criterion, the following sections focus firstly on the
behaviour of a material characterised by small defects, followed by the behaviour of a material
containing large defects.
3.2. Predictions for small defect size
In this section, focus is on the zone on the left of the Kitagawa type diagram defined by the relatively
horizontal line. The model predictions for combined tension–torsion loads and biaxial tensile loads are
analysed and compared with available experimental results.
3.2.1. Combined in-phase tension–torsion (R = −1)
The predictions of the criterion for combined in-phase tension–torsion loads are shown in Fig. 4. It can
be seen that the criterion is in good agreement with the Gough and Pollard empirical criterion [38]. The
results for different Weibull exponents and for 50% probability of failure, show that this parameter has
very little effect on the average fatigue behaviour of the material. The only available experimental
result, also from the work of Fan et al. [6] for in-phase combined tension–torsion loads with a biaxiality
ratio of 0.7, is also shown. The model gives a prediction very close to the experimental data.
Fig. 4. The criterion predictions for different values of the parameter m1 for in-phase combined tension–torsion
loads with an R-ratio of −1.
It is also possible to plot the criterion predictions for different failure probabilities, for this loading
condition (see Fig. 5). As previously discussed it is not possible to correctly estimate the value of m1,
however Fig. 5clearly shows the importance of this exponent. Indeed, when m1 goes from 20 to 5, the
hal-0
0821
800,
ver
sion
1 -

difference in the admissible stress between failure probabilities of 10% and 90% greatly increases.
This is synonymous with greater scatter.
Fig. 5. (a) Predictions of the criterion for different failure probabilities for different Weibull exponents m1 = 5 and
20 for in-phase combined tension–torsion loads with an R-ratio of −1.
3.2.2. Biaxial tensile loads (R = −1)
The proposed criterion leads to a relatively moderate influence of the biaxiality ratio for
biaxial tensile loading conditions (see Fig. 6). It can be seen that the admissible stress amplitude Σ
11,amp does not continuously decrease with increasing biaxiality ratio and that there is even a slight
increase for biaxiality ratios close to 0.5. This increase is a function of the parameter m1 and is greater
when m1 is large. It is very difficult to find experimental results (for biaxial tensile loads) with a load
ratio of R = −1, especially for this material. However Poncelet et al. [39] have also shown that stress
biaxiality is not detrimental compared to a uniaxial loading conditions. Their conclusion was based on
a small number of equibiaxial tensile fatigue tests done on an austenitic stainless steel.
Fig. 6. Effect of the parameter m1 on the criterion predictions for biaxial tensile loads (Pf = 0.5).
hal-0
0821
800,
ver
sion
1 -
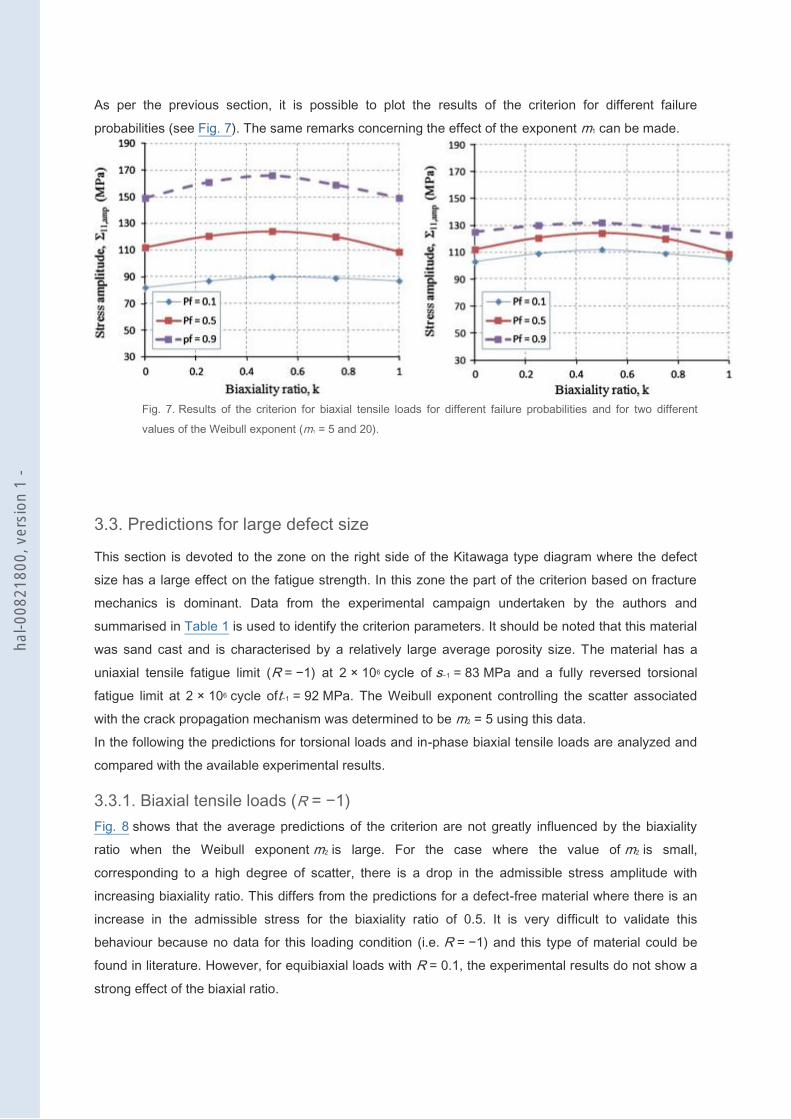
As per the previous section, it is possible to plot the results of the criterion for different failure
probabilities (see Fig. 7). The same remarks concerning the effect of the exponent m1 can be made.
Fig. 7. Results of the criterion for biaxial tensile loads for different failure probabilities and for two different
values of the Weibull exponent (m1 = 5 and 20).
3.3. Predictions for large defect size
This section is devoted to the zone on the right side of the Kitawaga type diagram where the defect
size has a large effect on the fatigue strength. In this zone the part of the criterion based on fracture
mechanics is dominant. Data from the experimental campaign undertaken by the authors and
summarised in Table 1 is used to identify the criterion parameters. It should be noted that this material
was sand cast and is characterised by a relatively large average porosity size. The material has a
uniaxial tensile fatigue limit (R = −1) at 2 × 10⁶ cycle of s−1 = 83 MPa and a fully reversed torsional
fatigue limit at 2 × 10⁶ cycle oft−1 = 92 MPa. The Weibull exponent controlling the scatter associated
with the crack propagation mechanism was determined to be m2 = 5 using this data.
In the following the predictions for torsional loads and in-phase biaxial tensile loads are analyzed and
compared with the available experimental results.
3.3.1. Biaxial tensile loads (R = −1)
Fig. 8 shows that the average predictions of the criterion are not greatly influenced by the biaxiality
ratio when the Weibull exponent m2 is large. For the case where the value of m2 is small,
corresponding to a high degree of scatter, there is a drop in the admissible stress amplitude with
increasing biaxiality ratio. This differs from the predictions for a defect-free material where there is an
increase in the admissible stress for the biaxiality ratio of 0.5. It is very difficult to validate this
behaviour because no data for this loading condition (i.e. R = −1) and this type of material could be
found in literature. However, for equibiaxial loads with R = 0.1, the experimental results do not show a
strong effect of the biaxial ratio.
hal-0
0821
800,
ver
sion
1 -

Fig. 8. (a) Criterion prediction as a function of the biaxiality ratio for different Weibull parameters and (b) for
several failure probabilities for a Weibull exponent of m2 = 5.
As per the previous section, it is possible to represent the criterion predictions for different failure
probability (see Fig. 8b). This figure is for a Weibull exponent of m2 = 5, which is the experimentally
determined value and corresponds to a high degree of scatter. Consequently, it can be seen that there
is a large difference between the admissible stress amplitude for failure probabilities of 90% and 10%.
3.3.2. Uniaxial loads (in plane bending)
The objective of this section is to consider the mean stress effect in terms of plane bending for the
sand gravity cast aluminium alloy (AlSi7Cu05Mg03). The predictions obtained are plotted in Fig. 9.
This figure shows the admissible stress amplitude as a function of the mean stress. It can be seen that
the predictions are in very good agreement with the experimental results. The dependence on the R-
ratio is such that the mean stress effect is not affected by the Weibull exponent m2 (see
Eqs. (15) and (16)).
Fig. 9. Comparison between the predictions of the criterion (with different value of m2) and the experimental
data for the cast aluminium alloy in the form of a Haigh diagram. The Goodman criterion is also shown.
hal-0
0821
800,
ver
sion
1 -

3.3.3. Fully reversed torsional loads
It is important to note that for the model describing crack initiation in the material matrix (i.e. for small
defects), the fatigue limit in torsion was necessary to identify the criterion parameters. This is not the
case here. The curve shown in Fig. 10 shows the change in the predicted torsional fatigue limit as a
function of the parameter m2.
Fig. 10. The predicted torsional fatigue limit as a function of the parameter m2.
It can be seen that the predicted torsional fatigue limit increases with increasing m2, and tends to the
plane bending fatigue limit of the material (i.e. f−1 = 83 MPa). Thus, according to the criterion, a
material with a high level of scatter leads to a lower torsional fatigue limit than a material with less
scatter. This finding must be qualified by noting that the difference between the plane bending fatigue
limits and the torsional limit is very low (approx. 10 MPa).
Surprisingly, the experimental results show a fatigue limit in torsion (t−1 = 92 MPa) which is higher than
in plane bending and therefore higher than the value predicted by the criterion. This error is
acceptable, however a possible explanation could be due to a volume effect. That is, the volume of
highly stressed material in the torsional specimens was lower than for the specimens loaded in plane
bending.
For other materials with defects (or porosity) such as nodular cast iron (which also has high scatter in
terms of fatigue), Nadot and Denier [40] showed that the uniaxial tensile fatigue limit and the torsional
fatigue limit are very similar (approx. 225 MPa). This confirms the overall good performance of the
proposed model for the torsional loading of a material with defects.
3.3.4. Biaxial tensile loads
In a previous section it was observed that for a load ratio of R = −1, a decrease of the
exponent m2 tended to accentuate the damaging effect of the biaxiality (see Fig. 8a). Fig. 11 shows
the effect of the mean stress for an equibiaxial in-phase loading mode, for different values of m2.
hal-0
0821
800,
ver
sion
1 -

Fig. 11. Haigh diagram adapted to equibiaxial in-phase tensile loads for different Weibull exponents for the cast
aluminium alloy.
From this figure it can be seen that the criterion predictions appear conservative compared to the one
experimental data point available for a load ratio of R = 0.1. The predictions for different values of the
Weibull exponent m2 are shown as the experimental identification of m2 was only done for a load ratio
of R = −1. The number of tests with a mean stress was not sufficient (i.e. 10 test per R-ratio) to
accurately estimate the Weibull exponent associated with the corresponding scatter. However, it is
observed that a high value of m2is required to get the best predictions.
3.4. Critical analysis of the proposed criterion
The principal objectives for the development of this probabilistic fatigue model were to correctly take
into account the effect of various microstructural heterogeneities and to accurately reproduce the
experimental trends observed for varied multiaxial loading conditions.
In order to compare the predictions from the proposed criterion with the experimental data for the
totality of the loading conditions investigated the Dang Van diagram is used. The Dang Van criterion is
based on a two scale approach [1], [19] and [20]. The two mechanical parameters used are the
mesoscopic resolved shear stress obtained for the elastic shakedown state τ and the hydrostatic
stress ΣH. The criterion is expressed as a linear combination of these two parameters:
(20) τ+αΣH⩽β
where τ and ΣH are both functions of time. In the criterion plane, the load path associated with a given
loading condition changes with the mean stress level and the stress state. All the load conditions
discussed in this work lead to proportional loading paths, however in Fig. 12, only the most critical
points of the paths are shown. The dotted line on the diagram corresponds to the Dang Van Criterion,
identified using the fully reversed experimentally determined torsional and plane bending fatigue limits.
It can be seen that the predictions of the proposed criterion (i.e. the non-solid data points) are in
general, closer to the experimental data (i.e. the solid data points) compared to the Dang Van
hal-0
0821
800,
ver
sion
1 -

criterion. Fig. 12 highlights the fact that the Dang Van criterion has difficulty predicting the fatigue
behaviour of this type of material.
Fig. 12. Dang Van diagram, showing the predictions of the proposed criterion and the corresponding
experimental data for the cast aluminium alloy AlSi7Cu05Mg03-T7.
The predictions of the proposed criterion are close to the experimental results for the uniaxial load
conditions with different mean values and lead to conservative results for the multiaxial loading
conditions. That is, the predictions are below the experimental data points.
4. Discussion and conclusion
The principal objective of this work was to develop a probabilistic high cycle fatigue model adapted to
Al–Si cast alloys, which is able to take into account the different microstructural heterogeneities
present in the material and has the capacity to reproduce the experimentally observed tendencies for
very different multiaxial loading conditions.
Based on a large number of data taken from the literature and the vast experimental campaign
undertaken by the authors (See Footnote 1), it has been concluded that two coexisting fatigue
damage mechanisms occur in this material. When the influence of micro-shrinkage pores is reduced,
by a HIP treatment for example, the multiaxial fatigue behaviour is controlled via meso-plasticity
occurring in the material matrix. This is very different to the damage mechanism observed with a
typical gravity sand cast material, for which the dominate crack leading to final fatigue typically occurs
at a micro-shrinkage pore. It is important to note that, even in this case, the first damage mechanism is
still present, but rarely leads to failure.
In order to take into account both of these damage mechanisms, a probabilistic approach using the
weakest link concept is employed to model the competition between the two mechanisms. This
approach leads naturally to a probabilistic Kitagawa type diagram, which in this case explains the
relationship between the fatigue behaviour of the material and the different casting processes or post-
casting treatments (i.e. gravity casting and HIP).
hal-0
0821
800,
ver
sion
1 -

A major advantage of this modelling framework concerns the question of “small crack propagation”. It
is generally accepted that linear elastic fracture mechanics is not suitable to predict the propagation
behaviour of small cracks. However, in the modelling framework presented here this is not an issue. If
the second damage mechanism (modelled using a LEFM approach) is dominate the problem is by
definition one of “long crack propagation” and will be situated on the right-hand side of the Kitagawa
diagram.
It is shown that the proposed model is capable of reproducing the experimentally observed
tendencies, with respect to both the mean stress effect and the loading mode (torsion, uniaxial tension
and equibiaxial tension). It is shown that the effect of a biaxial stress state is not as detrimental as the
predictions of the Dang Van criterion, which uses the hydrostatic stress.
Acknowledgments
This work was undertaken in partnership with PSA Peugeot Citroën and was financially supported by
the French region Pays de la Loire.
References
[1] K. Dang Van
Sur la résistance à la fatigue des métaux
Sci Tech Armement, 47 (1973)
[2] F. Morel, N. Huyen
Plasticity and damage heterogeneity in fatigue
Theor Appl Fract Mech, 49 (1) (2008), pp. 98–127
[3] N. Huyen, L. Flacelière, F. Morel
A critical plane fatigue model with coupled meso-plasticity and damage
Fatigue Fract Eng Mater Struct, 31 (1) (2008), pp. 12–28
[4]Y.X. Gao, J.Z. Yi, P.D. Lee, T.C. Lindley
A micro cell model of the effect of the microstructure and defects on fatigue resistance in cast
aluminum alloys
Acta Mater, 52 (2004), pp. 5435–5449
[5]D.L. Mc Dowell, K. Gall, M.F. Horstemeyer, J. Fan
Microstructure-based fatigue modeling of cast A356-T6 alloy
Eng Fract Mech, 70 (2003), pp. 49–80
[6]J. Fan, D.L. Mc Dowell, M.F. Horstemeyer, K. Gall
Cyclic plasticity at pores and inclusions in cast Al–Si alloys
Eng Fract Mech, 70 (2003), pp. 1281–1302
hal-0
0821
800,
ver
sion
1 -
[7]B. Zhang, W. Chen, D.R. Poirier
Effect of solidification cooling rate on the fatigue life of A356.2-T6 cast aluminium alloy
Fatigue Fract Eng Mater Struct, 23 (5) (2000), pp. 417–423
[8]X. Zhu, J.Z. Yi, J.W. Jones, J.E. Allison
A probabilistic model of fatigue strength controlled by porosity population in a 319-type cast
aluminum alloy: Part I. Model development
Metall Mater Trans A, 8 (5) (2007), pp. 1111–1122
[9]J.Y. Buffière, S. Savelli, P.H. Jouneau, E. Maire, R. Fougères
Experimental study of porosity and its relation to fatigue mechanisms of model Al–Si7–Mg0.3 cast AL
alloy
Mater Sci Eng A, 316 (2001), pp. 115–126
[10]Q.G. Wang, D. Apelian, D. A Lados
Fatigue behavior of A356-T6 aluminum cast alloys. Part I. Effect of casting defects
J Light Met, 1 (1) (2001), pp. 73–84
[11]Q.G. Wang, D. Apelian, D.A. Lados
Fatigue behavior of A356-T6 aluminum cast alloys. Part II: Effect of microstructural constituents
J Light Met, 1 (2001), pp. 85–97
[12]M. Brochu, Y. Verreman, F. Ajersch, D. Bouchard
High cycle fatigue strength of permanent mold and rheocast aluminium 357 alloy
Int J Fatigue, 32 (8) (2010), pp. 1233–1242
[13]M.J. Caton, J.W. Jones, J.E. Allison
The influence of heat treatment and solidification time on the behavior of small fatigue cracks in a
cast aluminum alloy
Mater Sci Eng A, 314 (1998), pp. 81–85
[14]B.E. Powell, T.V. Duggan
Predicting the onset of high cycle fatigue damage: an engineering application for long crack fatigue
threshold data
Int J Fatigue, 8 (4) (1986), pp. 187–194
[15]B. Skallerud, T. Iveland, G. Harkegard
Fatigue life assessment of aluminum alloys with casting defects
Eng Fract Mech, 44 (6) (1993), pp. 857–874
[16]J. Linder, M. Axelsson, H. Nilsson
The influence of porosity on the fatigue life for sand and permanent mould cast aluminum
hal-0
0821
800,
ver
sion
1 -

Int J Fatigue, 28 (2006), pp. 1752–1758
[17]H. Mayer, M. Papakyriacou, B. Zettl, S.E. Stanzl-Tschegg
Influence of porosity on the fatigue limit of die cast magnesium and aluminium alloys
Int J Fatigue, 25 (2003), pp. 245–256
[18]J.Z. Yi, P.D. Lee, T.C. Lindley, T. Fukui
Statistical modeling of microstructure and defect population effects on the fatigue performance of cast
A356-T6 automotive components
Mater Sci Eng A, 432 (2006), p. 5968
[19]E. Charkaluk, A. Constantinescu, H. Matournam, K. Dang Van
Revisiting the Dang Van criterion
Proc Eng, 1 (1) (2009), pp. 143–146
[20]K. Dang Van
Macromicro approach in high-cycle multiaxial fatigue
,in: D.L. McDowell, R. Ellis (Eds.), A dvances in multiaxial fatigue, ASTM STP, vol. 1191, ASTM, Philadelphia,
PA (1993), p. 12030
[21]Papadopoulos IV. Fatigue limit of metals under multiaxial stress conditions: the microscopic approach.
ISEI/IE 2464/93. Commission of the European Communities Joint Research Center; 1993.
[22]E. Pessard, F. Morel, A. Morel
The anisotropic fatigue behavior of forged steel
Adv Eng Mater, 11 (2009), pp. 732–735
[23]E. Pessard, F. Morel, A. Morel, D. Bellett
Modelling the role of non-metallic inclusions on the anisotropic fatigue behaviour of forged steel
Int J Fatigue, 33 (4) (2011), pp. 568–577
[24]E. Pessard, F. Morel, C. Verdu, L. Flacelière, G. Baudry
Microstructural heterogeneities and fatigue anisotropy of forged steels
Mater Sci Eng A, 529 (1) (2011), pp. 289–299
[25]H. Yaacoub Agha, A.-S. Beranger, R. Billardon, F. Hild
Statistical damage tolerance for cast iron under fatigue loadings
Stud Appl Mech, 45 (1997), pp. 415–424
[26]I. Chantier, V. Bobet, R. Billardon, F. Hild
A probabilistic approach to predict the very high cycle fatigue behaviour of spheroidal graphite cast
iron structures
Fatigue Fract Eng Mater Struct, 23 (2000), p. 173
[27]L. Flacelière, F. Morel
hal-0
0821
800,
ver
sion
1 -

Probabilistic approach in multiaxial high cycle fatigue: volume and surface effects
Fatigue Fract Eng Mater Struct, 27 (2004), pp. 1123–1135
[28]W. Weibull
A statistical theory of the strength of materials
Roy Swed Inst Eng Res Rep, 151 (1939)
[29]W. Weibull
A statistical distribution function of wide applicability
ASME J Appl Mech, 18 (1951), pp. 293–297
[30]R. Schmidt, P.C. Paris
Threshold for fatigue crack propagation and the effects of load ratio and freqeuncy
ASTM STP, 536 (1973), pp. 79–94
[31]M. Klesnil, P. Lukas
Effect of stress cycle asymmetry on fatigue crack growth
Mater Sci Eng, 9 (1972), pp. 231–240
[32]D. Kujawski
A fatigue crack driving force parameter with load ratio effects
Int J Fatigue, 23 (SUPPL 1) (2001), pp. S236–S246
[33]W. Elber
Fatigue crack closure under cyclic tension
Eng Fract Mech, 2 (1970), pp. 37–45
[34]S. Suresh, R.O. Ritchie
On the influence of environment on the load ratio dependence of fatigue thresholds in pressure
vessel steel
Eng Fract Mech, 18 (4) (1983), pp. 785–800
[35]S. Kawai
The effect of the stress ratio on fatigue crack growth in a 3% NaCl solution
Eng Fract Mech, 16 (6) (1982), pp. 857–870
[36]M.J. Couper, A.E. Neeson, J.R. Griffith
Casting defects and the fatigue behavior of an aluminum casting alloy
Fatigue Fract Eng Mater Struct, 13 (3) (1990), pp. 213–217
[37]S.-L. Chen, Y. Zuo, Y.A. Chang
A thermodynamic description for the ternary Al–Mg–Cu system
Metall Mater Trans A, 28A (1997), pp. 435–446
hal-0
0821
800,
ver
sion
1 -

[38]H.J. Gough, H.V. Pollard
The strength of metals under combined alternating stresses
Proc Inst Mech Eng (London), 131 (1935), p. 1103
[39]M. Poncelet, G. Barbier, B. Raka, L. Vincent, R. Desmorat
Etude de lendomagement dun acier inoxydable austenitique par fatigue multiaxiale grand nombre de
cycles
J Printemps SF2M (2009)
[40]Y. Nadot, V. Denier
Fatigue failure of suspension arm: experimental analysis and multiaxial criterion
Eng Fail Anal, 11 (2004), pp. 485–499
hal-0
0821
800,
ver
sion
1 -


