
A Powerful DFSS StrategyDOE Collective Response Capability Assessment
(DCRCA)
Forrest BreyfoglePresident and CEO, Smarter Solutions, Inc
www.smartersolutions.com
Example 43.3 from Implementing Six Sigma, 2nd edition, Forrest Breyfogle, Wiley 2003Example 43.3 from Implementing Six Sigma, 2nd edition, Forrest Breyfogle, Wiley 2003
DOE = Design of ExperimentsDOE = Design of Experiments
DOE/DCRCA - 2
Objectives
At the end of the presentation you will be able to:♦ Describe reliability test alternatives and limitations in DFSS♦ Describe DOE application in the verification phase of DFSS♦ Explain the benefits of S4/IEE DCRCA♦ Conduct a DCRCA
S4 = Smarter Six Sigma Solutions
IEE =Integrated Enterprise Excellence
S4 = Smarter Six Sigma Solutions
IEE =Integrated Enterprise Excellence

DOE/DCRCA - 3
Project Roadmap Alternatives
Product Design
Process Engineering
Product Engineering
Production Sales
Product DFSS DMAIC
DefineProject ControlMeasure Passive
AnalysisProactiveTesting
PlanProject
and Metrics
Wisdomof the
OrganizationMSABaseline
Project
ConsiderLeanTools
D M A I C
Chap 2-45, 2nd edChap 2-45, 2nd edChap 48-50, 2nd edChap 48-50, 2nd ed
DFSS project/process execution roadmap: Design-Measure-Analyze-Design-Verify
Note: DFSS product/process projects need to align with high-level enterprise needs
DFSS project/process execution roadmap: Design-Measure-Analyze-Design-Verify
Note: DFSS product/process projects need to align with high-level enterprise needs
This presentation focusThis presentation focus
DOE/DCRCA - 4
Mission of Test Organization and Problem Definition
Commission of Development Test OrganizationEvaluation of products against design requirements
Problem♦ A sophisticated power supply has a design specification of
10 × 106 hr MTBF (mean time between failures)Test organization is to evaluate the reliability and function of the non-repairable power supply

DOE/DCRCA - 5
Reliability Test Duration: Hypothesis Test Approach
♦ An hypothesis test approach for 10,000,000 hr MTBF testHo: ρ = 1/10,000,000 hoursHa: ρ > 1/10,000,000 hours
♦ Assumeα = 0.05; i.e., Uα=1.645β = 0.05; i.e., Uβ=1.645ρα = .80(1/10,000,000) = 8x10⁻⁸
ρβ = 1.20(1/10,000,000) = 12x10-8
22/12/1 )]1)()[(()]1)()[((Test time ⎟
⎟⎠
⎞⎜⎜⎝
⎛
−−+−
=αβ
βββααα
ρρρρρρ UU
hours 106701081012
)]10121)(1012)[(645.1()]1081)(108)[(645.1(Test time 62
88
2/1882/188
×=⎟⎟⎠
⎞⎜⎜⎝
⎛×−×
×−×+×−×= −−
−−−−
Obviously this test time is not reasonableObviously this test time is not reasonable

DOE/DCRCA - 6
♦ We could design a zero-failure test such that there is a 90% confidence interval that the failure rate is equal to or better than the criterion
Total test time would then be:T = 2.303 (10 × 106) = 23.03 × 10⁶ hr
Where the 2.303 factor is determined from Table K, Implementing Six Sigma
♦ Note, for this zero-failure test the units would need to perform 2.3 times better than the specified failure rate with no failures
Reliability Test Duration: Reduced Sample Size Calculation
Obviously this test time is also not reasonableObviously this test time is also not reasonable

DOE/DCRCA - 7
♦ Even if the time and resources could be devoted to conducting this test and no failure occurred, customer reliability problems can still exist
♦ Two basic assumptions are often overlooked with reliability testing 1. Sample is a random sample of the population of interest; e.g., future products
produced2. Test replicates customer usage; e.g., test may miss a failure mode caused by
additional loading of the electronics
Reliability Test Assumptions
DOE/DCRCA - 8
♦ Consider, after much work, a computer manufacturer detects a problem during a reliability test, often the only thing that they can do is notify a supplier to correct a problem
Often by the time the problem is identified, during a reliability test, someone is already aware of the problem’s existence and has a planned fix or the problem is considered a random occurrence that cannot be avoided“Fixes” for these problems typically do not impact the overall manufacturing/design process
♦ Remember that the best we can do is what the technology will permit us to do (e.g., the reliability of TV’s in the 1950’s could only achieve a level permitted by the technology)
Our goal within DFSS is to create products/processes in the shortest period of time that will be the best that they can be given the applied technology
Reliability Test Assumptions

DOE/DCRCA - 9
DESIGNDESIGN TESTTEST MFG.MFG. USERUSER
Answering the Right Question?
Creating New Product TypesCurrent
enterprise often has no
feedback
Current enterprise
often has no feedback

DOE/DCRCA - 10
Test Escapes
0
20
40
60
1 2 3 4 5 6 7 8 9 10 11 12 13
Project
Num
ber o
f Es
cape
s
Types of Issues
54
159
4 4 3 2 2 2 2 10
102030405060
BIOS
Vendor Drive
r/Utili
tyElec
trica l
Manufactur in
g Proces s
3rd Party A
pplic ation..
O pera tor/ Procedure
..S ystem Speci fi cDell
Driver/U
tili ty
Mechanica lOthe r/U
nk nownDocumen tatio
n
Per
cent
ages
DESIGNDESIGN TESTTEST MFG.MFG. USERUSER
S4/IEE DFSS Feedback
We need to create an information system that builds upon the knowledge gained from previous product designs; i.e., part of what
the S4/IEE DFSS roadmap accomplishes
We need to create an information system that builds upon the knowledge gained from previous product designs; i.e., part of what
the S4/IEE DFSS roadmap accomplishes
Creating New Product Types
Often one of the largest types of problems is no trouble found (NTFs),
not hardware reliability issues
Often one of the largest types of problems is no trouble found (NTFs),
not hardware reliability issues

DOE/DCRCA - 11
- +A: Ambient Temperature 47 deg C 25 deg CB: Input ac voltage range 110V 220 VC: Mode of programmable output 3.4 V 5.1 VD: ac line voltage (within range in B) Min MaxE: Frequency at ac input Min MaxF: Load on -12 V output Min MaxG: Load on -5 V Output Min MaxH: Load on 12 V output Min MaxI: Load on 5.1 V output Min MaxJ: Load on 3.4 V output Min MaxK: Load on programmable output Min Max
Output voltage on each output (-12V, -5V, 12V, 5.1V, 3.4V, programmable volt outputRipple/noiseNoiseInput (power factor)EfficiencyLine currentLine power
FactorsLevels
Inputs
Outputs
♦ Within one test, a Design of Experiments (DOE) evaluation can structurally address loading variations, environmental usage extremes, and process/product tolerances
♦ The DOE at the right is a functional test of the product design at its operating environmental extremes
DOE Functional Test Setup
A strategy that can identify potential NTF issues before
customer shipment
A strategy that can identify potential NTF issues before
customer shipment

DOE/DCRCA - 12
♦ A 32-trial resolution IV design was chosen from Table M4 of Implementing Six Sigma, 2nd edition
With this design, the main effects would not be confounded with two-factor interactions;
however, there would be confounding of two-factor interactions with each other
Trial A B C D E F G H I J K -12V 3.4V1 + - - - + + + + - + - -11.755 3.14652 + + - - - + + - + - - -11.702 3.39653 + + + - - - + + - + + -12.202 3.1474 + + + + - + - + + - - -11.813 3.40385 + + + + + + + + + + + -11.761 3.15376 - + + + + - + - + + - -12.2 3.18617 - - + + + - - + - + + -12.325 3.19028 + - - + + + - + + - + -12.292 3.3989 + + - - + + - - + + + -11.872 3.1498
DOE Setup and Responses

DOE/DCRCA - 13
DOE Analysis of the -12 Volt Output
0 50 100
ABBGALAHBED
ACBDAECEAJBC
ADAK
LEH
AGJA
DLAF
KGF
Pareto Chart of the Standardized Effects(response is -12V, Alpha = .10)
A: AB: BC: CD: DE: EF: FG: GH: HJ: IK: JL: K

DOE/DCRCA - 14
Fractional Factorial FitEstimated Effects and Coefficients for -12V (coded units)Term Effect Coef StDev Coef T PConstant -12.02 0.001804 -7E-03 0.000
A 0.02 0.01 0.001804 5.54 0.000B 0.00 0.00 0.001804 0.42 0.683C 0.00 0.00 0.001804 0.42 0.683D 0.00 0.00 0.001804 0.17 0.864E 0.00 0.00 0.001804 0.69 0.497F 0.43 0.22 0.001804 120.03 0.000G 0.11 0.06 0.001804 31.35 0.000H -0.01 -0.00 0.001804 -1.80 0.088I -0.02 -0.01 0.001804 -4.54 0.000J -0.06 -0.03 0.001804 -17.08 0.000K 0.00 0.00 0.001804 0.66 0.519A*F 0.03 0.02 0.001804 9.01 0.000D*K -0.03 -0.01 0.001804 -6.96 0.000
Load on -12V
Load on -5VSmal
ler
mag
nitu
des
Smal
ler
mag
nitu
des
Alias Structure (up to order 2)A*F + B*I + C*D + E*JD*K + E*H + F*G
DOE Analysis of the -12 Volt Output A model with all main effects and interactions
identified in Pareto chart of effectsA model with all main effects and interactions
identified in Pareto chart of effects

DOE/DCRCA - 15
♦ The results of statistical analyses are commonly presented as significance statements
However, a practitioner may be interested in the overall effects relative to specification limits
♦ If the factor levels represent expected extremes from process input parameters and environmental extremes,
a distribution picture of expected future responses can be creating from a probability plot of the 32 responses
♦ This distribution can be used to size how well the product specification needs will later be met
Note: probability plot can be considered representative but not a random sample of future responses
DCRCA Analysis of the -12 Volt Output
DCRCA analysis: DOE collective response capability assessment DCRCA analysis: DOE collective response capability assessment

DOE/DCRCA - 16
-11.5-12.0-12.5
99
95
90
80706050403020
10
5
1
Data
Perc
ent 1.988AD*
Goodness of Fit
Normal Probability Plot for -12VML Estimates
Mean
StDev
-12.0229
0.227399
ML Estimates
0.43 Volts
This plot reflects the variability of one machine, given structured worst-case loading/environmental scenariosThis plot reflects the variability of one machine, given
structured worst-case loading/environmental scenarios
K -12V 3.4V- -11.755 3.1465- -11.702 3.3965+ -12.202 3.147- -11.813 3.4038+ -11.761 3.1537- -12.2 3.1861+ -12.325 3.1902+ -12.292 3.398+ -11.872 3.1498
Since the distribution tails are well within a +/- 10% voltage tolerance voltage range, we feel comfortable concluding that the voltage output
level of future manufactured product should be satisfactory
Since the distribution tails are well within a +/- 10% voltage tolerance voltage range, we feel comfortable concluding that the voltage output
level of future manufactured product should be satisfactory
DCRCA Analysis of the -12 Volt Output

DOE/DCRCA - 17
♦ Now consider the 3.4-V output
A probability plot of the 3.4-V effects is shown to the right
♦ The 3.4-V loading effect appears most significant, followed by the temperature effect
The third most significant effect noted is a suspected interaction between this loading and temperature
250200150100500
KA
AKFLC
AHB
ALD
ABAFACAGCEBD
EAE
JBEG
ADDLAJH
BG
Pareto Chart of the Standardized Effects(response is 3.4V, Alpha = .10)
A: AB: BC: CD: DE: EF: FG: GH: HJ: IK: JL: K
DOE Analysis of the 3.4 Volt Output
Note: Minitab skips the letter I hence AK here
is AJ on the next slide
Note: Minitab skips the letter I hence AK here
is AJ on the next slide

DOE/DCRCA - 18
Fractional Factorial FitEstimated Effects and Coefficients for 3.4V (coded units)Term Effect Coef StDev Coef T PConstant 3.2891 0.000399 8238.12 0.000
A -0.0317 -0.0159 0.000399 -39.70 0.000B -0.0017 -0.0009 0.000399 -2.19 0.041C 0.0045 0.0022 0.000399 5.59 0.000D -0.0007 -0.0004 0.000399 -0.94 0.359E -0.0004 -0.0002 0.000399 -0.47 0.644F 0.0055 0.0028 0.000399 6.93 0.000G -0.0002 -0.0001 0.000399 -0.28 0.781H 0.0000 0.0000 0.000399 0.05 0.963I 0.0002 0.0001 0.000399 0.30 0.769J -0.2447 -0.1224 0.000399 -306.50 0.000K 0.0049 0.0025 0.000399 6.15 0.000A*J -0.0100 -0.0050 0.000399 -12.55 0.000
Temperature
Load on 3.4 V output
Smaller Effects
Temp*Load 3.4 V suspected
Resolution IV confounding: AJ, EF, GH, and BKResolution IV confounding: AJ, EF, GH, and BK
DOE Analysis of the 3.4 Volt Output A model with all main effects and interactions
identified in Pareto chart of effectsA model with all main effects and interactions
identified in Pareto chart of effects

DOE/DCRCA - 19
3.0 3.1 3.2 3.3 3.4 3.5
1
5
10
20304050607080
90
95
99
Data
Perc
ent
Normal Probability Plot for 3.4V
ML Estimates
Mean:
StDev:
3.28908
0.123585
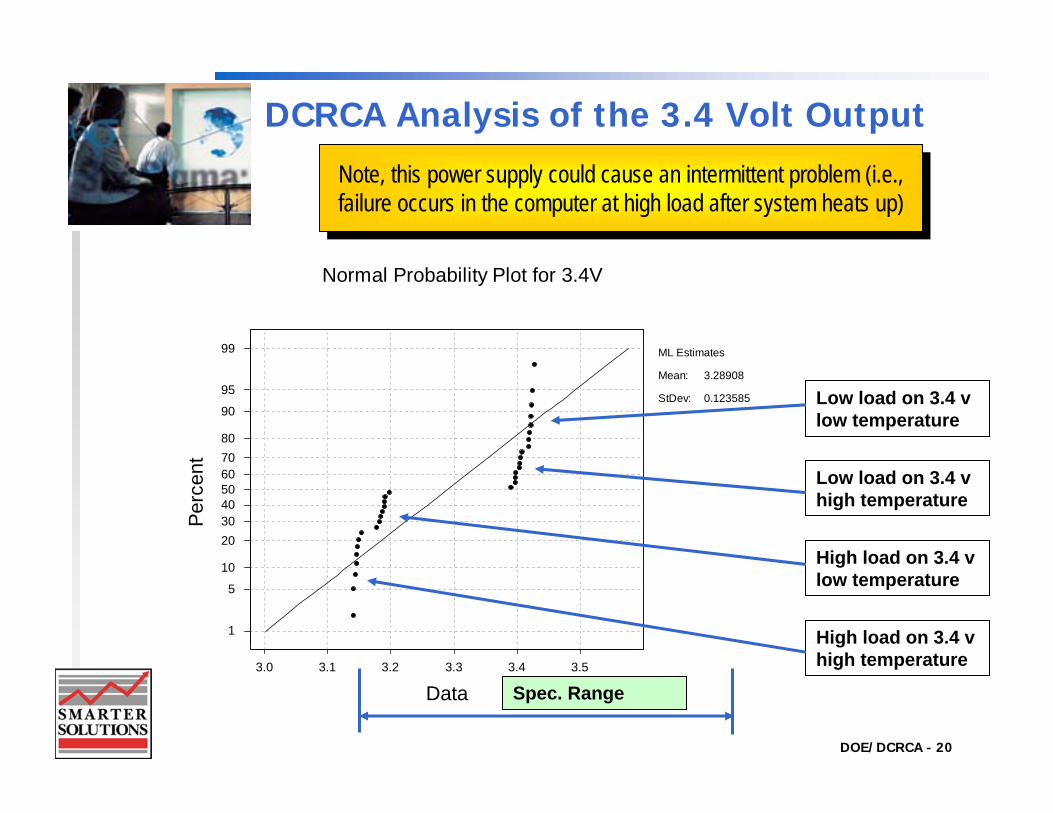
♦ Similarly to the −12-V analyses, let’s next create a probability plot of the 32 trial outputs
remembering that this plot is not a true random sample plot of the population
K -12V 3.4V- -11.755 3.1465- -11.702 3.3965+ -12.202 3.147- -11.813 3.4038+ -11.761 3.1537- -12.2 3.1861+ -12.325 3.1902+ -12.292 3.398+ -11.872 3.1498
DCRCA Analysis of the 3.4 Volt Output
DOE/DCRCA - 20
3.0 3.1 3.2 3.3 3.4 3.5
1
5
10
20304050607080
90
95
99
Data
Perc
ent
Normal Probability Plot for 3.4V
ML Estimates
Mean:
StDev:
3.28908
0.123585 Low load on 3.4 v low temperature
Low load on 3.4 v high temperature
High load on 3.4 v high temperature
High load on 3.4 v low temperature
Spec. Range
DCRCA Analysis of the 3.4 Volt Output
Note, this power supply could cause an intermittent problem (i.e., failure occurs in the computer at high load after system heats up)
Note, this power supply could cause an intermittent problem (i.e., failure occurs in the computer at high load after system heats up)

DOE/DCRCA - 21
♦ The next question of concern is whether there are any other parameters that should be considered
One possible addition to the variability conditions is circuitry drift with component age Another is variability between power supply assembly units
♦ We could use historical data to address the implication of circuit drift
♦ To address the between-assemblies condition, multiple units could have been used for this analyses
However, the test duration and resource requirements could be much larger
♦ For our test, a confirmation experiment addressed variability between units Probability plot indicated that approximately 99.8% of the population variability is within a 0.1-V range
DOE Follow-up

DOE/DCRCA - 22
♦ Some problems that escape traditional development testing can later appear as “no trouble found” issues when failing units are tested after being returned by the customer
“No trouble found” (NTF) issues can be very expensive to resolve When problems (especially NTFs) are timely detected and resolved through a DOE/DCRCA in development, much expensive future fire-fighting can be reduced or eliminated
♦ From a DOE/DCRCA qualification test process Test information can be used to determine which input parameters need to
be monitored within the manufacturing process have tightened tolerancesbe addressed in process improvement activities (e.g., through a DOE make process more robust to input parameter variation)
♦ S4/IEE DOE process optimization with DOE/DCRCA is a practical strategy for implementing parameter/tolerance design concepts
Advantages of DOE/DCRCA

DOE/DCRCA - 23
Summary
In this presentation we learned:♦ Reliability test alternatives and limitations in DFSS♦ DOE application in the verification phase of DFSS♦ Benefits of a DCRCA♦ DCRCA execution procedures


