
A Powder Diffraction Study of Problems in
PLATINUM GROUP METAL EXTRACTION

DOD DOD
A Powder Diffraction Study of Problems in
PLATINUM GROUP METAL EXTRACTION
IAN WILLIAM SANDS SMITH B.Se.(Rons.)
University of Natal, South Africa
Submitted in fulfilment of the requirements for the degree of
Doctor of Philosophy in the Department of Chemistry and Applied Chemistry,
University of Nata!'
DURBAN 1994

To Stuart

iv
ABSTRACT
The base metal and platinum group metal extractive processes for two South African
refineries were examined using x-ray powder diffraction.
Base metal refinery matte contained nickel sulphide (Ni3S2), copper sulphide (Cu2S),
nickel-copper alloy (Ni-Cu), iron oxide (Fe304) - nickel iron oxide (NiFe204) and nickel
oxide (NiO). Nickel iron oxide and cobalt sulphide (C03S4) were found in matte
aeration cavities. Matte fast cooling caused alloy zoning.
Alloy stoichiometry and weight percentages of matte constituents were calculated.
Magnetic separation of the alloy phase was unfeasible due to high bulk and poor
separation from Ni3S2. Sulphuric acid matte leaching produced residues containing
copper sulphide (Cul.SS) and nickel sulphides (Ni3S4, NiS). Potassium cyanide residue
leaching produced NiS-rich residues, while thiourea / hydrochloric acid leaching
produced residues almost free of copper sulphide.
PGM concentrates were examined. Base metals occurred as: copper sulphate
pentahydrate; copper sulphate hydroxide hydrate (CU4S04(OH)6"H20); copper sulphide
(CuS); copper platinum (Cu3Pt); nickel oxide (NiO); nickel iron oxide (NiFe204). Lead
occurred as lead sulphate and silicon as quartz and enstatite «Mg,Fe,Al)Si03). Heating
the concentrate to 260°C with sulphuric acid converted copper sulphide to copper
sulphate. PGMs were mostly metallic. Overdrying concentrates caused pgm sintering.
Drying with sulphuric acid reduced sintering.
PGM oxidative leach solubility was examined. Platinum sulphide (Pt,Pd)S caused low
platinum and palladium solubility. (Ru,Rh,Ir,Pt)AsS caused low rhodium and ruthenium
solubility. Platinum-rhodium (RhO.57Pt0.43), ruthenium-osmium (-Ru 160s), iridosmine
(Os,Ir,Ru) also caused low pgm solubility. Silver chloride remained in residues.
Concentrate overdrying produced insoluble sintered platinum, palladium monoxide, and
ruthenium dioxide.
In minor concentrates sintered platinum, rhodium selenide (RhSe2+x), ruthenium dioxide
and possibly palladium monoxide lowered pgm solubility.

v
Precipitates and salts were examined. Iron precipitated as iron oxide hydroxide
(J3-FeOOH); gold as metallic gold; lead as lead chloride. Common salts were: sodium
chloride; sodium iron hydroxide sulphate hydrate (Na2Fe(S04)z(OH)'3H20); ammonium
chloride; sodium carbonate monohydrate.
PGM-Iead fusion was examined. Fusion produced the insoluble alloy Pb(Pd,Pth.
Ruthenium dioxide reacted with lead carbonate forming lead ruthenium oxide
(Pb2Ru206.5)' Nitric acid insoluble residues also contained lead sulphate and iron oxide
(Fe30 4)'
This study demonstrated that solution problems can be understood by identifying the
crystalline insoluble phases in intractable residues.

vi
DECLARATION
I, IAN WILLIAM SANDS SMITH, declare that the work embodied in this thesis is my own
original work, except as otherwise acknowledged in the text and has not been submitted
for degree purposes at any other University.
DECEMBER 1994
I, Professor MICHAEL LAING, certify that the above statement is correct.
PROJECT SUPERVISOR

vii
Acknowledgements
I would like to express my thanks to the many people that have helped in achieving the
goals set for this project. In particular, the friendly enthusiasm, encouragement and
sound chemical advise given by my supervisor, Professor Michael Laing, are gratefully
acknowledged.
Many thanks also go to, '
Dr Terry Ashworth (BARPLATS) for initiating the project in such a positive way, for
providing all the base metal refinery samples and for an interesting plant visit;
Messrs. Western Platinum Refinery Ltd. for facilitating most of this study, and for
being so open with the supply of detailed and often confidential information which made
it possible to interpret the experimental data and achieve meaningful results;
Dr Ron Poole (WESTERN PLATINUM REFINERY) for showing such a keen interest in
continuing the project involving pgm extraction, and for two enjoyable and interesting
plant visits;
Mr George Kyriakakis, Mr Alan Keeley and Mr Bob Palmer (WESTERN PLATINUM
REFINERY) for providing so many interesting refinery samples and the necessary plant
information;
Mr Woody Aroun (DEPARTMENT OF GEOLOGy), the x-ray laboratory technician for his
friendly help and endless patience in running a diffractometer which often liked to mess
with our sanities;
Miss Fiona Graham (ELECTRON MICROPSCOPE UNIT) for her friendly expert help in
using the electron microscope;
Mr Mark Smith (BROTHER) for considerable help with the computer, and advice in
programming the analysis program 'CAPPA' used in this project;
Mrs Grace Ross (DEPARTMENT OF APPLIED CHEMISTRy) for her help with the FTIR
spectrometer;
Dr John Dunlevy (DEPARTMENT OF GEOLOGY, UDW) for allowing me to use his 'old
faithful' when our diffractometer finally packed in;

viii
Mr Josiah Ngcobo for his assistance in the lab;
The Chemistry Department (DURBAN) for providing such a pleasant enviroment;
The University of Natal (DURBAN) and the Foundation for Research Development
for financial assistance.
Finally, I would like to thank my parents for their loving assistance and encouragement in
everything I do.

CONTENTS
CHAPTER 1 INTRODUCTION
1.1 Overview
1.2 Previous Investigations
CHAPTER 2 X-RAY POWDER DIFFRACTION ANALYSIS
2.1 Introduction
2.2 Elementary Crystallographic Principles
1
2
3
3
2.2.1 The classification of crystals according to external characteristics 4
2.2.2 The classification of crystals according to internal characteristics 5
2.2.3 Describing crystallographic planes 6
2.3 The Nature and Generation of X-rays
2.3.1 Introduction
2.3.2 Characteristic x-ray radiation
2.3.3 Continuous x-ray radiation
2.4 The Diffractometer
2.5 Description of the Diffractometer System
2.5.1 Overview
2.5.2 The power supply
2.5.3 The x-ray tube
2 .5.4 The goniometer
2.5.5 The detector
2.5.6 Scan settings
2.6 Sample Preparation
2.6.1 Sample labelling
2.6.2 Sample examination and component separations
2.6.3 Sample and slide preparation
2.7 Solutions from Results
2.7.1 Introduction
2.7.2 Search manuals and powder diffraction files
2.7.3 Computer methods
8
8
8
10
10
12
12
12
12
14
16
16
16
16
16
18
18
18
19
20
ix

CHAPTER 3 PLATINUM GROUP METAL MINING IN SOUTH AFRICA
3.1 Introduction
3.2 The Reef
3.3 Ore Mining
3.4 Ore Enrichment
3.5 Recoveries
3.6 Platinum Group Metal Use
CHAPTER 4 THE BASE METAL REFINERY
21
21
22
22
22
23
4.1 Introduction 24
4.2 Overview of Mine Operations 24
4.2.1 Roasting 25
4.2.2 Smelting 26
4.2.3 Converting 27
4.2.4 Post conversion 28
4.3 Base Metal Refinery Operations 29
4.3 .1 The grinding circuit 29
4.3 .2 The nickel circuit 29
4.3.3 The copper circuit 31
4.3.4 The selenium circuit 32
4.4 The Analysis of Nickel-Copper Concentrate 32
4.5 Comment on Matte Phases 47
4.5 .1 The nickel sulphide phase 47
4.5.2 The copper sulphide phase 48
4.5.3 The nickel copper alloy 48
4.5.4 The iron oxide-nickel iron oxide phase 48
4.5.5 The nickel oxide phase 49
4.6 Microscopic Examination of Matte Phases 49
4.7 The Magnetic Separation of Matte 52
4.7.1 The slow cooling of matte 54
4.7.2 Determination of the stoichiometry of the matte alloy 56
4.7.3 Determination of the weight percentage of matte alloy 58
4.7.4 Determining the success ofa magnetic separation 59
4.8 Analysis of First Stage Leach Residue 64
4.9 First Stage Leach Residue Phases 72
4.9.1 The nickel sulphide phases 72
4.9.2 The copper sulphide phase 75
x

CHAPTER 5 THE PLATINUM GROUP METAL REFINERY
5.1 Introduction
5.2 Overview of PGM Refinery Operations
5.2.1 PGM concentrates
5.2.2 Concentrate pre-treatment 5.2.3 The RCVCl2 oxidative leach
5.2.4 Removal of hydrous oxides
5.2.5 Gold extraction
5.2.6 Ruthenium extraction
5.2 .7 Platinum extraction
5.2.8 Palladium extraction
5.2.9 Iridium extraction
5.2.10 Rhodium extraction
5.2.11 Resolubilisation
5.2.12 Lead fusion
5.3 Concentrate Problems
5.3.1 Composition of concentrates
5.3.2 Sintering of the PGM residue in normal concentrates
5.4 Base Metal Problems
5.4.1 The iron problem
5.4.2 The nickel problem
5.4.3 The copper problem
5.5 Oxidative Leach Problems
5.5.1 Introduction
5.5.2 Low ruthenium solubility
5.5.3 Low osmium solubility
5.5.4 Low rhodium solubility
5.5.5 Low iridium solubility
5.5.6 Low palladium solubility
5.5.7 Low platinum solubility
5.5.8 Low silver solubility
5.5.9 Other insolubles
5.6 Lead Fusion Problems
5.6.1 Introduction
5.6.2 PGM and lead insolubility
5.7 Gold Problems
5.7.1 Gold-rich precipitates
5.8 Residue and Precipitate Washing
76
77 77
77 78
78
78
79
79
79
80
80
81
81
81
81
82
86
89
101
108
125
125
125
142
144
158
161
163
180
183
189
189
189
202
202
204
xi

xii
CHAPTER 6 CONCLUSIONS
6.1 Converter Mattes 211
6.2 First Stage Leach Residues 212
6.3 Base Metals in Normal (or Major) Concentrates 212
6.4 Other Impurities in Normal Concentrates 212
6.5 PGMs in Normal Concentrates 212
6.6 Oxidative Leaching of Normal Concentrates 213
6.7 Oxidative Lea~hing of Over dried Normal Concentrates 213
6.8 Oxidative Leaching of Minor Concentrates 214
6.9 Precipitates and Salts 214
6.10 The Lead Fusion Process 215
Summary Diagrams 216
REFERENCES AND NOTES 221
APPENDIX 1 : Cohen's least square method 229
APPENDIX 2 : Isolation of the alloy phase 231

) DOD CHAPTER 1
INTRODUCTION DOD
1
1.1 OVERVIEW
This project was initiated by the South African base metal and platinum group metal
refinery BARPLATS, which was being run largely on the basis of overseas research done
by the Sherritt Gordon Group. Interest was shown in using x-ray powder diffraction to
analyse more completely the nickel-copper concentrate they were processing. In
addition, the idea of magnetically separating this concentrate had been proposed and a
feasibility study was required. Also requiring analysis were some leach residues and
leaching processes. Unfortunately due to economic and geological factors the mine
supplying nickel-copper concentrate to BARPLATS was forced to close. This led to the
take-over and closure of the base metal refinery shortly after the commencement of this
project.
WESTERN PLATINUM REFINERY was then approached and showed an interest in a project
aimed at solving some of the problems occurring in the platinum group metal extraction
process at their refinery, focusing mainly on pgm solubility in the oxidative leach. To
this end, process samples (some with elemental analyses) were to be provided for
examination. As the study developed, clear links between base metal refinery operations
and platinum group metal refinery operations emerged. The initial part of the project
performed for BARPLATS, which focused on base metal refining, thus greatly assisted in
explaining observations that otherwise would have remained a mystery.

2
1.2 PREVIOUS INVESTIGATIONS
Although much work has been done investigating base metal operations using x-ray
powder diffraction (1), every refinery seems to have quite different ratios of base metal
phases present in concentrate and residue samples. As these ratios playa major role in
determining leaching characteristics, accurate analyses of the concentrates remain an
important part of optimizing leach processes.
Relatively little has been done in the area of platinum group metal extraction. The low
crystallinity of refinery samples imposes severe limits on the x-ray powder diffraction
method. These difficulties are only overcome by comparing the analyses of numerous
samples and persistently searching for inoganic and mineral phases that make chemical
sense and explain observed facts .
Prior to this present study, a limited investigation of the phases occurnng In the
extractive process had been performed for WESTERN PLATINUM REFINERY. Although
several samples were analysed, only one pgm phase was assigned. The report ended
with the comment, 'There appears to be scope for much more detailed work on the
nature and composition of the platinum [group metal] phases present.'
As many extraction problems remained unresolved, a more thorough investigation
remained a priority. The aim of this second study has thus been to determine the 'nature
and composition' of phases causing 'probleIPs in platinum group metal extraction.

DOD CHAPTER 2
X-RAY POWDER DIFFRACTION ANALYSIS
DOD
2.1 INTRODUCTION
3
The analytical method of x-ray powder diffraction makes use of the interference patterns
produced when x-rays are scattered by the regular arrays of atoms present in crystalline
powders. The atomic and structural uniqueness of every known compound has the
important analytical implication that a unique x-ray diffraction pattern exists for all
known pure substances possessing some degree of crystallinity. Knowing these patterns
allows a qualitative analysis of phases in mixtures to be performed simply by comparing
the observed pattern from the mixture with the patterns of known standard compounds.
Two important subjects involved in the use of the powder diffraction method are:
Elementary crystallographic principles, and
The nature and generation of x-rays.
2.2 ELEMENTARY CRYSTALLOGRAPHIC PRINCIPLES (1)
The packing of ions, atoms or molecules into ordered three-dimensional arrays usually
bounded by well-defined flat planes is known as crystallization, and the solids produced
are known as crystals. The huge variety of crystals of various morphologies formed by
this process necessitates some kind of classification.

2.2.1 THE CLASSIFICATION OF CRYSTALS ACCORDING TO EXTERNAL CHARACTERISTICS
4
For morphologically similar crystals of a given crystalline material it is noted that the flat
planes bounding the crystal are orientated and inclined such that the angles between
related intersecting planes are always the same. The first classification system is based
on the axes required to describe these planes and their angles of intersection. Only
seven categories, known as the seven crystal systems, are needed to classify every
known crystal. Table 2.2.1-1 lists these systems where a, band c denote the lengths of
each axis as related to the others; and a., ~ and y denote the angles between the blc, alc,
and alb axes respectively. The equalities listed are the minimum required for the
symmetry of the system. For example, it is possible for a crystal oftriclinic symmetry to
have a=b=c and a.=~=y=90° purely by chance.
Table 2.2.1-1 The Seven Crystal Systems
Crystal System Axes Angles of Itercepts Abbreviation
Cubic a=b=c a.=~=y=90° Cub. Tetragonal a=b:;t:c a.=~=y=90° Tet. Hexagonal a=b:;t:c a.=~=90° y=120° Hex. Rhombohedral a=b=c a.=~=90° y=120° Rhom.
(or Trigonal) (or a.=~=y:;t:900)
Orthorhombic a:;t:b:;t:c a.=~=y=90° Ortho. Monoclinic a:;t:b:;t:c a.=y=90° p:;t:90° Mono. Triclinic a:;t:b:;t:c a.:;t: P:;t:y:;t:90 0 Tri.
A second more accurate way of classifying crystals based on their external idealized form
has been devised using the elements of symmetry : reflection and rotation. Defining
certain minimum symmetries, expressed by n-fold rotation axes, n-fold rotation/inversion
axes and reflection (or mirror) planes, 32 classes, known as the 32 point groups have
been established, each of which relates to one of the seven crystal systems. The 32 point
groups are however rarely used in qualitative x-ray powder diffraction analysis.

5
2.2.2 THE CLASSIFICATION OF CRYSTALS ACCORDING TO INTERNAL
CHARACTERISTICS
Another approach in the classification of crystals involves a consideration of their internal
rather than external order. Here, the emphasis is on the repetitive atomic arrangement
within the crystal.
An array of points can be mathermatically defined such that each point has an identical
spacial enviroment. Such an array is termed a lattice. In three dimensions it has been
shown that there are only 14 unique arrays. These are known as the 14 Bravais
lattices. Each of these lattices is defined by a simple space-filling subunit known as the
unit cell, which when translated in three-dimensional space, parallel to its axes produces
the entire lattice structure.
The ordering of the atoms, ions or molecules in crystals corresponds to such arrays,
although it is not required that an atom, ion or molecule be situated exactly on each
lattice point.
Externally all unit cells are related symmetrically to the seven crystal systems discussed
earlier. Seven additional unit cells are however required to fully describe the hidden
internal structure of crystals. These are known as non-primitive unit cells and differ
from primitive unit cells in that they contain more than one lattice point per cell. A
primitive unit cell thus has lattice points positioned at each cell corner, while a non
primitive unit cell can have an additional lattice point positioned at the cell centre (body
centred), or on two opposite faces (end-centred), or on each face (face-centred).
Table 2.2.2-1 relates the seven crystal systems to the unit cells of the 14 Bravais lattices.
See also Figure 2.2.2-1 .

6
Table 2.2.2-1 Unit cells of the 14 Bravais lattices
Crystal System Unit cell type Symbol
Triclinic Primitive p
Monoclinic Primitive P End-centred C
Orthorhombic Primitive P End-centred C Body-centred I Face-centred F
Hexagonal Primitive P Rhomohedral Primitive P Tetragonal Primitive P
Body-centred I Cubic Primitive P
Body-centred I Face-centred F
The increased complexity introduced by considering the internal ordering of the contents
of the unit cell in terms of two additional elements of symmetry (screw rotation axes and
glide reflection planes) is reflected in an internal symmetry which now requires 230 space
groups to classify each possible case uniquely. These space groups define all the
possible ways identical entities may be arranged in the 14 Bravais lattices. Fortunately,
these space groups are hardly ever used in qualitative x-ray powder diffraction analysis.
2.2.3 DESCRIBING CRYSTALLOGRAPHIC PLANES
Having classified the three dimensional structure of crystals it becomes important to have
some way of describing imaginary planes on which the atoms of crystals may lie. In
order to express the differring orientations and distances between families of parallel
planes, a reference system based on the unit cell is used. If a unit cell having edge
lengths of a, band c is intersected by a family of planes that are parallel and a set distance
apart, then the number of divisions such a family produces along each unit cell axis length
is used to identify the family of planes. A bracketed three digit number, known as the
Miller index, is used to represent such a family. For example, the Miller index (234) is

c
c
4
c
8
12
c
b
a " --~---- --5
c
2
13
I ' II
/1 1/ " ,
c ' 'y{ / " II ,',
/ 1 , 1/ \
I< .' b \
6
c
10
c
3
7
11
14
Figure 2.2.2-1 Unit Cells of the 14 Bravais Lattices (1)
1 Triclinic P 5 Orthorhombic C 9 Rhombohedral P
13 CubicI
2 Monoclinic P 6 Orthorhombic I
10 Tetragonal P 14 Cubic F
3 Monoclinic C 7 Orthorhombic F
11 Tetragonal I
4 Orthorhombic P 8 Hexagonal P
12 CubicP
7

8
taken to mean a family of parallel equidistant planes that, on passing through the crystals
unit cell, produces 2 divisions along the a axis, 3 divisions along the b axis and 4
divisions along the c axis (note that the order of the numbers in the Miller index follows
the order abc) (Figure 2.2.3-1(a»). A zero digit indicates that the family of planes is
orientated parallel to the axis indicated by the zero. For example, (101) planes produce
one division along the a axis and one division along the c axis and are orientated parallel
to the b axis (Figure 2.2.3-1(b»). In practice, Miller indices are important because they
are used to calculate unit cell dimensions. They are also used for labelling diffraction
peaks.
2.3 THE NATURE AND GENERATION OF X-RAYS (2)
2.3.1 INTRODUCTION
X-rays form the band of electromagnetic radiation falling in the wavelength range 0.1 -
100A (IA = lO-lOm). They are produced whenever matter is bombarded with high
energy electrons. X-rays used for diffraction analysis commonly have wavelengths of
about 0.5 - 2.3A and are generated in evacuated tubes containing an anode, known as the
target, and a cathode. A high potential difference (35 - 90kV) is applied between these
electrodes so as to accelerate a stream of electrons, produced by a heated tungsten wire,
towards the anodic target.
2.3.2 CHARACTERISTIC X-RA Y RADIATION
If an electron from one of the inner shells of the atoms making up the anodic target is
ejected by one of the high speed electrons, an unstable cation having an inner shell
vacancy is produced. A series of electronic transitions followed by electon capture now
occur which ultimately retunis the unstable cation to a ground state atom. Each
transition is accompanied by the emission of an x-ray photon of energy equivalent to the
difference between the binding energies associated with the shells involved. The
energies of such photons are high (short wavelength), of very specific wavelengths, and
form what is known as characteristic radiation. The three most important electronic

9
y
Figure 2.2.3-1(a) Family of planes having Miller indices (234)
z
b y
Figure 2.2.3-1(b) Family of planes having the Miller indices (101)

10
shells involved in x-ray emission have the principal quantum numbers 1, 2 and 3. These
are usually referred to as the K, Land M shells respectively (see below).
NUCLEUS K shell n=1 s orbital 1 level (K)
L shell n=2 sand p orbitals 3 levels (LI II III) , ,
M shell n=3 s, p and d orbitals 5 levels (MI II III IV v) , , , ,
Only a limited number of transitions are allowed under the quantum-mechanical selection
rules and so the x-ray emission spectrum for the target is relatively simple. Each
transition is given a three symbol label indicating the shell of the vacancy (K, L, M etc.),
the shell of the outer electron filling it relative to the first shell (a, p, y etc.) and a
numerical subscript denoting the intensity of the transition radiation (1 > 2 > 3 etc.).
Some important transitions are :
Kat LIII~K Lal Mv~LIII
Ka2 LII~K La2 MIV~LIII
KJ3t MII~K LPI MIV~LII
2.3.3 CONTINUOUS X-RA YS
Continuous x-ray radiation originates quite differently but is not used in powder
diffraction analysis, being polychromatic and of relatively low intensity. It is however of
value for the study of single crystals by the Laue method.
2.4 THE DIFFRACTOMETER (3)
A diffactometer is an instrument which allows a sample to be irradiated with a
monochromatised x-ray beam while recording reflected beams using a detector. For
powder diffractometers the sample is finely powdered, producing crystallites orientated in
every possible direction. On irradiation with monochromatic x-rays, the regular arrays
of atoms in each crystalline phase diffract the incident beam into many reflected beams
which are reflected out in all directions. The intensities of these beams are not equal, the

11
differences being determined by the arrangement of the atoms in the unit cell. For
constructive interference to occur for a set of planes of interplanar spacing d, and Miller
indices (hid), the following simple condition, known as the Bragg equation, has to be
met :
where
nA. = 2dsin8
n = order of reflection (1 in almost all cases) (unitless)
A. = wavelength of the incident monochromatic x-ray (A)
d = interplanar or d-spacing of the diffracting planes in the crystal (A)
8 = angle of incidence (and reflection) between the crystallographic planes
and x-ray beam (degrees)
Using this condition the direction (angle) of each intense reflected beam can be related to
the interplanar spacings, d, and unit cell dimensions a, b, c, cr, Band y of a crystal. As
the crystals of each compound have numerous crystallographic planes separated by
different interplanar distances and orientated in various directions, each compound
generates a unique set of constructivly reinforced reflections that can be detected by
rotating a detector around the irradiated powder sample.
X-ray powder diffractometers are expensive and complex instruments being made up of
many sub-components. Typical components of a diffraction system are listed below.
1. Stabilized high-voltage AC power supply
2. DC power supply
3. Water supply
4. High intensity x-ray tube
5. Multi-sample chamber that can be evacuated
6. Goniometer for measuring diffraction angles
7. Detector for diffracted beams
8. A scaler, amplifier, analyser and recorder for the detected signals
9. A dedicated computer system for control of the goniometer and storage
and analysis of the measured data.

12
The following section describes the powder diffractometer system used to collect the
data used in this project.
2.5 DESCRIPTION OF THE DIFFRACTOMETER SYSTEM
2.5.1 OVERVIEW
A Philips PW 1710 APD (automated powder diffractometer) direct recording powder
diffraction system was used (Figure 2.5-1).
2.5.2 THE POWER SUPPLY
The PW 1710 APD system was powered by a PW 1730 high-performance generator.
2.5.3 THEX-RAYTUBE
A Philips PW 2256/20 (Version A - with a PW 1316 tube shield) cobalt tube was used.
This had a cobalt anodic target set to earth and gave a broad focus beam with a focal
spot measured at the anode of 2 x 12mm (focal area 24rnrn2) . The maximum output
power rating for the tube was 2700watt at constant potential with a specific loading of
112wattlmm2. This tube was operating at 40kV, well within the maximum allowable of
60kV. The current used was 30rnA. This target produced x-ray emission spectra with
the following characteristics :
CONTINUOUS SPECTRUM
The continuous spectrum (white radiation) had a short wavelength limit, AQ, of 0.31 00A.
The wavelength of maximum intensity, Ama'\{, was 0.4649A.
CHARACTERISTIC SPECTRUM
Cobalt targets have a critical excitation potential of 7.71 k V above which they emit
radiation of the following wavelengths :

TERMINAL
WATER ~
SUPPLY ..
I FILE STORAGE I COMPUTER SYSTEM
AMPLIFIER, SCALER, SELECTOR, RATE METER
PW 1710 APD
PW 2256/20
CO X-RAY TUBE
jl'
PW1711/10 PROPORTIONAL
DETECTOR
t PW 1050/81
PW
--1 SAMPLE f 1170/10
-I SAMPLE
VERTICAL CHANGER GONIOMETER
PW 1730 HIGH VOLTAGE
GENERATOR
DIFFRACTOMETER SYSTEM
13
~ . PRINTER I
~ PLOTTER I
POWER SUPPLY
Figure 2.5-1 Schematic diagram of the Powder Diffraction System

Kal ')... = 1.78892A
')... = 1.79278A
')... = 1.62079A
14
(Kal 2 or Ka : ')... = 1.79026A) ,
The wavelength used by the computer system to convert the diffraction angle 28,
measured in degrees, into d-spacings, measured in Angstroms, was 1.78894A. The
equation for converting diffraction angles (28) into d-spacings (d) is thus (§ 2.4) :
d (A) = 0.89447 / sin (28 /2)
while that for converting d-spacings (d) into diffraction angles (28) is :
28 (degrees) = 2 x arcsin(1.78894 / (2 x d)) d~28
The anode was cooled by a continuous flow of water (about 3.5 Vrnin).
The CoK~ 1 radiation was removed by a graphite monochromator positioned in the
diffracted beam.
A cobalt tube was chosen because :
1) The longer Ka wavelength allows larger d-spacings to be measured.
2) The Ka radiation does not cause iron to fluoresce.
3) The longer wavelength is scattered better by softer materials.
2.5.4 THE GONIOMETER
A vertical Philips PW 1050/81 goniometer was used. This had a 50Hz synchronous
motor drive and was fitted with an automatic Philips PW 1386/55 theta-compensating
divergence slit which ensured a fixed area of sample was irradiated by the x-ray beam at
all diffraction angles (28), thereby enhancing the intensities of diffracted beams at high
diffraction angles, which are normally weak. This also resulted in low background at
low diffraction angles and good peak to background ratios.

15
It is important to note that as an automatic divergence slit (ADS) was used in the data
collection, the relative intensities of diffracted peaks will differ considerably from those
that would be measured using a fixed divergence slit (FDS). An ADS gives higher
intensities at high angles and lower intensities at low angles relative to those measured
with a FDS. Thus the relative intensities observed with this system often differed
considerably from those in the standard Powder Diffraction File (§ 2.7.2)_
The conversion equation (which assumes that intensity varies linearly with the divergence
of the x-ray beam) is given below (4) :
where
IF = (0.20268 x D x I~ / (sin (11.16 + ((79 x 8) / 90 » - 0.19355)
IF = intensity using a fixed divergence slit
D = fixed slit divergence in degrees (eg. Ylo, 1°, 2°, 4°)
I A = intensity using an automatic divergence slit
8 = 28 / 2
This equation can be used when comparing observed data with data of a standard file
pattern measured using a fixed divergence slit. The value of D is however usually not
quoted, and so has to be derived by comparison.
The goniometer was regularly aligned using quartz powder as a standard, the scan being
run from 5 - 30°. Quartz (a-Si02, low) gives peaks at the following d-spacings in this
range: 1) 4.26 A 2) 3.343 A
Relative intensity 35 Relative intensity 100

16
2.5.5 THE DETECTOR
A Philips PW 1711/10 proportional detector equipped with a sealed xenon detector
chamber was used. This detector had an entry window of beryllium 300J..lm thick. The
counting gas was a mixture of xenon (97%) and carbon dioxide (3%). A 60 x charge
preamplifier gave an overall counting efficiency for cobalt radiation of 88%.
The pulse-height descrirninator window was set at 35 - 70% so as to prevent sample
fluorescence and background tube radiation of low wavelength from increasing the
counts of the recorded pulses.
2.5.6 SCAN SETTINGS
Scans were run from 28 = 5.010 to 120.010° (d = 20.465 to 1.033A) using step sizes of
6.66s 1 degree (28) and 5.00s 1 degree (28). Peak positions were taken as the peak
maxima. The minimum peak significance was set to 0.75.
2.6 SAMPLE PREPARATION
The only real criteria for a sample to be analysable with XPD is that it should be in
powder form (if not metallic) and have some degree of crystallinity. A few important
considerations on sample handling and preparation as performed are given below.
2.6.1 SAMPLE LABELLING
Every sample was labelled chronologically as received with a simple unique source and
number code.
2.6.2 SAMPLE EXAMINATION AND COMPONENT SEPARATIONS
Each sample was mixed well and divided into two parts, one being retained as
representing the sample as received. The other part was examined physically and
chemically.

17
In several cases, physical examination allowed the removal of crystals which had formed
in the sample on drying, and the separation of large alloy crystals or granules. Strongly
magnetic particles usually indicated the iron oxide Fe304. The diffraction pattern of th~
non-magnetic fraction was far simpler to interpret, as most of the iron oxide peaks were
now removed.
Sometimes salts not completely removed by residue washing at the plant produced peaks
which severely interfered with peaks due to other phases. In such cases, simple washing
and mild drying gave satisfactory results. Drying of residues at the plant sometimes
gave samples containing soluble salts detectable at the 1 to 2% level.
Some samples could be separated into fractions of different sizes by sorting, or settling
techniques in water or organic solvents. (With inert powders such as pgm residues
flotation methods can also be used.) In most cases these fractions produced dissimilar
scans. On occasions large silvery alloy granules were detected and removed from the
sample and scanned separately. Some were examined under a scanning electron
microscope possessing a microprobe analyser, to identify the elements present.
Thermal decomposition of components of a sample sometimes yielded valuable clues as
to the exact identity of the phases present.
generally easy to identify using XPD.
Thermal decomposition products are
Leaching with various reagents is a favoured method of component separation in XPD
analysis . For most pgm residues however this method could not be used as residue
components were quite inert and generally insoluble in everything. Concentrated
(fuming) acids were sometimes used to chemically attack certain alloy phases. Flux
dissolution methods were also used in rare cases.

18
Drying at higher than normal temperatures (-250°C) was found to improve the quality
and resolution of peaks corresponding to alloys because the process of sintering partially
melted fine alloy particles, resulting in crystal growth.
2.6.3 SAMPLE AND SLIDE PREPARATION
When samples were not fine homogeneous powders, they were powdered with a clean
acetone-washed agate pestle and mortar. The method used for powdering is important.
Crushing granules so as to fracture them was preferred over grinding, as shearing forces
sometimes led to crystalline disorder (5) . PGM residues are generally extremely fine
black powders and so crushing is not important unless the sample has been dried as a
cake and broken up. In some cases sample powdering was observed to greatly affect the
intensities of peaks, especially those of the iron oxide Fe304. The powdered sample was
mounted in a clean flat-bed aluminium slide by pressing a portion of powder into the
rectangular cavity. Glue was smeared on the base plate to secure the compressed
powder cake. Surface irregularities were avoided by pressing with a microscope slide.
(Smoothing is not recommended, as some crystalline particles can be plate-like, and
smoothing therefore causes preferred orientation. This leads to some basal reflections
having exaggerated intensities.) The thickness of mounted samples was 1.0mm in all
cases.
Normally internal standards such as silicon dioxide are used to calibrate measured
d-spacings. As most pgm residues contain silicon oxide, calibration was automatically
achieved.
2.7 SOLUTIONS FROM RESULTS
2.7.1 INTRODUCTION
After the sample had been scanned, and the diffractometer system had stored the scan
data in a computer file, hard copies were produced as a data listing and a plot of the
diffractogram. The relative intensity values were invaluable in making qualitative

19
compansons. The horizontal axis could be plotted as d-spacings or diffraction angles,
calibrated in Angstoms or degrees respectively. Diffraction angles in degrees were more
practical as the peaks were better spaced across the axis. This made comparisons a lot
easier.
The data listing contained such information as peak diffraction angles (28), peak counts
and background counts, d-spacings, and relative integrated intensities.
2.7.2 SEARCH MANUALS AND POWDER DIFFRACTION FILES
In principle, once the diffraction data for a sample has been collected, the process of data
analysis can begin. Data analysis can be approached in several different ways. The
most common method is to use search manuals (6) to match observed peaks to reference
data. Such manuals constitute various indices, some of which are based on compound
type (eg. oxide, sulphide), while others are based on the d-spacings of the three or four
most intense peaks given by the pure compound.
Every index entry gives eight or ten d-spacings corresponding to the eight or ten most
intense peaks given by the compound. All other information is obtainable from a
powder diffraction card, the number of which is referenced with the entry. These cards
are contained in bound volumes and give such data as peak d-spacings, intensities and the
Miller indices of the plane(s) of origin; crystallographic data such as the space group,
lattice parameters, interaxial angles, calculated density and number of formula units per
unit cell; and other information such as colour, and melting point. The data source is
usually given.
Once a family of peaks has been identified, a second family of peaks from the remaining
lower intensity peaks is searched for (allowing for overlap), and so on until all peaks
have been assigned. In scans from mixtures containing several components, it is easy for
incorrect families of peaks to be chosen. This makes the analysis of mixtures difficult.

20
In such cases several attempts at component separation are made, until solutions are
derived from additional scans that satisfy the samples elemental analysis, make chemical
sense, and explain observations.
Another approach involves matching peaks with one of the unit cell types (eg. cubic,
tetragonal etc.) and calculating the unit cell dimensions. Indices are available that are
categorised according to unit cell type and parameters.
All the above methods were used where appropriate.
2.7.3 COMPUTER METHODS
Computer search programs and diffraction data libraries are available, but solutions
yielded by such programs can be totally incorrect and misleading. The specific needs of
a particular user might not be met by commercially available programs due to inherent
inflexibilities, although the situation is improving.
The programming of an analysis program specific to the needs of a project, with a
selected compound library, sample scan filing capabilities and numerous graphical
manipulation techniques (such as superimposing, shifting and matching) is often more
fruitful.
In this study, all fits were initially made by hand, comparing observed d-spacings and
intensities with those in the Powder Diffraction File. The peaks of low intensity for each
phase were then fitted using an analysis program created specifically for this project.
This approach was found to be remarkably efficient because of the limited number of
phases invoved.

DOD CHAPTER 3
PLATINUM GROUP METAL MINING IN SOUTH AFRICA
DOD
3.1 INTRODUTION
21
This chapter provides an overview of platinum group metal mining in the South African
context. Informational sources are given under REFERENCES AND NOTES
(CHAPTER 3).
3.2 THEREEF
The pgms are mined almost solely from a 2 billion year old igneous assemblage occurring
in the central Transvaal known as the Bushveld Igneous Complex. This is the largest
known magmatic ore deposit (460km from the extreme western to eastern outcrops, and
250km from the extreme northern to southern outcrops) containing the worlds greatest
reserve of the pgms, chromium and vanadium, and large amounts of nickel, copper and
Iron. The richest sections of the complex are chromitite seams with high associated
levels of sulphide minerals. The two most important chromitite seams are known as the
Merensky Suite and the UG-2 Reef (Upper Ground 2) which occur at depths of between
1100 and 1400m below ground (the Merensky Suite is actually two close chromitite
seams) . Rock temperatures at these levels range from 43 - 49°C. The UG-2 reef is
found between 15 and 370m below the Merensky Suite and contains 50% of the pgm
resources of the complex. The pgm ratios of the two seams are markedly different :
Merensky Suite UG-2 Reef
PGMRATIOS Pt Pd Rh Ru 100 42 5 14 100 46 19 29
Ir 2 5

22
The chromitite seams are predominantly chromite (FeCr204). Just above these seams
occur the highest levels of sulphide minerals which are mainly chalcopyrite (CuFeS2),
pyrrhotite (FeS), pentlandite (Fe,Ni,Co)9Sg and pyrite (FeS2)' Minor sulphides are
bornite (CusFeS4)' millerite (NiS) and galena (PbS). The highest concentration of the
pgms occurs in these sulphide bands, either as solid solution or as tiny particles (pgm
levels are close to zero outside these bands). The main pgm minerals are braggite
«Pt,Pd,Ni)S), cooperite «Pt,Pd)S), laurite «Ru,Os,Ir)S2), vysotskite (PdS) and
platinum-iron alloy (Pt-Fe) . The mined ore contains 6-8 ppm (gltonne) pgm + Au. The
UG-2 reef has just over one, to one and a halftimes higher pgm levels than the Merensky
Suite but lower levels of nickel and copper.
considerably higher.
3.3 ORE MINING
The nickel to copper ratio is also
The Merensky Suite has a high degree of width and dip uniformity and is relatively free
from geological disturbances. Standard mining techniques are thus used. 95% of the
reefis extracted, 5% of the reef body being left in place as mine support pillars.
3.4 ORE ENRICHMENT
Mined ore is enriched physically by flotation, after crushing and milling. . The sulphide
minerals respond well to normal sulphide flotation methods. The flotation concentrate
constitutes 4 - 5% of the mined ore. Pyrometallurgical enrichment involves smelting and
converting the extracted sulphide minerals.
3.5 RECOVERIES
95% of the available reef is extracted by mining. 4 - 5% of this ore is extracted by
flotation representing a recovery of 85% of the original ore nickel, copper and pgm
content. Over 95% of the metal content of the flotation concentrate is recovered during
smelting and converting. The base metal refinery extracts about 98% of the nickel and
copper from converter concentrate and 96% of the pgms are recovered in the pgm

23
concentrate. The platinum group metal refinery recovers 98% of the pgms from base
metal refinery pgm concentrate. Thus about 25% of the pgm content of the original
mined ore is lost.
3.6 PLATINUM GROUP METAL USE
Uses of the pgms are many and varied. The table below lists these in order of current
importance together with the general demand for each metal in each sector.
Table 3.6-1 Uses of the Platinum Group Metals
Automobile exhaust catalysts variable Petroleum reforming, refining and isomerization Pt Rh Pd Ir Ru Electrical equipment Pd Pt Rh Ir Ru Industrial chemical synthesis (RN03, catalysts) Pd Pt Rh Ru Ir Ceramics and Glass (incl. glass fibre production) Pt Rh Pd Ir Ru Jewellery Pt Pd Rh Ir Ru

DOD CHAPTER 4
THE BASE METAL REFINERY DOD
4.1 INTRODUCTION
24
The base metal refinery plays an important (although often overlooked) role in platinum
group metal extraction, forming the link between the mine and the platinum group metal
refinery (Figure 4.1-1). As will be demonstrated in the next chapter, many of the most
serious extraction problems faced by the platinum group metal refinery have their origins
in base metal refinery processes. This chapter presents the results of an examination of
these processes using the analytical method of x-ray powder diffraction.
4.2 OVERVIEW OF MINE OPERATIONS (1 , 2, 3, 4, 4a)
The base metal refinery (HMR) depends entirely on the ore concentrate produced and
supplied by the mine. The purpose of this section is thus to give an overview explaining
the various operations leading to the production of this concentrate, known as matte.
The concentrate produced at the mine differs greatly from the mined ore, being the result
of various physical and chemical ore enrichment processes. These are aimed at the
separation of the valuable components from the rock matrix, and the conversion of these
components into metal-rich species or to the impure metals themselves. When nickel
copper sulphide ores are involved the final three pyrometallurgical extractive processes
taking place at the mine are roasting, smelting and converting. It is important to

24a
REEF
MINE ..
~
Ni-Cu CONCENTRATE (MATTE)
r NICKEL SULPHATE
HEXAHYDRATE
BASE METAL --. REFINERY
I I COPPER
PGM CONCENTRATE
•
PLATINUM GROUP METAL REFINERY
I PLATINUM II RHODIUM I I RUTHENIUM II GOLD I
I PALLADIUM II IRIDIUM I I OSMIUM II SILVER I
Figure 4.1-1

25
consider these three processes in some detail because the species finally encountered in
matte derive from them.
4.2.1 ROASTING
The main aim of roasting concentrated ore is to remove as much sulphur as possible and
to selectively convert about half the iron sulphide present to iron oxide. At the typical
roasting temperature of 760°C all the base metal (nickel, copper and iron) sulphides are
unstable with respect to their oxides in the presence of oxygen. Iron however has a far
greater affinity for oxygen than nickel or copper. The following exothermic reactions
can therefore take place :
4 FeS + 7 O2 ~ 2 Fe203 + 4 S02
3 FeS + 5 O2 ~ Fe304 + 3 S02
2 FeS + 3 O2 ~ 2 FeO + 2 S02
hematite formation
magnetite formation
wustite formation
These are simplified reactions as iron sulphide (FeS) is actually the mineral pyrrhotite,
better formulated Fe7Sg, and all reactions proceed through the unstable and quickly
decomposed sulphate Fe2(S04h (Tdec.= 710°C). The oxide species of iron produced
are critically dependant on the gaseous composition inside the roaster and on the
temperature, higher roasting temperatures favouring magnetite followed by wustite
formation. The three main parameters defining the conditions of the roast are :
1) temperature
2) time of heating
3) Po Ipso ratio of the roast atmosphere 2 2
The oxidation of copper and nickel sulphides is much less favourable as the oxides have
much higher free energies of formation, and so reactions terminate once the metal-rich
sulphides have been formed .
F or example :
2 CuS + O2 --+ CU2S + S02 termination reaction
2 CU2S + 3 O2 --+ 2 CU20 + 2 S02 energetically unfavourable

26
A second consequence of roasting is that some elements can be partially or entirely
removed from the charge because their oxides are volatile. Examples are :
arsemc 2 As2S3 + 9 02 ~ 2 As20 3 + 6 S02
4 AsS + 7 O2 ~ 2 AS20 3 + 4 S02
antimony 2 Sb2S3 + 9 O2 ~ 2 Sb20 3 + 6 S02
ZinC 2 ZnS + 3 O2 ~ 2 ZnO + 2 S02
Other oxides are not volatilized, as is the case for bismuth:
bismuth
The roasted concentrate is known as calcine.
4.2.2 SMELTING
The purpose of smelting is to collect the iron oxides formed during roasting and other
undesired species into a slag. The charge is melted in an electric arc smelter or flash
smelted at temperatures from 1230°C to 1500°C (according to calcine constituents).
These high temperatures are necessary for the melting of the nickel sulphides. A silica
flux (Si02) is added, this acting as an acidic collector of the basic iron oxides. The
percentage of each iron oxide present depends on the conditions of the roast. The
hematite (Fe203) present passes very quickly into the slag; the magnetite (Fe304) less
so. On liquification the melt separates over time into two immiscible liquid layers. The
upper layer constitutes the slag, which is mainly iron silicate (fayalite : Fe2Si04 or
2FeO'Si02) formed by the following acid-base reaction :
fayalite formation
Silica reacts with all basic and amphoteric oxides present in a similar way, although it
should be noted that magnetite (Fe304) needs to be reduced to wustite (FeO) before
removal into the slag layer can occur :
3 Fe304 + FeS ~ 10 FeO + S02
2 FeO + Si02 ~ Fe2Si04
The lower layer constitutes the smelter matte and is a highly concentrated mixture of
base metal sulphides. The remaining iron sulphide is important as any copper or nickel

27
oxides that might have formed and passed into the slag are reconverted to sulphides by
double decomposition reactions and enter back into the molten matte layer:
CU20 + FeS ~ CU2S + FeO
9 NiO + 7 FeS ~ 3 Ni3S2 + 7 FeO + S02
Control of the separation process allows almost all major impurities to se'parate into the
slag layer and all the nickel, copper and platinum group metals to be collected into the
smelter matte.
4.2.3 CONVERTING
The purpose of converting is to further reduce the sulphur level by the formation of a
metallic alloy phase. This is accomplished by blowing air or oxygen through the liquid
matte.
NICKEL: A complete conversion to the impure metal is not possible for nickel as the
mutual reduction or roast reaction between nickel sulphide and the nickel oxide formed
has a positive free energy change at 1200°C :
Ni3S2 + 4 NiO ~ 7 Ni + 2 S02 roast reaction
The overall conversion reaction,
Ni3S2 + 2 O2 ~ 3 Ni + 2 S02
although unfavourable, can be achieved using high converter temperatures and ensuring
intimate contact between the matte and oxygen.
COPPER: The copper sulphide proves much easier to convert as the roast reaction
between copper sulphide and the copper oxide formed has a negative free energy change
at 1200°C, and CuO (unlike NiO) is soluble in the molten sulphide phase :
CU2S + 2 CuO ~ 6 Cu + S02 roast reaction
The overall conversion reaction is also exothermic (ie. it has a negative enthalpy) :
CU2S+02 ~ 2Cu+ S02
The result of the above reactions for nickel and copper is that a fair amount of metallic
nickel-copper alloy is formed as a solution (the metals are mutually soluble).

28
IRON: The presence of iron sulphide ( as pyrrhotite) at this stage is essential for two
reasons :
1) Iron sulphide aids in the autogenous conversion of the fraction of the sulphide phase
which converts into the metallic alloy phase by the heat that is produced on oxidation of
iron sulphide to iron oxide :
2 FeS + 3 O2 ~ 2 FeO + 2 S02 highly exothermic
2) Iron sulphide also prevents copper and nickel (a small amount of which might have
been converted to oxides) from passing into the slag during conversion (see § 4.2.2).
Most of the iron oxide that forms is removed by reaction with the residual silica present,
although if the temperature is not kept high Fe304 can be deposited beneath the molten
matte layer.
PLA TINUM GROUP METALS: The pgms, including gold, are not oxidised as their free
energies of oxidation are all positive, and usually collect in the alloy phase. Platinum can
however partially remain in the sulphide phase.
4.2.4 POST CONVERSION
After the conversion stage, which is usually carried out at temperatures around 1200°C,
the liquid matte is cooled. This can be done rapidly or slowly. Slow cooling in the
temperature range 925°C to 370°C over about a week causes an almost complete
separation of matte constituents by crystallization of the three main phases present in the
order:
1) copper sulphide - crystallization begins around 921°C
2) nickel-copper alloy - crystallization begins around 699°C
3) nickel sulphide - crystallization begins around 575°C
Below about 371°C no further separation occurs.
The post-converter matte (known as 'white metal' if iron free), once solidified, is
crushed into small chunks (of about 2cm diameter) and supplied to the base metal
refinery where the extractive process continues following hydrometallurgical techniques.

29
4.3 BASE METAL REFINERY OPERATIONS (5)
In this section a relatively detailed description is given of the various extractive processes
taking place in a base metal refinery. To some extent these are specific to the process
used at BARPLATS REFINERlES, although many refineries (especially in South Mrica)
follow the same general scheme.
The BMR at BARPLATS REFINERlES received its post-converter matte from the
CROCODILE RIVER MINE. This mine concentrated and converted ore provided solely by
the LEFKOCHRYSOS UG-2 reef The matte was slow cooled in the post conversion step.
4.3.1 THE GRINDING CIRCUIT
In the BMR the matte chunks were ground in a ball mill under highly controlled
conditions. The slurry from the grinding circuit was stored in a surge tank which
continuously fed the nickel circuit. (Figure 4.3-1)
4.3.2 THE NICKEL CIRCUIT
The nickel circuit involved leaching the ground matte (in an 80% slurry) for nickel with
sulphuric acid. This first stage leach (FSL) extracted 60-70% of the approximately 50%
nickel content of the matte. In addition 30-50% of any iron present in the matte was
also extracted. Five tanks (in a cascade) were operated at atmospheric pressure. Steam
and oxygen were fed into the first two or three tanks to achieve temperatures in the
range 85-95°C and oxidising conditions. (The potential and pH of the final tanks was
important as in the event of copper and pgm dissolution, these had to be reprecipitated
by reducing the potential without reprecipitating iron. This was done by starving the
final tanks of oxygen and ensuring their pH was around 4.) The first stage leach
discharge slurry was pumped into a thickener tank. Part of the underflow of this tank
was recycled into the first tank and part was repulped with water in an agitated surge
tank which fed the copper circuit. The thickener overflow solution was filtered and sent
to crystallization vessels. The filter cake was routed into the last FSL tank.

30
MA TIE (Nickel-Copper Concentrate)
I , Surge Tank - Ball Mill GRINDING CIRCUIT
Centrifuges & - Nickel sulphate Rotary Driers hexahydrate
FIRST STAGE ~ LEACH
(atmospheric) Vacuum
Crystallizers
t NICKEL CIRCUIT
I....- Thickener Tank Clarifiers
Electrochemical Copper metal Cells
SECOND STAGE LEACH 10- COPPER CIRCUIT
(pressurized)
Pipeline Precipitators ,
SELENIUM CIRCUIT
Filter Presses Electric r--Roasters
t Driers Sodium hydroxide Sodium selenite
Scrubbers - Solution
1 NORMAL SELENIUM
~ CONCENTRATE CONCENTRATE
Figure 4.3-1 Simplified flowchart of the BASE METAL REFINERY

31
Nickel sulphate hexahydrate, NiS04"6H20 , was crystallized from the FSL clarifier
filtrate by vacuum crystallization. The pregnant solution contained about 100g/1 Ni.
The stainless steel vacuum crystallizers were steam heated shell and tube exchangers
operated at 50°C. The crystals in the crystallizer slurry (50% by weight) were separated
by centrifuges, washed, removed and dried in a rotary drier. The filtrate was recycled.
(Figure 4.3-1)
4.3.3 THE COPPER CIRCUIT
The copper circuit involved leaching the thickened FSL pulp for copper using sulphuric
acid. The leaching conditions were much more severe than those of the FSL, the aim
being to dissolve everything except the precious metals. Two autoclaves were operated
at elevated pressures. Once again steam was used for heating, and oxygen sparged in to
create the desired oxygen partial pressure. Heating was controlled to achieve initial
temperatures of 120-125°C. At this stage the exothermic oxidation of sulphur raised the
temperature to the final operating range of 150-160°C. Sulphuric acid was added in two
stages. 70% of that required was added on charging and the final 30% once the final
operating temperature range had been reached. After several hours the autoclave
contents were discharged and filtered . The filtrate typically contained 1 OOg {Ni + Cu}ll
and 20g/1 free acid. The filter cake was washed, dried, blended and weighed. This
residue formed the 'NORMAL CONCENTRATE' for the platinum metal refinery.
The filtrate was pumped into a recirculation tank which fed the electrowinning section of
the copper circuit. Various additives were added to this tank to aid in the subsequent
plating process. The electrochemical cells were piped in parallel. Each had 43 stainless
steel sheet cathodes and 44 lead-antimony anodes. The electrolyte was pumped into the
cells and the current density adjusted to achieve a copper concentration of 20g/1 in the
spent electrolyte. (It was important to maintain an electrolyte temperature of 55°C.
This was controlled by heating or cooling the feed .) The spent electrolyte was returned
to the leaching vessels of both the nickel and copper circuits. Once the steel cathodes

32
had formed a sufficient copper deposit, they were removed and the deposits stripped.
(Figure 4.3-1)
4.3.4 THE SELENIUM CIRCUIT
The so called selenium circuit at BARPLATS primarily involved the removal of selenium
from the filtrate of the copper circuit by precipitation with sulphur dioxide. This was
necessary as high levels of the heavy chalco gens (selenium and tellurium) in the filtrate
contaminate the copper deposit formed in the copper electrowinning section, in which
this filtrate is the electrolyte. The selenium circuit was fed by a surge tank containing
the filtered pressure leach solution. A steam heat exchanger heated this solution to 90e C
as it passed into the precipitator (a pipeline reactor). Aqueous sulphur dioxide was
injected into the reactor and the precipitate filtered out. In addition to the heavy
chalco gens, almost all of the pgms which might have dissolved in the copper circuit, were
precipitated. The filter cake was washed, collected and roasted in air at 700ec in an
electric roaster. The selenium present was volatilized and scrubbed from the vent gasses
with a 20% sodium hydroxide solution. The relevant reactions are:
Se+02 ~ Se02
Se02 + H20 ~ H2Se03
H2Se03 + 2 NaOH ~ Na2Se03 + 2 H20
This roast residue was termed the 'SELENIUM CONCENTRATE' for the platinum metal
refinery. This residual concentrate was sometimes blended with the 'NORMAL
CONCENTRATE' from the copper circuit (see § 4.3.3) for input to the PGM refinery.
(Figure 4.3-1)
4.4 THE ANALYSIS OF NICKEL-COPPER CONCENTRATE
In general, the post-converter matte provided by the smelter is essentially a mixture of
metal-rich sulphides and alloy. Three samples of ground matte from the grinding circuit
were provided by the BARPLATS BMR for intensive analysis. These represented three
different consignments from the mine. Matte chunks prior to grinding have a metallic

33
brassy appearance and are weakly magnetic. The density of unground chunks was found
to range from 6.2 to 6.3g/cm3. This value cannot be more accurately determined as
numerous gas cavities occur throughout the solid due to aeration in the conversion step.
Partial elemental analyses for the three ground matte samples are given in Table 4.4-1.
Table 4.4-1 Partial elemental analyses for mattes A, Band C t
Element MatteA MatteD Matte C
Ni 52.9 50.7 51.7 Cu 24.6 26.5 25 .8 Pt 1.12 1.10 1.05 Pd 0.51 0.47 0.42 Ru 0.273 0.249 0.266 Rh 0.175 0.165 0.145 Ir 0.0570 0.0605 0.0562 Au 0.009 0.008 0.007
t all values in weight % (Data supplied by BARPLATS.)
The remaining 20% of the weight is made up of sulphur (-18%), iron (-1 %), chromium
(-0. 1 %) and small amounts of cobalt, selenium, arsenic, silicon and osmium. The
average grade of the three samples is 20389g1tonne pgms, which is high. The samples
were all finely ground, having come from the ball mill.
X-ray powder diffraction (XPD) scans over the 28 angle range 5-120° were recorded for
all three samples, these being performed using the system and methods detailed in
CHAPTER 2, X-RAY POWDER DIFFRACTION ANALYSIS.
All three samples yielded similar scans and showed relatively high levels of crystallinity as
indicated by the number of counts recorded for the most intense peak (symbol : II) ' The
average count value of II was 10 18. Analysis of the data listings and spectra enabled
several phases to be identified. Most of the high intensity lines were assignable to the

34
nickel sulphide Ni3S2 known mineralogically as heazlewoodite. Table 4.4-2 compares
the reference data for this compound with that observed in the samples.
Table 4.4-2 Comparison of Ni3S2 reference data with that observed of Ni3S2 found in matte samples
Reference data (6) Matte A (obs.) Matte B (obs.) . Matte C (obs.) d(A) (1111) d(A) (1111) d(A) (1111) d(A) (1111)
4.11 (50) 4.157 (36) 4.161 (37) 4.163 (39) 2.89 (90) 2.911 (100) 2.911 (95) 2.911 (100) 2.38 (40) 2.405 (43) 2.404 (46) 2.402 (45) 2.36 (10) 2.371 (13) 2.373 (15) 2.374 (16) 2.03 (50) 2.059 (57) 2.059 (59) 2.058 (57) 1.826 (100) 1.846 (84) 1.846 (89) 1.846 (86) 1.816 (100) 1.831 (71) 1.832 (76) 1.831 (78) 1.673 (10) 1.690 (24) 1.690 (27) 1.690 (27) 1.660 (80) 1.674 (92) 1.674 (100) 1.674 (93) ] split
1.672 (60) 1.673 (68) 1.672 (69) ] peak 1.371 (5) 1.366 (9) 1.367 (8) l.366 (9) 1.357 (10) 1.360 (7) l.360 (10) 1.360 (8) l.294 (20) 1.299 (20) 1.299 (19) l.300 (17) 1.222 (20) 1.229 (19) 1.229 (21) 1.232 (19) 1.188 (5) 1.191 (2) 1.192 (2) 1.192 (2) l.171 (5) 1.178 (6) 1.178 (7) 1.178 (8) l.135 (10) 1.139 (15) 1.140 (19) 1.139 (17) ] split
1.139 (10) l.137 (10) ] peak 1.124 (10) 1.12,9 (18) 1.130 (23) l.130 (21) 1.099 (20) 1.101 (28) 1.101 (33) l.101 (35) ] split
1.101 (17) 1.101 (21) ] peak l.089 (5) 1.094 (17) 1.094 (23) 1.094 (20) 1.083 (30) l.089 (36) 1.089 (41) 1.089 (37) ] split
1.087 (33) l.087 (35) l.087 (35) ] peak
The following should be noted :
1) In some cases observed peaks at low d-spacings are split. These peaks are known as
'Ulu 2 doublets' and arise from CoKa.l (A. = l.78892A) and CoKa.2 (A. = 1.79278A)
wavelengths giving one peak at a low 28 value (higher dObs. value) of higher intensity,
and one peak at a high 28 value (lower dObs. value) oflower intensity respectively. Line
splitting is mainly observed at higher diffraction angles and indicates good crystallinity.

35
2) As the goniometer uses an automatic divergence slit and reference data is usually
measured with fixed divergence slits, the observed scan when compared to reference data
will have lower intensities at lower diffraction angles and higher intensities at higher
angles. (See § 2.5.4.)
3) At large d-spacings the difference between dreference and dobserved can be quite high
(± 0.050A) but is generally lower at smaller d-spacings (± 0.005A) (ie. large d-spacings
are less accurate than small d-spacings when measured experimentally). These large
differences need to be taken into account when assigning lines to reference data.
Table 4.4-3 Diffraction angles, 2e t : Ni3S2
Reference data (6) Observed data (average) 29 (1111) 29 (1111)
25 .1 (50) 24.8 (38) 36.1 (90) 35 .8 (100) 44.2 (40) 43 .7 (46) 44.5 (10) 44.3 (15) 52.3 (50) 51.5 (59) 58.7 (100) 58.0 (88) 59.0 (100) 58.5 (77) 64.6 (10) 63 .9 (27) 65 .2 (80) 64.6 (97) ]
64.7 (67) ] 81.4 (5) 81.8 (9) 82.5 (10) 82.2 (8) 87.5 (20) 87.0 (19) 94.1 (20) 93 .3 (20) 97.7 (5) 97.3 (2) 99.6 (5) 98.8 (7) 104.0 (10) 103 .4 (17) ]
103 .6 (10) ] 105.5 (10) 104.7 (21) 109.0 (20) 108.6 (33) ]
108.7 (19)] 110.4 (5) 109.7 (20) 111.4 (30) 110.4 (39) ]
110.7 (35) ]
t Applicable for radiation of wavelength A = 1.78894A (CoKal)

36
Table 4.4-3 gives the reference and average observed diffraction angles for Ni3S2 peaks.
The 1111 data for the observed data has been adjusted so as to give the most intense line a
maximum intensity of 100. This allows reasonable intensity comparisons to be made. .
Figure 4.4-1(a) and (b) shows the scan for matte A with the Ni3S2 peaks indicated and
the reduced or line spectrum for matte A compared to that of reference Ni3S2. The
matching lines are indicated in the strip above the sample pattern.
The second phase identified from the low intensity lines in the matte samples was the
copper sulphide CU2S known mineralogically as chalcocite.
Table 4.4-4 Comparison of CU2S reference data with that observed of
CU2S found in matte samples
Reference data (7) Matte A (obs.) Matte B (obs.) Matte C (obs.) d(A) (I1Il) d(A) (I1Il) d(A) (I1Il) d(A) (I1Il)
3.73 (20) 3.805 (2) 3.802 (2) 3.810 (2) 3.59 (16) 3.664 (1) 3.652 (1) 3.662 (1) 3.31 (25) 3.352 (2) 3.330 (3) 3.326 (2) 3.18 (40) 3.231 (3) 3.212 (4) 3.231 (3) 3.05 (20) 3.098 (1) 3.101 (2) 3.097 (2) 2.942 (45) 2.998 (3) 2.997 (3) 2.996 (4) 2.718 (55) 2.761 (6) 2.764 (7) 2.762 (7) 2.659 (25) 2.701 (1) 2.701 (4) 2.609 (16) 2.648 (1) 2.524 (40) 2.560 (5) 2.559 (4) 2.557 (4) 2.469 (45) 2.502 (4) 2.495 (4) 2.504 (5) 2.396 (85) 2.432 (10) 2.429 (13) 2.431 (11) 2.325 (40) 2.353 (8) 2.351 (7) 2.351 (8) 2.237 (25) 2.270 (3) 2.263 (3) 2.207 (30) 2.233 (3) 2.234 (5) 2.232 (3) 1.977 (100) 1.992 (15) 1.997 (17) 1.998 (15) 1.876 (90) 1.893 (14) 1.893 (15) 1.893 (14) 1.704 (35) 1.718 (5) 1.714 (7) 1.717 (6) 1.526 (25) 1.535 (2) 1.534 (2) 1.536 (2) 1.361 (10) 1.377 (2) 1.378 (3) 1.377 (3)
Table 4.4-4 compares the reference data for this compound with that observed in the
samples. As the reference data for CU2S contains 38 peaks, only those lines

100 80
IIII 60 40 20 0
Slow cooled matte [A] (from the grinding circuit)
Card number : BP-006
0 10 20
Nickel sulphide Ni3S2
~ ~ ~ ro ~ 00 w m 00 W 28 (degrees) COKC(l
CHeazlewoodite)
37
I( 1056
08-0126 100 80 60
I1I j 40 I 2~ .".,"""" ,,, ...... ,,, . ', " "'" ", " .. , ... T ' " , . . .... . . , .... ... . ,. " .. ,.1 .. ,..I. .... !,." ','" !.I ... !)". ,.".
Intensity (counts)
o ro ~ ~ ~ ~ ro ~ 00 w m 00 ~ 28 (degrees) COKC(l
2000
1620
1280
980
720
500
320
180
80
20
0 0
,
,
Figure 4.4-1(a)
, ,
Rad. COKC(1 : 1.7889
ill ~ ~ ~ ~ ro W 00 W ~ 00 W diffraction angle, 28 (degrees)
Figure 4.4-1(b)

38
corresponding to peaks found in the sample scans have been listed. Note especially the
large differences in the d-spacings for planes with d-spacings less than about 2.5A.
Table 4.4-5 gives the reference and average observed diffraction angles for CU2S peaks.
Figure 4.4-2(a) and (b) shows the scan for matte B with the main CU2S peaks indicated,
and the reduced spectrum for matte B compared to that of reference CU2 S.
Table 4.4-5 Diffraction angles, 29 t : CU2S
Reference data (7) Observed data (average)
29 (I1I1) 29 (I1I1)
25.1 (50) 24.8 (38) 27.8 (20) 27.2 (12) 28 .9 (16) 28.3 (6) 31.4 (25) 31.1 (12) 32.7 (40) 32.2 (19) 34.1 (20) 33 .6 (12) 35.4 (45) 34.7 (19) 38.4 (55) 37.8 (44) 39.3 (25) 38.7 (12) 40.1 (16) 39.5 (6) 41.5 (40) 40.9 (25) 42.5 (45) 41.9 (25) 43 .8 (85) 43 .2 (69) 45 .2 (40) 44.7 (50) 47.1 (25) 46.5 ('19) 47.8 (30) 47.2 (25) 53.8 (100) 53 .3 (100) 57.0 (90) 56.4 (88) 63.3 (35) 62.8 (38) 71.8 (25) 71.3 (12) 82.2 (10) 81.0 (19)
t Applicable for radiation of wavelength A = 1.78894A (CoKa.l)
Remaining lines could be assigned to the nickel-copper alloy phase, Ni-Cu. As these
two metals form solid solutions in any ratio no card data exists for this alloy. The peaks

100 80
!III 60 40
Slow cooled matte [B] (from the grinding circuit)
Card number : BP-007
20 O~~~~~~~~~~~~~~~~~~~~
100 80
!III 60 40 20 0
Intensity (counts)
o ill ~ .~ ~ ~ ro ~ ~ ~ ~ M W 29 (degrees) COKIXI
Copper sulphide CU2S
0
2000
1620
1280
980
720
500
320
180
80
20
0
10
(Chalcocite, low)
~ ~ ~ ~ ro ~ ~ ~ ~ M W 29 (degrees) COKIXI
Figure 4.4-2(a)
Rad. COKIXI : 1.7889
39
23-0961
0 ill ~ ~ ~ ~ W ~ ~ ~ ~ M W diffraction angle, 29 (degrees)
Figure 4.4-2(b)

40
however fall between those of pure nickel and those of pure copper for which reference
data is available.
Table 4.4-6 compares this reference data with that observed for the alloy phase in the
matte samples.
Table 4.4-6 Comparison of Ni and Cu reference data with that observed of the Ni-Cu alloy found in matte samples
Reference data (8) Matte A (obs.) Matte B (obs.) Matte C (obs.) deAl (IIII) deAl (IIII) deAl (IIII) deAl (IIII)
2.034- (100)t 2.0741 (31) 2.0587 (58) 2.0577 (57) 2.088 (100)
1.762- (42) t 1.7871 (14) 1.7911 (13) 1.7883 (10)
1.808 (46)
1.246- (21) t 1.2601 (9) 1.2596 (7) 1.2593 (5) 1.278 (20)
1.0624- (20) t 1.0714 (5) 1.0720 (7) 1.0707 (4) 1.0900 (17)
t Data for nickel is given first, followed by that for copper.
It should be noted that the first alloy peak (the reflection from the (111) planes) has
overlapped in mattes Band C with one of the nickel sulphide peaks (the reflection from
the (202) Ni3S2 planes).
Table 4.4-7 gives the reference and average observed diffraction angles for the alloy.
Figure 4.4-3(a) and (b) shows the scan for matte C with the Ni-Cu alloy peaks indicated
and the reduced spectrum for matte C compared to that of reference copper and nickel.

41
Slow cooled matte [C] Card number : BP-008 (from the grinding circuit)
I I I 100 h 1063 80
IIII 60 40
I II II 20 11 .1 I .11 I I I 0 I IlL .... ..... , ... ...... , .... .. ... , .... ..... , ..... .... , .. ...... . , .. ....... , .... ..... , .. .. .... ... .. .... . .... .... . .... ....
0 10 20 30 40 50 60 70 80 90 100 110 120 28 (degrees) CoKO:I
Copper Cu (lines 1,3,5,7,9) Nickel Ni (lines 2,4,6,8)
100 BP-0002 80
IIIl 60 40 '')0
I I I J ~
0 .... .. ..... .... ... , .... ..... , ......... , .. .. ........................... . .. . , .... .... . , .. .. ..... , .. ... .. .......... . 0 10 20 30 40 50 60 70 80 90 100 110 120
28 (degrees) CoKO:1
Figure 4.4-3(a)
Rad. CoKO:1 : 1.7889 2000
1620
1280
980
720 , Intensity
500 (counts)
320
180 , 80
20
0 0 ro ~ 30 ~ ~ ro ~ 00 ~ ~ 00 ~
diffraction angle, 28 (degrees)
Figure 4.4-3(b)

42
Table 4.4-7 Diffraction angles, 28 t : Ni-Cu alloy
Reference data (8) Observed data for mattes A, B & C 29 (I1Il) 29 (III!) 29 (III!) 29 (III!)
50.7- (100) t 51.1 (100) 51.5 (100) 51.5 (100)
52.2 (100)
59.3- (46) t 60.1 (45) 59.9 (41) 60.0 (48)
61.0 (42)
88.8- (20) t 90.4 (29) 90.5 (22) 90.5 (24)
91.8 (21)
110.3- (17) t 113.2 (16) 113 .1 (22) 113.3 (19) 114.7 (20)
t Applicable for radiation of wavelength A. = 1.78894A (CoKal)
:j: Copper data given first
In Table 4.4-7, estimated intensity data is given in italics.
Other matte samples (without elemental analyses) with a high iron content were also
provided by the BARPLATS B.MR. Scans of these samples showed numerous additional
peaks of high intensity which in some cases corresponded closely to the iron oxide
Fe304 known mineralogically as magnetite, and in other cases to the nickel iron oxide
NiFe204 known mineralogically as trevorite. Table 4.4-8 compares the reference data
for these two compounds with that observed in two selected samples (mattes D and E).
Observed data shown in italics overlaps with other phases such as nickel sulphide, copper
sulphide and the alloy phase.
Table 4.4-9 gives the reference diffraction angles for Fe304 and NiFe204 corresponding
to those found in mattes D and E . Data in italics indicates overlap with other phases.

43
Table 4.4-8 Comparison of Fe304 and NiFe204 reference data with
corresponding peaks observed in matte
Fe304 NiFe204
Reference data (9) Matte D (obs.) Matte E (obs.) Reference data (9a)
d(A) (IIIl) d(A) (IIIl) d(A) (III 1) d(A) (IIIl)
4.852 (8) 4.916 (4) 4.803 (10) 4.82 (20)
2.967 (30) 2.983 (29) 2.942 (21) 2.948 (30)
2.532 (100) 2.544 (87)] split 2.516 (100) 2.513 (100)
2.531 (51)] peak 2.4243 (8) 2.436 (40) 2.409 (34) 2.408 (8)
2.0993 (20) 2.106 (69) 2.089 (84) 2.085 (25)
2.105 (51) 2.083 (70)
1.7146 (10) 1.714 (11) 1.704 (10) 1.7025 (8)
1.6158 (30) 1.615 (32) 1.607 (34) 1.6051 (30)
1.4845 (40) 1.483 (78) 1.477 (51)] split 1.4760 (40) 1.477 (48)] peak
1.4192(2) 1.415 (2) 1.411 (2) 1.4100(2)
1.3277 (4) 1.325 (5) 1.319 (4) 1.3187 (6) 1.2807 (10) 1.277 (11) 1.276 (12) 1.2706 (10) 1.2659 (4) 1.264 (23) 1.261 (18) 1.2573 (4) 1.2119(2) 1.212 (15) 1.208 (9) ] split 1.2036 (6)
1.204 (8) ] peak 1.1221 (4) 1.118 (5) 1.117 (4) ] split 1.1145 (6)
1.114 (3) ] peak 1.0930 (12) 1.089 (64) 1.087 (57)] split 1.0857 (16)
1. 086 (34)] peak 1.0496 (6) 1.048 (18) 1.046 (11)] split 1.0424 (6)
1.048 (20) 1.043 (9) ] peak
From Table 4.4-9 it can be seen that some peaks have intensities substantially higher
than expected (shown in boldface type). In order to determine whether this was an
effect of using an automatic divergence slit, a geological sample of Fe304 was run and
compared to the reference data.
Table 4.4-10 compares the reference data for Fe304 with that collected from the
geological sample showing that the increase in the intensity of these peaks is due to
another crystalline phase.

44
Table 4.4-9 Diffraction angles, 28 t : Fe304 and NiFe204
Fe304 NiFe204
Reference data (9) Matte D (obs.) Matte E (obs.) Reference data (9a)
29 (I1Il) 29 (I1Il) 29 (I1Il) 29 (I1Il)
21.2 (8) 21.0 (5) 21.5 (10) 21.4 (20)
35 .1 (30) 34.9 (33) 35.4 (21) 35.3 (30)
41.4 (100) 41.2 (100)] split 41.6 (100) 41.7 (100)
41.4 (59) ] peak
43 .3 (8) 43.1 (46) 43.6 (34) 43 .6 (8)
50.4 (20) 50.3 (79) 50.7 (84) 50.8 (25) 50.3 (59) 50.8 (70)
62.9 (10) 62.9 (13) 63 .3 (10) 63.4 (8)
67.2 (30) 67.3 (37) 67.6 (34) 67.7 (30)
74.1 (40) 74.2 (90) 74.5 (51)] split 74.6 (40) 74.6 (48)] peak
78 .1 (2) 78.4 (2) 78 .7 (2) 78.7 (2) 84.7 (4) 84.9 (6) 85.4 (4) 85.4 (6) 88.6 (10) 88.9 (13) 89.0 (12) 89.5 (10) 89.9 (4) 90.1 (26) 90.4 (18) 90.7 (4) 95 .1 (2) 95.2 (17) 95.6 (9) ] split 96.0 (6)
95.9 (8) ] peak 105.7 (4) 106.3 (6) 106.4 (4) ] split 106.8 (6)
106.8 (3) ] peak 109.8 (12) 110.5 (74) 110.8 (57)] split 110.9 (16)
110.9 (34)] peak 116.9 (6) 117.2 (21) 117.6 (11)] split 118.2 (6)
117.2 (23) 118.1 (9) ] peak
t Applicable for radiation of wavelength A. = 1.78894A (CoKa.l)
The phase responsible for the increase in the intensity of these lines was determined as
being nickel oxide NiO, known mineralogically as bunsenite.
Table 4.4-11 lists the reference data for this compound and compares it with peaks in
mattes D and E.
Figure 4.4-4(a) and (b) shows the scan for matte D compared with that from a
geological sample of Fe304 for comparison. Note peaks of higher than expected

45
intensity. As nickel replaces iron in the Fe304 lattice forming NiFe204 the peaks shift
slightly to higher diffraction angles.
Table 4.4-10 Comparison of Fe304 reference data and data measured
for a geological sample of Fe304
Fe304 Fe304
Reference data (9) Measured data
d(A) (1111) 29 t d(A) (1111) 29 t
4.852 (8) 2l.2 4.815 (9) 2l.4
2.967 (30) 35 .1 2.963 (28) 35 .1 2.532 (100) 41.4 2.531 (100) 4l.4 2.4243 (8) 43 .3 2.413 (6) 43 .5 2.0993 (20) 50.4 2.093 (26) 50.6 l.7146 (10) 62.9 1.715 (15) 62.9 l.6158 (30) 67.2 1.616 (33) 67.2 1.4845 (40) 74.1 1.483 (42) 74.2 1.4192 (2) 78 .1 1.418 (1) 78.2 1.3277 (4) 84.7 1.327 (5) 84.7 l.2807 (10) 88.6 1.279 (12) 88 .7 l.2659 (4) 89.9 1.265 (4) 90.0 l.2119 (2) 95 .1 l.212 (7) 95 .2 1.1221 (4) 105.7 1.122 (11) 105.8 l.0930 (12) 109.8 1.093 (23) 109.9 1.0496 (6) 116.9 1.049 (17) 116.9
t Applicable for radiation of wavelength A = 1.78894A (CoKa.l)
Mattes D and E
Measured data . (1111) (1111)
(79) (84)
(90) (51)
(17) (9)
(21) (11)
Table 4.4-11 Comparison of NiO reference data with peaks observed in matte scans
NiO Matte D MatteE Reference data (10) Measured data Measured data d(A) (1111) 29 t d(A) (1111) 29 t d(A) (lilt> 29 t
2.410 (91) 43 .6 2.395 (54) 43.9 2.409 (40) 43.6 2.088 (100) 50.7 2.106 (100) 50.3 2.089 (100) 50.7 1.476 (57) 74.6 1.483 ( -) 74.2 1.477 (61) 74.5 1.259 (16) 90.5 1.259 (38) 90.6 1.255 (27) 91.0 1.206 (13) 95 .8 1.209 (23) 95 .5 1.208 (11) 95 .6 1.0441 (8) 117.9 1.048 (29) 117.2 1.046 (13) 117.6
t Applicable for radiation of wavelength A = 1.78894A (CoKa.l)

47
4.5 COMMENT ON MATTE PHASES
The table below lists the phases detected in BARPLATS base metal refinery matte :
Table 4.5-1 Matte phases (detectable by XPD)
Phase Formula Mineral name JCPDS Card number
Nickel sulphide Ni3S2 heazlewoodite 08-0126
Copper sulphide CU2S chalcocite (low) 23-0961
Nickel-copper alloy Ni-Cu 04-0850, 04-0836 Iron oxide Fe304 magnetite 19-0629
Nickel iron oxide NiFe204 trevorite 10-0325
Nickel oxide NiO bunsenite 04-0835
4.5.1 THE NICKEL SULPHIDE PHASE
On the Ni-S phase diagram (11) Ni3S2 falls on the 26.7 wt% sulphur line. This phase can
however show a metal excess or metal deficiency according to the non-ideal formula
Ni3±xS2 (12), small amounts of iron and cobalt making up the deficiencies. The density
is 5.82g1cmJ (13). Structurally Ni3S2 is strictly hexagonal or rhombohedral, but can be
regarded as pseudocubic with a body centred arrangement of sulphur atoms (ao =
4.08A, a = 89°25'), with nickel atoms being positioned at tetrahedral sites (14) . The
phase is pseudometallic and paramagnetic due to complex Ni-Ni bonding (15).
The only real difference between the measured XPD pattern and the reference XPD
pattern measured from a geological specimen is a more definite separation of the (113)
and (211) lines (these occur at 1.83A and 1.82A in geological specimens (o.olA
difference); 1.85A and 1.83A were the measured values, 0.02A difference). This is
characteristic ofNi3S2 of synthetic origin (16).

48
4.5.2 THE COPPER SULPHIDE PHASE
On the Cu-S phase diagram (17) CU2S falls on the 20.1 wt% sulphur line. The density is
5.5 - 5.8g/cm3 (18). CU2S is crystallographic ally a superstucture based on a hexagonal
system of close packed sulphur atoms (19). These planes are layered with copper atoms
triangularily coordinated in two different positions; one between sulphur atoms in the
layer and the other between sulphur atoms of two different layers (20) . The phase is .. a
semiconductor and diamagnetic (21) .
The XPD analysis confirmed that the copper sulphide phase of matte is CU2S rather than
the sulphur-richer CU31 S 16 (djurleite) phase which is almost structurally identical.
4.5.3 THE NICKEL COPPER ALLOY PHASE
As nickel and copper are mutually soluble at all concentrations (22) forming no alloys of
definite stoichiometry but rather solid solutions, diffraction peaks occur at spacings
intermediate between those of nickel and copper. The exact position of these peaks is
important and is dealt with later in § 4.7.2. Structurally the alloy is cubic (23). The
density of the alloy is usually about 8.9g/cm3 (24).
In most cases the maximum intensity (111) line overlaps with the (202) Ni3S2 line in
matte XPD patterns.
4.5.4 THE IRON OXIDE - NICKEL IRON OXIDE PHASE
Iron oxide Fe304 has a cubic structure (ao = 8.397A) very similar to that of nickel iron
oxide NiFe204 which is also cubic (ao = 8.339A) (25). Fe304 can be formulated as
Fe3+(Fe2+Fe3+)04 where Fe2+ and half the Fe3+ ions occupy octahedral sites and half
the Fe3+ ions occupy tetrahedral sites in an inverse spinel framework. Ni2+ ions can
replace Fe2+ ions in this structure leading to the formation of nickel iron oxide
Fe3+(Ni2+Fe3+)04· This phase can then form a continuous range of solid solutions with
Fe304 (26) .

49
Possible reactions leading to the formation of the phases are :
(i) 2 FeS + 3 O2 ~ 2 FeO + 2 S02 iron sulphide oxidation
(ii) 3 FeS + 5 O2 ~ Fe304 + 3 S02 iron sulphide oxidation
(iii) 6 FeO + O2 ~ 2 Fe304 iron oxide oxidation
(iv) 2 Ni3S2 + 7 O2 ~ 6 NiO + 4 S02 nickel sulphide oxidation
(v) 4 FeO + 2 NiO + O2 ~ 2 NiFe204 iron oxide / nickel oxide reaction
(vi) 4 Fe304 + 6 NiO + O2 ~ 6 NiFe204 iron oxide / nickel oxide reaction
(vii) Fe304 + NiFe204 ~ solid solution mutually soluble
Note that all the above reactions require oxygen. An XPD analysis of matte showing
high levels of Fe304 / NiFe204 generally indicates too much oxygen has been used
during the conversion step at the mine.
The two phases have densities of 5.20glcm3 and 5.37g1cm3 repectively.
4.5.5 THE NICKEL OXIDE PHASE
The NiO structure is also cubic (ao = 4.177A) and usually contains both Ni2+ and Ni3+
ions (27) . NiO plays an important role in the formation of NiFe204 (28) (see § 4.5.4).
The density of this phase is 6.81g/cm3 (29).
4.6 MICROSCOPIC EXAMINATION OF MATTE PHASES
Many metallic and non-metallic phases are optically anisotropic in that their optical
properties vary with crystallographic direction (30) . Use can be made of this property by
illuminating a cut and polished surface of a crystalline solid with plane polarized light. If
the surface is isotropic, the reflected light remains polarized and on rotation of a second
polarizer, known as the analyser, (through which the reflected light is beamed) can be
completely extinguished. Reflection from an anisotropic surface produces a component
perpendicular to the plane of polarization of the incident light. This component cannot
be completely extinguished and so rotation of the analyser, when examining

50
heterogeneous crystalline surfaces, produces regions of differing light intensity. Cubic
crystals are optically isotropic simply because light can travel in all crystallographic
directions with the same velocity (31) . All other non-cubic crystals are optically
anisotropic. In hexagonal crystals for example, a light ray travelling through the crystal
is split into two rays of different velocities, polarized at right angles to each other (32).
The changed velocities of light produce different colours in the reflected beam as light of,
for example, long wavelength (these would be red-band rays) which are now plane
polarized will be removed from the original incident plane polarized light and so be
extinguished by the analyser. The reflected light seen in this case would be blue-green.
The constituents of matte can be differentiated under plane polarized light as they are
crystallographically different (see § 4.5). The Ni-Cu alloy is cubic and therefore
optically isotropic and so will not change the plane of polarization. Reflected light is
thus expected to remain white. Ni3S2 is pseudocubic, and so will show only a slight
effect. CU2S however has a structure based on the hexagonal system which is optically
anisotropic and so will show the greatest effect, as hexagonal crystals split light
considerably (for example, hexagonal 'Iceland spar' calcite - CaC03) . On rotation of the
analyser the colour of reflected light from this phase should change the most, possibly to
blue or green.
A small sample of solid matte (matte F) was thus cut to give a thin section, and after
polishing and mounting, examined using a polarized-light microscope fitted with a
sodium lamp (A. = 589.3 nm). It should be noted that although a tungsten lamp gives
higher intensity light it does not give as good a contrast (the wavelength is unsuitable) .
Two of the photomicrographs obtained are shown in Figures 4.6-1(a) and 4.6-1(b).
The Ni-Cu alloy, containing the pgms, shows up as white cubic crystals or as anhedral
masses. The copper sulphide phase shows up as larger blue-green dentritic crystals.
The pale yellow-green backround is a matrix of crystalline nickel sulphide. This

51
Figure 4.6-1(a) Photomicrograph ofa slow cooled matte section (). = 589nm)
Figure 4.6-1(b) Photomicrograph ofa slow cooled matte section (). = 589nm)

52
particular sample had no iron oxide phase present (the black dots are voids). Thus the
XPD analysis was fully confirmed.
An interesting feature of matte crystallization is that an organic system exists which
crystallizes in a very similar manner. When a molten mixture of 88 wt% camphor
(C lOH 160 : mp 180°C) and 12 wt% anthracene (C 14H 10 : mp 218°C) solidifies, dentritic
crystals of camphor form, associated with a eutectic of camphor and anthracene, in an
anthracene matrix (33). The similarity demonstrates that the crystallization of a liquid
mixture of CU2S, Cu-Ni and Ni3S2 can probably be explained using a constitutional
supercooling model. Table 4.6-1 compares these two systems.
Table 4.6-1 Comparison of matte crystallization with that of a similar organic system
Inorganic system
CU2S
Cu-Ni Ni3S2
Organic system
Camphor
Camphor-anthracene eutectic Anthracene
Manner of crystallization
Dentritic
Associated with dentrites Matrix
Figure 4.6-2(a) shows crystals from the matte system and Figure 4.6-2(b) crystals from
the camphor + anthracene system.
4.7 THE MAGNETIC SEPARATION OF MATTE
Research by the South African minerals research group, MINTEK, has shown that 97% of
the pgms present in ore concentrate can be collected into a magnetic alloy fraction with a
. mass of 10% of the matte by the process of slow cooling (34). This study was however
done on ore concentrate from the Merensky reef Further work done using ore
concentrate from the UG-2 reef and mixed ore concentrate showed that in order to

53
Figure 4.6-2(a) Crystals from the matte system
Figure 4.6-2(b) Crystals from the camphor + anthracene system

54
achieve reasonable pgm recoveries a greater fraction of magnetic material had to be
produced (35).
As the BARPLATS base metal refinery showed an interest in the feasibility of magnetically
separating the slow cooled matte they were using, a study in this area was felt necessary.
For this purpose various magnetic and non-magnetic fractions of matte were provided.
The study had the following aims :
(a) To determine the percentage alloy present in the matte
(b) To determine whether pgms were being collected by the alloy phase
(c) To determine the success of the magnetic separation process
4.7.1 THESLOWCOOLINGOFMATTE
The slow cooling process takes place at the mine during the post conversion stage (see
§ 4.2.4). As this step is vital in ensuring satisfactory pgm collection, it becomes
important to have some way of finding out whether the mine has in fact slow cooled the
matte. Under non-equilibrium conditions of cooling non-homogeneous solid solutions
are formed (36) . In the case of the nickel-copper alloy this means that instead of
homogeneous cubic crystals forming, the crystals will be zoned. As the melting point of
nickel is 1555°C and that of copper is 1083°C, fast cooling will initially. produce small
nuclei of nickel-rich alloy. As there is no time for the solution around these nuclei to
equilibrate, the matrix solution becomes richer in copper, until finally the remaining
copper-rich alloy solution of low melting point crystallizes out around each nucleus.
The XPD scan of a matte sample exhibiting the effects of fast cooling is shown in Figure
4.7.1-1. Each alloy line has broadened and partiallysplit. The low angle side of each
split peak is due to copper-rich zones (approaching pure copper) while the high angle
side is due to nickel-rich zones within the alloy crystals (see Figure 4.7.1-2).
Thus an XPD analysis can be used to confirm whether slow cooling has taken place.

55
Rad. CoKO:1 : 1.7889
1000
810
640
490
360 Intensity'
250 (counts) 160
90
40
10
0 0 ill ~ ~ ~ ~ ro ~ 00 W ~ 00 W
diffraction angle, 28 (degrees)
Figure 4.7.1-1 XPD scan of fast cooled matte showing alloy peak splitting
COPPER-RICH ZONE NICKEL-RICH ZONE
29 ..
Figure 4.7.1-2 Origin of split alloy peaks

56
4.7.2 DETERMINATION OF THE STOICHIOMETRY OF THE MATTE ALLOY
In order to determine the percentage of alloy present in matte, it is first necessary to
determine its stoichiometry. This is possible if the unit cell dimensions are known. The
alloy phase gives four diffraction peaks over the 28 range 5° - 120°, these being .
reflections off the (111), (200), (220) and (311) planes. Table 4.7.2-1 gives the
observed data for these peaks for mattes A, Band C.
Table 4.7.2-1 Observed alloy data for mattes A, Band C
MatteA Matte B Matte C Peak (hkl) d(A) d(A) d(A)
1 (111) 2.0741 2.0587 2.0577 2 (200) l. 7871 1.7911 1.7883 3 (220) 1.2601 1.2596 1.2593 4 (311) 1.0714 1.0720 1.0707
As the nickel-copper alloy is cubic the Bragg equation for determining the unit cell
dimensions, in the absence of systematic errors, is (37) :
sin28 = (A.2 / 4ao2)(h2 + k2 + 12)
where f.. is the wavelength of the radiation used (for the x-ray system used, A. =
1.78894A); ao is the edge length of the cubic cell; h, k, and 1 are the Miller indices of the
diffraction planes (Table 4.7.2-1), and 8 is the angle of reflection calculated from the
relation below (38) :
nA. = 2dsin8
where, for single order reflections n = 1, and d is the d-spacing of the peak in Angstroms
(given in Table 4.7.2-1).
Accurate determination of unit cell dimensions usmg the Bragg equation requires
virtually all systematic errors to be eliminated. This is seldom achieved in practice.
Significant errors are introduced by small axial divergences and rotational axis

57
malalignments, both of which shift peak positions slightly. Cohen has shown that when
such systematic errors are present, the introduction of a second term involving a 'drift'
constant, D, into the above Bragg equation for cubic systems enables the accurate
calculation of ao (See Appendix 1 : Cohen's least-squares method).
Using Cohen's method on the data given in Table 4.7.2-1 the following alloy unit cell
dimensions were obtained :
Matte A ao = 3.5419A
Matte B ao = 3.5426A
Matte C ao = 3.5378A
Average : ao = 3.540sA
The stoichiometry of the alloy can now be determined by using Vegard's law which states
that for solid solutions the lattice parameter is a linear function of the atomic
concentrations of the dissolved atoms (39). This law is approximately true for most solid
solutions, and for nickel-copper alloys has the form :
at% nickel = [(ao, alloy - ao,copper) / (ao,nickel- ao, copper)] x 100
where for nickel ao = 3.5236A (25°C) (Literature value)
for copper ao = 3.6147 A (25°C) (Literature value)
for the alloy ao = 3 . 5408A (25°C) (Calculated average)
Thus the atomic concentration of nickel in the alloy is 81.12 at% on average (79.87 wt%
Ni), and the alloy can be formulated as ranging from Ni3.97sCu to Ni5.414Cu.
Average stoichiometry: Ni4.297Cu (based on average ao value)

58
4.7.3 DETERMINATION OF THE WEIGHT PERCENTAGE OF MATTE ALLOY
Having determined the stoichiometry of the alloy, the weight percentage present in the
matte can be estimated by considering the matte as a three component system and
solving as a set of three linear equations. In the case of matte A the equations would be :
Ni3S2 Ni3.97SCu CU2S
0.733 x + 0.786 Y + 0 .. 000 Z = 52.9
0.000 x + 0.214 Y + 0.799 z = 24.6
0.267 x + 0.000 Y + 0.201 z = 18.0
total nickel content (Table 4.4-1)
total copper content (Table 4.4-1)
total sulphur content (estimate)
where x, y and z are the weight percentages of Ni3S2, Ni3.97SCu and CU2S present in
matte A. Solution of the above equations, and similar equations for mattes B an C gave
the results shown in Table 4.7.3-1.
Table 4.7.3-1 Weight percent composition of mattes A, Band C
Matte
A B C
48 .7 46.8 46.4
Ni-Cu
21.9 21.0 21.2
24.9 27.3 27.9
What these results show is that the alloy phase makes up about 21.0 - 21.9% of the
weight of the matte. This might not seem likely based on the photomicrographs, except
that it must be remembered that the alloy has a much higher density than the other two
phases. The Ni3S2 : CU2S : Ni-Cu volume ratio is 3.4 : 2.0 : 1.0.
Based on the values in Table 4.7.3 -1 an average calculated density for the three mattes
(using the densities given in § 4.5) would be about 6.25g/cm3. This agrees well with the
measured density of6.2 - 6.3g1cm3 and indicates the weight percentages are correct.

4.7.4 DETERMINING THE SUCCESS OF A MAGNETIC SEPARATION
The success of a magnetic separation depends on several factors. Three of these are :
(1) Having an alloy phase into which most of the pgms have been collected
(2) Having a low bulk of alloy present in the matte
(3) Having an alloy with good magnetic properties
59
An observation to be covered later (§ 4.8) will indicate that the alloy phase is rich in the
pgms, thus satisfying condition (1). From § 4.7.3 however it seems that there is quite a
high bulk of alloy present in the matte (about 21 wt%). Thus condition (2) is only
partially met.
An interesting feature of the nickel-copper alloy is that when the weight percentage of
nickel rises above 68% (ie. Ni2.30Cu), it undergoes a magnetic transformation in which
numerous electron spins become locked into cooperative parallel orientations over large
domains, rendering the material ferromagnetic rather than paramagnetic (40). As the
weight percentage of nickel in the alloy has been determined as being about 79.9% (see
§ 4.7.2) the alloy will be ferromagnetic, and a separation of phases should be easy. This
was not the case, as the alloy crystals were tiny and dispersed throughout the matte (See
§ 4.8 and Appendix 2 : Isolation of the alloy phase).
Figures 4.7.4-1(a) and 4.7.4-2(a) show the reduced patterns of a qIagnetically separated
matte (matte [1]) compared to the alloy lines. The scans of these two fractions are
shown in Figures 4.7.4-1(b) and 4.7.4-2(b). As can be seen, both fractions contain
paramagnetic Ni3S2 and the intensities of the alloy peaks are not very different.
Figures 4.7.4-3(a), 4.7.4-4(a), 4.7.4-3(b) and 4.7.4-4(b) show a slightly better alloy
separation (matte [2]).
From the analysis of various samples, the following observations were made :
1) In all cases the paramagnetic nickel sulphide phase (Ni3S2) occurs in both
fractions.
2) The diamagnetic copper sulphide phase (Cu2S) occurs mainly in the
non-magnetic fraction .

60
Slow cooled matte [1] Card number : BP-036 (magnetic fraction)
I I 100 h 552 80
1/11 60 40
II I 20 I II I I I I I I I I 0 · · .. •· .. · , .... • · .. ·, .... •• .. · 1 .... •• .. · .... . .. . ..... . . .. ... .... ..... .. •• .. ·1 .. .. • .. · · . .. ....... .. .. ... . .... . .. ..
o ro ~ . ~ ~ ~ ro ~ w w ~ w ~ 28 (degrees) COKCX:l
Nickel copper alloy Ni-Cu
100 BP-0001 80
I1Il 60 40 20 I I 0 .. .. ... .. , .... .... . , ... ... .. ·r .. ··· .... I .... • •· · ·1 .. • ·• .. .... ... .... ....... . . .... . ........ . .. .. , ..... . . , .........
o ill ~ ~ ~ ~ ro ~ w w ~ w ~ 28 (degrees) COKCX:l
Figure 4.7.4-1(a)
Slow cooled matte [1] Card number : BP-037 (non -magnetic fraction)
100 I I h 534
80
I1Il 60 40 20 I II I I I II I I I II 0 I 1 · ··· 1· · · ..... ... . .. .... ... r .... · .. ·· .. ... ... . .... .. ... ..... ... . , .............. . ... . . . .. .... I .. .. .. ... ..... . .. .
0 10 20 30 40 50 60 70 80 90 100 110 120 28 (degrees) COKCX:I
Nickel copper alloy Ni-Cu
100 BP-OOOI 80
I1II 60 40 20 I I 0 .... •· .. ·1 .. .. • .. ·· . . ..... . . · ·· ·• · .. · 1 .... . • .. · .... . ...... .. . • .. · 1 .. · ·•· .. · .... .... · 1 .... . . .. . ......... 1 .. .. . . .. .
o ill ~ ~ ~ ~ ro ~ w w ~ w W 29 (degrees) COKCX:I
Figure 4.7.4-2(a)

Intensity (counts)
Intensity (counts)
1000
810
640
490
360
250
160
90
40
10
0 0
Rad. CoKO:1 : 1.7889
,
ill ~ ~ ~ 50 ro ~ 00 W ~ 00 rn diffraction angle, 29 (degrees)
61
Figure 4.7.4-1(b) XPD scan of the magnetic fraction of matte [1]
1000
810
640
490
360
250
160
90
40
10
0 0
Rad. CoKO:1 : 1.7889
,
ill ~ ~ ~ 50 ro ~ 00 W ~ 00 rn diffraction angle, 29 (degrees)
Figure 4.7.4-2(b) XPD scan of the non-magnetic fraction of matte [1]

100 80
1/11 60 40
Slow cooled matte [2] (magnetic fraction)
I
Card number : BP-034
I I
20 1 I II I II .11 I I I II I o ·· ··' ·· ·· r···· ' ···· I······· ··j··· ·'· ·· .. l···· '· ··· ,····' .... 1 .... 1 ........ , ........ , .... ···· j···· I· ·· ·I ··· · ... . , ... .
100 80 60 40
o ill ~ . ~ ~ ~ ro ~ ~ ~ ~ 00 ~
Nickel copper alloy Ni-eu
28 (degrees) CoKlX1
~ I I o ,··· '· ··· 1····' ··· ·)· ···,· ·· ·1 ···· ,···· .... j • • • ••• •• , • • •• ···· ' ··· ·r·· ··.·· ·· .... , .... ·· ··1· ··· ... ·1 ···· 1·.' ·1 .... o ill ~ ~ ~ ~ ro ~ ~ ~ ~ 00 ~
Slow cooled matte [2] (non -magnetic fraction)
28 (degrees) COKIXI
Figure 4.7.4-3(a)
Card number : BP-035
62
It: 900
BP-OOOl
100 J---------~------L-___ _l It: 445 80 60
IIIl 40 20 O+=~~~~~~~~~~~~~~~~~~~~ o ill ~ ~ ~ ~ ro ~ ~ ~ ~ 00 ~
28 (degrees) CoKlX1 Nickel copper alloy Ni-eu
@ ~-OOOl 80 60
IlIl 40
~ I I o .... , ...... .. '· .. · 1 .... ' .... 1 .... ' .. .. 1 .... ' .... .. .. , ........ , .. ...... , .... .... ' .... 1 .... ' ........ , .. .. [ ... . , .. ..
o m ~ ~ ~ ~ ro ~ ~ W ~ 00 ~ 28 (degrees) CoKlXl
Figure 4.7.4-4(a)

Intensity (counts)
Intensity (counts)
1000
810
640
490
360
250
160
90
40
10
0 0
63
Rad. CoKO:1 : 1.7889
,
, , ,
ID ~ ~ ~ ~ ~ ~ W 90 ~ M ~ diffraction angle, 28 (degrees)
Figure 4.7.4-3(b) XPD scan of the magnetic fraction of matte [2]
IDOO
810
640
490
360
250
160
90
40
10
0 0
Rad. CoKO:1 : 1.7889
ID ~ ~ ~ ~ ~ ~ W 90 ~ M ~ diffraction angle, 28 (degrees)
Figure 4.7.4-4(b) XPD scan of the non-magnetic fraction of matte [2]

3) The magnetic fraction always has a higher crystallinity than the non-magnetic
fraction (as measured by the most intense scan peak).
64
4) No differences in the d-spacings of the alloy lines were observed between the two
fractions (this confirms slow cooling).
Thus a magnetic separation of the matte being provided to the BARPLATS base metal
refinery was shown not to be feasible.
4.8 ANALYSIS OF FIRST STAGE LEACH RESIDUE
After passing through the grinding circuit (Figure 4.3-1) the nickel-copper concentrate
or matte is leached for nickel with sulphuric acid at atmospheric pressure in what is
known as the first stage leach. A sample of first stage leach residue from the underflow
of the thickener tank (representing the feed of the second stage leach tanks) was
provided by the base metal refinery for analysis.
This residue showed substantially lower crystallinity than the matte samples (maximum
count, 11 = 471). Many of the high intensity lines were identified as those of the nickel
sulphide Ni3S4 known mineralogically as polydymite. Table 4.8-1 · compares the
reference data for this compound with that observed for the sample. Boldface indicates
overlap with another phase.
From Table 4.8-1 it can be seen that there is a good correlation between reference and
observed d-spacings, but not for the intensity values. This is probably due to the age of
reference data (the original pattern was recorded on film in 1953 and the intensities
estimated visually) .
Figure 4.8-1(a) and (b) shows the reduced pattern of first stage leach residue compared
with that ofNi3S4. Two good diagnostic lines are indicated in the sample peak scan.

65
Table 4.8-1 Comparison of Ni3S4 reference data with that observed
of Ni3S4 found in the first stage leach residue
Ni3S4 Observed data
Reference data (41) First stage leach residue d(A) (1111) 28 t d(A) (1111) 28 t
5.50 (20) 18.7 5.402 (7) 19.1 3.34 (40) 31.1 3.318 (23) 31.3 2.85 (90) 36.6 2.841 (86) 36.7 2.36 (90) 44.5 2.360 (50) 44.5 1.941 (30) 54.9 1.954 ( -) 54.5 1.820 (90) 58.9 1.819 (41) 58.9 1.674 (100) 64.6 1.671 (100) 64.7 1.600 (10) 68 .0 1.599 (11) 68.0 1.499 (10) 73 .3 1.499 (4) 73.3 1.444 (50) 76.6 1.443 (10) 76.6 1.369 (60) 81.6 1.366 (10) 81.8 1.269 (30) 89.6 1.278 (6) 88 .9 1.232 (80) 93 .1 1.234 (16) 92.9 1.185 (70) 98.0 1.185 (10) 98.1 1.117 (10) 106.4 1.113 (7) 106.9 1.095 (70) 109.5 1.096 (17) 109.5 1.055 (60) 116.0 1.055 (7) 116.0
t Applicable to radiation of wavelength A = 1.78894A (CoKa.l)
The remaining high intensity lines had to be due to a copper sulphide. Altogether 13
crystallographically different copper sulphides have been identified (42) . Table 4.8-2
lists the reference data for each.
The similarity of the data in Table 4.8-2 makes the assignment of lines difficult. The
sulphides giving the best match with the observed data were CU9S5, CU1.8S, and CU7S4 '
The sulphide CU7S4 can also transform to CU1.8S on grinding (43). The best intensity
and d-spacing fit was obtained with the sulphide Cu 1.8S (known mineralogically as
digenite) although slight shifts were noted.

66
First stage leach residue [2) Card number : BP-051 (from the underflow of the thickner tank)
100 I( 471 80
1/11 60 40 20 0
0 10 20
Nickel sulphide Ni3S4
~ ~ ~ ro ~ 00 ~ ~ M ~ 29 (degrees) CoKO: l
(Polydymite) 100 80 60
lIIl 40 I 20 I I I I I I I o ' .. , ' '''' ! .... , .. '! .. , , , .. , 'T"" " , , 'T' , .. , .... I "" , .... I ""''''' !'' .. ,' .. '! " .. , ''' ! '' '''' '' '!'"'''''' ... , .. '
o 10 20 ~ ~ ~ ro ~ 00 ~ ~ M ~ 29 (degrees) CoKO: l
Figure 4.8-1(a)
Rad, CoKO: l : 1.7889
1000
810
640
490 , 360
, Intensity
250 (counts) 160
90
40
10
0
08-0106
0 10 20 ~ ~ ~ ro ~ 00 ~ ~ ~ ~
diffraction angle, 29 (degrees)
Figure 4.8-1(b)

67
Table 4.8-2 XPD reference data for Copper sulphides (42)
Formula Peak 1 t Peak 2 Peak 3 Peak 4 Card No.
CU2S 2.403x 3.051x 1.97508 1.70464 24-0057
CU2S 1.9805x 1.8759x 2.401 9 1.70635 26-1116
CU2S 1.977x 1.8769 2.3969 2.7186 23-0961
CU1.96S 2.74x 2.3028 1.9944 1.8834 17-0449
CU1.96S 2.016x 2 . 85~ 1.7206 3.303 12-0174
CU1.93S 1. 870x 1.959x 2.3899 1.9664 23-0959
CU1.91 S 1.938x 2.3749 1.861 9 2.8644 23-0958
CU7.2S4 1.9693x 2.7857 3.2164 1.67941 24-0061
CU9S5 1.9594x 2.9543 3.2003 3.0422 26-0476
CU1.8S 1. 967x 2.7795 3.214 1.6782 23-0962
CU7S4 1.956x 2.777 3.206 2.164 22-0250
CuS 2.813x 1.8968 3.0487 2.7246 06-0464
CuS2 2.89x 2.048 1.738 2.577 19-0381
t X denotes most intense line(s); subscript numbers denote intensities relative to 10
Table 4.8-3 compares the reference data for this compound with that observed for the
relatively low intensity copper sulphide peaks. Many lines overlapped those of other
phases (shown in boldface). Figure 4.8-2 shows the reduced spectra of first stage leach
residue compared to that OfCU1.8S,
Table 4.8-3 Comparison of CU1.8S reference data with that observed
of <;U1.8S found in first stage leach residue
Cu1.sS Observed data Reference data (44) First stage leach residue d(A) (1/11) 29 d(A) (1/11) 29
3.35 (4) 31.0 3.318 (16) · 31.3 3.21 (35) 32.4 3.174 (25) 32.7 3.01 (14) 34.6 3.021 (19) 34.4 2.779 (45) 37.6 2.752 (48) 37.9 2.141 (10) 49.4 2.150 (4) 49.2 1.967 (100) 54.1 1.954 (100) 54.5 1.814 (2) 59.1 1.819 (29) 58.9 1.678 (20) 64.4 1.671 (70) 64.7 1.607 (4) 67.6 1.599 (8) 68.0 1.392 (10) 80.0 1.385 (8) 80.4

100 80 60
IIII 40 20
First stage leach residue [2] Card number : BP-051 (from the underflow of the thickner tank)
O+=~m+.~~~~~~~~~+.+.~~~~~~~~
o ro ~ . ~ ~ ~ ro ~ ~ ~ ~ 00 ~ 29 (degrees) COKC<l
Copper sulphide CU1.8oS (Digenite)
68
100 23-0962 80
IIII 60 40 20 II I o .. ··'· .. · 1 .. · · '· .. · .... , . .. ... . . , .. . ... . . , . .. .' .. ·" .. ·· / .. ' .... I · .. ·' .. ·· ~ .. .. , ... · .... , ........ , ........ , ... .
o ill ~ ~ ~ ~ ro ~ ~ ~ ~ 00 ~ 29 (degrees) COKC<l
Figure 4.8-2

69
The choice of Cu l.8S is supported by the observation that the shift of the maximum
intensity peak is that predicted on averaging the reference d-spacing with the reference
d-spacing of an overlapping nickel sulphide peak :
Ni3S4 1.941 A peak intensity = 30
CUl.SS 1.967 A peak intensity = 100
Average : 1.954 A Observed: 1.954 A overlapped peak
After the assignment of Ni3S4 and CUl.sS peaks only a few very low intensity peaks
remained which seemed to indicate the nickel sulphide NiS. A cyanide leach was
therefore carried out to remove most of the Ni3S4 and CUl.SS from the sample.
2.00g of FSLR were placed in a solution of 5.20g KCN in 50.0mI water. The
suspension was heated with stirring at 95°C for 30 minutes, cooled and filtered . The
residue was dried at 100°C for 45 minutes. The residue mass was 0.16g (8% of the
original sample mass). XPD analysis of this residue indicated that it was predominantely
the nickel sulphide NiS . CUl.SS had been completely removed, although a little Ni3S4
remained.
Thus the nickel sulphide NiS was confirmed as also being present in first stage leach
residues.
Table 4.8-4 compares the reference data for NiS with that observed for the cyanide leach
residue
Figure 4.8-3(a) and (b) shows the reduced and peak spectra for the cyanide leach
residue.

70
Table 4.8-4 Comparison of NiS reference data with that observed of the NiS in the FSLR cyanide leach residue
NiS Observed data
Reference data (45) Cyanide FSLR leach residue
d(A) (III!) 2e t d(A) (III!) 2e t
4.807 (60) 2l.4 4.755 (24) 2l.7
2.946 (40) 35.4 2.934 (40) 35.5
2.777 (100) 37.6 2.763 (100) 37.8
2.513 (65) 41.7 2.506 (58) 4l.8
2.228 (55) 47.3 2.220 (45) 47.5
1.8631 (95) 57.4 l.858 (96) 57.6
l.8178 (45) 59.0 l.814 (52) 59.1
l.7372 (40) 62.0 1.734 (39) 62.1
l.6340 (18) 66.4 1.633 (12) 66.4
l.6037 (35) 67.8 l.601 (35) 67.9
1.5470 (25) 70.6 l.546 (30) 70.7 1.3884 (8) 80.2 l.387 (10) 80.3 l.3343 (4) 84.2 1.329 (5) 84.6 1.3008 (10) 86.9 1.299 (14) 87.0 1.2560 (8) 90.8 1.254 (16) 9l.0 1.2023 (6) 96.1 1.199 (6) 96.5 1.1783 (4) 98 .8 1.182 (8) 98.4 1.1447 (6) 102.8 1.143 (8) 103 .0 1.1133 (16) 106.9 1.113 (32) 106.9 1.0846 (8) 111.1 1.084 (4) 111.2
t Applicable to radiation of wavelength A. = 1.78894A (CoKa.})
A leach performed on FSLR using thiourea and hydrochloric acid (method provided by
BARPLATS) was found to remove CU1.8S almost completely, leaving a residue containing
Ni3S4 and NiS . 2.00g of FSLR were placed in a solution of 11.00g thiourea in 50.0mI
1M HCl. The suspension was stirred for 180 minutes at room temperature (22°C), and
filtered . The residue was dried at 100°C for 45 minutes and weighed 0.81g (40.5% of
the original sample mass). It should be noted that this leach can only give an estimate of
CU1.8S present in the sample as the residual Ni3S4 can be structurally contaminated with
copper (46) .
During this leach a silvery-grey highly magnetic metallic powder separated and floated on
the meniscus. An EDAX analysis showed the powder to be about 50% Ni, 13% Cu,

100 80
IIII 60 40 20 0
100 80
IlII 60 40 20 0
Intensity (counts)
First stage leach residue [2] (after a potassium cyanide ·leach)
Card number: BP-056
0 10 20 30 40 50 60 70 80 90 100 28 (degrees) CoKtXl
Nickel sulphide NiS (Millerite)
0 10 20 30 40 50 60 70 80 90 100 28 (degrees) COKtXl
Figure 4.8-3(a)
Rad. COKtXl : 1.7889 500
405
320 , , 245
180
125 , 80
45
20
5
0
71
It: 234
110 120
12-0041
110 120
0 ro ~ ~ ~ ~ ro ~ ~ ~ ~ 00 W diffraction angle, 28 (degrees)
Figure 4.8-3(b)

72
13% Fe, 21% Pt, 2% Rh and 1% Pd. Not enough was formed to analyse using XPD.
The high platinum, nickel and copper content suggests it might be residual matte alloy.
The presence of iron was unusual although both nickel and platinum are known to form
alloys with iron (47) . This powder was later confirmed as residual alloy (See
Appendix 2: Isolation of the alloy phase.). The high pgm content should be noted.
Figure 4.8-4(a), (b) and (c) show the presence ofNi3S4 and NiS inJhis leach residue.
4.9 FIRST STAGE LEACH RESIDUE PHASES
The table below lists the phases detected in the first stage leach residue:
Table 4.9-1 First stage leach residue phases (detectable by XPD)
Phase Formula
Nickel sulphide
Copper sulphide CUI .8S
Nickel sulphide NiS Nickel-copper alloy Ni4.3CU
Mineral name
polydymite
digenite
millerite
4.9.1 THE NICKEL SULPHIDE PHASES
JCPDS Card Number
08-0106
23-0962
12-0041
The identification of the nickel sulphides Ni3S4 and NiS showed that the following
reactions were taking place in the first stage leach (48) :
: NiS formation
2 Ni3S2 + 2 H2S04 + O2 ~ 4 NiS + 2 NiS04 + 2 H20 : NiS formation
8 NiS + 2 H2S04 + O2 ~ 2 Ni3S4 + 2 NiS04 + 2 H20: Ni3S4 formation

1/11
100 80 60 40 20 0
100 80
First stage leach residue [2] (after a thiourea leach)
Card number : BP-057
73
h 243
0 10 20
Nickel sulphide Ni3S4
~ ~ ~ ro ~ ~ ~ ~ M m 29 (degrees) COKC(l
(Polydymite) 08-0106
1/11 60 40 I 20 I I I I I I I o .... , ..... ... , .. .. ..... , ... ..... ,· .. '1" .. .. ' .. ·· 1 .. .. ' .. ·· 1· · .. ' .. ··1 .. · · ' .. .. 1 .. .. '· .. ·1 .. .. ' .. · · 1 .. .. ' .... .... , .. ..
Intensity (counts)
o ro ~ ~ ~ ~ ro ~ ~ ~ ~ M m 29 (degrees) COKC(l
500
405
320
245
180
125
80
45
20
5
0 0
Figure 4.8-4(a)
Rad. COKC(l : 1.7889
, ,
,
ro ~ ~ ~ ~ ro ~ ~ ~ ~ M ~ diffraction angle, 29 (degrees)
Figure 4.8-4(b)

100 80
IlIl 60 40 "0 .::.
0
First stage leach residue [2] (after a thiourea leach)
Card number : BP-057
0 ill ~ ~ ~ ~ ro ~ ~ ~ ~ 00 ~ 29 (degrees) COKC<l
Nickel sulphide NiS (Millerite)
74
h 243
100 12-0041 80 60
IlIl 40 I 20 I III, I, 1 1 I, I o .. ... .. ...... ..... ............. · .. .. ' .... · .. .. 1 ......... 1 ........... .. . .. .... .. , ........ . .... , .... . .. .. , .... ... ..
o ill ~ ~ ~ ~ ro ~ ~ ~ ~ 00 ~ 28 (degrees) COKC<l
Figure 4.8-4( c)

75
4.9.2 THE COPPER SULPHIDE PHASE
The identification of the copper sulphide Cu l.SS suggested that the following reactions
were taking place in the first stage leach (49) :
2 CU2S + 2 H2S04 + O2 ~ 2 CuS04 + 2 CuS + 2 H20
5 NiS + 2 CuS04 ~ CU2S (as CUl.SS) + 2 NiS04 + Ni3S4
The first reaction was proposed by a researcher at another refmery. Almost no CuS was
observed in the first stage leach residue however. This suggested the reaction occurring
was rather (50) :
Residual copper phases from the pressure leach present in pgm concentrates are dealt
with in the next chapter.

DOD CHAPTERS
THE PLATINUM GROUP METAL
REFINERY DOD
5.1 INTRODUCTION
76
The platinum group metal refinery in essence has to perform three functions. These are :
1) Extraction of the pgms from the base metal refinery concentrates into
hydrochloric acid.
2) Separation of the pgms by precipitation, solvent extraction and other methods.
3) Purification of the separated species prior to reduction to the metals.
This chapter focuses on the first of these operations. In many ways it is the most
challenging of the three, having to contend with a feedstock of highly variable
composition containing over 30 elements.
Numerous process samples, provided by WESTERN PLATINUM REFINERY and BARPLATS
REFINERY, have thus been investigated with the aim of gaining a better understanding of
problems being encountered in the extraction of the pgms into hydrochloric acid. It
should be appreciated that this has taken the form of a qualitative speciation study, and in
many instances the exact details of certain processes are not given under the constraints
of the confidentiality that exists in this industry.

77
5.2 OVERVIEW OF PGM REFINERY OPERATIONS (1)
Whereas the base metal refinery depends entirely on the ore concentrate provided by the
mine, known as matte, the platinum group metal refinery depends entirely on the pgm
concentrates provided by the base metal refinery. The purpose of this section is to give
a broad overview of the various operations taking place at the pgm refinery.
5.2.1 PGM CONCENTRATES
The base metal refinery produces and supplies two different concentrates to the pgm
refinery. The origin of each was described in § 4.3.3 and § 4.3.4, and appears in Figure
4.3-1. Normal concentrates are essentially the insoluble residue from the copper circuit,
while the minor so called "selenium concentrates" derive from the selenium circuit.
These minor concentrates may be treated and supplied separately, blended into a mixed
concentrate, or re-introduced to the Bl\I1R circuit. The percentage of precious metals
present in normal concentrates is highly variable, ranging anywhere from 40 to 66%.
The pgm grade relative to the total precious metal content (pgms + Au + Ag) is usually
between 49.5 and 56.3%. Normally very little osmium is present (0.6 - 2.7% relative to
the total pgm content). This is a feature of Merensky and UG-2 pgm concentrates,
although the UG-2 reef tends to yield concentrates with slightly higher levels of osmium.
5.2.2 CONCENTRATE PRE-TREATMENT
Before undergoing the oxidative leach to extract the pgms, it is usually of benefit to
subject concentrates to a number ' of pre-treatment steps aimed at the removal of
unwanted impurities and further enrichment of the feedstock. Typical pre-treatment
steps are :
1) An acid leach to remove iron and nickel
2) A sulphidising process to increase pgm solubility
3) A polysulphide leach to remove most of the metalloids
4) A roast to upgrade the residue

78
5.2.3 THE HCl/CI2 OXIDATIVE LEACH
After pre-treatment, the concentrate is leached using 6M hydrochloric acid and chlorine
gas at elevated temperatures. Oxidation leads to the dissolution of almost all the
platinum, palladium, rhodium and iridium, which pass into solution as the chloro- species
[PtCI6]2-, [PdCI4]2-, [RhCI6]3-, and [lrCI6]2-. Gold dissolves similarily forming
tetrachloroaurate(III), [AuCI4]-. A fair amount of ruthenium and osmium also dissolve
(forming [RuCI6]2-, [OsCI6]2-).
5.2.4 REMOVAL OF HYDROUS OXIDES
The pH of the filtrate is adjusted to initiate hydrolysis reactions that precipitate most of
the antimony, bismuth, tellurium, silver and lead as their hydrous oxides. These are
filtered off.
5.2.5 GOLD EXTRACTION
The pH of the solution is further adjusted, and a reductant added to reduce [AuCI4]- to
metallic gold. The reduction leads initially to a fine colloidal suspension, which can be
made to agglomerate by boiling, into gold sponge, known as 'brown gold'. The impure
sponge is filtered off and purified.
One purification method involves redissolving the sponge in aqua-regia (HClIHN03) or
HCl/CI2 at 60°C thereby forming soluble [AuCI4]- once more. This solution is diluted
and sodium sulphate added. In this way silver is removed as the chloride and lead as the
sulphate. A second reduction yields a sponge with very low levels of silver, palladium
and copper. Leaching this sponge with nitric acid removes these impurities almost
entirely and after ignition at 900°C, pure gold of 99.9% purity is obtained.

79
5.2.6 RUTHENIUM EXTRACTION
Ruthenium is next extracted by adding sodium chlorate to the filtrate and boiling. In this
way [RuCI6]2- is oxidized to ruthenium tetroxide gas, Ru04 ' (A small amount of Os04
also forms .) The gaseous oxide is distilled out and collected into carbon tetrachloride
(CCI4), from which it is extracted back into hydrochloric acid. Thermal reduction
follows, to ensure that all soluble ruthenium is present as [RuCI6]3- which is solvent
extracted using triethylphosphate in an organic solvent. After purification of the solvent
by washing, ruthenium can be extracted back into hydrochloric acid and precipitated as
the ammonium salt, (NH4h[RuCI6], by boiling with ammonium chloride. Ignition of
this salt at lOOO°C under hydrogen produces pure ruthenium powder.
5.2.7 PLATINUM EXTRACTION
After the oxidation step to remove ruthenium, all the platinum is present as [PtCI6]2-.
Platinum can now be precipitated as the ammonium salt, (NH4h[PtCI6], by adjusting the
pH to 5 and adding ammonium chloride as a saturated solution. The salt is filtered off
and after washing and drying, ignited in air at lOOO°C to give impure Pt sponge.
This sponge can be purified by redissolving in HCI (using Cl2 as the oxidant) and
adjusting the pH by adding aqueous ammonia. Hydrolysis leads to the precipitation of
most impurities (Ru, Ir, Rh and Fe) as the hydrous oxides. Controlled reduction ofPtIV
to pta yields the pure metal which can be melted and cast into ingots.
(Numerous other methods exist.)
5.2.8 PALLADIUM EXTRACTION
The platinum-free filtrate is now adjusted to pH 5-6 by the addition of aqueous ammonia
and the temperature reduced to 60°C. Slow addition of hydrochloric acid to this
solution results in the precipitation of the impure neutral complex Pd(NH3hC12 (almost
entirely the trans- isomer, formed as a result of the trans effect) .

80
The precipitate is purified by redissolving in aqueous ammonia of pH 10 at 80°C. At
this high pH, all the base metals precipitate as their hydroxides and can be filtered off
Pure Pd(NH3hC12 is reprecipitated by the addition of hydrochloric acid and filtered off,
washed and dried. Ignition under hydrogen at lOOO°C produces palladium sponge of
99.99% purity.
Very successful solvent extraction methods are currently replacing this method.
5.2.9 IRIDIUM EXTRACTION
The filtrate now contains iridium and rhodium which are separated by the addition of
ammonium chloride solution and refluxing for 1 hour. On cooling the solution, the
impure salt (NH4h[IrCI6] precipitates. After pufication by precipitation methods,
ignition of this salt in hydrogen at lOOO°C yields pure iridium sponge.
5.2.10 RHODIUM EXTRACTION
The filtrate from the iridium extraction step still contains numerous impurities such as
copper, nickel, iron, lead and silver. After these have been removed, the solution
contains rhodium present as the hexachloro- anion [RhCI6]3-. By adding a small amount
of ammonium chloride and boiling down to a slurry to remove most of the acid, followed
by the addition of further ammonium chloride and cooling to room temperature, the salt
(NH4)3 [RhC161 can be precipitated.
Purification of this salt involves redissolving in aqueous ammonia of pH 10 at room
temperature. After several hours, the slurry is boiled. Lowering the pH to 5 by the
addition of hydrochloric acid at 90°C and then cooling causes the complex salt
[Rh(NH3)5CI]C12 to precipitate. This is further purified by leaching and after washing
and drying is ignited at 1000°C under hydrogen to produce pure rhodium powder.

81
5.2.11 RESOLUBILISATION
Using a number of different processes, most of the highly inert insolubles from the
oxidative leach can be converted to pgm species which are acid soluble.
5.2.12 LEAD FUSION
During the separation process, numerous waste residues, dust, and precipitates
containing low but significant levels of the pgms are produced. A large bulk of
precipitate containing ruthenium, palladium and some platinum IS produced in the
purification of ammonium hexachloroplatinate(IV) for example. All such residues,
together with metals precipitated with zinc or magnesium from dilute waste solutions are
dried and mixed with lead carbonate and smelted in an arc furnace. The carbonate is
decomposed and reduced to molten lead which acts a.s a collector of the pgms. Other
elements form an oxide slag. After cooling, the lead ingots are dissolved in nitric acid.
Metallic lead dissolves as soluble lead nitrate leaving behind an extremely fine pgm
sludge that can be returned to the oxidative leach step.
5.3 CONCENTRATE PROBLEMS
5.3.1 COMPOSITION OF CONCENTRATES
The pgm concentrations of concentrates can vary widely, although the order of
abundance is generally constant (see below).
Normal concentrates : Pt > Pd > Ru > Rh > Ir> Os
Minor concentrates : Ru > Rh > Pt > Pd > Ir > Os
An elemental analysis of a South African normal concentrate reveals the presence of over
30 elements. This gives an indication of the difficulty in analysing concentrates by XPD,
because these elements can be present as binary or ternary alloys, oxides, and a whole
series of complex mixed chalcogenides.

82
5.3.2 SINTERING OF THE PGM RESIDUE IN NORMAL CONCENTRATES
The nickel-copper alloy containing the bulk of the pgms dissolves easily during the first
and second stage leaches in the base metal refinery. This leaves a fine residue of metallic
pgms of low crystallinity. If the concentrate is dried too harshly at the base metal
refinery, sintering between the fine pgm particles can occur. This effect is accompanied
by an observable rise in the crystallinity of the sample (indicated by an increase in the
counts registered for the maximum intensity peak, given the symbol 11). Sintering is
undesirable as it leads to a concentrate which dissolves much more slowly and erratically
in the oxidative HCI/Cl2 leach. As will be shown later, this can lead to a drop in the
solubilities of some pgms.
A series of concentrate drying experiments were conducted in which it was found that
sintering of the pgms can be substantially reduced by moistening the concentrate with
sulphuric acid (20g/1) prior to drying.
Five concentrates were dried at the temperatures 160°C and 260°C, in each case with
and without moistening with sulphuric acid, and also at 110°C without sulphuric acid.
XPD scans of each were then run and the counts for the strongest pgm residue peak at a
d-spacing of about 2.2SA measured (this peak originates from the (111) planes of the
cubic pgms Pt, Pd, Rh and Ir). The results are listed in Table 5.3.2-1.
The sintering of the pgm residue for concentrate [3] under normal drying conditions is
shown in Figures 5.3.2-1(a) and (b), 5.3.2-2 (a) and (b) and 5.3.2-3 (a) and (b) (the
(111) pgm residue peak occurs at about 28 = 47°). The copper sulphide CuS, which
was present in this concentrate and is not affected by normal drying, has been used as a
reference peak in these figures (arrowed).

100 80 60
1/11 40 20
Concentrate [3] (Dried at 110°C)
83
Card number : WP-079
h 24
o .... , ... ..... , ... ..... , .... ····j ···· I····'···· I· ··· .· ··· I···· '···· .... , .... , ... . 1 •• • '1 .... 1 ••••• • •• , • • • • , ' ••• , • •••
o ill ~ ~ ~ ~ ro ~ 00 W ~ 00 W 28 (degrees) COKC(l
Copper sulphide eus (Covellite)
06-0464 100 00 60
IIIl 40
~ . " . , . .'.""., ...... ,L ... , ... I .. 4" .""J ,,:.d "".\".').'"".' "~L ,, "". "ti ",, !,,"
Intensity (counts)
o ill ~ ~ ~ ~ ro ~ 00 W ~ 00 W 28 (degrees) COKIXI
Figure 5.3.2-1(a)
Rad. COKIXI : 1.7889 100
81
64
49
36
25
16
9
4
1
0 0 10 20 30 40 50 60 70 80 90 100 110 120
diffraction angle, 28 (degrees)
Figure 5.3.2-1(b)

100 80
I1II ~~ 20
Concentrate [3] (Dried at 160°C)
Card number : WP-085
It: 36
o+=~~~~~~~~~~~~~~~~~~~
o ill ~ ~ ~ ~ ro ~ 00 ~ ~ M ~ 28 (degrees) COKcr:l
Copper sulphide CuS (Covellite)
84
100 80
06-0464
I1II 60 40
2~~ .. ~ ... ~ ... = .. *., .. = ... = .. = ... = ... = ... ~.IJ~ ... ~ ... ~ .. = ... *,.I .. = .. ~I. !.~ ... ~ ... ~. I~".~.'.I'~)'="'*""~" I~ .. ~~I .. ,~"~~, .. +,,,!~,,,~,,.= ... = ... ~. ~II~ ... +'.!.d ...
Intensity (counts)
o 10 20 30 40 50 60 70 80 28 (degrees) COKcr:l
90 100 110 120
100
81
64
49
36
25
16
9
4
1
0 0
Figure 5.3.2-2(a)
Rad. COKcr:1 : 1.7889
ill ~ ~ ~ ~ ro ~ 00 ~ ~ M ~ diffraction angle, 28 (degrees)
Figure 5.3.2-2(b)

100 80
IIII 60 40 20
Concentrate [3] (Dried at 260°C)
85
Card number : WP-097
h 121
O~~==~~~~~~~~~~~~~~=+.~~
100 80
IIII 60
o ill ~ .~ ~ ~ ro ~ ~ ~ ~ rn ~ 28 (degrees) COKCl:I
Copper sulphide CuS (Covellite)
06-0464
40
2~ .... " ..... ' .. " .. . , ... .... . , .Ii,. """",. ,' .... " ~ " " " '" I., ,:.'. ,I , .. " .... ," !'.", ,I" , .. ! .... ", .. " .. ~I, .. , ,! .. ..
Intensity (counts)
o ill ~ ~ ~ ~ ro ~ ~ W ~ rn ~ 28 (degrees) COKCl:I
200
162
128
98
72
50
32
18
8
2
0 0
Figure 5.3.2-3(a)
Rad. COKCl:I : 1.7889
ill ~ ~ ~ ~ ro ~ ~ W ~ rn ~ diffraction angle, 28 (degrees)
Figure 5.3.2-3(b)

86
Table 5.3.2-1 Reduction of pgm sintering using H2S04
Drying temperature Counts measured for the (111) pgm residue peak [2] [3] [4] [5] [6]
110°C 44 15 15 - t 25
160°C 66 36 30 10 46 160°C (+ H2SO4) 38 18 10 -t 19
260°C 225 121 56 20 72 260°C (+ H2SO4) 108 67 27 17 40
t Very low intensity - counts above background counts could not be measured
Table 5.3.2-1 shows that in each case the sintering effect is reduced by the addition of
sulphuric acid. Two scans from concentrate [6] dried at 260°C with and without
sulphuric acid are shown in Figure 5.3.2-4(a) and (b) and Figure 5.3.2-5(a) and (b).
Notice the measured values ofI I corresponding to the (111) peak.
The detrimental effects of overdrying concentrates are dealt with in later sections.
5.4 BASE METAL PROBLEMS
The three most important base metals occurring in pgm extraction are iron, nickel and
copper. Together they account for about 7% of the mass of normal concentrates and
4% of minor concentrates. If they are not carefully removed from the process, they can
pose serious impurity problems. This removal is however critically reliant on a
knowledge of what compounds are involved. The following three sections examine the
various iron, nickel and copper compounds identifed in process samples supplied by the
refinery.

100 80 60
I1II 40 20
Concentrate [6] (Dried at 260°C with H2S04)
87
Card number : WP-106
h 40
O+'=h===~~~~~~Hb~~~~~+.r-~~~~~
100 80 60
I1II 40
o ill ~ ~ ~ ~ ro ~ 00 ~ ~ 00 W 29 (degrees) COKCX:l
Platinum palladium rhodium iridium (Pt,Pd,Rh,Ir) (Residue of cubic pgms)
05-0681
2~ """" ' I """" ' \ " ", '" ' I """" 'I "'. " " ' I " .. "'" """'" .... , "" !, ., "'" "" ",.J .. , ,,t,,, 'I "" " .. ,
Intensity (counts)
o ill ~ ~ ~ ~ ro ~ 00 ~ ~ 00 W 29 (degrees) COKCX:I
100
81
64
49
36
25
16
9
4
1
0
....
0 10
Figure 5.3.2-4(a)
Rad. COKCX:I : 1.7889
,
~ ~ ~ ~ ro ~ ~ ~ ~ 00 W diffraction angle, 28 (degrees)
Figure 5.3.2-4(b)

100 80
1/11 60 40 20
Concentrate [6] (Dried at 260o)C)
88
Card number : WP-l00
h 72
O~~==~+.d~~~~~~~~~~==~~~~~
100 80 60
1/11 40
o 10 20 30 40 50 60 70 80 90 100 110 120 28 (degrees) COKCX:l
Platinum palladium rhodium iridium (Pt,Pd,Rh,Ir) (Residue of cubic pgms)
05-0681
W I I o .... , ... 'T"""" ·T··· · ,. " 'T .... , ... T···· ' ··· ·1 ···· , ... · 1· ···'·" · 1··" , .... 1 .... '. " . .. .. , .... . . " ,I .. .. . , .. , . . . .
Intensity (counts)
o ro ~ ~ ~ ~ ro ~ 00 ~ ~ 00 W
200
162
128
98
72
50
32
18
8
2
0 0
28 (degrees) COKCX:l
Figure 5.3.2-5(a)
Rad, COKCX:l : 1.7889
T
ro ~ ~ ~ ~ ro ~ 00 ~ ~ 00 ~ diffraction angle, 29 (degrees)
Figure 5.3.2-5(b)

89
5.4.1 THE IRON PROBLEM
In the previous chapter (§ 4.4), it was established that the main iron compound occurring
in the base metal refinery was the oxide Fe304' It was also mentioned that reactions
with nickel oxide, NiO, can result in the formation of nickel iron oxide, NiFe204, by
replacement of Fe2+ with Ni2+ in the inverse spinel structure - M3+(M2+M3+)04'
Furthermore both these oxides are mutually soluble and crystallographically almost
identical. This oxide solid solution solubilizes with difficulty, even in the second stage
pressure leach. Consequently these oxides would be expected in pgm refinery samples.
Chemically their dissolution is not favoured by the highly oxidative (HCl/CI2) leach used
for pgm dissolution. Therefore the presence of these oxides in oxidative leach residues
would be expected. It was however observed that in all cases the diffraction peaks
corresponded very closely to the oxide NiFe204 rather than Fe304, as Table 5.4.1-1
shows (values in boldface indicates overlap with another phase).
Table 5.4.1-1 Comparison of NiFe204 reference data with peaks
observed for two HCl/Cl2leach residues
NiFe204 Hel/el2 residue 1 (WP-OOl) Hel/el2 residue 2 (BP-027)
Reference data (2) Observed data Observed data d(A) (1111) 29 t d(A) (1111) 29 t d(A) (1111) 29 t
4.82 (20) 21.4 4.813 (8) 21.4 2.948 (30) 35 .3 2.944 (45) 35 .3 2.950 (12) 35.3 2.513 (100) 41.7 2.514 (100) 41.7 2.515 (100) 41.7 2.408 (8) 43 .6 2.413 ( -) 43.5 2.085 (25) 50.8 2.092 ( -) 50.6 2.086 (12) 50.8 1.6051 (30) 67.7 1.601 (50) 67.9 1.605 (30) 67.7 1.4760 (40) 74.6 1.476 ( - ) 74.6 1.475 (39) 74.6 1.2706 (10) 89.5 1.274 (20) 89.2 1.272 (11) 89.3 1.2573 (4) 90.7 1.257 ( -) 90.8 1.256 (20) 90.9 1.2036 (6) 96.0 1.208 (-) 95.5 1.200 (22) 96.4 1.0857 (16) 110.9 1.082 (25) 111.6 1.086 (11) 110.9 1.0424 (6) 118.2 1.044 ( -) 117.9 1.043 (14) 118.1
t All 29 data in this and all following tables is applicable for radiation of wavelength A. = 1. 78894A (CoKa I)
(Scans for samples wp-oo 1 and BP-027 appear in § 5.4.2.)

90
An XPD analysis showing traces of NiFe20 4 in oxidative leach residues immediately
indicates that the pre-treatment leach to remove iron has only partially succeeded and
should be revised.
In most cases iron in solution is precipitated as hydrated oxide by appropriate control of
pH. Hydrated oxides are normally of such low crystallinity that they are not identifiable
using XPD. In one sample however (originating from a solution where the iron had
been precipitated from solution by pH control and prolonged boiling) a hydrated oxide of
iron was detected and identified as being J3-FeOOH. Table 5.4.1-2 compares the
reference data for this compound with that observed for this sample.
Table 5.4.1-2 · Comparison of J3-FeOOH reference data with peaks observed for an iron-rich precipitate
J3-FeOOH pH 3 Cake [2] (WP-025-A)
Reference data (3) Observed data d(A) (1111) 20 d(A) (1111) 20
7.40 (100) 13 .9 7.262 (38) 14.1 5.25 (40) 19.6 5.215 (33) 19.8 3.311 (100) 31.3 3.321 (89) 31.2 2.616 (40) 40.0 2.618 (36) 40.0 2.543 (80) 41.2 2.528 (100) 41.4 2.285 (40) 46.1 2.278 (56) 46.2 1.944 (60) 54.8 1.942 (42) 54.9 1.746 (40) 61.6 1.748 (35) 61.5 1.635 (100) 66.3 l.636 (75) 66.3 1.515 (40) 72.4 1.507 (44) 72.8 1.497 (20) 73.4 1.501 (35) 73.2 1.438 (80) 76.9 1.441 (50) 76.8 1.374 (40) 81.2 1.378 (31) 81.0
Figure S.4.1-1(a) shows the reduced pattern for the sample matched with that for the
reference compound. The peaks as observed are shown in the sample scan (Figure
S.4.1-1(b»). Only three good diagnostic lines have been arrowed. Note the low
crystallinity of the sample, and that no other lines due to other phases are observed.

100 80 60
I1Il 40 20
pH 3 Cake [2] Card number : WP-025-A (after salt extraction)
o~~~~==~~~~~~~~~~~~~~~
o ill ~ .~ ~ ~ ro ~ 00 w m 00 ~
Iron oxide hydroxide beta-FeOOH
28 (degrees) COKC(l
(Akaganeite) 100 80 60
1/11 40
20 I ,I II I II III I o .... , .... ····t···· . ... , ..... . .. , .... . ... , .. . . .. . . , . .. . . .. . ..... .. .. , .... ··· ·, ···· ,···· 1· ···1···· .···· ,····,· ··· o ill ~ ~ ~ ~ ro ~ 00 w m 00 ~
28 (degrees) COKC(l
Figure 5.4.1-1(a)
Rad. COKC(l : 1.7889 200
162
128
98 , 72
Intensity 50 (counts) 32
18
8
2
0
91
13-0157
0 ill ~ ~ ~ ~ ro ~ 00 w m rn ~
diffraction angle, 28 (degrees)
Figure 5.4.1-1(b)

92
Iron oxide hydroxide (the beta- form) can be synthetically prepared by the hydrolysis of
FeCl3 in solution at 60-100°C and usually takes 6 hours at these temperatures to
crystallize (4, 4a). Before crystallizing, FeOOH forms in solution as a gel with a high
active surface area (5) with strong absorptive properties and is thus capable of taking
down ions of other elements on precipitation. The elemental analysis (Table 5.4.1-3) of
this sample is thus of interest as it indicates those elements favoured to co-precipitate on
hydrolysis in hydro~hloric acid at pH 3 (pH increased with NaOH). Tellurium appears
to be very well removed from solution under these conditions.
Table 5.4.1-3 Partial elemental analysis for a precipitate of the hydrous iron oxide J3-FeOOH
Element Weight %
Iron 27.74 Tellurium 5.17 Copper 3.21 Iridium 2.97 Rhodium 1.31 Aluminium 1.23 Bismuth 1.09
Elements occurring in trace amounts (in order) : As, Pb, Sb, Se, Pt, Ni, Pd, Sn, Ru, Ag, Au The rest of the weight of this sample was due to salt (NaCl).
One of the concentrate pre-treatment steps involves a polysulphide leach aimed at
removing metalloids. Scans of residue samples showed a line of relatively high intensity
at about lOA (28 = 10°) (Figure 5.4.1-2(a) and (b». This seemed to indicate sodium
iron hydroxide sulphate hydrate, Na2Fe(S04h(OH)·3H20. Tiny nucleated lemon
yellow crystals were isolated from one of the samples and the scan produced a good
match with the reduced spectrum of the reference compound (Figure 5.4.1-3(a) and
(b». The comparison of reference and observed data is given in Table 5.4.1-4
(comparison for 28 = 5 - 52°). Quite high d-shifts were observed (salt of synthetic
origin).

Poly [3] (dry sample)
93
Card number : WP-068
100 II: 38 80 60
1/11 40 20 O+=~~~~~~r.+.~~~~~~~~+.=~~~~
o ill ~ .~ ~ ~ ro ~ m w ~ 00 ~ 28 (degrees) COKC!:l
Sodium iron hydroxide sulphate hydrate Na2Fe(S04)2(OH)· 3H20 (Sideronatrite)
100 17-0156 80 60
IIIl 40 20 O+=~=+.~~~~~~~~~~~~==~~~~~
Intensity (counts)
o ill ~ ~ ~ ~ ro ~ m w ~ 00 ~ 28 (degrees) COKC!:l
100
81
64
49
36
25
16
9
4
1
0 0
Figure 5.4.1-2(a)
Rad. CoKO:1 : 1.7889
ill ~ ~ ~ ~ ro ~ m ~ ~ 00 ~ diffraction angle, 28 (degrees)
Figure 5.4.1-2(b)

100 80
1/11 60 40 20
Lemon yellow crystals (formed on Poly [3])
94
Card number : WP-068-A
h 228
O+'=~=+-MM~+.H~~~~~~~~~~~~~~
100 80 60
1/11 40 20
o 10 20 30 40 50 60 70 80 90 100 110 120 28 (degrees) COKC<l
Sodium iron hydroxide sulphate hydrate Na2Fe(S04h(OH)' 3H20 (Sideronatrite)
17-0156
O+=~=+'~~~~~~~~~======~~~===d
o ro ~ ~ ~ ~ ro ~ ~ 90 100 110 120 28 (degrees) COKC<l
Figure 5.4.1-3(a)
Rad. COKlXl : 1.7889 500
405
320
245 ,
180 Intensity
125 (counts) 80
45
20
5
0 0 10 20 30 40 50 60 70 80 90 100 110 120
diffraction angle, 28 (degrees)
Figure 5.4.1-3(b)

95
Table 5.4.1-4 Comparison of Na2Fe(S04h(OH)·3H20 reference data
with peaks observed for yellow iron rich crystals
NazFe(S04h(OH)·3HzO Yellow crystals in concentrates (WP-068-A)
Reference data (6) Observed data Deviation
d(A) (IIII) 28 d(A) (IIII) 28 Ad(A)
10.2 (100) 10. i 10.263 (100) 10.0 + 0.063
6.78 (40) 15 .2 6.873 (8) 15.0 + 0.093
5.86 (30) 17.6 5.951 (4) 17.3 + 0.091
5.00 (20) 20.6 5.065 (5) 20.3 + 0.065
3.58 (40) 28 .9 3.646 (15) 28.4 + 0.066 3.38 (60) 30.7 3.430 (38) 30.2 + 0.050 3.18 (20) 32.7 3.228 (8) 32.2 + 0.048 3.01 (80) 34.6 3.045 (87) 34.2 + 0.035 2.86 (5) 36.5 2.902 (5) 35.9 + 0.042 2.68 (60) 39.0 2.725 (28) 38.3 + 0.045 2.537 (10) 41.3 2.574 (11) 40.7 + 0.037 2.437 (10) 43 .1 2.474 (6) 42.4 + 0.037 2.375 (20) 44.2 2.413 (11) 43 .5 + 0.038 2.251 (10) 46.8 2.288 (l2) 46.0 + 0.037 2.062 (10) 51.4 2.096 (11) 50.5 + 0.034
Although it seems quite an unusual compound, identification was important because this
salt is reported to be soluble in cold water but unstable in warm water, in which it
hyrolyses, precipitating hydrated iron oxide (7) . The salt was thus synthesized
according to a published method (8) . A scan of the product matched that of the salt
showing a successful synthesis. The product was indeed observed to hydrolyse in hot
water forming a dense brown precipitate of hydrated iron oxide (of a-FeOOH rather than
p-FeOOH - hydrolysis was rapid).
The only traces of the iron oxide Fe304 that were found were in samples from the lead
fusion process. After dissolving the lead ingots in nitric acid, an insoluble residue is left
behind. A scan of one of these residues gave a few peaks indicative of Fe304. The
sample was magnetically separated and another scan performed on the magnetic fraction.

96
All the Fe304 peaks were enhanced in the second scan thus confirming the assignment.
A few of the lines overlapped those of another phase (Table 5.4.1-5).
As the lead fusion of waste residues and precipitates occurs at high temperatures this
oxide is probably formed by the thermal decomposition of ~-FeOOH (for example)
mentioned earlier, via the reactions :
2 FeOOH ---+ Fe203 + H20
6 Fe203 ---+ 4 Fe304 + O2
The second of these reactions only occurs at 1400°C which is quite high. Another route
for the formation of Fe304 might be through the mixed metal oxide PbFe12019 which,
when leached with nitric acid, would give a precipitate of Fe304 (9). The Fe304 found
in the nitric acid insolubles was observed to have an unusually low crystallinity (Figure
5.4.1-4(a) and (b» .
Table 5.4.1-5 Comparison of Fe304 reference data with peaks observed of nitric acid insolubles (magnetics)
FeJ0 4 Nitric acid insolubles (magnetics) (WP-005-A)
Reference data (10) Observed data deAl (1111) 29 deAl (1111) 29
2.967 (30) 35 .1 2.968 ( -) 35.1 2.532 (100) 41.4 2.520 (100) 41.6 2.0993 (20) 50.4 2.096 (59) 50.5 1.6158 (30) 67.2 1.612 (34) 67.4 1.4845 (40) 74.1 1.483 ( -) 74.2 1.2807 (10) 88 .6 1.280 ( -) 88.7 1.0930 (12) 109.8 1.091 (24) 110.2 1.0496 (6) 116.9 1.049 ( -) 117.0
Iron-pgm alloys are generally not encountered in pgm extraction (with one exception -
see § 5.5.4), although in one experiment carried out by BARPLATS platinum refinery a
misunderstanding lead to the formation of an iron-platinum alloy.

Nitric acid insolubles [1] (magnetic fraction)
97
Card number : WP-005-A
100 80 60
IIIl 40
h 42
20 o+=====~~~~~~~~~~~~~~~~~~
100 M
o ill ~ ~ ~ ~ ro ~ M ~ ~ 00 m 28 (degrees) CoKO: l
Iron oxide Fe304 (Magnetite)
IIIl 60
~ I 2~ .. " , ...... " , ..... '." , .... ,,, .. ! .... , ... '. , ... ..I. ... , .. . 'T" !' , .. 1 ..... . , ........ , . ..I.," " ,." ., .... , .... \" .. ,:+ ..
Intensity (counts)
o ill ~ ~ ~ ~ ro ~ M ~ ~ 00 W 29 (degrees) CoKO:1
Figure 5.4.1-4(a)
Rad. CoKO:1 : 1.7889 100
81 , 64
49
36
25
16
9
4
1
0
19-0629
0 ill ~ ~ ~ ~ ro ~ 00 ~ ~ 00 W diffraction angle, 28 (degrees)
Figure 5.4.1-4(b)

98
An insoluble pgm residue was resistant to a RCVCl2 leach. It was felt that this might be
due to sulphides. The sample was thus reduced in hydrogen at 800aC in order to
convert the pgms to metals which, it was hoped, would render it soluble. Analysis
showed that the reduction had produced the alloy PtFe (Figure 5.4.1-5 (a) and (b» .
Evidently the insolubles in the original sample had been residual iron oxide, Fe304, and
highly sintered platinum, which had reacted via the reaction :
Fe304 + 3 Pt + 4 R2 --{ 800aC ~ 3 PtFe + 4 H20
Table 5.4.1-6 compares the reference and observed data for this alloy. A few of the
peaks (boldface) showed significant shifts and differences in intensity. This could be due
to fast cooling the alloy or non-ideal stoichiometry. It should be noted that the reference
data was collected for a geological sample having the composition
(Ptl .03Iro.Ol)(Feo.69CuO.24Nio.02Sbo.Ol) (10) .
Table 5.4.1-6 Comparison of FePt reference data with peaks observed for a hydrogen reduced HCI/Cl2 residue
PtFe
Reference data (11)
d(A) (IIII) 29
3.69 (30) 2.714 (30) 2.195 (100) l.918 (40) 1.857 (30) l.707 (30) l.534 (30) 1.361 (30) l.338 (50) 1.280 (40) 1.243 (20) l.218 (30) l.156 (90) l.127 (60) l.098 (60) l.068 (5) l.042 (50)
28.1 38.5 48.1 55 .6 57.6 63 .2 7l.3 82.2 83 .9 88.7 92.0 94.5 lOlA 105.1 109.1 113 .8 118.3
H2 Reduced residue (BP-023)
Observed data d(A) (IIII) 29
3.640 (13) 2.735 (17) 2.184 (100 l.930 (24) 1.818 (13) l.706 (11) 1.512 (8) l.366 (10) l.323 (20) l.278 (6) 1.222 (8) 1.212 (5) l.158 (29) 1.122 (1) l.091 (13)
1.035 (2)
28.5 38.2 48.3 55.2 59.0 63.2 72.5 8l.8 85.1 88.8 94.1 95.1 1Ol.2 105.7 110.2
119.6

100 80
I1II 60 40 20 0
HCI leach residue of slow cooled matte Card number : BP-023 (after 3 hour H2 reduction)
0 ill ~ ~ ~ ~ ro W 00 ~ m m w 28 (degrees) COKCt:1
Iron platinum PtFe (Tetraf errop la tin urn)
99
100 r---------------------, 26-1139 80 60
I1II 40 20 O~~~~~~~~~=H~~~==~~~~~~~
Intensity (counts)
o 10 20 ~ ~ ~ ro W 00 ~ m m w 28 (degrees) COKCt:l
1000
810
640
490
360
250
160
90
40
10
0 0
Figure 5.4.1-5(a)
Rad. COKCt:1 : 1.7889
-
ill ~ ~ ~ ~ 60 W 00 90 m m ~ diffraction angle, 29 (degrees)
Figure 5.4.1-5(b)

100
Only one further compound containing iron was identified. This was a magnesium-iron
silicate, (Mg,Fe)Si03, of geological origin. Being totally inert this compound poses no
process problems (see § 5.5 .9).
Table 5.4.1-7 lists the iron compounds identified in the process samples examined, their
occurrence and suggested methods of removal.
Table 5.4.1-7 IRON compounds occurring in pgm extraction
Compound Occurrence and removal
NiFe204 Concentrates and some HCl/CI2 residues
acid leach ego Hel f3-FeOOH Hydrated oxide precipitates
pH control Na2Fe(S04h(OH)·3H20 Pre-treated concentrates (polysulphide leach residues)
cold water wash Fe304 Nitric acid insolubles of lead ingots
magnetic separation PtFe alloy Hydrogen reduced HCl/CI2 residues ofPt and Fe304
re-leach with Helfel2
(Fe,Rhh.s1ro.2 alloy t Pre-treated concentrates (rare in large amounts)
partially Helfel2 soluble; insoluble traces remain
(Mg,Fe)Si03 t HCl/CI2 residues (rare)
HClfCl2 insoluble,' inert
t Covered in § 5.5.4 :I: Covered in § 5.5 .9

101
5.4.2 THE NICKEL PROBLEM
Nickel is far less of a problem in pgm extraction. The main nickel compound
encountered is the oxide NiFe204 (§ 5.4.1). Figure 5.4.2-1 shows the reduced pattern
of an aqua-regia leach residue of second stage leach residue matched with the NiFe204
reference pattern. This phase is always of high crystallinity giving sharp intense lines.
In this particular sample it survived the oxidative leach, along with highly inert quartz,
Si02 (Figure 5.4.2-2). This phase is formed during the conversion stage of mine
operations (§ 4.2.3). Aeration of smelter matte results in numerous tiny oxygen-filled
cavities, some of which are trapped in the solid on cooling during post conversion. Each
of these cavities is lined with a grey crust. A XPD scan of this aeration crust showed
that it was predominantly NiFe204 (Figure 5.4.2-3(a) and (b». (Another interesting
phase identified was the cobalt sulphide Co3S4 - Figure 5.4.2-3(c). This was the only
cobalt compound identified in all the analyses peformed.) The aeration cavities
occurring in a matte chunk are indicated in Figure 5.4.2-3(d).
The only other nickel compound found in any of the samples was nickel oxide, NiO.
Table 5.4.2-1 compares the reference data with that observed for a leach residue sample
(boldface type indicates overlap with another phase).
Table 5.4.2-1 Comparison of NiO reference data with peaks observed for a HCI/Cl2 leach residue
NiO BCI/el2 residue [1] (WP-OOl)
Reference data (12) Observed data d(A) (1111) 20 d(A) (1111) 20
2.410 (91) 43 .6 2.413 (75) 43 .5 2.088 (100) 50.7 2.092 (100) 50.6 l.476 (57) 74.6 1.476 (-) 74.6 1.259 (16) 90.5 1.257 (14) 90.8 1.206 (13) 95.8 1.208 (11) 95 .5 1.0441 (8) 117.9 1.046 ( -) 117.5

IIII
100 80 60 40 20 0
100 80 60 40
Aqua-regia leach residue [1] Card number: BP-027 (of second stage leach residue) : scan 1
0 10 20 30
Nickel iron oxide NiFe204
~ ~ ~ ~ ~ W ~ m ~ 28 (degrees) COKCXI
(Trevorite)
102
10-0325
2~ ......... , ......... ) ..... .. , ... J ... T .. I ••• ••• I .... ... ..... 1 ••• .1.. ......... ..... , .. .. 1 .... . ~ .. . ...... ' ... ! ... , .. '.
100 80
o ill ~ ~ ~ ~ ~ ~ ~ W ~ m ~ 28 (degrees) COKCXI
Figure 5.4.2-1
Aqua-regia leach residue [1] Card number: BP-027 (of second stage leach residue) : scan 1
h 372
IIII 60 40
I1II
20 0+===~~~~~~~~~~~~4=~~~~~~
o ill ~ ~ ~ ~ ~ ~ 00 ~ ~ m ~ 28 (degrees) COKCXI
Silicon oxide alpha-Si02 (Quartz, low)
100 ,------------...:.------- 05-0490 80 60
40 I 20 I I I I I II o ............. , ......... ''' ' ............. , .... , ......... , .... '; ........ , ........ ....... .. ..... , .... , ... 'T' ... , ... .
o ill ~ ~ ~ ~ ~ ~ 00 W ~ m ~ 28 (degrees) COKCXI
Figure 5.4.2-2

100 80
I1Il 60 40 20 0
100 80
IIIl 60 40 20 0
Intensity (counts)
103
Aeration crust [1] Card number : BP-030 (of slow cooled matte [F])
0 10 20 30
h 79
~ ~ ro ~ ~ ~ m 00 m 29 (degrees) CoKO:: l
Nickel iron oxide NiFe204
0 10
200
162
128
98
72
50
32
18
8
2
0 0
20 30
(Trevorite) 10-0325
~ ~ ro ~ ~ ~ m 00 m 28 (degrees) CoKO:: l
Figure 5.4.2-3(a)
Rad. CoKO::1 : 1.7889
,
ro ~ ~ ~ ~ ro ~ ~ ~ ~ 00 m diffraction angle, 28 (degrees)
Figure 5.4.2-3(b)

104
Aeration crust [1] Card number : BP-030 (of slow cooled matte [F])
100 80 60 40 20
h 79
O~~~~~~~~~~+.=~*'*~~~~~~~~~~
o 10 20 . 30
Cobalt sulphide C03S4
40 50 60 70 80 28 (degrees) COK(XI
90 100 110 120
100 80 60 40
2~ ~~. """"l"' .• .• • ,.,.,+y .. . ~ .... ':"'"'"'" . .. . . ,.,-:L:-:.' .. .,..+ . ... ~ ... ,..,.,...., .. ,1",.,..,.". " I~" .. ~., ... ".,.,.,.1 ... ,..,f,-: .• •. ""'""" 1''''+'''' ':+-"''''''I~) *""" .... +.. 1...:+;:-:1 .. .. .,+,..! .~ .. ... ,.,J,.". .. . b I . ... ~ .. . ..
o ill ~ ~ ~ ~ ro ~ ~ ~ ~ 00 ~ 28 (degrees) COK(XI
Figure 5.4.2-3(c)
Figure 5.4.2-3( d)
19-0367

105
The reduced and peak patterns for this sample are shown in Figure 5.4.2-4(a) and (b).
Those for another sample showing small amounts of NiO are shown Figure 5.4.2-5(a)
and (b). Two good diagnostic peaks are indicated.
The high crystallinity observed of this compound in samples indicates it has probably not
resulted from the leaching of iron from NiFe204 ie.
NiFe204 == [NiO·Fe203] + 6 HCI -x~ 2 FeCl3 + NiO + 3 H20
but rather exists associated with NiFe204.
Table 5.4.2-2 lists the nickel compounds identified in the process samples examined, their occurrence and suggested methods of removal.
Table 5.4.2-2 NICKEL compounds occurring in pgm extraction
Compound
NiO
Occurrence and removal
Normal concentrates and some HCVCl2 residues
acid leach eg. Hel Normal concentrates and some HCVCl2 residues
acid leach ego Hel

I1II
100 80 60 40 20 0
100 80
I1II 60 40
HClICl2 leach residue [1] (Finsol : Dried at 110°C)
Card number : WP-OOl
0 10 20
Nickel oxide NiO
~ ~ ~ 60 ~ ~ ~ ~ M W 28 (degrees) CoK 0.: I
(Bunsenite)
106
04-0835
~ I I O+"="'~" '~' "I"="'=" '="I~"'="'~"'~I" =" '=" ="I"~"'~"'=" I~"'=" '~"'~I"=" '=" ="I"~"'~"'~" I="'~'" =···~I··~· ·.~···~"I"=· · ·=.··=· ·I=· · ·=· .·~· ! ·
Intensity (counts)
o 10 20 30 40 50 60 70 80 90 100 110 120
200
162
128
98
72
50
32
18
8
2
0 0
28 (degrees) CoK 0.: 1
Figure 5.4.2-4(a)
Rad. CoKo.:1 : l.7889
, ,
,
ill ~ ~ ~ ~ 60 ~ ~ ~ ~ M W diffraction angle, 29 (degrees)
Figure 5.4.2-4(b)

100 80
IlIl 60 40 20 0
100 80
I1Il 60 40
107
HClICl2 leach residue [2] (Finsol : Dried at 110°C)
Card number : WP-002
0 10 20
Nickel oxide NiO
I . "'0'" l ' j J
~ ~ ~ ro W 00 ~ ~ 00 m 29 (degrees) COKCl:l
(Bunsenite) 04-0835
'''\0 ~ I l I o .. ··· .... 1 .... •· .. ·1 .... • • .. · 1 .... •• .. · 1 .. .. •• .. · · • .. •• .. · 1 .... • .. ··1 .. .. • .... 1 .... • .... 1 .. .. • .. · · ................ ..
o ill ~ ~ ~ ~ ro W 00 ~ ~ 00 m 29 (degrees) COKCl:l
Figure S.4.2-5(a)
Rad. COKCl:l : 1.7889 500
405
320
245
180 Intensity
125 (counts)
80
45
20
5
0 0 10 20 30 40 50 60 70 80 90 100 110 120
diffraction angle, 28 (degrees)
Figure 5.4.2-5(b)

108
5.4.3 THE COPPER PROBLEM
Copper is the most common and serious base metal impurity occurring in platinum group
metal refinery operations. Normal concentrates received from the base metal refinery
can be over 9% copper, while for minor concentrates the problem is less pronounced (the
copper content rarely going above 4%). One of the aims of the project was to identify
the copper species involved in the process, with a view to reducing the unacceptably high
levels of copper being encountered throughout operations.
From the analysis of several concentrates, it became clear that much of the problem was
due to the presence of very high levels of copper sulphate pentahydrate, CuS04·5H20 .
Figures 5.4.3-1(a) and (b), and 5.4.3-2(a) and (b) show the scans of two typical normal
concentrates showing copper sulphate peaks together with their reduced patterns. As is
normal for hydrated salts, the peaks are observed in the low angle region. Table 5.4.3-1
compares CuS04·5Hi.o reference data with that observed in these two samples.
Table 5.4.3-1 Comparison of CuS04·5H20 reference data with peaks observed for two normal concentrates
CUS04·5H20
Reference data (13)
d(A) (1111) 29
5.48 (55) 18.8 5.21 (10) 19.8 4.73 (100) 21.8 4.28 (15) 24.1 3.99 (60) 25 .9 3.71 (85) 27.9 3.54 (20) 29.3 3.45 (15) 30.1 3.30 (60) 31.5 3.05 (30) 34.1 2.749 (50) 38.0
Concentrate [9) (WP-126)
Observed data d(A) (1111) 29
4.706 (100) 21.9
3.988 (100) 25 .9 3.704 (100) 27.9
3.306 (100) 31.4 3.038 (100) 34.2
Concentrate [13) (WP-130)
Observed data d(A) (1111) 29
5.477 (54) 18.8 5.213 (49) 19.8 4.739 (65) 21.8 4.277 (49) 24.1 3.996 (86) 25 .9 3.706 (100) 27.9 3.551 (49) 29.2 3.474 (49) 29.8 3.304 (57) 31.4 3.004 (49) 34.6 3.752 (59) 27.6

100 80
1111 60 40 20
Concentrate [9] (normal concentrate)
Card number : WP-126
O+=~~~~~~==~~~~==~~~~~~~
100 80
I1Il 60 40
o ill ~ ~ ~ ~ ro ~ 00 w m 00 W
Copper sulphate hydrate CUS04 ·5H20
28 (degrees) COKIXI
( Chalcan thi te)
109
11-0646

100 80
I1II 60 40 20
Concentrate [13] (normal concentrate)
Card number : WP-130
110
It: 58
O+=~~~~~~~~~~~~~~~~~~~~
100 80 60 40 20
o ro ~ ~ ~ ~ ~ ~ 00 ~ ~ 00 ~ 28 (degrees) COKCXI
Copper sulphate hydrate CUS04 ·5H20 (Chalcanthite)
11-0646
o+=~==~~~~~~~~~~~====~======~ o ro ~ ~ ~ ~ ~ ~ 00 ~ 100 110 120
28 (degrees) COKIXI
Figure 5.4.3-2(a)
Rad. COKCXl : 1.7889 100
81
64
49
36 Intensity
25 (counts) 16
9
4
1
0 0 ro ~ ~ ~ .~ ~ ~ 00 ~ roo 00 ~
diffraction angle, 28 (degrees)
Figure 5.4.3-2(b)

111
The presence of this salt is due to incomplete washing of the pgm residue after the
second stage pressure leach of the copper circuit. Much of the copper in concentrates
can thus easily be removed by simply washing with water as a first pre-treatment step or
improving the washing process at the base metal refinery. Washing at the base metal
refinery can sometimes be so incomplete that dry concentrates contain masses of clear
blue crystals easily identifiable as copper sulphate crystals (Figure 5.4.3-3(a) and (b».
Not only are large quantities of copper introduced into the process by this impurity, but
also high levels of the sulphate anion.
Another related salt of copper found in some concentrates was copper sulphate
hydroxide hydrate, CU4S04(OH)6·H20. Table 5.4.3-2 compares the reference and
observed data for this phase.
Table 5.4.3-2 Comparison of CU4S04(OH)6'H20 reference data with
peaks observed for a normal concentrate
CU4S04(OH)6'H20 Concentrate [2] (WP-078)
Reference data (14) Observed data d(A) (IJI1) 28 d(A) (IJI1) 28
6.94 (100) 14.8 6.939 (100) 14.8 3.47 (30) 29.9 3.472 (90) 29.9 3.33 (6) 3l.2 3.338 (18) 31.1 2.882 (2) 38.7 2.893 (39) 36.0 t 2.792 (2) 40.0 2.820 (18) 37.0 t 2.422 (25) 43 .3 2.429 (33) 43 .2 2.018 (12) 52.6 2.031 (24) 52.3
t Assignment of these lines doubtful (sample had a very low crystallinity).
Figure 5.4.3-4(a) and (b) show the reduced and peak spectra for this sample.
The salt CU4S04(OH)6'H20 can also be formulated as 3Cu(OH)z'CuS04'H20 which
shows it is a basic copper sulphate probably formed on inaccurate pH adjustment of the
copper leach solution at the base metal refinery, via the reaction :
4 Cu2+ + S042- + 6 OH- + H20 ~ 3Cu(OH)z'CuS04'H20

IIIl
100 80 60 40 20 0
100 80 60 40
Clear blue crystals (formed on Poly [3])
Card number : WP-068-B
0 ro ~ ~ ~ ~ ro ~ ~ ~ m rn rn 29 (degrees) COKCXl
Copper sulphate hydrate CUS04 ·5H20 (Chalcanthite)
112
11-0646

100 80 60
IlII 40 ')0 '-
Concentrate [2] (Dried at 110°C)
Card number : WP-078
O+===~~~~~~~~~====~~====*-=~~~
100 80 60
IlII 40
o 10 20 30 40 50 60 70 80 90 28 (degrees) COKIXI
Copper sulphate hydroxide hydrate C1.l4 S04(OH)6· H20 (Posn jakite)
100 110 120
20 I, I II III I ~ o .... , ........ , ... ..... , .... ····'···· 1·· ·· '· ··"1"···,· ··"1"···'·· ·· 1· · ·· ' · .. ·1 .... '· .. · .. .. , ... ... .. , ........ , ... .
113
It: S6
20-0364
a ill 20 ~ ~ ~ W ~ W ~ ~ M ~ 28 (degrees) CoKlXl
Figure 5.4.3-4(a)
Rad. COKIXI : 1.7889 100
81
64
49
36 Intensity
25 (counts)
16
9
4
1
0 0 ill 20 ~ ~ ~ W ~ W W ~ M ~
diffraction angle, 28 (degrees)
Figure 5.4.3-4(b)

114
A copper phase detected in concentrates posing a much more serious problem was the
copper sulphide, CuS (known mineralogically as covellite). This is not water-soluble
and dissolves with considerable difficulty in sulphuric acid. It originates from the acid
dissolution of the copper sulphide, CU1.80S or CU9S5, formed in the nickel circuit and
present in first stage leach residues. The formation reaction is :
2 CU2S + 2 H2S04 + 02 ~ 2 CuS04 + 2 CuS + 2 H20 (15) (simplified) or
2 CU9S5 + 8 H2S04 + 37 H20 + 6 O2 ~ 9 CuS0405H20 + 9 CuS
The scan of a residue of a sample of first stage leach residue leached for three hours with
5% (v/v) sulphuric acid at 95°C gave evidence of the above reaction. Figure 5.4.3-5(a)
and (b) shows the appearence of CuS peaks (arrowed) as the Cu 1.80S phase is leached.
The dissolution of this phase by sulphuric acid alone is not possible unless the leach is
carried out at elevated temperatures and pressures - hence the pressure leach of the
copper circuit. High levels of covellite were observed only occasionally, and
immediately indicated an incomplete second stage leach at the base metal refinery.
Drying concentrates with sulphuric acid has been shown to reduce pgm sintering relative
to drying without sulphuric acid (§ 5.3.2). A second observed benefit of drying with
H2S04 is that if insoluble CuS is present in the concentrate it can be converted to soluble
CUS0405H20. If the concentrate is moistened with 20g/1 H2S04 and heated to 160°C,
no reaction occurs. At 260°C however, complete conversion to the sulphate takes
place. The reactions probably occurring are :
2 CuS + 2 H2S04 + 3 O2 ~ 2 CuS04 + 2 S02 + 2 H20 (redox reaction)
CuS04 + 5 H20 ~ CuS0405H20 (hydration after cooling)
Two scans showing the reaction occurring only at 260°C in the presence of H2S04 are
shown in Figures 5.4.3-6(a) and (b), and 5.4.3-7(a) and (b). Figure 5.4.3-8 shows the
complete absence of CuS. Table 5.4.3-3 compares the reference data for CuS with
data observed for a concentrate dried in two different ways. Note that before
decomposition, the crystallinity of CuS improves when dried with H2S04,

100 80 60
I1Il 40 20
First stage leach residue [2] (after a 3 hour H2S04 leach)
Card number : BP-048
115
O~~~~==~~~~~~~~~~~~~~~
o ill W ~ ~ ~ ro ~ 00 ~ ~ M ~ 29 (degrees) COKCl:I
Copper sulphide CuS (Covellite)
06-0464 100 80 60
I1II 40
~ .. .. .... .'... .. . ..... .. t.... .. . ..' ... '.! ....... J .... .'.I .... ' ... ' .. !' ... .',. .'.!.. ... .... '.', . .. ! ..
Intensity (counts)
o ill W ~ ~ ~ ro ~ 00 ~ ~ 00 W 29 (degrees) COKCl:I
1000
810
640
490
360
250
160
90
40
10
0 0
Figure 5.4.3-5(a)
Rad. COKCl:l : 1.7889
ill W ~ ~ ~ ro ~ 00 ~ m M W diffraction angle, 29 (degrees)
Figure 5.4.3-5(b)

100 80
I1II 60 40 20
Concentrate [3] (Dried at 160°C with H2S04)
116
Card number : WP-091
h 28
o~~~~~~~~~~~~~~~~~~~~
o ro ~ ~ ~ ~ ro ~ 00 ~ ~ 00 W
Copper sulphide CuS
28 (degrees) COKC(l
(Covellite) 06-0464 100
80 60
1/11 40
~ ........... , ........... .... ,l ..... , ..... , .... ,'! .... ... r I .. , :.'.1 .... , ... . ' .. "., .. ', ... . I ... , ... ..... !', ... "' .. . o ro ~ ~ ~ ~ ro ~ 00 ~ ~ 00 W
28 (degrees) COKC(l
Figure 5.4.3-6(a)
Rad. COKD:l : 1.7889 100
81
64 , 49
36 Intensity
25 (counts) 16
9
4
1
0 0 ill ~ ~ ~ ~ ro ~ 00 ~ ~ 00 W
diffraction angle, 28 (degrees)
Figure 5.4.3-6(b)

100 80 60
1/11 40 20
Concentrate [3] Card number : WP-103 (Dried at 260°C with H2S04)
O+=~~~~~~~~~~~~~~~~T-=~==~
100 80 60
1/11 40 20
o ro ~ ~ ~ . ~ ro ~ ~ ~ ~ 00 W 28 (degrees) COKlXl
Copper sulphate hydrate CUS04 ·5H20 (Chalcanthite)
O+=~~~~~~~~~~~==~======~~~d
o ro ~ ~ ~ ~ ro ~ ~ ~ ~ 00 W 28 (degrees) CoKO: l
Figure 5.4.3-7(a)
Rad. CoKO: l : 1.7889
117
11-0646
100 ~.........u......u..... ............ ...........u.. ............. .....u........a..I..I.o.I.;.u.................u.........u........u............J..........L.......u.........L..u.....w...J.. ............. .....L..........w..4
81
64
49
36 Intensity
25 (counts) 16
9
4
1
Or=~~~~~~~~~~~~~~~~~~~
o ro ~ ~ ~ ~ ro ~ ~ ~ ~ 00 W diffraction angle, 28 (degrees)
Figure 5.4.3-7(b)

118
Concentrate [3] Card number : WP-I03 (Dried at 260°C with H2S04)
100 80 60
IIII 40
h 67
20 O+=~~~~~~~~~~~~~~~~~~==~
o ro ~ ~ ~ ~ . ro ~ ~ ~ ~ 00 W
Copper sulphide CuS
29 (degrees) COKCl:I
(Covellite) 100 ,-------:---------------, 06-0464 80 60
IIII 40
~ .... ... .. , . ' ... .. , .. .. , ... ) .... .. . , .... ,I .... '.1. ., .. .. .I .. "'.1 .... .' . . ' .. !' ..... I, .. . ) ... , ....... '1, .,). .. . o ro ~ ~ ~ ~ ro ~ ~ ~ ~ 00 W
29 (degrees) COKCl:I
Figure 5.4.3-8

119
Table 5.4.3-3 Comparison of CuS reference data with peaks observed for a normal concentrate
CuS Concentrate [3] t (WP-079) Concentrate [3] t (WP-091)
Reference data (16) Observed data Observed data
deAl (III!) 29 deAl (III!) 29 deAl (III!) 29
3.220 (30) 32.3 3.223 (44) 32.2
3.048 (65) 34.1 3.048 (73) 34.1 3.045 (63) 34.2
2.813 (100) 37.1 2.813 (73) 37.1 2.812 (100) 37.1
2.724 (55) 38.3 2.728 (82) 38.3
1.896 (75) 56.3 1.897 (100) 56.3 1.896 (100) 56.3
1.735 (35) 62.1 1.735 (43) 62.1 1.735 (51) 62.1
1.556 (35) 70.2 1.556 (51) 70.2 1.557 (51) 70.1
1.280 (10) 88.7 1.277 (36) 89.0
1.0946 (10) 109.6 1.096 (36) 109.4
1.0607 (10) 115 .0 1.060 (36) 115.1
t Dried at 160°C t Dried at 160°C with H2S04 (at 260°C, all these lines disappear)
Another rather interesting copper phase identified in a few samples was the copper
platinum alloy, CU3Pt. Figures 5.4.3-9(a) and (b), 5.4.3-10(a) and (b), and 5.4.3-11(a)
and (b) show the scans and reduced spectra of three normal concentrate samples from
different stages of the pre-treatment process (Note: the first sample has been selectively
leached). Table 5.4.3-4 compares the observed data for these three samples with that of
the reference compound.
Table 5.4.3-4 Comparison of CU3Pt reference data with peaks
observed for three normal concentrates
CU3Pt Concentrate [1] Concentrate [2] Concentrate [3]
Reference data (17) Observed data Observed data Observed data deAl (III!) 29 deAl (III!) 29 deAl (III!) 29 deAl (III!) 29
2.14 (100) 49.4 2.150 (100) 49.2 2.129 (100) 49.7 2.149 (100) 49.2 1.85 (40) 57.8 1.861 (28) 57.5 1.845 (43) 58.0 1.858 (63) 57.6 1.31 (20) 86.1 1.318 (26) 85 .5 1.303 (24) 86.7 1.309 (58) 86.2 1.12 (20) 106.0 l.125 (22) 105 .3 1.113 (24) 107.0 1.121 (36) 105.8 l.07 (10) 113.4 1.077 (11) 112.3 1.068 (27) 113 .8

100 80 60
1111 40 20
Thioform [1] (after leaching and heating)
120
Card number : WP-013
h 139
O+=~~~~~~~~~~~~~~~~+.+.~±+.~
o ill ~ ~ ~ ~ ro ~ 00 ~ m m ~ 29 (degrees) COKC<l
Copper platinum CU3Pt (index pattern)
100 35-1358 80 60
IIIl 40 20 III o ···· 1···· '· .··1··· ·' .. ·.1···· '· ··· .····1· ··1· ··· ···· 1·· ' I ' • • ' .••• 1 •• • • 1 ... . , .... 1 ... . 1 •••• 1 .... ···· 1' ··· ... , .. ..
Intensity (counts)
a ro ~ ~ ~ ~ ro ~ 00 ~ m m ~ 29 (degrees) COKC<1
200 1~') b.:..
128
98
72
50
32
18
8
2
0 0
Figure 5.4.3-9(a)
Rad. COKC<l : 1.7889
, , ,
ill ~ ~ ~ ~ ro ~ 00 ~ m m ~ diffraction angle, 29 (degrees)
Figure 5.4.3-9(b)

121
VIPR [1] Card number : WP-073
I I 100 80 60
I1II 40
It: 98
~ I t. I I I I I I I I I I I I o ····· ····1···· '·· ·· .... , .... ... . " ... .. .. , .... ···· ,· ··· j· ···'···· I··· ·' ····I ····'·· ·· .... , ...... .. , ... .. ... .... . o ro ~ ~ ~ ~ ro ~ ~ ~ ~ m w
Copper platinum CU3Pt (index pattern)
28 (degrees) COK!Xl
35-1358 100 80 60
I1II 40 I ~ I I I o .... ... .. , ......... , .. ... .. .. , ... ................................. , .. ..... . , .... ..... .... ....... .... ... .... .... .
o
200
162
128
98
72 Intensity
50 (counts) 32
18
8
2
0
ro ~ ~ ~ ~ ro ~ ~ ~ ~ m w 28 (degrees) COK!Xl
0
Figure 5.4.3-10(a)
Rad. COK!Xl : 1.7889
,
ro ~ ~ ~ ~ ro ~ ~ ~ ~ m ~ diffraction angle, 28 (degrees)
Figure 5.4.3-10(b)

Concentrate [6] (Dried at 110°C)
122
Card number : WP-082
100 80
h 40
60 I1II 40
20 O+=~~~~~~~~~~~~~~~~T-=~~~
o ro ~ ~ ~ ~ 60 ~ 00 ~ ~ 00 W 28 (degrees) COKIXI
Copper platinum CU3Pt (index pattern)
100 35-1358 80 60
I1II 40 I 20 I I I o "" .. " ' I " "''' ''I ' ' '' '''' ' I " " ',' " I ""'"'' " """ 'I " " " ''' I '' "' '' ''I '' " ' "'' 1'' '' ''' '' 1'' ' " ' ''' 1' ' "'"''
Intensity
(counts)
o ro ~ ~ ~ ~ 60 ~ 00 ~ ~ 00 W
100
81
64
49
36
25
16
9
4
1
0 0
28 (degrees) COKIXI
Figure 5.4.3-11(a)
Rad, COKIXI : 1.7889
ro ~ ~ ~ ~ 60 ~ 00 ~ ~ 00 ~
diffraction angle, 28 (degrees)
Figure 5.4.3-11(b)

123
In Table 5.4.3-4, Concentrate [1] is from the pre-treatment process and has been
selectively leached and dried. Concentrate [2] is also from the pre-treatment process.
Concentrate [3] is as received from the BMR..
(Sample numbers : [1] WP-013 [2] WP-073 [3] WP-082)
Several observations on the data and scans can be made. Firstly, the peaks are unusually
asymmetric, flaring towards higher d-spacings (lower 28 values) . This is due to disorder
in the alloy and indicates relatively fast cooling. Such disorder has been observed for
similar alloys (eg. CU3Au, CU3Pd and Ni3Fe) (18) which all pack face-centred cubic.
The ideally ordered alloy has platinum atoms at the corners of the cubic cell and copper
atoms at the centre of each face.
Secondly, the variability in the position of the lines points to variable stoichiometry.
Although a similar palladium alloy of identical formula exists, the pattern diff~rs in having
stronger peak intensities and additional lines. Table 5.4.3-5 compares the XPD
reference data for these two compounds. Clearly, it should be concluded that the alloy
contains very little, if any palladium, and that shifts are due to variable stoichiometry (ie.
CU3±xPt) rather than the inclusion of palladium.
Table 5.4.3-5 Comparison of CU3Pt and CU3Pd reference data
CU3Pt CU3Pd
Reference data (17) Reference data (19)
d(A) (I1Il) 28 d(A) (I1Il) 28
2.14 (100) 49.4 2.13 (100) 49.7 1.85 (40) 57.8 1.86 (90) 57.5
1.83 (80) 58.5 not observed 1.31 (20) 86.1 1.31 (90) 86.1
1.30 (90) 87.0 not observed 1.12 (20) 106.0 1.12 (100) 106.0 1.07 (10) 113.4 1.07 (90) 113.4

124
The copper-platinum alloy is probably formed around the nickel-copper alloy crystals in
fast cooled mattes. Fast cooling produces nickel-copper alloy crystals having nickel-rich
cores and copper-rich faces (§ 4.7.1). Platinum, because of its size and factors to be
covered later, is the pgm which is taken up by the nickel-copper alloy with the greatest
difficulty. Movement from the molten sulphide phase is slow. The combination of fast
cooling and the slow inclusion into the alloy would favour the formation of a copper
platinum alloy around each crystal. Figure 5.4.3-12 illustrates the idea.
,-------, I I I I I I I I~----
I ~~I~----~ I I L ______ J
Ni3S2 matrix + Pt sulphide
CU3Pt alloy layer
Copper-rich zone
Nickel-rich zone
Figure 5.4.3-12 Possible origin of the CU3Pt alloy
Table 5.4.3-6 lists the copper compounds encountered m pgm extraction, their
occurence and suggested methods of removal.
Table 5.4.3-6 COPPER compounds occurring in pgm extraction
Compound
eus
Occurrence and removal
Nonnal concentrates (common)
water wash Nonnal concentrates (rare)
water (or dilute acid) wash N onnal concentrates (occasionally observed)
moisten concentrate with H2S04 (20 gi l) and
heat to 260°C (wash with water after cooling) Normal / pre-treated concentrates (occasionally observed)
HClICl2 soluble

125
5.5 OXIDATIVE LEACH PROBLEMS
5.5.1 INTRODUCTION
After pre-treatment, the concentrate is oxidatively leached using 6M hydrochloric acid
and chlorine gas at elevated temperatures. The aim is to solubilise 100% of each
precious metal. This is seldom achieved in practice. Table 5.5.1-1 gives typical
solubility ranges for the pgms encountered in the refinery under study.
Table 5.5.1-1 PGM solubility in the oxidative HCIICI21each
NORMAL CONCENTRATES MINOR CONCENTRATES
Element Typical solubility range t Typical solubility range t
Platinum 95 .6 - 99.9 % 85 .1 - 89.4 % Palladium 96.7 - 99.9 % 66.9 - 90.1 %
Rhodium 80.1 - 99.2 % 2.0 - 90.1 % Iridium 84.6 - 97.7 % 8.5 - 24.8 %
Ruthenium 76.7 - 98 .9 % 0.6 - 88.8 %
t Minimum - maximum solubilities measured over a five month period
The above table shows that in some cases pgm solubility is unbelievably low, especially in
the case of minor concentrates. In order to explain the solubility problems illustrated
above, concentrates and residues showing low and high pgm solubility were examined by
XPD and the analyses compared.
5.5.2 LOW RUTHENIUM SOLUBILITY
On dissolution of the nickel-copper alloy, a pgm residue is produced that gives broad
diffraction peaks at the d-spacings given and assigned in Table 5.5.2-1. Platinum,
palladium, rhodium and iridium all exhibit face-centred cubic packing. Their diffraction
peaks are thus very similar. When occurring together, the averaging effect of the
combined peaks of differing intensity results in broad peaks at d-spacings very similar to

126
those of palladium, with a maximum peak at about 2.25A. Ruthenium and osmium
however both pack according to the hexagonal system and so the maximum intensity
peak occurs at a different d-spacing (about 2.07 A or 51.3°).
Table 5.5.2-1 Typical normal concentrate diffraction peaks
Observed diffraction peaks d(A) (III!) 29 (hkl) Assignment
2.252 (100) 46.9 (111) [platinum + palladium + rhodium + iridium] 1.947 (46) 54.6 (200) [platinum + palladium + rhodium + iridium] 1.380 (34) 80.8 (220) [platinum + palladium + rhodium + iridium] 1.179 (39) 98 .7 (311) [platinum + palladium + rhodium + iridium] 1.128 (12) 104.9 (222) [platinum + palladium + rhodium + iridium]
2.066 (0 - 100) 51.3 (101) [ruthenium + osmium]
Figures 5.5.2-1 and 5.5.2-2 show two diffiaction scans of typical concentrates, with the
[ruthenium + osmium] (101) peak arrowed. Examination of the scans from numerous
normal concentrates revealed that this peak is usually of high intensity and in some cases
dominates all others (although the levels of ruthenium never exceeds that of platinum).
This indicates that relative to the cubic pgms, the [ruthenium + osmium] metallic phase
has a higher degree of crystallinity.
In almost every case residual highly crystalline metallic ruthenium was found to be
responsible for low ruthenium solubility in normal concentrates. Table 5.5.2-2
compares XPD reference data for ruthenium metal with observed data. All observed
peaks are shifted to lower diffraction angles.
Examination of the peak scans and reduced patterns of two HCVCl2 leach residues
(Figures 5.5.2-3(a) and (b), and 5.5.2-4(a) and (b» shows that in both cases peaks are
shifted to lower diffraction angles.

100
81
64
49
36 Intensity
25 (counts) 16
9
4
1
0 0
127
Rad. CoKO:1 : 1.7889
ill ~ ~ ~ ~ ro ~ 00 W ~ 00 m diffraction angle, 29 (degrees)
Figure 5.5.2-1 XPD scan ofa nonnal concentrate showing the [Ru+Os] (101) peak
100
81
64
49
36 Intensity
25 (counts)
16
9
4
1
0 0
Rad. CoKO:1 : 1.7889
ill ~ ~ ~ ~ ro ~ 00 W ~ 00 m diffraction angle, 29 (degrees)
Figure 5.5.2-2 XPD scan ofa nonnal concentrate showing the [Ru+Os] (l01) peak

100 80 60
I1Il 40 20
HC1/C1 2 leach residue [14] (Pin sol)
128
Card number : WP-048
II: 188
O~~~~~~~~~~~~~~~~~~=±~
o ill ~ ~ ~ ~ ro ~ ~ W ~ m ~ 28 (degrees) COKC(l
Ruthenium Ru
06-0663 100 80 60
1/11 40
~ u . u .,. u, .u, J u.uu. I ......... J. i,u, II ,. o ro ~ ~ ~ ~ ro ~ ~ W ~ m ~
28 (degrees) COKC(l
Figure 5.5.2-3(a)
Rad. CoKrxl : 1.7889 500
405
320
245 , 180
Intensity 125 (counts)
80 , ' 45
20
5
0 0 ro ~ ~ ~ ~ ro ~ ~ ~ ~ m ~
diffraction angle, 28 (degrees)
Figure 5.5.2-3(b)
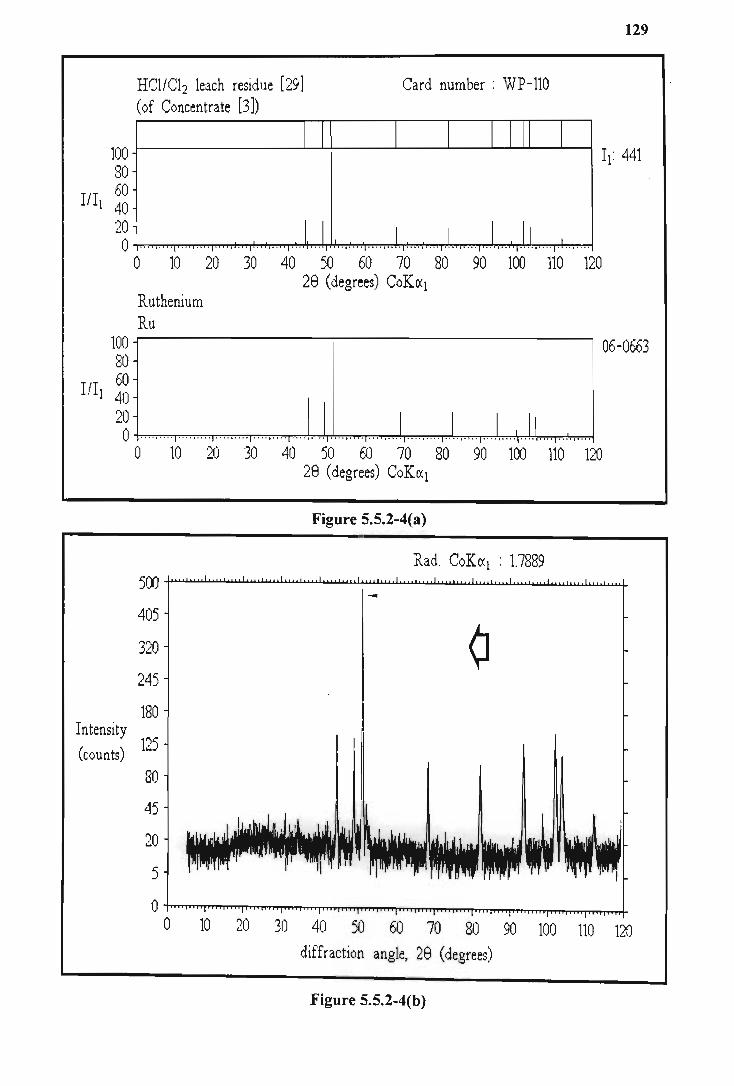
100 80
1111 60 40 20
HClfCl2 leach residue [29] (of Concentrate [3])
Card number : WP-ll0
O+-=====~~~~~=Y-~~~~~~~~~~~~
100 80
o ro ~ ~ ~ ~ ro ~ 00 W ~ M W 28 (degrees) COK(Xl
Ruthenium Ru
60 1111 40 I
20 I I I II o ..... .. .... .. ..... ... ..... . , ......... , .... .. ... .. .. .. ... .... ...... .. ..... ..... .... . , .... ... .. , ... ...... , ..... ... .
129
h 441
06-0663
o ro ~ ~ ~ ~ ro ~ 00 W ~ M ~
500
405
320
245
180 Intensity
125 (counts)
80
45
20
5
0 0
28 (degrees) COK(Xl
Figure 5.5.2-4(a)
Rad. COK(X1 : 1.7889
-
ro ~ ~ ~ ~ ro ~ 00 W ~ 00 ~ diffraction angle, 28 (degrees)
Figure 5.5.2-4(b)

130
Table 5.5.2-2 Comparison of Ru reference data with peaks observed for a normal concentrate HClICl2 residue
Ru HCI/CI2 reidue [14] (WP-048)
Reference data (20) Observed data Deviation d(A) (1111) 29 d(A) (1111) 29 L\d(A) L\29(O)
2.343 (40) 44.9 2.346 (21) 44.8 + 0.003 - 0.1 2.142 (35) 49.4 2.145 (25) 49.3 + 0.003 - 0.1 2.056 (100) 51.6 2.061 (100) 51.4 + 0.005 - 0.2 1.5808 (25) 68.9 1.588 (20) 68.6 + 0.007 - 0.3 1.3530 (25) 82.8 1.360 (17) 82.3 + 0.007 - 0.5 1.2189 (25) 94.4 1.227 (23) 93 .6 + 0.008 - 0.8 1.1715(6) 99.6 1.178 (6) 98 .7 + 0.007 - 0.9 1.1434 (25) 102.9 1.152 (23) 101.9 + 0.009 - 1.0 1.1299 (20) 104.7 1.137 (17) 103 .7 + 0.007 - 1.0 1.0705 (4) 113 .3 1.081 (11) 111.7 + 0.010 - 1.6
Figure 5.5.2-5 shows that the peaks of the second residue show an almost exact fit with
osmium rather than ruthenium (note the high crystallinity of this sample). An elemental
analysis, performed using a scanning electron microscope, indicated a ruthenium-osmium
alloy of approximately llwt% osmium. (- Ru160S). These elements are mutually
soluble at all compositions (21), and so an alloy is not unexpected. Very slow scans (1°
per minute), run on another diffractometer (CoKa. radiation), showed no line splitting
(except when peak intensities were very low, when splitting results from poor
crystallinity). Instead a single sharp (101) peak was obseved at 2.067A for one sample,
almost midway between the d-spacings of the (101) lines of ruthenium (2.056A) and of
osmium (2.076A). (Figure 5.5.2-6)
It was thus concluded that this insoluble phase was a highly crystalline ruthenium
osmium alloy, generally with low levels of osmium. Such an alloy would be highly
inert. Small amounts could be generated during ignitions of impure ammonium
hexachloroplatinate(IV) to platinum sponge, which are carried out at high temperatures.
(NH4h[PtCI6] + (NH4h[RuCI6] + (NH4h[OsCI6] ~ Pt + (Ru-Os)

H ClI C12 leach residue [29] (of Concentrate [3])
Card number : WP-110
131
100 80 60
IIII 40
It: 441
20 O+=====~~~~~~~~~~~~~~~=9~~
o ro ~ ~ ~ ~ ro ~ w w ~ 00 m 28 (degrees) COK(X1
Osmium Os
100 06-0662 80 60 40
20 1 _I I I J II o ." ..... . ""."" ""."" ""."" ""."" ""."" ""."" ""."" "" '"'' ,''''''''' ''' ''' '''' ,'' '' ''' '' a ro ~ ~ ~ ~ ro ~ w ~ ~ 00 m
28 (degrees) COK(X1
Figure 5.5.2-5
I
h411~
•• '11' ... .. . .,"" 11'111 -' '1 "
l 'J
52· 50·
Figure 5.5.2-6 Expanded scan of the Ru-Os alloy (101) peak

132
Traces of ruthenium and osmium can be coprecipitated with (NH4h[PtCI6] (22). On
redissolution of platinum, an insoluble residue of Ru-Os alloy remains and on recycling
would appear in oxidative leach residues.
A second ruthenium phase causmg low solubility was ruthenium oxide, Ru02·
Generally this phase is rarely observed in normal concentrates. When encountered, it
indicates that overdrying at the base metal refinery has resulted in the reaction :
Ru+02 ~ Ru02
This reaction is rapid when the metal is finely divided (as in concentrates) (23), and
favoured by the extreme stability of the oxide, which has a distorted rutile-type structure
(24) similar to titanium dioxide, Ti02.
deficient, ie. Ru02_x (25).
The product is however actually oxygen-
A correctly dried normal concentrate was found to give 15 to 50 counts for the
maximum peak. Overdrying leads to sintering and this is reflected in an increase in the
number of counts recorded for the maximum peak. One overdried normal concentrate,
giving 282 counts for the maximum peak, is shown in Figure 5.5.2-7(a) and (b). As
indicated, most of the metallic ruthenium has been oxidized. This oxide is not attacked
in the oxidative leach, and substantial quantities are detectable in the residue. Such a
residue is shown in Figure 5.5.2-8(a) and (b) with the Ru02 peaks indicated.
Table 5.5.2-3 compares ruthenium oxide reference data with the oxide phase found in an
overdried normal concentrate and its leach residue (values in boldface indicates overlap
with another phase).

Concentrate [1] (Dried at 110°C)
I I
133
Card number : WP-077
100 80 60
I1Il 40
I I It: 282
20 ,III ,I I I II I I o .. .. , ... · 1·· · · , • . ... . •. , . .... . .. , . . .. . .. , " , . ' I " .. " .. ·1 .... " .. · .. .. , . .. , .... , ....... " ... 'T .... , .. . 'T .... ,' .. ,
100 80 60
I1Il 40
o ill ~ .~ ~ ~ ro ~ 00 W ~ W ~ 28 (degrees) COKcr:l
Ruthenium o~{ide
RU02 21-1172
20 I ~ , o ,.," , .. .. ,.,' ,. ,',.,' ", .. . , .. ,"" "".'" 'T" .' .' , . ' j " " .'" ' I " .. ·' .. , , .. " . '" . , "" ., .. 'r ' .. ·· ' " r .. "· .. , ,
Intensity (counts)
o ill ~ ~ ~ ~ ro ~ 00 W ~ W ~ 28 (degrees) COKcr:l
Figure 5.5.2-7(a)
Rad, COKcr:l : 1.7889 500
405
320
245
180
125
80 , 45
20
5
0 0 10 20 30 ~ ~ ro ~ 00 W ~ 00 ~
diffraction angle, 28 (degrees)
Figure 5.5.2-7 (b)

134
HCI/Cl2 leach residue [16] Card number : WP-050 (Finsol)
100 80 60
1/11 40
h 100
20 O+=======~~~~~~~~~~~~~~~~
100 80 60
IIIl 40
o ro ~ ~ ~ ~ ro ~ 00 W ~ rn w 29 (degrees) COKC<l
Ruthenium oxide Ru02
20 I I, I o .. " , . ". . ... ,. ... . ... ,.... . .. . ,.... . ... ,. ... . ... ,. .. . "",.... "" ,.... ""'". or" " , ".. "" '" .. " .. , ".
Intensity (counts)
o ro ~ ~ ~ ~ ro ~ 00 W ~ rn w 28 (degrees) COKC<l
Figure 5.5.2-8(a)
Rad. COKC<l : 1.7889 200
r" 00:.
128 , 98 , 72
50
32
18
8
2
0
21-1172
0 ro ~ ~ ~ ~ ro ~ 00 W ~ rn w diffraction angle, 28 (degrees)
Figure 5.5.2-8(b)

135
Table 5.5.2-3 Comparison of RU02 reference data with peaks observed for a normal concentrate and leach residue
Ru02 N-CONCENTRA TE (WP-077) HCVCI2 RESIDUE (WP-107)
Reference data (26) Observed data Observed data
d(A) (IfII ) 29 d(A) (IfII ) 29 d(A) (IfII ) 29
3.17 (100) 32.8 3.178 (100) 32.7 3.149 (74) 33 .0
2.550 (50) 4l.1 2.557 (100) 4l.0 2.539 (100) 4l.2
2.243 (10) 47.0 2.250 (-) 46.9 2.236 (32) 47.1
l.685 (30) 64.1 l.688 (87) 64.0 1.683 (85) 64.2
l.586 (9) 68.7 l.588 (27) 68 .5 l.588 (27) 68 .6
l.552 (4) 70.4 l.543 (14) 70.9
l.4200 (5) 78 .1 l.418 (16) 78.2
l.3943 (5) 79.8 l.394 (21) 79.9 l.3491 (5) 83 .1 1.351 (24) 83 .0
1.2770 (2) 88.9 1.276 (11) 89.0 1.1559(4) 101.4 1.159 (21) 101.0 1.1097 (3) 107.4 1.108 (12) 107.6 1.0585 (2) 115.4 1.048 (17) 117.1
Ruthenium oxide was found to be a constant problem in minor concentrates. This is
expected, because, after the pgms are precipitated from the copper pressure leach
solution using sulphur dioxide gas, the filter cake is roasted at about 700°C in air to
volatilize selenium (§ 4.3.4). Ruthenium, being in an even finer state of division than in
normal concentrates, oxidises almost completely. Consequently, oxidative leach
ruthenium solubility for minor concentrates can be as low as 0.6%.
Figure 5.5.2-9(a) and (b) shows Ru02 as detected in a minor concentrate.
Figure 5.5.2-10(a) and (b) shows Ru02 as detected in the leach residue of this
concentrate.
Table 5.5.2-4 compares Ru02 reference data with the oxide data observed for a minor
concentrate and residue. Note that many more Ru02 peaks are observed in minor
concentrates due to the high level of ruthenium present (about 20%).

100 80
IIII 60 40 20
Concentrate [7] Card number : WP-124
O+===~~~~~~~~~~~~~~+.=~~~~
100 80
IIII 60 40
o ill ~ ~ ~ ~ ro ~ ~ W ~ 00 W 28 (degrees) COKC(1
Ruthenium oxide Ru02
2~ ... . ' ... . I .... ' ... T ... ' .... I .... ' . .. . I .. .. ';~ . . I . . .. ' .. .. . J,.) .... , ... ..... , ... ..... , ........ , .... , .. .. , ....
Intensity (counts)
o ill ~ ~ ~ ~ ro ~ ~ W ~ 00 W 28 (degrees) COKC(1
Figure 5.5.2-9(a)
Rad. COKC(l : 1.7889 100
81
64 , 49
36
25
16
9
4
1
0
136
21-1172
0 10 20 30 40 50 60 70 80 90 100 110 120 diffraction angle, 28 (degrees)
Figure 5.5.2-9(b)

100 80 60
I1Il 40 20
HCl/Cl2 leach residue [33] (of Concentrate [7])
137
Card number : WP-1l4
o~~==~==~~~~~~~==~~~~~~~
100 80 60
1/11 40
o ill ~ ~ ~ ~ ro ~ 00 ~ ~ 00 W 28 (degrees) COKIXI
Ruthenium oxide Ru02
21-1172
2~ ... . , ........ , ........ , .... , .... , .... , .... ,.!' .. , .... , .... , ... !, ... I ..... .. ... .... , ....... . , .... , .... , . ... , .... , ... .
o ill ~ ~ ~ ~ ro ~ 00 ~ ~ 00 W 28 (degrees) COKIXI
Figure 5.5.2-10(a)
Rad. CoKlXl : 1.7889 100 -F""' ............................................. ...........w.......u.......u..I..u.i..o.~~.....w....~ ............... ......L........w...rJ.......w........J.....u..w.......JLu........u.u4
81
64
49
36
, , ,
Intensity (counts) 25
16
9
4
1
O~~~~~~~~~~~~~~~~~ o ill ~ ~ ~ ~ ro ~ 00 ~ ~ 00 ~
diffraction angle, 28 (degrees)
Figure 5.5.2-10(b)

138
Table 5.5.2-4 Comparison of RU02 reference data with peaks observed for a minor concentrate and leach residue
Ru02 M-CONCENTRATE (WP-124) HCI/CI RESIDUE (WP-1l4) 2
Reference data (26) Observed data Observed data d(A) (1111) 29 d(A) (1111) 29 d(A) (1111) 29
3.17 (100) 32.8 3.175 (100) 32.7 3.186 (81) 32.6 2.550 (50) 4l.1 2.551 (94) 4l.1 2.553 (100) 4l.0 2.243 (10) 47.0 2.246 (-) 46.9 2.261 (16) 46.6 l.685 (30) 64.1 l.688 (69) 64.0 l.688 (64) 64.0 1.586 (9) 68 .7 l.594 (25) 68.3 l.597 (25) 68.1 l.552 (4) 70.4 l.551 (24) 70.4 1.547 (16) 70.6 l.4200 (5) 78.1 l.429 (24) 77.5 1.429 (16) 77.5 1.3943 (5) 79.8 1.393 (-) 79.9 l.391 (20) 80.1 l.3491 (5) 83 .1 l.353 (24) 82.8 1.350 (16) 83.0 1.2770 (2) 88.9 1.276 (24) 89.0 1.277 (16) 88.9 1.1559(4) 101.4 1.160 (24) 100.9 l.1 097 (3) 107.4 l.111 (24) 107.3 1.109 (17) 107.5 l.0585 (2) 115.4 l.050 (24) 116.8 1.049 (16) 117.0
Both Tables 5.5.2-3 and 5.5.2-4 show that the observed intensities for the oxide phase
are much higher than would be expected. This indicates that the oxide phase is not pure
Ru02, but possibly contains iridium or even rhodium. In Table 5.5.2-5 the XPD
reference data for the oxides Rh02, Ru02, Ir02 and OS02 are compared. The
d-spacings are clearly very similar, stronger intensities being observed for Rh02, Ir02
and OS02.
When these oxides are formed together, peaks unique to each oxide are not necessarily
observed in the XPD scan. Proof of this is shown in Figure 5.5.2-11(a) and (b) which
is the scan of an electrode used for chlorine production, manufactured by the thermal
decomposition of a mixture of ruthenium and iridium salts on a titanium surface. The
combined oxides are observed as one set of un split peaks (Cp. Figure 5.5.2-10(a), (b» .
In Figure 5.5.2-12(a) and (b) the reduced scan of the residue of another minor
concentrate is compared with the reference patterns of Ir02 and Rh02. Ir02 is very
inert, stable to 1100°C, and formed by heating iridium in air (30). Rh02
is not too stable

139
(the more stable oxide being Rh20 3) but can form the more stable mixed metal oxide
RUO.6RhO.402 (31) . Os02 dissolves in hydrochloric acid forming [OsCI6]2- (32) and so
poses no solubility problems.
Table 5.5.2-5 Comparison of XPD reference data for the dioxides of rhodium, ruthenium, iridium and osmium
Rh02 Ru02 Ir02 Os02
Reference data (27) Reference data (26) Reference data (28) Reference data (29)
d(A) (1111) 29 d(A) (1111) 29 d(A) (1II1) 29 d(A) (1II1) 29
3.18 (100) 32.7 3.17 (100) 32.8 3.178 (100) 32.7 3.18 (100) 32.7 2.546 (90) 41.1 2.550 (SO) 41.1 2.582 (90) 40.S 2.600 (100) 40.2 2.245 (2S) 47.0 2.243 (10) 47.0 2.2488 (2S) 46.9 2.249 (80) 46.9 2.215 (6) 47.6 2.217 (4) 47.6 2.008 (2) S2.9 2.005 (1) S3 .0 2.0119 (1) S2.8 1.683 (80) 64.2 1.685 (30) 64.1 1.6960 (SS) 63.7 1.701 (40) 63 .S 1.587 (18) 68 .6 1.586 (9) 68 .7 1.5903 (12) 68.S 1.592 (100) 68.4 1.545 (10) 70.8 1.552 (4) 70.4 1.5771 (6) 69.1 1.590 (80) 68.S 1.419 (18) 78 .2 1.4200 (S) 78 .1 1.4227 (12) 77.9 1.423 (80) 77.9 1.390 (20) 80.1 1.3943 (S) 79.8 1.4133 (14) 78.S 1.347 (2S) 83 .2 1.3491 (S) 83 .1 1.3542 (14) 82.7 1.357 (60) 82.S 1.273 (10) 89.3 1.2770 (2) 88 .9 1.2914 (8) 87.7 1.300 (80) 87.0 1.155 (16) I01.S 1.1559 (4) 101.4 1.1604 (10) 100.9 1.162 (60) 100.7 1.122 (4) lOS .7 1.1230 (1) 10S.6 1.1247 (4) IOS.4 1.125 (60) lOS .3 1.107 (12) 107.8 1.1097 (3) 107.4 1.1199 (6) 106.0 1.058 (6) IIS.4 1.0585 (2) IIS.4 1.0602 (4) l1S .1 1.045 (14) 117.7 1.0481 (3) 117.2 1.0563 (10) l1S .7
Table 5.5.2-6 shows that the solubilities of ruthenium and iridium are clearly linked and
can be understood in terms of an insoluble ruthenium-osmium alloy, and an insoluble
ruthenium-iridium oxide phase (in most cases).

140
Chlorine electrode [1] Card number : BP-072
100 t--____ --'-_L---:--_--I.--I..J'--...a....L-.L...-~ ____ _j h 276
80 IIII 60
40 20 0+=~~~~~~~~~~~~~~~=+~9=~
100 80 60
IIII 40
o ill ~ ~ ~ ~ ro ~ ~ W ~ M ~ 28 (degrees) COKC<1
Ruthenium oxide Ru02
20 I k I o ·· .. '· · .. 1 .... '· .. ·1 .. · · ' .. .. 1 .. · · '· .. · .. .. , .. .... .. , .. .. .. . .. .. .. .... '· .. · 1·· .. ' · .. · 1 .... ' .. ··1 .... ' .... 1 .... ' · .. ·
o ill ~ ~ ~ ~ ro ~ 00 W ~ M ~ 28 (degrees) COKC<l
Figure 5.5.2-11(a)
Rad. COKC<l : 1.7889 500
405
320
245
180 , Intensity
125 (counts) , , 80
45
20
5
0
21-1172
0 10 20 30 ~ ~ ro ~ 00 W ~ 00 ~
diffraction angle, 28 (degrees)
Figure 5.5.2-11(b)

HClIC12 leach residue [34] (of Concentrate [8])
141
Card number : WP-1l5
100 80 60
IIII 40
h 32
20 O*=~==~~~~~~~~~~~~rm=T~~~
o ro ~ ~ ~ ~ ro ~ 00 W ~ M W 28 (degrees) COKC<1
Iridium oxide Ir02
100 15-0870 80 60
IIII 40
2~ ... . , .... .... , ...... .. , ........ , .. .. .... ,J ..... , .... I .... , .. \ .... , . .!I.) .. , .. I .. I .. .. , .... , .. .. :! .. . .... :1.,1 ..
100 80
IIII 60 40 20 0
o ro ~ ~ ~ ~ ro ~ 00 W ~ M W 28 (degrees) COKC<1
Figure 5.5.2-12(a)
HClICl2 leach residue [34] (of Concentrate [8])
Card number : WP-115
0 ro ~ ~ ~ ~ ro ~ 00 W ~ M ~ 28 (degrees) COKC<1
Rhodium oxide Rh02
h 32
100 .-------;-----------------, 21-1315 80
IIII 60 40 20 0r.=~~T-=~~~~~~~~d+~+=~~~~ o 10 20 30 40 50 60 70 80 90 100 110 120
28 (degrees) COKC<1
Figure 5.5.2-12(b)

Table 5.5.2-6 Comparison of Ru and Ir solubility with counts observed for the (101) Ru and Ru02lines
142
Normal Solubility in the HCI/CI2 leach Ru (101) line t Ru02 (101) line t Concentrate Ru Ir counts counts
1 93.5 9l.7 49 10 2 90.6 90.0 56 12 3 89.7 89.1 74 10 4 89.4 88 .8 83 14
t Observed at about 2.07 A (51 .2°) t Observed at about 2.54A (41.2°)
Figures 5.5.2-13(a) and (b) show that both these phases were also being encountered in
the concentrate being processed at BARPLATS REFINERY.
5.5.3 LOW OSMIUM SOLUBILITY
The solubility of osmium in the oxidative leach is never determined due to the very low
percentage present in concentrates (about 0.6%). The metal is not of major economic
importance, its demand usually being confined to aqueous and stabilized non-aqueous
solutions ofOs04 used in organic oxidations and as stain in microscopy.
(See § 5.5.2 and § 5.5.5.)

I1II
1111
143
Aqua-regia leach residue (1] Card number : BP-027 (of second stage leach residue) : scan 1
100 It: 372 80 60 40 20 0
0 10 20 30 40 50 60 70 80 90 100 110 120 29 (degrees) COKCJ:I
Ruthenium Ru
100 06-0663 80 60 40 20 0
100 80 60 40 20
0 10 20 30 40 50 60 70 80 90 100 110 120 29 (degrees) COKCJ:I
Figure 5.5.2-13(a)
Aqua-regia leach residue (1] Card number : BP-027 (of second stage leach residue) : scan 1
o~~==~~~~~~~~~~~~~~~~~ o 10 20
Ruthenium oxide Ru02
30 40 50 60 70 80 29 (degrees) COKCJ:I
90 100 110 120
It: 372
100 21-1172 80 60 40 ~ I o .... , .. .. ··· ·' ···· 1···· '· ···1····'···· ... . ,.!' .. ···· '···· 1···· ' ···'· .... , .... ····'···· 1 .. ·· '· ·· ·1 .· .. ' .... ... . , ... .
o ill ~ ~ ~ ~ ro ~ 80 ~ m 00 W 29 (degrees) COKCJ:I
Figure 5.5.2-13(b)

144
5.5.4 LOW RHODIUM SOLUBILITY
The oxidative leach solubility of rhodium is worst for minor concentrates where the
solubility can be as low as 2%. Over a five month period, the average rhodium solubilitr.
of 9 consignments was 22.4%. In addition, rhodium solubility was highly erratic,
ranging from 2 to 90%. Two minor concentrates, with rhodium solubilities of 19.0%
and 27.5%, and their oxidative leach residues were examined with the aim of explaining
this behaviour.
Although the XPD scans indicated very low sample crystallinity, it was possible to
establish the presence of the rhodium selenide, RhSe2+X (X - 0.01), as the main rhodium
phase present in minor concentrate samples. Table 5.5.4-1 compares the reference data
for this compound with peaks observed in the concentrate scans (boldface values
indicates overlap with another phase). Whenever sample crystallinity drops, peak
intensities tend to become high and very similar. Some expected lines can also be lost in
the background noise.
Table 5.5.4-1 Comparison of RhSe2+X reference data with peaks
observed for two minor concetrates
RhSe2+x Concentrate [7] (WP-124) Concentrate [8] (WP-125)
Reference data (33) Observed data ObserVed data d(A) (1111) 29 d(A) (1111) 29 d(A) (1111) 29
3.45 (20) 30.1 3.462 (96) 29.9 2.99 (45) 34.8 2.984 (96) 34.9 2.992 (52) 34.8 2.68 (65) 39.0 2.688 (100) 38.9 2.44 (60) 43 .0 2.444 (52) 42.9 1.808 (100) 59.3 1.800 (96) 59.6 1.810 (74) 59.2 1.603 (50) 67.8 1.594 (100) 68.3 1.601 (52) 67.9 1.281 (15) 88.6 1.276 (96) 89.0 1.278 (52) 88.8 1.227 (20) 93.6 1.221 (96) 94.2 1.222 (52) 94.1 1.156 (50) 101.4 1.156 (52) 101.4 1.116 (30) 106.5 1.111 ( - ) 107.3 1.114 ( - ) 106.9

145
Figure 5.5.4-1(a) and (b) show a typical minor concentrate XPD scan with its reduced
pattern compared to that of reference RhSe2+x. Note the low crystallinity of the sample.
This assignment made chemical sense as both samples had relatively high levels of
selenium present (Table 5.5.4-2). The first concentrate however had insufficient
selenium to completely combine with all the rhodium present. Thus less RhSe2+X was
expected even though the amount of insoluble rhodium was higher.
Table 5.5.4-2 Rh / Se composition of minor concentrates
Element Concentrate [7] (WP-124) Concentrate [8] (WP-125) wt% at% at. ratio wt% at% at. ratio
Rh 9.569 62.48 l.00 8.138 33.64 l.00 Se 4.409 37.52 0.60 12.32 66.36 l.97
Rh insoluble 7.748 57.42 l.00 5.902 26.88 l.00
Se 4.409 42.58 0.74 12.32 73 .12 2.72
Scans of the oxidative leach residues showed that virtually none of the rhodium selenide
present in the concentrates had dissolved (Figure 5.5.4-2 (a) and (b»). As expected, far
more RhSe2+X was evident in the second residue, even though the solubility was better
(Table 5.5.4-3).
Table 5.5.4-3 Evidence of the RhSe2+X phase being present
Concentrate [7] (WP-124) Concentrate [8] (WP-125)
Rh solubility 19.03 % RhSe2+X expected
(based on solubility) high RhSe2+x expected
(based on analysis) low Maximum wt% RhSe2+X possible 7.27
(based on analysis) XPDSCAN
Counts for maximum line (-l.81A) concentrate 10 concentrate residue 16
27.48 %
low
high 15.01
14 26

100 80
1111 60 40 '''''0 .c..
0
100 80
IlIl 60 40 20 0
Intensity (counts)
146
Concentrate [8] Card number : WP-125
It: 22
····1· .. · '· ·· 1· ·· ..... , .. .. ····1···· .... , .... ····1···· .... , ... . .. ·.1 ... ' ............. , ... · j ••• •••••• , •..• I .... 0 10 20 30 40 50 60 70 80 90 100 110 120
28 (degrees) COKC<1 Rhodium selenide RhSe2+x
19-1047
I II IIII I II I .... . .... ......... I "" '"'' ..... "" ..... .................... .. I """ " T""'"'' ...... .. ...................
0 10 20 30 40 50 60 70 80 90 100 110 120 28 (degrees) COKC<1
Figure 5.5.4-1(a)
Rad. COKC<1 : 1.7889 50.0
405 , 32.0
245
18.0
12.5
8.0
4.5
2.0
0.5
0.0 0 ill ~ ~ ~ 50 ro ~ ~ 90 ~ M ~
diffraction angle, 28 (degrees)
Figure 5.5.4-1(b)

100 80 60
1/11 40 20
HC1/C1 2 leach residue [34] (of Concentrate [8])
Card number : WP-115
O~~~====~~~~==~~==~~~~~~~ o ill ~ ~ ~ ~ ro ~ 00 ~ ~ 00 W
29 (degrees) COKC<l Rhodium selenide RhSe2+x
147
100 19-1047 80 60
1/11 40 I 20 I I IIII I II o ' .... "" .... ..... ..... .... , ........ , .... .... ... ...... 'T ....... . .............. . "" .................. ,., .. . ... .
Intensity (counts)
o ill ~ ~ ~ ~ ro ~ 00 ~ ~ 00 W 29 (degrees) CoKC<l
100
81
64
49
36
25
16
9
4
1
0 0
Figure 5.5.4-2(a)
Rad. COKC<l : 1.7889
ill ~ ~ ~ ~ ro ~ 00 00 ~ 00 W diffraction angle, 28 (degrees)
Figure 5.5.4-2(b)

148
Table 5.5.4-4 compares the reference data for RhSe2+X with peaks observed for the
residues of the two concentrates. Clearly RhSe2+X has remained unleached, and is thus
responsible for low rhodium solubility, although other undetected phases (tellurides,
sulphides, or mixed metal oxides eg. RUO.6Rh0.402 (§ 5.5.2» are probably also involved.
The oxide Rh20 3 was not detected in the samples, although traces might also be present.
Table 5.5.4-4 Comparison of RhSe2+X reference data with peaks observed for two minor concentrate leach residues
RhSe2+X HCI/CI2 residue [33] (WP-1l4) HCI/CI2 residue [34] (WP-llS)
Reference data (33) Observed data Observed data d(A) (I1Il) 29 d(A) (I1Il) 29 d(A) (I1Il ) 29
2.99 (45) 34.8 2.998 (64) 34.7 3.001 (48) 34.7 2.68 (65) 39.0 2.688 (80) 38.9 2.682 (78) 39.0 2.44 (60) 43.0 2.450 (64) 42.8 2.452 (45) 42.8 2.12 (40) 49.9 2.106 (64) 50.3 2.117 (40) 50.0 1.808 (100) 59.3 l.813 (100) 59.1 l.809 (100) 59.3 1.603 (50) 67.8 1.597 (100) 68 .1 1.604 (52) 67.8 1.311 (35) 86.0 1.306 (64) 86.5 1.281 (15) 88.6 1.277 (64) 88.9 1.278 (40) 88.9 1.227 (20) 93 .6 1.219 (64) 94.4 1.223 (40) 94.0 1.156 (50) 101.4 1.160 (96) 100.9 1.116 (30) 106.5 1.109 (68) 107.5 1.112 (40) 107.1 1.097 (25) 109.2 1.062 (40) 114.8 1.060 (40) 115.1
Rhodium selenide has clearly been formed during the roasting of the selenium-rich
precipitate cake obtained from the copper pressure leach solution, via the reaction:
Rh + (2+X) Se ~ RhSe2+x (x-o.O!)
This is a sintering reaction (34) that is reported to take place at about 900°C (35) . The
selenium roast is usually performed at about 700°C. Minor concentrates typically
exhibit highly erratic rhodium solubility. This indicates that the selenium roast
temperature is very near the critical temperature required for the formation of rhodium

149
selenide. The formation of this phase could probably be avoided by a slight lowering of
the roast temperature and strict control ensuring no overheating.
Low rhodium solubility in normal concentrates is not simply explained. For some
leaches, low rhodium solubility could be ascribed to the alloy phase platinum rhodium,
RhO.57PtO.43. The observed data for this phase is compared to that of the reference
alloy in Table 5.5.4-5. (It should be noted that this set of peaks can quite easily be
mistaken for residual iridium (Table 5.5.4-6). The elemental analysis for this residue
revealed high levels of platinum and rhodium thereby confirming the chosen assignment.)
Table 5.5.4-5 Comparison of Rho.57Pt0.43 alloy reference data with
peaks observed for a HClICl2 leach residue
RhO.57PtO.43 HCVCI2 1each residue [7] (WP-Oll)
Reference data (36) Observed data
deAl (IJI1) 29 d(A) (IJI1) 29
2.227 (100) 47.4 2.227 (100) 47.4 l.927 (50) 55 .3 1.924 (34) 55.4 1.362 (85) 82.1 1.360 (54) 82.3 l.162 (85) 100.7 l.161 (57) 100.7 l.112 (18) 107.1 1.111 (11) 107.2
Table 5.5.4-6 Comparison of Rho.57Pt0.43 alloy reference data with
Ir reference data
RhO.57PtO.43 Ir
Reference data (36) Reference data (37) d(A) (IfII ) 28 d(A) (IfII ) 29
2.227 (100) 47.4 2.2170 (100) 47.6 1.927 (50) 55 .3 1.9197 (50) 55.5 1.362 (85) 82.1 1.3575 (40) 82.4 1.162 (85) 100.7 l.1574 (45) 101.2 l.112 (18) 107.1 1.1082 (15) 107.6

150
Figure 5.5.4-3 (a) and (b) shows this alloy as detected in an oxidative leach residue.
The peaks occur at quite different spacings to those of platinum, and are generally quite
broad. The insolubility of this alloy is shown by the fact that this phase had passed twic~
through the oxidative leach. This alloy is one of the few minerals of rhodium (38). Not
much is known about it except that virtually no other elements occur together with the
alloy (38) . This phase was rarely observed in samples.
Another rhodium alloy detected in a selectively leached concentrate sample was iridium
iron rhodium, (Fe,Rhh.s1ro.2' The observed XPD data gave a good fit with the
reference data, which was not all that accurate, having been collected using three
successive radiations (CuKa., CrKa., and FeKa.) over the 28 range (39) (Table 5.5.4-7).
Table 5.5.4-7 Comparison of (Fe,Rhh.sIro.2 reference data with peaks observed for a leached pre-treated concentrate
(Fe,Rh h.s1ro.2 Concentrate [1] (WP-013)
Reference data (39) Observed data d(A) (IJI!) 28 . d(A) (IJI!) 28
2.98 (IS) 34.9 2.984 (16) 34.9 2.11S (100) SO.O 2.116 (100) SO.O 1.720 (2) 62.7 1.729 (8) 62.3 1.493 (2S) 73.6 1.498 (18) 73 .3 1.34 (S) 83 .8 1.341 (18) 83 .7 1.22 (80) 94.3 1.22S (48) 93.8 1.06 (2) 11S.1 1.061 (17) 114.9
This alloy is reported to contain two phases giving identical powder patterns. The first
is iron-rich, white in colour, cubic, and has the formula Rh4FeSIr. The second is
rhodium-rich, brown in colour, pseudo-cubic, and has the formula RhsFe4Ir (39). The
observed peaks for this phase were very sharp and quite distinct (Figure 5.5.4-4(a) and
(b» . This phase is obviously a residual mineral. Tiny traces seemed to be present in
the some oxidative leach residues of normal concentrates, although at these levels only

100 80
IIIl 60 40 20 0
100 80
I1II 60 40 20 0
151
HClIC12 leach residue [7] Card number : WP-011 (Finsol-second pass)
I II: 142
I I I I I II III I I I I I I I I ·· ·· '· · ·T·· · ' ···· I ···· ' .... I .. ·· ' · · · · ····'· ··· r·· ·· '· · .. l .. ·· ' · .. T .. · '· ···I .. .. ' .... .. .. , .. . ..... , ... ... . . , ...
0 10 20 30 40 50 60 70 80 90 100 110 120 28 (degrees) COKC<l
Platinum rhodium Rho. 57PtO. 4 3
27-0504
I .. .. , .... ····0···· ···· 1···' .... .. .. . ···· 1···· .... , .... .... , .... ·· ·· 1···· ···· 0· ··· .... , ... . .... , . .. ····0 ··· ·
0 10 20 30 40 50 60 70 80 90 100 110 120 28 (degrees) COKC<l
Figure 5.5.4-3(a)
Rad. COKC<1 : 1.7889 200~~~~~~~~~~~~~~~~~~~~
162
128
98
72
, , ,
, Intensity 50 (counts) 32
18
8
2
O~~~~~~~~~~~~~~~~~~~~
o ro ~ ~ ~ ~ W ~ 00 W ~ 00 ~ diffracti()t1 angle, 28 (degrees)
Figure 5.5.4-3(b)

100 80
I1Il 60 40 20
Thioform [1] Card. number : WP-013 (after leaching and heating)
O+-=~~~~==~~~~~~~~~~~~~~~
o ro ~ ~ ~ ~ ro ~ ~ W ~ 00 m 29 (degrees) COK(X1
Iridium iron rhodium (Fe,Rh)I .8IrO.2 (Iron, rhodian)
152
100 25-1408 80
I1Il 60 40
~ I I o .... ,., ...... , ........ , .... .. .. , ........ , ........ , ........ , .... I .... ' .. .. I .... '· • 'I' .. , .. · 1 .... ' .... I .... ' ....
Intensity (counts)
o ro ~ ~ ~ ~ ro ~ ~ W ~ 00 W
200
162
128
98
72
50
32
18
8
2
0 0
29 (degrees) COK(Xl
Figure 5.5.4-4(a)
Rad. COK(Xl : 1.7889
,
, , ,
ro ~ ~ ~ ~ ro ~ ~ ~ ~ 00 m diffraction angle, 29 (degrees)
Figure 5.5.4-4(b)

153
two lines are evident, which makes assignment difficult. It probably plays a minor role
in rhodium and iridium insolubility.
Numerous low to medium intensity peaks appeared in almost every normal concentrate
leach residue, that could not be fitted to any reference data with certainty. In one
sample these peaks dominated all others and had intensities which corresponded well
with those of ruthenium sulphide, RuS2. The d-spacings where however greater, the
peaks being systematically shifted from those expected (Table 5.5.4-8).
Table 5.5.4-8 Comparison of RuS2 reference data with peaks
observed for a HCI/CI2 leach residue
RuS2 BCI/CI2 residue [30] (WP-lll)
Reference data (40) Observed data Deviation deAl (1111) 28 deAl (1111) 28 Ad (A) M8CO)
3.24 (75) 32.1 3.300 (54) 31.5 + 0.060 - 0.6 2.805 (100) 37.2 2.861 (91) 36.4 + 0.056 - 0.8 2.509 (20) 41.8 2.556 (40) 41.0 + 0.047 - 0.8 2.290 (20) 46.0 2.326 (25) 45 .2 + 0.036 - 0.8 1.983 (60) 53 .6 2.022 (70) 52.5 + 0.039 - 1.1 1.691 (100) 63 .9 1.721 (100) 62.6 + 0.030 - 1.3 1.619 (20) 67.1 1.647 (14) 65 .8 + 0.028 - 1.3 1.556 (8) 70.2 1.590 (16) 68.4 + 0.034 - 1.8 1.499 (10) 73.3 1.525 (16) 71.8 + 0.026 - 1.5 1.287 (20) 88 .1 1.311 (20) 86.1 + 0.024 - 2.0 1.254 (20) 91.0 1.273 (19) 89.3 + 0.019 - 1.7 1.145 (20) 102.7 1.164 (16) 100.4 + 0.019 - 2.3 1.080 (35) 11l.8 1.095 (25) 109.5 + 0.015 - 2.3
Figure 5.5.4-5(a) and (b) show how well the intensities correspond to those of RuS2.
Note the peak shifts as indicated in the reduced spectra. Clearly this phase is not RuS2,
but closely related to it. Structurally, ruthenium sulphide is cubic (41).

100 80
lIIl 60 40 20 0
HC1/C12 leach residue [30] (of Concentrate [4])
Card number : WP-1l1
154
h 112
0 10 20 30
Ruthenium sulphide
~ ~ ro ~ ~ ~ m 00 ~ 28 (degrees) COK(Xl
RuS2 (Laurite) 100 19-1107 80
IIIl 60 40
~"'H" H,IJHH'HH 'H" 1. 'H'"" "" ,.1 IH" "" "I"H" L,
Intensity
(counts)
o ill 20 ~ ~ ~ ro ~ 00 w m 00 ~
200
162
128
98
72
50
32
18
8
2
0 0
28 (degrees) COK(Xl
Figure 5.5.4-5(a)
Rad. COK(Xl : l.7889
, ,
ill 20 ~ ~ ~ ro ~ 00 W ~ 00 ~ diffraction angle, 28 (degrees)
Figure 5.5.4-5(b)

155
The unit cell dimension was calculated (using Cohen's least squares method - See
Appendix 1) based on a cubic structure, and a unit cell dimension, ao' of 5.6760A
obtained (Calculation data appears in Table 5.5.4-9.).
Table 5.5.4-9 Calculation of unit cell dimension for the observed data given in Table 5.5.4-8 (,,-2 = 3.2003)
d(A) 29 9 sin29 (bid) (b2+k2+12)
3.300 31.46 15 .73 0.0735 (111) 3
2.861 36.43 18.22 0.0977 (200) 4
2.556 40.96 20.48 0.1224 (210) 5
2.326 45.23 22.61 0.1479 (211) 6
2.022 52.52 26.26 0.1957 (220) 8
1.721 62.63 31.32 0.2701 (311) 11
1.647 65 .78 32.89 0.2948 (222) 12
1.590 68.45 34.22 0.3163 (230) 13 1.525 71.81 35 .91 0.3439 (321) 14
1.311 86.08 43.04 0.4658 (331) 19 1.273 89.26 44.63 0.4936 (420) 20 1.164 100.4 50.20 0.5902 (422) 24 1.095 109.5 54.76 0.6670 (333) 27
A = 0.024834 D = -0.000462 U nit cell dimension ao : 5.68 A
Table 5.5.4-10 lists similar cubic compounds together with their ao values (42).
Table 5.5.4-10 Cubic pgm chalcogenide minerals
Formula Mineral name Structure ao(A) Card No.
(Ru,Os,Ir)S2 laurite cubic 5.61 19-1107
RuS2 laurite cubic 5.61
(Os,Rh,Ir)S2 erlichmanite cubic 5.62 19-0882
(Rh,Pt,Ru,Ir)AsS hollingworthite cubic 5.77-5 .80 RhAsS hollingworthite cubic 5.78 (lr,Ru,Rh,Pt )AsS irarsite cubic 5.78 19-0591 IrAsS irarsite cubic 5.79 (Pt,Rh,Ru,Ir )AsS platarsite cubic 5.79 29-0974 Pt(As,Sh platarsite cubic 5.93

156
Table 5.5.4-10 shows that based on the ao value, a compound with formula (pgm)AsS
rather than (pgm)S2 is indicated, where (pgm) represents some ratio of rhodium,
platinum, ruthenium and iridium. A study of the mineral platarsite (43), found that as
the platinum present in the pgm ratio increases, the measured ao value also increases.
Given the low ao value measured (5.68A), a compound of formula (Ru,Rh,Ir,Pt)AsS
.(with very low levels of platinum) is indicated by the observed data. Figure 5.5.4-6
compares the reduced spectra of irarsite with that of the sample, showing that an iridium
rich compound also deviates from the observed data.
If the above assignment is correct, low rhodium solubility should be accompanied by low
ruthenium solubility, and to a certain extent, low iridium solubility. Table 5.5.4-11
compares the measured solubilities of these three pgms in the oxidative leach with XPD
data for the phase assigned as (Ru,Rh,Ir,Pt)AsS. A clear correlation exists between the
rhodium and ruthenium solubility of normal concentrates, extending in most cases to
observed iridium solubility.
Table 5.5.4-11 Comparison of rhodium, ruthenium and iridium solubilities in the HCIICI2 leach (for 8 concentrates)
Solubility in the BCI/CI2 leach Observed data ao Rh Ru Ir d(A) (counts) d(A) (counts) (A)
1 85.90 83 .97 86.96 2.8793 (29) 1.7344(21) 5.76 2 85 .93 85 .11 85 .24 2.8606 (14) 1.7124(13) 5.70 3 89.79 89.06 88.83 2.8741 (24) 5.75 4 90.24 89.39 88.76 2.8330 (27) 1.7105(36) 5.67 5 90.84 90.60 90.05 2.8362 (18) 1.7059(18) 5.67 6 90.96 89.65 89.08 1.7114(10) 5.67 7 93.95 93.49 91.71 2.8732 (11) 5.75 8 98.06 97.91 95 .75
The observed data in Table 5.5.4-11 relates to the two strongest peaks of the
(Ru,Rh,Ir,Pt)AsS phase; these being a peak usually positioned at about 2.87 A

HClIC12 leach residue [30] (of Concentrate [4])
Card number : WP-l11
157
100 80 60
III1 40
It: 112
20 O+===~==~~~~~H=~~~~~~~~~~~
o ro ~ ~ ~ ~ ~ ~ 00 ~ ~ 00 W
Iridium arsenic sulphide (Ir ,Ru,Rh,Pt)AsS
28 (degrees) COK!Xl
(Irarsite) 100 r-----~~-----:---------__, 19-0591 80 60
1111 40
~ , H" , H" H H ,HH , I, 'HJH" J.,1J o ill ~ ~ ~ ~ ~ ~ 00 ~ ~ 00 W
28 (degrees) COK!X1
Figure 5.5.4-6

158
(28 = 36.3°, (hkl) = (200» and a peak positioned at about 1.71A (28 = 63 .1°, (hkl) =
(311» . It should be noted that the d-spacings of these peaks are highly variable,
reflecting variable unit cell dimensions (as shown by the roughly calculated ao values).
Thus no definite Ru : Rh : Ir : Pt ratio seems to be indicated. No real relationship
between the observed counts for this phase and solubility exists, except that when
rhodium, ruthenium and iridium solubility is high, no peaks. are observed.
5.5.5 LOW IRIDIUM SOLUBILITY
For minor concentrates low iridium solubility was ascribed to the formation of iridium
oxide, Ir02, that forms together with Ru02 during the roast to volatilize selenium at the
base metal refinery (§ 5.5 .2). This also applies to normal concentrates if they have been
overdried.
For normal concentrates dried correctly, low iridium solubility was shown to be closely
related to a mixed chalcogenide, formulated as (Ru,Rh,Ir,Pt)AsS, where the platinum
group metal ratio was variable, but low in platinum (§ 5.5.4). The iridium-containing
alloy (Fe,Rh>t.2IrO.8 was also mentioned in § 5.5.4 as probably playing a minor role in
iridium solubility.
One other iridium alloy was detected in a few samples. This was the alloy (Os,Ir,Ru)
known mineralogically as iridosmine. Table 5.5.5-1 compares the reference data for this
compound with that observed for the oxidative leach residue of a normal concentrate
(Note that the reference data is not all that accurate.).
Figure 5.5.5-1(a) and (b) shows the scan and reduced pattern of a sample containing this
alloy. The peaks are usually oflow intensity and sharp.

Table 5.5.5-1 Comparison of (Os,Ir,Ru) alloy reference data with peaks observed for a HClfCI21each residue
(Os,Ir,Ru) HCI/CI2 residue [6] (WP-OlO)
Reference data (44) Observed data d(A) (III1) 29 d(A) (III1) 29
2.13 (100) 49.7 2.139 (100) 49.4 2.03 (50) 52.3 2.032 (67) 52.2 1.58 (50) 69.0 1.582 (67) 68.8 1.35 (60) 83 .0 1.352 (53) 82.9 1.22 (100) 94.3 1.222 (100) 94.1 1.14 (40) 103 .4 1.144 (67) 102.8 1.13 (10) 104.7 1.134 (-) 104.2 1.07 (70) 113.4 1.068 (53) 113 .8
159
This is also a residual mineral phase. The analysis of the reference alloy (a natural
sample from the Urals, Russia) gave a composition of 46.0% Os, 24.5% Ir, 18.3% Ru,
7.4% Pt and 2.6% Fe. Impurities were gold and copper (45). The analysis of a South
African sample gave an approximate formula of OSO.69IrO.24RuO.05PtO.OIFeO.OI (46). As
the levels of osmium in concentrates are very low, the effect of this alloy on iridium
solubility will be almost negligible. The phase is nevertheless of interest as it shows in
what form the small amounts of osmium are occurring.

100 80 60
I1Il 40
HCI/Cl2 leach residue [6] (Finsol)
160
Card number : WP-OI0
h 132
20 O+=~~~~~~~MM~h=~~~+.m~+.=~~~~
100 80
I1Il 60 40 20
o 10 20 30 40 50 60 70 80 90 29 (degrees) COKCX:l
Osmium iridium ruthenium (Os,Ir,Ru) (Iridosmine)
100 110 120
02-1194
o .... , ...... .. , .... ..... ........ , .... ' ... ·1 ...... ... , ....... .... ..... I··· 'T···· .· ··· ···· 1··· · .... , ... .. ·'· ·1··· ·
o ro 20 ~ ~ ~ ro ~ 00 ~ ~ 00 W 29 (degrees) COKCX:l
Figure 5.5.5-1(a)
Rad. COKCX:l : 1.7889 200
162
128
98
72 Intensity
50 (counts) 32
, , , 18
8
2
0 0 10 20 30 40 50 60 70 80 90 100 110 120
diffraction angle, 29 (degrees)
Figure 5.5.5-1(b)

161
5.5.6 LOW PALLADIUM SOLUBILITY
Palladium solubility in the HClICl2 leach is the best of all platinum group metals (Table
5.5.1-1). For normal concentrates it rarely drops below 99%, and can be as high as
99.978%. The reason for small amounts of palladium in normal concentrates being
insoluble is discussed in § 5.5.7. In some rare cases normal concentrates show quite bad
palladium solubility. The XPD examination of the concentrate and the residue of one
such case revealed that "low palladium solubility was the result of insoluble palladium
oxide, PdO. Table 5.5.6-1 compares the reference data for this compound with that
observed for a normal concentrate and its HClICl2 leach residue.
Table 5.5.6-1 Comparison of Pd~ reference data with peaks observed for a concentrate and HCI/Cl2 leach residue
PdO Concentrate [1] (WP-095) BCI/el2 residue [26] (WP-107)
Reference data (47) Observed data Observed data d(A) (I1II ) 28 d(A) (I1II) 28 d(A) (I1II) 28
2.644 (100) 39.5 2.636 (100) 39.7 2.624 (100) 39.9 2.153 (20) 49.1 2.156 (44) 49.0 2.148 (25) 49.2 1.674 (30) 64.6 1.685 ( - ) 64.1 1.683 ( - ) 64.2 1.536 (18) 71.2 1.536 (44) 71.2 1.543 (35) 70.9 1.319 (20) 85.4 1.315 (44) 85 .7 1.316 (25) 85 .7 1.1334 (6) 104.2 1.132 (25) 104.5 1.0806 (10) 111.7 1.079 (25) 111.9
Figure 5.5.6-1(a) and (b) shows palladium oxide as detected in the above residue.
When palladium oxide is present, the strongest line occurring at about 2.64A is generally
the only one observed. This concentrate had been overdried at the base metal refinery.
This was immediately evident as some ruthenium had been oxidized and a high
crystallinity was noted. Some palladium had clearly been oxidized during drying.
Palladium oxide is insoluble in acids when anhydrous, but can be reduced to the metal on
contact with hydrogen at room temperature (48) .

100 80
IIIi 60 40 "0 L.
0
100 80 60
IIIi 40
HClIC12 leach residue [26] (of Concentrate [1])
Card number : WP-I07
0 10 20
Palladium oxide Pd~
~ ~ ~ ro ~ ~ ~ ~ 00 ~ 28 (degrees) COKCXi
(Palladinite)
162
06-0515
20 I I II ,j I o ... . , .... , .... , .... , .... ..... , .. ....... ·· · · 1···· .... , ....... . •.. .. . . . . , .... . . . . j ., •• . ••• 1·.·· , ·· · ·1.· · · 1···· ' ... .
Intensity (counts)
o ill 20 ~ ~ ~ ro ~ ~ ~ ~ 00 ~ 28 (degrees) COKCXi
200
162
128
98
72
50
32
18
8
2
0 0
Figure 5.5.6-1(a)
Rad. COKCXi : 1.7889
ill 20 ~ ~ ~ ro ~ 00 ~ ~ 00 ~ diffraction angle, 29 (degrees)
Figure 5.5.6-1(b)

163
Determining the reasons for the low palladium solubility of minor concentrates is
complicated by the fact that the two main phases present, (Ru,Ir)02 and RhSe2+X,
dominate the concentrate and residue spectra. Both Pd~ and PdSe could form, but Pd~
seems more probable, having been found in overdried normal concentrates.
5.5.7 LOW PLATINUM SOLUBILITY
Platinum solubility in the oxidative leach generally ranges from 95 .6 to 99.9 % for
normal concentrates. A typical consignment of such concentrate usually contains about
78kg of platinum, meaning that for every 0.1 % drop in platinum solubility, 2.5 oz (troy)
of platinum remain behind in the oxidative leach residue. In cases of severe insolubility
the insoluble residue for a single consignment can contain over 100 oz (troy) of platinum
that have to be processed by other methods. Normal concentrates and their RCVCl2
leach residues were examined using XPD with the aim of explaining the lowering of
platinum solubility. Results showed that in almost all cases only one platinum
compound was responsible for solubility loss, this being the platinum sulphide PtS.
Table 5.5.7-1 Comparison oJ PtS reference data with peaks observed for two HCI/CI2 leach residues
PtS HCI/CI2 residue [4] (WP-004) BCI/eI2 residue [26] (WP-1l6)
Reference data (49) Observed data Observed data d(A) (III1) 29 d(A) (III1) 29 d(A) (III1) 29
3.02 (100) 34.5 3.025 (100) 34.4 3.020 (100) 34.5 2.452 (16) 42.8 2.461 (24) 42.6 2.452 (31) 42.8 1.910 (35) 55 .8 1.916 (45) 55.6 1.914 (43) 55.7 1.754 (20) 61.3 1.761 (41) 61.0 1.759 (31) 61.1 1.733 (16) 62.1 1.736 (54) 62.0 1.734 (31) 62.1 1.505 (35) 72.9 1.508 (25) 72.7 1.505 (29) 72.9 1.296 (8) 87.3 1.299 (15) 87.0 1.233 (16) 93 .0 1.239 (26) 92.4 1.237 (30) 92.7 1.226 (6) 93 .7 1.226 (15) 93 .7 1.227 (20) 93.6 1.152 (8) 101.9 1.152 (21) 101.9 1.137 (10) 103.8 1.137 (14) 103 .8 1.135 (15) 104.1

164
Table 5.5.7-1 compares the data for this compound with data observed for peaks in two
oxidative leach residues showing high levels of this sulphide.
Once the presence of this phase had been established, platinum solubility was compared
to the intensity (as given in counts), and the relative intensity (1111) of the (002, 101) PtS
line. Table 5.5.7-2 clearly shows that a relationship exists between the intensity of this
peak and observed platinum solubility. As a general trend, it was also noted that the
higher the sulphur content of the concentrate, the less platinum would be soluble.
Table 5.5.7-2 Comparison of Pt solubility with the intensity of the 3.02A PtS line observed for a series of normal concentrates residues
Platinum Hel/el2 residue Sulph'ur content
Solubility 3.02A (002, 101) PtS peak of concentrate (%) counts (1111) (%)
95 .58 67 (100) 11.3 98 .11 37 (52) 10.3 98 .12 24 (32) 9.3 98.83 21 (18) 11.1 99.41 10 (14) 8.6 99.89 0 (0) 8.5
Figures 5.5.7-1(a) and (b) show PtS as detected in the oxidative leach residue of a
normal concentrate showing low platinum solubility.
Figures 5.5.7-2, 3, 4, 5, 6 and 7 show the six residue scans corresponding to the data
given in Table 5.5.7-2 (in the same order) . In each case the (002, 101) PtS peak has
been indicated.
This sulphide has a considerable inertness, being insoluble in all acids except nitric acid.
It can however be decomposed by heating in air (50), via the reaction:
PtS+02 ~ Pt+S02

100 80
1/11 60 40 20 0
100 80
IIIl 60 40 20 0
Intensity
(counts)
HClICl2 leach residue [4] (Fin sol : Dried at 130°C)
Card number : WP-004
0 10 20 30
Platinum sulphide PtS
0 10 20 30
200
162
128
98
72
50
32
18
8
2
0
~ ~ W ~ ~ ~ ~ rn w 28 (degrees) COKlXl
(Cooperite)
~ ~ W ~ ~ ~ ~ rn w 28 (degrees) COKlXl
Figure 5.5.7-1(a)
Rad. COKlXl : 1.7889
, ,
165
h 74
18-0972
0 ro ~ ~ ~ ~ W W ~ W ~ rn ~ diffraction angle, 28 (degrees)
Figure 5.5.7-1 (b)

100 80
IIIl 60 40 20 0
HCI/C12 leach residue [35] (of Concentrate [9])
Card number : WP-116
0 10 20 30 40 50 60 70 80 90 28 (degrees) COK(Xl
Platinum sulphide
166
PtS (Cooperite) 100 ~----~-----------~ 18-0972 80 60 40 20 0~~~~~~~9F~~~~~~~~~9
Intensity (counts)
o 10 20 30 40 50 60 70 80 90 28 (degrees) COK(Xl
100 110 120
100
81
64
49
36
25
16
9
4
1
0 0
Figure 5.5.7-2(a)
Rad. COK(Xl : 1.7889
--
ro ~ ~ ~ ~ 60 ~ 00 ~ ~ 00 ~ diffraction angle, 28 (degrees)
Figure 5.5.7-2(b) Residue scan ofa concentrate showing aPt solubility of95 .58%

100 80
IIII 60 40 20 0
100 80
IIII 60 40 20 0
Intensity (counts)
HCl!Cl2 leach residue [36] (of Concentrate [10])
0 10 20 30 40
Card number : WP-117
50 60 70 80 90 28 (degrees) COKC<I
Platinum sulphide PtS (Cooperite)
0 10 20 30 40 50 60 70 80 90 100 110 28 (degrees) COKC<I
Figure 5.5.7-3(a)
Rad. COKC<I : 1.7889 100
81
64
49
36
25
16
9
4
1
0
167
I(72
18-0972
120
0 ro ~ ~ ~ ~ ro ~ 00 ~ ~ 00 W diffraction angle, 28 (degrees)
Figure 5.5. 7-3(b) Residue scan of a concentrate showing a Pt solubility of 98.11 %

100 80
I1Ii 60 40 20 0
HClIC12 leach residue [37] (of Concentrate [11])
Card number : WP-118
168
J-____ -L~-----1-----L-------___ h 74
0 10 20 30 40 50 60 70 80 90 29 (degrees) COKIXI
Platinum sulphide PtS (Cooperite)
100 ;.:..:----~-------.:..--------, 18-0972 80 60 40 20 O*=~~~~~~~~~~~~~~~~~
Intensity (counts)
o ro ~ ~ ~ ~ W W 00 ~ ~ 00 W
100
81
64
49
36
25
16
9
4
1
0 0
29 (degrees) COKIXI
Figure 5.5.7-4(a)
Rad. COKIXI : 1.7889
ro ~ ~ ~ ~ W W 00 ~ ~ 00 W diffraction angle, 29 (degrees)
Figure 5.5.7-4(b) Residue scan ofa concentrate showing aPt solubility of98.12%

100 80
IIIl 60 40 20 0
100 80
IIIl 60 40 20 0
Intensity (counts)
HCl/Cl2 leach residue [38] (of Concentrate [12])
Card number : WP-119
169
1--___ --:-...l.-__ -1-__ ...I-..-_____ ----j It: 114
0 10 20 30 40 50 60 70 80 28 (degrees) CoKO: l
Platinum sulphide PtS (Cooperite) r------:-------------_ 18-0972
0
200
162
128
98
72
50
32
18
8
2
0
10
0
20 30 ~ ~ ro ~ ~ ~ m 00 ~ 28 (degrees) CoKO: l
Figure 5.5.7-5(a)
Rad. CoKO: l : 1.7889
10 20 30 40 50 60 70 80 90 100 110 120 diffraction angle, 29 (degrees)
Figure 5.5.7-5(b) Residue scan ofa concentrate showing a Pt solubility of98.83%

HCI/CI? leach residue [40] (of Co;centrate [14])
170
Card number : WP-121
100 L ____ ...L __ :--______________ II: 74
80 60
IIIl 40 20 0~~~~~~~~~~4+~~~~F*'dp.~ o ro ~ ~ ~ ~ ro ~ ~
28 (degrees) COKC(l Platinum sulphide PtS (Cooperite)
100 18-0972 80 60
~ I I II ,I I I, III o ..... ... .......... ······ .. "1" · .. '· .. · 1 .... ' .... ' .... , .... , .. .. • .. •• .... . ........ . ........ ' .... 1 .... ' .... 1 .... ' · .. •
Intensity (counts)
a ro ~ ~ ~ ~ ro ~ ~ w ~ 00 ~ 28 (degrees) COKC(l
Figure 5.5.7-6(a)
Rad. COKC(l : 1.7889 100
81
64
49
36
25
16
9
4
1
0 0 10 20 30 40 50 70 80 90 100 110
diffractil)t1 angle, 29 (degrees) 120
Figure 5.5.7 -6(b) Residue scan of a concentrate showing a Pt solubility of 99.41 %

HClICl2 leach residue [42] (of Concentrate [16])
171
Card number : WP-123
100 J------L;-------------i h 102 80 60
I1II 40 20 0~~~~~~~~~~~~~~~~~9 o ill ~ ~ ~ ~ ro ~ ~ ~
Platinum sulphide PtS
28 (degrees) COKIXI
(Cooper it e) 100 ~------;----------------, 18-0972 80 60 40 20 0~~~~~~~~~~~~~~~~~9F~
Intensity (counts)
o ro ~ ~ ~ ~ ro ~ ~ ~ ~ M W
200
162
128
98
72
50
32
18
8
2
0 0
28 (degrees) CoK IX 1
Figure 5.5.7-7(a)
Rad. COKIXI : 1.7889
ro ~ ~ ~ ~ ro ~ ~ ~ ~ M rn diffraction angle, 28 (degrees)
Figure 5.5.7-7(b) Residue scan of a concentrate showing a Pt solubility of99.89%

172
A sample showing a high PtS content was ignited at about 700°C, and the residue
scanned. The intensity of the PtS (002, 101) line had been greatly reduced, and new
lines corresponding closely to platinum had appeared (Figure 5.5.7-8(a), (b) and (c»).
Pure platinum was not however indicated because a slight shift towards the d-spacings
given by palladium was evident. In Table 5.5.7-3 XPD data for reference platinum is
compared to that obtained by the ignition of pure (NH4h[PtCI6] and that obtained from
the ignition of PtS. The last column gives the data for reference palladium for
comparison. (See also Figure 5.5.7-9(a) and (b).) The platinum residue thus had
palladium present as an impurity, meaning the original sulphide is better formulated as
(Pt,Pd)S (Pt»Pd) rather than PtS.
Table 5.5.7-3 Comparison of XPD data for Pt obtained from the
ignition of PtS and pure (NH4h[PtCI61 with reference
data for Pt and Pd
Pt Pt Pt Pd Reference data (51) (NH4h [PtCI6] PtS Reference data (52)
deAl (IIIl) 26 deAl (IIIl) 26 deAl (IIIl) 26 deAl (IIIl) 26
2.265 (100) 46.5 2.266 (100) 46.5 2.255 (100) 46.7 2.246 (100) 46.9 1.9616 (53) 54.3 1.965 (51) 54.2 1.956 (51) 54.4 1.945 (42) 54.8 1.3873 (31) 80.3 1.388 (45) 80.2 1.381 (35) 80.8 1.376 (25) 81.1 1.1826 (33) 98 .3 1.1828 (62) 98.3 1.1763 (43) 99.0 1.1730 (24) 99.4 1.1325 (12) 104.3 1.1330 (22) 104.3 1.1248 (13) 105.4 1.1232 (8) 105.6
This platinum sulphide is one of the well known minerals of platinum (known
mineralogically as cooperite). It commonly occurs in ore from all sectors of the UG-2
chromite layer (53), and accounts for about 40% of platinum group minerals in the
Merensky Reef (54). Microprobe analyses (55) have shown that some natural samples
can contain 5.78% palladium; typical impurities were found to be nickel, lead and
bismuth. Thus an ignition of the sulphide could produce a Pt-Pd residue (rather than a
pure Pt residue), as was observed. The natural origin of this phase is also supported by
the fact that PtS is stable in other sulphide phases (56) . In matte, PtS could remain in the

I1Il
1/11
100 80 60 40 20 0
100 80 60 40 20 0
HClICl2 leach residue [35] ((1 f Concen tra te [9])
Card number : WP-116
173
h 67
0 10 20 30
Platinum sulphide PtS
0 10 20 30
~ ~ ro ~ 00 W ~ 00 W 29 (degrees) COKC!:l
( Cooperi te)
~ ~ ro ~ 00 W ~ 00 W 29 (degrees) COKC!:l
Figure 5.5.7-8(a)
HCl/Cl2 leach residue [35] (after heating in air)
Card number : WP-116-A
18-0972
100 J--------~--I....------L---l..-I...-- II: 81 80
1111 60 40 20 O+=~~~~~~~~~~~~~==~~~=+_=d o ro ~ ~ ~ ~ ro ~ 00 W ~ 00 W
Platinum Pt
28 (degrees) CoKexl
100 ..r-------~----------_ ____. 04-0802 80 60
1/11 40
20 . I II o " ""' " 1'' '' '''' ' """ "' 1"" "' " ""'" .. · ···'·"· 1"··' · ··· "" ,. " . , "" , "" " "' "'' 1''''' '''' . ".,. ".
o ro ~ ~ ~ ~ ro ~ 00 W ~ 00 W 29 (degrees) COKC!:l
Figure 5.5.7 -8(b)

100 80
IIIl 60 40 20 0
100 80
IIIl 60 40 20 0
HClICl2 leach residue [35] (after heating in air)
Card number : WP-116-A
174
It: 81
0 10 20 30
Platinum sulphide PtS
0 10 20 30
~ ~ ro ~ ~ ~ ~ rn w 28 (degrees) COKIXl
(Cooperite)
~ ~ ro ~ ~ ~ ~ 00 W 28 (degrees) COKIXl
Figure 5.5.7 -8( c)
18-0972

175
Pt sponge [B] Card number: BP-071 (obtained from the ignition of ACP [D])
I 100 II: 1347 80 60 40 20 I, o ......... , .... ..... , .... ..... , ..... .... , .. .. , .... , .... , .... , ... . , .... , .... , ........ , .... , .... , ... . \ .. .. , .... \ .... , ... .
100 80
IIII 60 40
o ill ~ ~ ~ ~ ro ~ 00 ~ ~ ® ~
Platinum Pt
28 (degrees) CoKO::1
~ I I I o .... , .... \ .... .. ... \ ......... \ .... , .... \ .... , .... , ... .... ··,····' ···· 1··· ·'····1····'····1 .... ' .. ·1 .. ··'····1 .. ·· '· .. ·
o ill ~ ~ ~ ~ ro ~ 00 ~ ~ rn ~ 28 (degrees) CoK 0:: 1
Figure 5.5.7-9(a)
Rad. CoK 0:: 1 : 1.7889 2000
1620
1280
980
720 Intensity
500 (counts) 320
180
80
20
0
04-0802
0 ill ~ ~ ~ ~ ro ~ 00 ~ ~ rn ~ diffraction angle, 28 (degrees)
Figure 5.5.7-9(b) XPD scan for platinum sponge (pure)

176
nickel sulphide matrix after most of the other pgms have been taken up by the Ni-Cu
alloy phase. This would explain why the formation of the CU3Pt alloy (§ 5.4.3) seems
favoured in certain circumstances.
The small amounts of palladium present in this phase would also have an effect on
palladium solubility. Table 5.5.7-4 compares the solubilities of platinum and palladium
for the series of samples examined above (Table 5.5 .7-2), showing a clear relationship
between the two.
Table 5.5.7-4 Comparison of Pt solubility and Pd solubility with the the intensity of the 3.02A PtS line observed for a series of normal concentrate residues
Platinum BCI/CI2 residue Palladium
Solubility 3.02A (002, 101) PtS peak Solubility (%) counts (IIII ) (%)
95 .58 67 (100) 96.75 98.11 37 (52) 98.41 98 .12 24 (32) 98.82 98 .83 21 . (18) 99.31 99.41 10 (14) 99.52 99.89 0 (0) 99.86
Another cause of low platinum solubility was found to be sintering. Overdrying normal
concentrates causes sintering of the finely divided pgm second stage leach residue. Such
concentrates dissolve much more slowly in the oxidative leach, due to a reduction in pgm
surface area. It was observed that in cases where overdrying of the concentrate had
taken place, sintered platinum, Pt, remained behind in the insoluble residue, while
palladium, rhodium and iridium dissolved. Table 5.5.7-5 gives XPD data for two
oxidative leach residues in which sintered platinum of low solubility was observed (both
concentrates had been overdried).

Table 5.5.7-5 Comparison of Pt reference data with data observed for residues showing residual sintered platinum
177
Pt Leach residue [1] (BP-027) Leach residue [26] (WP-I07)
Reference data (51) Observed data Observed data d(A) (III!) 29 d(A) (III!) 29 d(A) (III!) 29
2.265 (100) 46.5 2.263 (100) 46.6 2.259 (100) 46.6 1.9616 (53) 54.3 1.960 (37) 54.3 1.957 (62) 54.4 1.3873 (31) 80.3 1.383 (45) 80.6 1.389 (77) 80.2 1.1826 (33) 98.3 1.182 (36) 98 .3 1.178 (62) 98.8 1.1325 (12) 104.3 l.131 (13) 104.5 l.132 (38) 104.5
Figure 5.5.7-10 (a) and (b) shows sintered platinum as detected in residues. Note the
sharpness of the indicated peaks and the high crystallinity of the sample.
Figure 5.5.7-11 (a) and (b) shows another residue with smaller amounts of residual
platinum. Concentrate overdrying is immediately shown by the associated presence of
ruthenium oxide (lower pattern), which was also present in leach residue [1]. As some
residue samples showed ruthenium oxide and no sintered platinum, it would be
reasonable to regard ruthenium oxidation as taking place slightly prior to platinum
sintering.
Sintering was also found to be the primary cause of platinum insolubility in minor
concentrates.

100 80
1/11 60 40 20
Aqua-regia leach residue [1] Card number : BP-027 (of second stage leach residue) : scan 1
178
I . ~7'") l ' ) "
O+===~~~~~~~~~~~~~~~~~~~
100 80 60 40
o ill ~ ~ ~ ~ ro ~ ~ w m 00 ~ 28 (degrees) CoKO:1
Platinum Pt
20 I I I o .... , .... ··· ·, ·· · "1" ·· ·' · .. ·1 .. .. '· .. · 1· .. ·'· .. · 1 .... '····1 .... ' .... 1 .. .. ' .. .. 1 .... , ... ... .. , . ... .. . .. .. .... .. , .. . .
Intensity (counts)
o ill ~ ~ ~ ~ ro ~ ~ w m 00 ~ 28 (degrees) CoKO:1
Figure 5.5.7-10(a)
Rad. CoKO:1 : 1.7889 500
405 ,
320
245 , 180 , , 125
, 80
45
20
5
0
04-0802
0 ill ~ ~ ~ ~ ro ~ ~ ~ m 00 ~ diffraction angle, 28 (degrees)
Figure 5.5.7-1 O(b)

100 80
I1II 60 40 20
HC1/C12 leach residue [26] (of Concentrate [1])
Card number : WP-107
o~~~==~~~~~~~~~~~~~~~+-=~
o ill ~ ~ ~ ~ ro ~ 00 ~ ~ M W 28 (degrees) CoKO:: I
Platinum Pt
179
100 80
04-0802
1/11 60 40 20 I I I o ·· · · ··· ·· j· ·· · · ·· · · I· · · ·I ···· I····I···· I··· ·' ·· ··I · · ·· ' . . .. 1 .. .. 1 • • • • 1 . .. . .. . . . 1 . .. . , . .. . 1 . . .. .... . 1 . .. . ' .. . ·1 ···· '····
o 10 20 30 40 50 60 70 80 90 100 110 120 28 (degrees) CoK 0:: 1
Figure 5.5.7-11(a)
HClIC12 leach residue [26] (of Concentrate [1])
Card number : WP-I07
100 }-------I....-"'---'--__ L-..I..-'----L..L-..L.-..L-.._..l.-.....l.-_L...l It: 100 80 60
IlII 40 20 OT=~~9F~~~~~~~=H~~~~=4~~~ o ill ~ ~ ~ ~ ro ~ 00 ~ ~ M W
Ruthenium oxide Ru02
28 (degrees) CoKO:: I
100 21-1172 80 60
I1II 40
2~. ...... .. .., .,. ....... .. 1,. ... ,. L.!,. .. .... .., . , .... ,... .. ... ... o ro ~ ~ ~ ~ ro ~ 00 ~ ~ M W
28 (degrees) CoK 0:: I
Figure 5.5.7-11(b)

180
5.5.8 LOWSILVERSOLUBILITY
Silver generally accounts for less than 1 % of minor concentrates and 1 - 2% of normal
concentrates. The solubility of silver in the oxidative leach is usually not monitored.
The silver content of leach residues usually ranges from 2 to 10 % and can be as high as
22%. XPD analysis of several residues revealed that most of the silver remains behind
as silver chloride, AgCI. . In hindsight, this was a rather obvious result, but had not been
realized previously.
Table 5.5.8-1 compares the reference data for AgCl with that observed for two residues
having high silver contents.
Table 5.5.8-1 Comparison of AgCI reference data with data observed for two HClfCl2 leach residues
AgCI Leach residue [5] (WP-007) Leach residue [22] (WP-056)
Reference data (57) Observed data Observed data d(A) (I1Il) 2e d(A) (I1Il ) 2e d(A) (I1Il) 2e
3.203 (50) 32.4 3.178 (36) 32.7 3.186 (79) 32.6 2.774 (100) 37.6 2.758 (100) 37.8 2.763 (100) 37.8 1.962 (50) 54.2 1.954 (59) 54.5 1.957 (77) 54.4 1.673 (16) 64.6 1.669 (16) 64.8 1.670 (28) 64.8 1.602 (16) 67.9 1.599 (18) 68 .0 1.600 (33) 68.0 1.387 (6) 80.3 1.386 (9) 80.4 1.385 (11) 80.4 1.273 (4) 89.3 1.272 (8) 89.4 1.271 (10) 89.5 1.241 (12) 92.2 1.240 (17) 92.4 1.240 (32) 92.3 1.1326 (8) 104.3 1.132 (15) 104.5 1.132 (22) 104.4 1.0680 (4) 113 .8 1.067 (5) 114.0 1.067 (8) 113.9
In every case, d-spacings for silver chloride were observed to be smaller than those given
by the reference data.
Figures 5.5.8-1(a) and (b), and 5.5.8-2(a) and (b) show the scans and reduced spectra
for two silver-rich residues. Note the sharpness of the silver chloride lines (the

1/11
100 80 60 40 '")0 ~
0
100 80
III1 60 40
HCl/CI2 leach residue [5] (Finsol)
Card number : \VP-007
0 10 20 ~ ~ ~ ro ~ ~ 00 ~ 00 ~
Silver chloride AgCI
28 (degrees) COKC<l
(Chlorargyrite)
181
I . ')9') l ' .:. .:.
06-0480
20 o ...... .. . , .... ......... ....... ............................. ' .. . !., .... .. .. . ,' ......... , .. I ...... . , .. .. I ...... . .. . .. . .
o ro ~ ~ ~ ~ ro ~ ~ 00 ~ 00 ~ 28 (degrees) COKC<l
Figure 5.5.8-1(a)
Rad. COKC<l : 1.7889 500
405
320 ,
245
180 Intensity
125 (counts) 80
45
20
5
0 0 ro ~ ~ ~ ~ ro ~ ~ 00 ~ 00 ~
diffraction angle, 28 (degrees)
Figure 5.5.8-1(b)

100 80
1/11 60 40 20 0
HClIC12 leach residue [22] (Finsol)
Card number : WP-056
182
h 190
0 10 20
Silver chloride
~ ~ ~ ro ~ 00 ~ ~ rn w 28 (degrees) COKlXl
AgCl (Chlorargyrite) 100 06-0480 80
I1Il 60 40 20 o .... , .. ...... , ...... .. , ...... .. , ........ , ........ , ........ I...!. .... , .... : .... , ... T .' .• , .. . . , .... 1, . . .. , .•.. , ... .
Intensity (counts)
o ill ~ ~ ~ ~ ro ~ 00 ~ ~ rn w 28 (degrees) COKlXl
500
405
320
245
180
125
80
45
20
5
0 0
Figure 5.5.8-2(a)
Rad. COKlXl : 1.7889
,
ill ~ ~ ~ ~ ro ~ 00 ~ ~ rn w diffraction angle, 28 (degrees)
Figure 5.5.8-2(b)

183
crystallinity of the silver chloride in leach residues was found to be substantially higher
than that of silver chloride synthesised by normal laboratory methods).
Although silver chloride has a low solubility in water (lAx 1O-4g/100ml at 18°C) (58), the
solubility in 6M hydrochloric acid is considerably higher due to formation of a soluble
anionic complex via the reaction (59) :
AgCl + Cl- ---+ [AgCI2]-
Thus substantial amounts of silver are also present in the hot oxidative leach solutions.
Precipitation of the chloride usually occurs on dilution or pH adjustment of solutions.
Silver chloride is easily leached from residues using warm 4M aqueous ammonia, which
results in the formation of a soluble amrnine complex (60), via the reaction:
AgCl + 2 NH3'H20 ---+ [Ag(NH3h]+ + Cl- + 2 H20
Figure 5.5.8-3(a) and (b) show scans of an oxidative leach residue before and after total
silver chloride removal.
It is well known that silver chloride slowly photodecomposes to silver metal.
Unfortunately the main silver peak is overlapped by a strong Ru-Os alloy peak. A small
amount of metallic silver seems to form as ammonia leach residues still show traces of
silver to be present.
5.5.9 OTHER INSOLUBLES
XPD analysis showed that the bulk of many leach residues was silicon oxide, Si02. This ·
was the usual alpha- form, known geologically as quartz. Table 5.5.9-1 lists the Si02
reference peaks with those observed for a quartz-rich residue. Figure 5.5.9-1(a) and
(b) shows the reduced spectum and scan for this sample.

200
162
128
98
72 Intensity
50 (counts) 32
18
8
2
0 0
184
Rad. CoKO:1 : 1.7889
.....
ro ~ ~ ~ ~ ro ~ ~ ~ ~ M W
diffraction angle, 29 (degrees)
Figure 5.5.8-3(a) XPD scan of a leach residue showing silver chloride peaks
Rad. CoKO:1 : 1.7889 500
405
·~')O 5 ..
245
180 Intensity
125 (counts) 80
45
20
5
0 0 10 20 30 40 50 60 70 80 90 100 110 120
diffraction angle, 29 (degrees)
Figure 5.5.8-3(b) XPD scan of the above residue after an ammonia leach

185
Table 5.5.9-1 Comparison of Si02 reference data with data observed
for a HCI/Cl2 leach residue
Si02 Leach residue [28] (WP-109)
Reference data (61) Observed data d(A) (III}) 28 d(A) (III}) 28
4.26 (35) 24.2 4.232 (10) 24.4 3.343 (100) 31.0 3.327 (100) 31.2 2.458 (12) 42.7 2.450 (12) 42.8 2.282 (12) 46.2 2.276 (9) 46.3 2.237 (6) 47.1 2.231 (7) 47.3 2.128 (9) 49.7 2.122 (9) 49.9 1.980 (6) 53 .7 1.978 (4) 53 .8 1.817 (17) 59.0 1.814 (26) 59.1 1.801 (1) 59.6 1.797 (7) 59.7 1.672 (7) 64.7 1.670 (4) 64.8 1.541 (15) 71.0 1.540 (14) 71.0 1.453 (3) 76.0 1.452 (5) 76.1 1.418 (1) 78 .2 1.423 (4) 77.9 1.382 (7) 80.7 1.381 (10) 80.7 1.375 (11) 81.2 1.375 (16) 81.2 1.372 (9) 81.4 1.374 (19) 81.2 1.288 (3) 88.0 1.288 (4) 88.0 1.256 (4) 90.8 1.255 (6) 90.9 1.228 (2) 93 .5 1.227 (19) 93 .6 1.1997 (5) 96.4 1.199 (11) 96.5 1.1802(4) 98.6 1.180 (10) 98.6 1.0816 (4) 111.6 1.081 (10) 111.6 1.0437 (2) 118.0 1.044 (6) 117.9
The quartz phase originates from residual ore matrix and from the silica flux added to
remove the iron oxides from the matte (§ 4.2.2). Microscopic examination of leach
residues showed that quartz was present in two forms . The first was granular and sand
like. The second was globular (usually spherical), with tiny gas vesicles. Some of these
globules were various colours such as ruby red and amber yellow.
A second similar insoluble phase identified in residues was the magnesium iron silicate
(Mg,Fe)Si03, known mineralogically as enstatite (ferro an) or bronzite. This phase

100 80 60
IlIl 40 20
HClIC1 2 leach residue [28] (of Concentrate [3])
186
Card number : WP-I09
h 313
o~~~~~~~~~~~~~~~~~~~~
o ill ~ ~ ~ ~ ro ~ 00 ~ ~ M W
Silicon oxide alpha-Si02
29 (degrees) COKlXl
(Quartz, low) 05-0490 100
80 60
IIIl 40
20 I I I I 11. I 11 o .. ······"1"···· ·· ··1· ··· ·· ···1···· ··· ·"1"· ·· ····"1" ·· ·· ·· ·"1"·· .. ... "1" ........ ... ..... . ... ..... . ............ .... . . o ill ~ ~ ~ ~ ro ~ 00 ~ ~ M W
29 (degrees) COKlXl
Figure 5.5.9-1(a)
Rad. COKlXl : 1.7889 500
405 , 320
245
180 Intensity
125 (counts) 80
45
20
5
0 0 ill ~ ~ ~ ~ ro ~ 00 ~ ~ M ~
diffraction angle, 29 (degrees)
Figure 5.5.9-1(b)

187
gives numerous sharp peaks, making identification difficult if other phases are present.
The sample was thus separated into coarse and fine grains. Analysis of the coarse grains
confirmed the assignment. Table 5.5.9-2 compares the XPD reference data of this
silicate with that observed for a residue sample (only peaks above l.95A have been
listed).
Table 5.5.9-2 Comparison of (Mg,Fe)Si03 reference data with data observed for a separated HClICI2 leach residue
(Mg,Fe)Si03 Leach residue [12] (WP-046-A)
Reference data (62) Observed data d(A) (III!) 29 d(A) (III!) 29
4.01 (8) 25 .8 4.054 (14) 25 .5 3.30 (25) 3l.5 3.311 ( -) 31.3 3.15 (100) 33 .0 3.158 (100) 32.9 2.934 (30) 35.5 2.931 (36) 35.5 2.865 (60) 36.4 2.863 ( -) 36.4 2.819 (16) 37.0 2.814 (33) 37.1 2.698 (20) 38.7 2.700 (14) 38.7 2.528 (35) 4 l.4 2.530 (24) 4l.4 2.489 (40) 42.1 2.484 (38) 42.2 2.463 (20) 42.6 2.458 (33) 42.7 2.351 (4) 44.7 2.352 (12) 44.7 2.237 (6) 47.1 2.246 (13) 46.9 2.108 (25) 50.2 2. 116 (25) 50.0 2.091 (20) 50.7 2.094 (18) 50.6 1.979 (16) 53 .7 1.972 (14) 53.9 1.954 (20) 54.5 l.954 (26) 54.5
Figure 5.5.9-2(a) and (b) shows the reduced spectra and scan for this sample. The
reference compound analysed as 55.45% Si0 2, 34.48% MgO, 8.42% FeO and 2.03%
Al20 3 (geological analysis) (62). The identification of this phase was of interest as it
explained the trace amounts of aluminium in samples. Although this silicate is of
geological origin, it seems more probably to have been introduced by furnace bricks
(these are predominately bronzite).

100 80 60 40 '')0 .:..
HClICl2 leach residue [12] (coarse particles)
188
Card number : WP-046-A
h 151
O+=~*=~~~~~~~~~~~~~~~~~~
100 80 60 40 20
o 10 20 30 40 50 60 70 80 90 100 29 (degrees) COKC(l
Iron magnesium silicate 0.88MgSi03 ·0.12FeSi03 (Enstatite, ferroan)
110 120
19-0605
O+=~==~~~~~~~~~~~~~~~~=+~
Intensity (counts)
o ill ~ ~ ~ ~ ro ~ 00 ~ ~ l10 120
200
162
128
98
72
50
32
18
8
2
0 0
29 (degrees) COKC(l
Figure 5.5.9-2(a)
Rad. COKC(l : 1.7889
ill ~ ~ ~ ~ ro ~ 00 ~ ~ 00 ~ diffraction angle, 29 (degrees)
Figure 5.5.9-2(b)
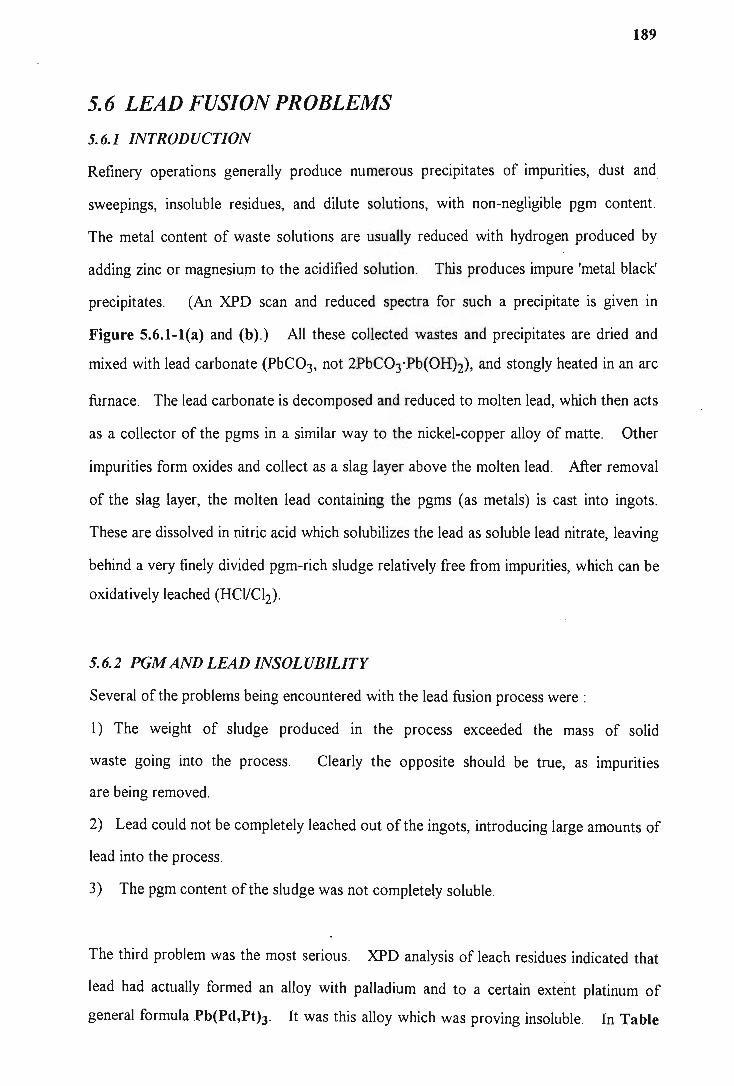
189
5.6 LEAD FUSION PROBLEMS
5.6.1 INTRODUCTION
Refinery operations generally produce numerous precipitates of impurities, dust and
sweepings, insoluble residues, and dilute solutions, with non-negligible pgm content.
The metal content of waste solutions are usually reduced with hydrogen produced by
adding zinc or magnesium to the acidified solution. This produces impure 'metal black'
precipitates. (An XPD scan and reduced spectra for such a precipitate is given in
Figure 5.6.1-1(a) and (b).) All these collected wastes and precipitates are dried and
mixed with lead carbonate (PbC03, not 2PbC03'Pb(OHh), and stongly heated in an arc
furnace. The lead carbonate is decomposed and reduced to molten lead, which then acts
as a collector of the pgms in a similar way to the nickel-copper alloy of matte. Other
impurities form oxides and collect as a slag layer above the molten lead. . After removal
of the slag layer, the molten lead containing the pgms (as metals) is cast into ingots.
These are dissolved in nitric acid which solubilizes the lead as soluble lead nitrate, leaving
behind a very finely divided pgm-rich sludge relatively free from impurities, which can be
oxidatively leached (HCl/CI2) .
5.6.2 PGM AND LEAD INSOLUBILITY
Several of the problems being encountered with the lead fusion process were :
1) The weight of sludge produced in the process exceeded the mass of solid
waste going into the process. Clearly the opposite should be true, as impurities
are being removed.
2) Lead could not be completely leached out of the ingots, introducing large amounts of
lead into the process.
3) The pgm content of the sludge was not completely soluble.
The third problem was the most serious. XPD analysis of leach residues indicated that
lead had actually formed an alloy with palladium and to a certain extent platinum of
general formula Pb(Pd,Pth. It was this alloy which was proving insoluble. In Table

100 80 60 40 20
Reduced metals Card number : BP-069 (reduced with Mg from an aqua-regia extract)
O~==~~~~~==~~~~~~~~~=+.~~~
o 10 20 30 40 50 60 70 80 90 100 110 120 29 (degrees) COKC(l
Platinum palladium rhodium iridium (Pt,Pd,Rh,Ir) (Residue of cubic pgms)
190
I( 100
100 .r----------:---------------, 05-0681 80 60 40 20 I I o ' , .. , ' .. , I .... , ' .. , I .. .. , .. , , I .... , ' , " .... ," " " .. , .... , .. , ' , .. , .... , .... I ' .. , , .. , , I .... , ' .. , I .... ,I, .. , I .... , .. ..
o ill ~ ~ ~ ~ W ~ 00 W ~ M W 29 (degrees) COKC(l
Figure 5.6.1-1(a)
Rad. COKC(l : 1.7889 200
162
128
98
72 Intensity
50 (counts) 32
18
8
2
0 0 ill ~ ~ ~ ~ W ~ 00 W ~ M W
diffraction angle, 29 (degrees)
Figure 5.6.1-1(b)

191
5.6.2-1 the reference data for the alloy PbPd3 is compared to that observed in two leach
residues. The scans and analyses for these residues are shown in Figures 5.6.2-1(a) and
(b), and 5.6.2-2(a) and (b).
Table 5.6.2-1 Comparison of PbPd3 reference data with data
observed for two sludge leach residues
PbPd3 Leach residue [2] (WP-009) Leach residue [1] (WP-006)
Reference data (63) Observed data Observed data deAl (IIIl) 29 deAl (IIIl) 29 d(A) (IIIl) 29
2.32 (100) 45.4 2.328 (100) 45.2 2.329 (100) 45 .2 2.01 (80) 52.8 2.017 (43) 52.7 2.019 (40) 52.6 1.80 (20) 59.6 1.804 (29) 59.4 1.644 (20) 65 .9 1.638 (6) 66.2 1.423 (70) 77.9 1.429 (30) 77.5 1.433 (37) 77.3 1.342 (5) 83 .6 1.338 (6) 83 .9 1.215 (90) 94.8 1.221 (44) 94.2 1.223 (55) 94.0 1.163 (40) 100.5 1.168 (13) 99.9 1.170 (21) 99.7 1.077 (5) 112.3 1.074 (6) 112.8 1.072 (15) 113 .0
This alloy also occurs naturally (as the mineral zvyagintsevite). In most cases small
amounts of platinum are found together with palladium, ie Pb(Pd,Pt)3 (64). Even in
11M hydrochloric acid (at room temperature) this alloy was only mildly attacked.
The solution to the 'insoluble lead' problem was twofold. The XPD analysis of one nitric
acid leach residue containing about 26% lead (should have been close to zero) showed
that most of the residue was lead sulphate, PbS04. Table 5.6.2-2 compares PbS04
reference data with that observed for a sample of nitric acid insolubles (only peaks above
1.95A have been listed). The scan and reduced spectra for this sample are shown in
Figure 5.6.2-3(a) and (b).

100 80
I1II 60 40 20 0
100 80
1/11 60 40 20 0
Intensity (counts)
192
H leach solids [2] Card number : WP-009 (water leached)
I I h 164
II , I III I II I' 1 III I , , . . .. •. .. · 1··· ·. ···· . ....... . ........ 'T' ...•...• , ....•.... , .... . .... . . . ... . ........... , . .. .•.. . · 1 .... •· · · · 1· ··· ··· ··
0 10 20 30 40 50 60 70 80 90 100 110 120 28 (degrees) COKCX:l
Lead palladium PbPd3 (Zvyagintsevite)
20-0827
I I I I .. .. • .... 1 .... •· .. ·1 .... • .... 1 .... • ........ . .. . ............... . ...... . . .. ...... •· .. T .... • .. ...... • .... 1 .. .. • ....
0 10
200
162
128
98
72
50
32
18
8
2
0 0
20 30 40 50 60 70 80 90 100 110 120 28 (degrees) COKCX:l
Figure 5.6.2-1(a)
Rad. COKCX:l : 1.7889
-
ill ~ ~ ~ ~ 60 ~ ~ ~ ~ 00 ~ diffraction angle, 28 (degrees)
Figure 5.6.2-1(b)

H leach solids [1] ('vvater leached)
193
Card number: WP-006
100 80 60
IIll 40
It: 67
20 O+-===~~=+==~~~~~~~~~~~~~~
100 80 60
1/11 40
o ro ~ ~ ~ ~ ro ~ 00 W ~ 00 ~ 29 (degrees) COKCXl
Lead palladium PbPd3 (Zvyagintsevite)
20 I I I I o ·· ·· ,· .. · I .... ,. .. · I .... ,· .. · I · ···,· .. · I .... ' .... r .... '· .. · .... , ...... ........... ,. ....... , ... ... .. ' .. ·· 1 .. .. '· · ..
Intensity (counts)
o ill ~ ~ ~ ~ ro ~ 00 W ~ 00 ~ 29 (degrees) COKCXl
Figure 5.6.2-2(a)
Rad. COKCXl : 1.7889 500
405
320
245
180
125 , 80
45
20
5
0
20-0827
0 10 20 30 40 50 60 70 80 90 100 110 120 diffraction angle, 29 (degrees)
Figure 5.6.2-2(b)

194
Table 5.6.2-2 Comparison of PbS04 reference data with data
observed for a nitric acid insoluble residue
PbS04 Nitric acid residue [2] (WP-008)
Reference data (65) Observed data d(A) (III1) 28 d(A) (III1) 28
4.26 (87) 24.2 4.252 (54) 24.3 3.8l3 (57) 27.1 3.801 (36) 27.2 3.622 (23) 28.6 3.610 (20) 28 .7 3.479 (33) 29.8 3.470 (25) 29.9 3.333 (86) 31.1 3.324 (77) 31.2 3.220 (71) 32.3 3.212 (62) 32.3 3.001 (100) 34.7 3.000 (100) 34.7 2.773 (35) 37.6 2.760 (44) 37.8 2.699 (46) 38.7 2.694 (42) 38.8 2.618 (8) 40.0 2.612 (17) 40.0 2.406 (17) 43 .6 2.406 (22) 43 .6 2.276 (20) 46.3 2.271 (24) 46.4 2.193 (7) 48 .1 2.192 (19) 48.2 2.164 (26) 48 .8 2.163 (29) 48.9 2.067 (76) 5l.3 2.066 (96) 51.3 2.031 (34) 52.3 2.033 (60) 52.2 1.973 (21) 53.9 1.971 (27) 54.0
Lead sulphate is almost totally insoluble in nitric acid (although it is soluble in sodium
hydroxide) and not decomposed by furnace temperatures having a melting point of
1170°C (66) . This sulphate has two possible origins.
The first of these is based on reactions with sulphide phases. Here the reactions would
be:
PbC03 ~ PbO + CO2
2PbO ~ Pb+02
4 Pb + 3 (Pt,Pd)S ~ Pb(Pt,Pd)3 + 3 PbS
PbS + 2 02 ~ PbS04
lead carbonate decomposition
lead oxide reduction
lead sulphide formation
lead sulphate formation
Any residual sulphur or sulphides could lead to the formation of lead sulphide; the third
reaction is just an example, based on one known source of sulphur.

100 80 60
IIII 40 20
Nitric acid insolubles [2] (from head)
Card number : WP-008
O+=~~~~~~~~~~~~~~~~~~~
100 80 60
IIII 40 20
o ill ~ ~ ~ ~ W ~ ~ ~ ~ 00 ~ 29 (degrees) COKC(l
Lead sulphate PbS04 (Anglesite)
O+.=~~~~~~~~~~~~~==~==~~~
o 10 20 30
200
162
128
98
72 Intensity
50 (counts)
32
18
8
2
0
,
~ ~ 60 ~ ~ ~ ~ 00 ~ 29 (degrees) COKC(l
Figure 5.6.2-3(a)
Rad. COKC(1 : 1.7889
, ,
195
05-0577
0 ill ~ ~ ~ ~ 60 ~ ~ ~ ~ 00 ~ diffraction angle, 29 (degrees)
Figure 5.6.2-3(b)

196
The second source of lead sulphate might simply be from the base metal refinery. Some
concentrates can be over 3% lead. Evidence for this source came from a normal
concentrate that had gone through a pre-treatment leach (3rd stage leach) to remove iron
and nickel. This residue contained 5.6% lead and showed clear evidence of lead
sulphate, although the sample was oflow crystallinity (Figure 5.6.2-4(a) and (b» . Note
the unleached pgm residue peaks. This is probably the most important source.
Although the above findings explained much of the problem, it was found that not only
was lead alloying with pgms, it was also reacting with oxide dust (mainly ruthenium
oxide). Another sample of insolubles from the nitric acid leach revealed the presence of
the mixed metal oxide Pb2Ru206.5' Table 5.6.2-3 compares the reference data for this
compound with data observed for a leach residue, before and after magnetic separation
(to remove the iron oxide Fe304). Values in boldface indicate overlap with another
phase, while those in italics indicate significant deviation from the reference values.
Table 5.6.2-3 Comparison of Pb2Ru206.5 reference data with data
observed for a nitric acid insoluble residue
Pb2Ru20 6.5 Residue [1] (WP-005) Residue [1] (WP-005-B) t Reference data (67) Observed data Observed data d(A) (1111) 28 d(A) (1111) 28 d(A) (1111) 28
2.959 (100) 35 .2 2.953 (100) 35 .3 2.956 (100) 35 .2 2.563 (35) 40.9 2.551 ( - ) 41.1 2.558 ( - ) 40.9 2.352 (9) 44.7 2.328 (11) 45.2 2.355 (18) 44.6 1.973 (5) 53.9 1.952 (11) 54.6 1.959 (17) 54.3 1.812 (50) 59.1 1.811 (54) 59.2 1.818 (50) 59.0 1.546 (55) 70.7 1.545 (44) 70.8 1.548 (46) 70.6 1.480 (12) 74.4 1.480 (27) 74.3 1.480 (24) 74.3 1.281 (7) 88 .6 1.282 (14) 88.4 1.282 (l3) 88 .5 1.176 (19) 99.0 1.178 (35) 98 .8 1.179 (34) 98.7 1.146 (17) 102.6 1.147 (23) 102.5 1.147 (26) 102.5 1.119 (1) 106.1 1.112 (11) 107.1 1.112 (13) 107.1 1.046 (15) 117.5 1.049 (29) 117.0 1.050 (23) 116.9
t The non-magnetic fraction of the residue

100 80 60
IlIl 40 20
3rd Stage leach residue [1]
197
Card number : WP-028
O~==~==~~~~~~~~~~~~~~~~'~
100 80 60
IIII 40 20
o ro ~ ~ ~ ~ ro ~ 00 w m m ~ 29 (degrees) COKC<1
Lead sulphate PbS04 (Anglesite)
05-0577
O~~~~~~~~~~~~~~~~==~==~d
o ill ~ ~ ~ ~ ro ~ 00 w m m ~ 29 (degrees) COKC<l
Figure 5.6.2-4(a)
Rad. COKC<1 : 1.7889 100 i"""""" ......................................................................................... ~~~ ............ """""""'w.....u........J..&. ............ ~............u~~
81
64
49
36 Intensity (counts) 25
16
9
4
1
O~~~~~~~~~~~~~~~~~~ o ro ~ ~ ~ ~ ro ~ 00 w m m ~
diffraction angle, 29 (degrees)
Figure 5.6.2-4(b)

198
Deviations are due to the original preparation for the reference material producing a
product of relatively low crystallinity. Some of the reference peaks were broad (68),
while all those observed for the residue compound were relatively sharp.
Figures 5.6.2-5(a) and (b), and 5.6.2-6(a) and (b) show the scans and reduced spectra
for the two residues of Table 5.6.2-3.
The discovery of this oxide was extraordinary as it has only been quite recently
synthesised. It was the first example of an anion-deficient pyrocWore (the ideal formula
should be Pb2Ru207), and is capable of metallic conduction (68) . The oxidation states
proposed in the given reference are : (Pb2+h[Ru4+Ru5+](02-)6.5-
The given laboratory synthesis (68) is to heat (850-900°C, in air) an intimately ground
mixture of lead nitrate (Pb(N03h) and ruthenium oxide (Ru02)' At these temperatures
lead nitrate decomposes into the basic monoxide (PbO) which then reacts with ruthenium
oxide. The oxygen radical (0) was suggested as being important in the reaction. The
simplified reactions are given below :
2 Pb(N03h ~ 2 PbO + 4 N02 + O2
8 PbO + 8 Ru02 + O2 ~ 4 Pb2Ru206.5
As lead monoxide is formed during the decomposition of lead carbonate to molten lead
in the lead fusion process, the first reaction above would be replaced by :
PbC03 ~ PbO + CO2
Unreacted ruthenium oxide (Ru02) was found together with lead ruthenium oxide in the
residue (PbO is soluble in nitric acid) (Figure 5.6.2-7). The reaction illustrates the
mildly acidic nature of ruthenium oxide. The identification of this oxide explained why
lead was not completely leachable, and the lead fusion mass balance problem. Attempts
are being made to phase out the lead fusion process.
The iron oxide Fe304 was also found in nitric acid insoluble residues, as mentioned
earlier (§ 5.4.1).

100 80
1/11 60 40 20
Nitric acid insolubles [1] (from head)
Card number : WP-005
0+===~~~~~~~~~~~~~+.m~~H=~~
100 80 60 40
o ro ~ ~ ~ ~ ro ~ ~ W ~ m w 28 (degrees) COKC<l
Lead ruthenium oxide Pb2Ru206 .5
20 I I J I J I I o .... , .... ··· ······1 ··· ·'··· ·1···· · ···· 1····· ·· ·· 1· ······ ·· ........... , ...... .... , . . .. .. ...... . 1 .... 1 •••• 1 .. .. ' . .. .
Intensity (counts)
o ro ~ ~ ~ ~ ro ~ ~ W ~ m w 28 (degrees) COKC<l
Figure 5.6.2-5(a)
Rad. COKC<l : 1.7889 200
162
128 , 98 , 72 , 50
32
18
8
2
0
199
34-0471
0 10 20 30 40 50 60 70 80 90 100 110 120 diffraction angle, 28 (degrees)
Figure 5.6.2-5(b)

100 80 60
IIIl 40 20
Nitric acid insolubles [1] (non -magnetic fraction)
200
Card number : WP-005-B
h77
O~~~~~~~~~~~~~~~~~~~~
100 80
o ro 20 ~ ~ ~ ro W 00 ~ ~ m ~ 28 (degrees) COKCX:l
Lead ruthenium oxide Pb2Ru206 .5
34-0471
1/Il 60 40
~ .... ....... , .... ....... ,..i! ...., I. .. , .. ""I" , .. "t o
100
81
64
49
36 Intensity
25 (counts) 16
9
4
1
0 0
10 20 30 40 50 60 70 80 28 (degrees) COKCX:l
Figure 5.6.2-6(a)
90 100 110 120
Rad. COKIXl : 1.7889
ro 20 ~ ~ ~ ro W 00 ~ ~ m ~ diffraction angle, 28 (degrees)
Figure 5.6.2-6(b)

100 80
1/11 60 40 20
Nitric acid insolubles [1] (from head)
Card number : WP-005
O+=~~~==~~~~~~~~~~~~~~~
o ro ~ ~ ~ ~ ~ W ~ ~ m m w 28 (degrees) COKC(1
Ruthenium oxide Ru02
201
100 ,-------:----------------, 21-1172 80 60
I1II 40
20 _1 I o .... , ... · 1 .... ' ........ , ........ , .. .... .. , .. .... .. " ....... , .. .I ..... , .. .. , .. .. , .... , ... , ........ , ........ , .... o ro ~ ~ ~ ~ ~ W ~ ~ m m ~
28 (degrees) COKC(1
Figure 5.6.2-7

202
Most lead is precipitated from solutions by pH control. It can also precipitate
automatically if chloride leach solutions are cooled as lead chloride, PbCI2 (which is only
soluble in warm solutions). This was found to be occurring in several cases. Table
5.6.2-4 compares lead chloride reference data with that typically observed in precipitate
samples (only peaks above 1. 95A have been listed).
Figure 5.6.2-8 shows the reduced spectra of such a precipitate.
Table 5.6.2-4 Comparison of PbCI2 reference data with data observed for a lead-rich precipitate
PbCI2 Precipitate [1] (WP-019 : Sphone)
Reference data (69) Observed data d(A) (IIIl) 29 d(A) (IIIl) 29
4.523 (14) 22.8 4.501 (29) 22.9 4.057 (35) 25 .5 4.051 (31) 25 .5 3.890 (75) 26.6 3.887 (93) 26.6 3.810 (40) 27.2 3.797 (51) 27.2 3.579 (100) 28.9 3.567 (100) 29.0 2.776 (55) 37.6 2.771 (84) 37.7 2.510 (45) 41.8 2. 506 (75) 41.8 2.261 (25) 46.6 2.260 (58) 46.6 2.214 (25) 47.7 2.215 (51) 47.6 2.152 (35) 49.1 2. 147 (61) 49.2 2.096 (40) 50.5 2.094 (81) 50.6 1.959 (18) 54.3 1.956 (63) 54.4
5.7 GOLD PROBLEMS
5.7.1 GOLD-RICH PRECIPITATES
Species, like lead chloride, that precipitate automatically or erratically are highly
undesirable as they have to be filtered out in places where a filtration line might be
absent. This slows the whole process. One precipitate problem occurring in pgm
refinery operations was the erratic deposition of precipitates that filtered with extreme
difficulty. These were relatively rich in gold (5 - 6%). XPD analysis of these

203
Sphone [1] Card number : WP-019
100 80
11: 35
III1 60 40 20 0
0 10 20 30 40 50 60 70 80 90 100 110 120 28 (degrees) COKC(l
Lead chloride PbCl2 (Cotunnite)
100 26-1150 80
IfIl 60 40 20 0
0 10 20 30 40 50 60 70 80 90 100 110 120 28 (degrees) COKC(l
Figure 5.6.2-8

204
precipitates showed that the gold was present as particulate metallic gold, Au. Table
5.7.1-1 compares the reference data for metallic gold with data observed for two such
precipitates. The scans and reduced spectra are shown in Figures 5.7.1-1(a) and (b),
and 5.7.1-2(a) and (b).
Table 5.7.1-1 Comparison of Au reference data with data observed for two gold-rich precipitates
Au Precipitate [1] (WP-OlS) Precipitate [2] (WP-027-A)
Reference data (70) Observed data Observed data deAl (III.) 29 deAl (III.) 29 d(A) (III.) 29
2.355 (100) 44.6 2.340 (100) 45 .0 2.350 (100) :-44.7 2.039 (52) 52.0 2.027 (60) 52.4 2.029 (55) 52.3 1.442 (32) 76.7 1.433 (32) 77.2 1.442 (32) 76.7 1.230 (36) 93 .3 1.223 (47) 94.0 1.228 (33) 93.5 1.1774 (12) 98.9 1.174 (19) 99.3 1.177 (17) 98.9
The identification of particulate gold was important as it showed that the cyclone used to
remove reduced gold was not working efficiently. An effective high-pressure filter press
has since replaced the cyclone.
5.8 RESIDUE AND PRECIPITATE WASHING
The washing of residues and precipitates is a common pgm refinery operation.
Incomplete washing is easily detected by XPD analysis. Evaporation of the wash
solution, followed by analysis of the evaporate also reveals what salts are being removed
by the wash. The pH adjustment of solutions was found to produce sodium chloride,
NaCI (71), in many precipitates (Figure 5.8-1). The high crystallinity of this phase
reduces the intensity of all other lines. It thus has to be removed from samples before a
meaningful XPD analysis can be performed.

100 80
I1Il 60 40 20 0
Fphone [5]
0 10
Gold Au
205
Card number : WP-018
h 106
~ ~ ~ ~ ro ~ ~ W ~ 00 W 29 (degrees) COKCl:l
100 04-0784 80 60
I1Il 40
20 I I I o ····I ···· I···· '···· I···· ·····;r····'···· .... , .... .... , ........ , .. .. ··· ·, ··· ·,· ···'··· ·r··· ·'··· · .... , .... ····1 .. .
Intensity (counts)
o ill ~ ~ ~ ~ ro ~ ~ W ~ 00 W 29 (degrees) COKCl:l
200
162
128
98
72
50
32
18
8
2
0 0
Figure 5.7.1-1(a)
Rad. COKCl:l : 1.7889
,
ill ~ ~ ~ ~ ro ~ ~ W ~ 00 W diffraction angle, 29 (degrees)
Figure 5.7.1-1(b)

pH 1 Cake [1] Card number: WP-027-A (after salt extraction)
I I I 100 80 60
If 11 40
20 I I I I I I I o .. ··'· .. ·1 ·· .. ' .... 1 .... ' .... 1· .. , ........ , ........ , ....... , .. ..... . , .. ... . .. , . . ..... . , ........ , ... . ... , ... .
206
It: 61
o ill ~ ~ ~ ~ ro ~ 00 W ~ M W 28 (degrees) COKC<l
Gold Au
100 04-0784 80
If 11 60 40
20 I I I o .... , ........ , ........ , .. ... ... , ........ , ........ , ........ , .. ...... , .... ···· '· ··· 1···· '···"1"···,·· · "1"·· · .. ···
o ill ~ ~ ~ ~ ro ~ 00 W ~ M W 28 (degrees) COKC<l
Figure 5.7.1-2(a)
Rad. COKC<l : 1.7889 100
81 ,
64
49
36 Intensity
25 (counts) 16
9
4
1
0 0 ill ~ ~ ~ ~ ro ~ 00 W ~ 00 W
diffraction angle, 29 (degrees)
Figure 5.7.1-2(b)

100 80
!Ill 60 40 20 0
207
Fphone [5] Card number : WP-018-B (evaporate of extract)
It: 1030
0 10 20
Sodium chloride
~ ~ ~ ro ~ 00 ~ ~ 00 ~ 28 (degrees) COKC<l
NaCl (Halite) 100 05-0628 80
!Ill 60 40 20
I I, I I o ... , ........ , ........ , .... ,· .. ·,· .. ·, ........ ·, .... ' .. ··r .... ' ........ , ..... .. . , ... ..... , ........ , ...... .. , ... .
Intensity (counts)
o ill ~ ~ ~ ~ ro ~ 00 ~ ~ 00 ~ 28 (degrees) COKC<l
2000
1620
1280
980
720
500
320
180
80
20
0 0
Figure 5.8-1(a)
Rad. CoKC<l : 1.7889
,
ill ~ ~ ~ ~ ro ~ 00 ~ ~ 00 W diffraction angle, 28 (degrees)
Figure 5.8-1(b)

208
Sometimes sodium carbonate is used to adjust pH. If this is not completely washed out
of the residue, drying was found to result in the partially hydrated salt,
Na2COJ·H20 (72) being present in residue cakes (Figure 5.8-2).
Another example of incomplete washing is shown in Figure 5.8-3. Here (NH4h[PtCI6]
provided by the refinery as the pure salt was found to contain relatively high levels of
ammonium chloride, NH4CI (73). The salt cannot be washed out with water as
(NH4h[PtCI6] is relatively soluble. Washing with cold 95% ethanol however removes
this salt completely.

209
Leaconc [4] Card number : WP-072
100 h 86 80
I1II 60 40 20 0
0 10 20 30 40 SO 60 70 80 90 100 110 120 29 (degrees) COKC(I
Sodium carbonate hydrate N~03'H20 (Thermona tri te)
100 08-0448 80
I1II 60 40 20 0
0 10 20 30 40 SO 60 70 80 90 100 110 120 29 (degrees) COKC(I
Figure 5.8-2(a)
Rad. COKC(I : 1.7889 200
162
128 , 98
72 Intensity
50 (counts) 32
18
8
2
0 0 ill ~ ~ ~ ~ ro ~ 00 ~ ~ 00 W
diffraction angle, 28 (degrees)
Figure 5.8-2(b)

100 80 60
1/11 40 20 o
Ammonium chloroplatinate (IV) (NH4)2F'tC16 (pure)
I
210
Card number : WP-060
I . ?'o-l ' ... I
I II I, I I ,III I I I II \ III I ..... ... . • , • • I • • • • ···· ' ···· 1···· ' ···· 1····'·· · · 1···· ' ·· .. 1· ···' ··· "1"· .. , · .. · I ···· ,· ··· , ····,··· ·, .. ··1···· 1'''· ' ····
o ill ~ ~ ~ ~ ro ~ 00 ~ ~ rn w 29 (degrees) COKtXl
Ammonium chloride NH4Cl (index pattern)
100 ,-------:----------------, 07-0007 80 60
1/11 40
2~ ... . ,. " "I" ' .. , . ... 1 .. . . ' J .. I ... . , . . . . , ... ,.! ... ... ! ... . .. 1 .. ,. ,.11" , . , .... 1,1. " ' '''"1" .. I. ,. ''' I '' .. , .. .. I .. .. ' . .. .
o ill ~ ~ ~ ~ ro ~ 00 ~ ~ rn w 29 (degrees) COKtXl
Figure 5.8-3(a)
Rad. COKtXl : 1.7889 500
405
320
245
180 Intensity
125 (counts) 80
45
20
5
0 0 10 20 30 40 50 60 70 80 90 100 110 120
diffraction angle, 28 (degrees)
Figure 5.8-3(b)

DOD CHAPTER 6
CONCLUSIONS DOD
211
The central aim of this project was to explain problems in platinum group metal
extraction using x-ray powder diffraction analysis to identify species in matte, residue
and precipitate samples. After the analysis of numerous process samples from both the
base metal and platinum group metal refineries, a much clearer picture emerged of what
was actually going on, what was dissolving, what was not dissolving, and what was
precipitating. The results of this work are summarized below, and in the diagrams
following.
6.1 CONVERTER MATTES
The main constituents of converter matte are nickel .sulphide (Ni3S2), copper sulphide
(Cu2S), nickel copper alloy (Ni-Cu), iron oxide (Fe304) / nickel iron oxide (NiFe20 4)
solid solution, nickel oxide (NiO), and trace amounts of cobalt sulphide (C03S4).
Nickel iron oxide (NiFe204) occurs mainly as a grey crust in matte aeration cavities,
together with cobalt sulphide (C03S4) .
XPD data can be used to detect fast cooling, determine the alloy stoichiometry and the
feasibility of magnetic separations.
If iron oxide, nickel iron oxide and nickel oxide are absent, XPD data can be used to
determine a weight % estimate of the Ni3S2, CU2S and Ni-Cu present in matte.

212
6.2 FIRST STAGE LEACH RESIDUES
The main constituents of first stage leach residue are nickel sulphides (Ni3S4 and NiS),
copper sulphide (Cu1.8S) and residual nickel copper alloy (Ni-Cu).
Leaching with potassium cyanide solution at 95°C removes almost all copper sulphide
(Cu1.8S) and almost all of the nickel sulphide Ni3S4.
Leaching with thiourea and hydrochloric acid removes almost all copper sulphide
(Cu1.8S), but none of the nickel sulphides nor any of the residual alloy.
6.3 BASE METALS IN NORMAL (OR MAJOR) CONCENTRATES
Copper occurs in normal concentrates as copper sulphate (CuS04'5H20), copper
sulphide (CuS), copper platinum alloy (Cu3Pt) and copper sulphate hydroxide
hydrate (Cu4S04(OH)6'H20).
The formation of copper platinum alloy (Cu3Pt) would be favoured by the fast cooling
of matte.
Copper sulphide (CuS) can be removed from concentrates (if present) by washing after
the concentrate has been dried at 260°C in the presence of sulphuric acid.
Nickel occurs in normal concentrates as nickel oxide (NiO) and nickel iron oxide
(NiFe204)·
Iron is present in normal concentrates mainly as nickel iron oxide (NiFe20 4)'
6.4 OTHER IMPURITIES IN NORMAL CONCENTRATES
Lead occurs in normal concentrates mainly as lead sulphate (PbS04).
Silicon occurs in normal concentrates mainly as silicon oxide (Si02), and in trace
amounts as magnesium iron aluminium silicate (Mg,Fe,Al)Si03.
6.5 PGMS IN NORMAL CONENTRA TES
Most of the platinum, palladium, rhodium, iridium, ruthenium and osmium content
of pgm concentrates is contained as a fine residual metallic mud of low crystallinity.
213
The overdrying of normal concentrates at the base metal refinery produces sintered
platinum, thereby reducing its solubility in the oxidative leach. (Small amounts of
palladium, iridium and rhodium are also rendered insoluble by the sintering process.)
Drying a normal concentrate in the presence of sulphuric acid produces a metallic pgm
residue of lower crystallinity relative to a normal concentrate dried without sulphuric
acid.
6.6 OXIDATIVE LEACHING OF NORMAL CONCENTRATES
Low platinum and palladium solubility in normal concentrates is the result of the mixed
sulphide (Pt,Pd)S (where Pt»Pd). This seems to be a residual mineral phase.
(Pt,Pd)S can be converted to metallic platinum and palladium of relatively low
crystallinity by ignition in air.
Low rhodium and ruthenium (and iridium) solubility is due in most cases to a
compound of the type (Ru,Rh,Ir,Pt)AsS. The composition of this compound is variable.
Low rhodium and platinum solubility in normal concentrates can be caused by the alloy
Rho.57PtO.43, a residual mineral phase.
Low rhodium and iridium solubility in normal concentrates can be due to the alloy
(Fe,Rh)l.SIrO.2, a residual mineral phase.
Low ruthenium solubility is usually the result of insoluble highly crystalline ruthenium
osmium alloy (-Ru160s).
Low iridium and osmium solubility can be due to the alloy iridosmine (Os,Ir,Ru).
Low silver solubility is due to insoluble silver chloride (AgCl).
6.7 OXIDATIVE LEACHING OF OVERDRIED NORMAL CONCENTRATES
Low platinum solubility is due to sintered highly crystalline platinum (Pt)
Low palladium solubility is due to palladium oxide (PdO).
Low ruthenium solubility is due to ruthenium oxide (Ru02).
Low iridium solubility is probably due to iridium oxide (lr02).

214
6.S OXIDATIVE LEACHING OF MINOR CONCENTRATES
Low platinum solubility in minor concentrates is due to sintered platinum of high
crystallinity formed during the high temperature roast to volatilize selenium.
Low palladium solubility in minor concentrates seems to be due to the formation of
palladium oxide (PdO) (by analogy with overdried normal concentrates). This would be
formed during roasting.
Low rhodium solubility is due to rhodium selenide (RhSe2+X)' formed by the reaction of
precipitated rhodium with elemental selenium during roasting.
Low ruthenium (and iridium) solubility in minor concentrates is due to ruthenium
oxide (Ru02) (and iridium oxide - Ir02) formed during roasting.
6.9 PRECIPITATES AND SALTS
Iron is precipitated by pH control from hot acidic solutions as iron oxide hydroxide
(~-FeOOH).
Tellurium coprecipites well with iron oxide hydroxide.
Iron can be present in pre-treated concentrates as sodium iron hydroxide sulphate
hydrate (Na2Fe(S04h(OH)"3H20).
After gold is reduced to metallic gold, highly efficiet:tt filtration is required to remove all
particulate gold from solution or it can precipitate erraticaly during subsequent
operations.
pH control using sodium hydoxide or sodium carbonate causes sodium chloride (NaCI)
to be present in many precipitates.
Cooling chloride solutions can lead to the precipitaton oflead chloride (PbCI2).
Dried precipitates can contain sodium carbonate monohydrate (Na2C03"H20).
Pure ammonium hexachloroplatinate (IV) can contain high amounts of ammonium
chloride (NH4CI).

215
6.10 THE LEAD FUSION PROCESS
Fusing metallic pgm waste with lead can lead to the formation of a lead-pgm alloy of
the type Pb(Pd,Pth oflow solubility.
Ruthenium oxide reacts with lead oxide (formed during the decomposition of lead
carbonate, PbC03) forming lead ruthenium oxide Pb2Ru206.5 which does not dissolve
in nitric acid.
Hydrated iron oxid~s (if present in waste precipitates) are converted to iron oxide
(Fe304) in the lead fusion process, which does not dissolve in nitric acid.
Lead sulphate (PbS04) can be a major constituent of the nitric insoluble residue of lead
ingots.

216
I CONVERTER MA TIE
[ Ni3S2 ) [ CU2S ) ( Ni-Cu 1
[ NiFe204 ) ( NiO ) ( Fe304 )
( C03S4 1
FIRST STAGE LEACH RESIDUE
[ Ni3S4 1 [ NiS ) [ CU1.8S )
[ Ni-Cu )

[Pt, Pd, Rh, Ir]
[ CU3Pt )
[ CuS ) [ CuS04'5H20 )
CU4S04(OH)6 ·H20
NiO (partially soluble)
NiFe204 (partially soluble)
[ PbS04 )
[ SOLUBLE)
NORMAL CONCENTRATE
I (Pt,Pd)S I I RU160S I
(Ru,Rh,lr,Pt)AsS
(Fe,Rh)1 .2Iro.8 (partially soluble)
I Rho.57PtO.43 I (Os,lr,Ru)
I Si02 I (Mg,Fe,AI)Si03
I INSOLUBLE I
[ [Ru,Os]
Pt (SINTER ED)
RU02/lr02
Pd~
INSOLUBLE (overdried)
217
)
I I

[Pt, Pd, Rh, Ir]
[ [Ru,Osj ]
[ SOLUBLE 1
MINOR CONCENTRATE
RhSe2+X
INSOLUBLE (reacted)
Pt (SINTEREO)
Ru02/lr02 I PdO (?) I
INSOLUBLE (overdried)
218

I PRECIPITATES AND SALTS
[ ~-FeOOH )
Na2Fe(S04)2(OH) ·3H20
[ Na2C03-H20 )
[ NaCI )
219
[ NH4CI )
[ Au ]

PbC03
FeOOH
Fe304
HN03 SOLUBLE
LEAD FUSION PROCESS
PbO
,
Ru02
Pb2Ru206.5
PbS04
- Pb
Pd,Pt
Pb(Pd,Pt)3
HN03 INSOLUBLE
220

REFERENCES AND NOTES
NOTE: All JCPDS Numbers apply to the following sources :
Joint Committee on Powder Diffraction Standards (JCPDS) -
International Centre for Diffraction Data (lCDD),
1601 Park Lane, Swarthmore, Pennsylvania 19081, USA (publishers)
(a) Powder Diffraction File, Sets 1-35
(b) Powder Diffraction File Search Manual, Inorganic, JCPDS-ICDD, 1990
(c) Metals and Alloys Search Manual, JCPDS-ICDD, 1978
221
(d) Selected Powder Diffration Data for Metals and Alloys, JCPDS-ICDD, 1978
(e) Inorganic Index, JCPDS, 1972
(f) Mineral Powder Diffraction File Data Book, JCPDS-ICDD, 1980
CHAPTER 1 INTRODUCTION
(1) Hofirek, Z (1988), The chemistry of the nickel-copper matte leach process
at Rustenburg Refiners (Rustenburg Refiners, Pty. Ltd.)
CHAPTER 2 X-RAY POWDER DIFFRACTION ANALYSIS
Bibliography
(1) (a) Barrett, C & Massalski, T (1980), "Structure of the Metals", 3rd ed.,
Pergamon Press: u.K. (Figure 2.2.2-1, p. 8)
(b) D'eye, W & Wait, E (1960), "X-Ray Powder Photography in Inorganic
Chemistry", Butterworths : London
(c) Whiston, C (1987), "X-ray Methods", John Wiley & Sons : London
(d) Klug, H & Alexander, L (1970), "X-ray Diffraction Procedures for
Polycrystalline and Amorphous Materials", John Wiley & Sons
(e) Stout, G & Jensen, L (1968), "X-ray Structure Determination - A Practical
Guide", Macmillan
(f) Azaroff, L (1968), "Elements of x-ray crystallography", McGraw-Hill
(g) Guinier, A (1952), "X-ray Crystallographic Technology", Hilger and Watts
Ltd. : London
(2) See (1)(a)-(g).
(3) See (l)(a)-(g).
(4) Philips Operation Manual
(5) Brindley, G and Brown, G, "Crystal Structures of Clay Minerals and their X-ray
Identification", Chapter 7, p.425 (Publisher and date of publication unknown.)
(6) See Note at beginning of References «b)-(f)

CHAPTER 3 PLATINUM GROUP METAL MINING IN SOUTH AFRICA
Informational sources :
222
A. Newman, S (1973), Platinum, Trans. Inst. Min. Metall., Section A, 82, A52-68
B. Cabri, L (1981), " Platinum-Group Elements : Mineralogy, Geology, Recovery"
The Canadian Institute of Mining and Metallurgy, CIM Special Volume 23,
Canada,p. 201-205
C. McLaren, C et al. (1982), The platinum-group chemistry and mineralogy of the
UG-2 chromite layer of the Bushveld complex, Economic Geology, 77,
p. 1348-1366
D. McLaren, C, A mineralogical investigation of the platinum-group minerals in the
UG-2 layer of the Bushveld complex with special reference to the recovery of the
minerals from the ores.
(Source : C McLaren, Dept. of Geology, Rand Afrikaans University,
PO Box 524, Johannesburg, 2000)
CHAPTER 4 THE BASE METAL REFINERY
(1) Habashi, F (1986), "Principles of Extractive Metallurgy, Volume 3 :
Pyrometallurgy", Gordon and Breach Science Publishers, UK
Habashi, F (1994), "Conversion Reactions in Inorganic Chemistry"
1. Chem. Ed, 71, 130
(2) Moore, 1. (1981), "Chemical Metallurgy", Butterworths : London, p. 215-226
& p. 232-236
(3) Gilchrist, J (1982), "Extraction Metallurgy", 2nd ed., Pergamon Press: Oxford,
p.275-293
(4) Boldt, J (1967), "T.he Winning of Nickel", Longmans : Toronto, p. 227-288
(4a) Mellor, J (1936), "A Comprehensive Treatise on Inorganic and Theoretical
Chemistry", Longmans : London, Volume XV, Chapter LXVIII (Nickel),
p. 15-20
(5) Barplats Base Metal Refinery Process Outline, Barplats Refineries (Pty) Limited
(6) JCPDS Number : 08-0126
Peacock (1946), University o/Toronto Studies, Geological Series. 21, 59-69 Structure : Westgren,A (1938), Die Kristallstruktur von Ni3S2,
Z. Anorg. Chem. 239, 82-84
(7) JCPDS Number: 23-0961
Cook, Jr., Thesis: The Cu-S Phase Diagram, Gould Labs, Cleveland, Ohio, USA
Cook et al.(1970), 1. Appl. Phys. , 41,3058
Structure: Evans, H (1971), Crystal structure of low chalcocite, Nature, London, 232,69-70

(8) Ni : JCPDS Number : 04-0850
Swanson & Tatge (1953), NBS Circular 539, 1, 13
Cu : JCPDS Number : 04-0836
Swanson & Tatge (1953), NBS Circular 539, 1, 15
(9) JCPDS Number: 19-0629
National Bureau of Standards (1967), Monograph 25, Sec. 5,31
(9a) JCPDS Number : 10-0325
National Bureau of Standards (U.S .) (1960), Circular 539, lQ, 44
(10) JCPDS Number : 04-0835
Swanson & Tatge (1953), NBS Circular 539, 1,47
(11) Putnam, A et al. (1973), "Metals Handbook",~, "Metallography, Structures
and Phase Diagrams", 8th ed. , American Society for Metals
Also Ref (12), p. 294.
(12) Vaughan, D & Craig, J (1978), "Mineral Chemistry of the Metal Sulphides",
Cambridge University Press, p. 293
(13) Ref (6), (JCPDS card data)
(14) Ref (12), p. 60
(15) Ref (12), p. 60-61 & p. 161
223
(16) Compare powder diffraction data of geological Ni3 S2 (Ref (6» with synthetic
Ni3S2 (JCPDS Number : 02-0772)
Westgren (1938), z. anorg. allgem.Chem. , 239, 82
(17) Ref (12), p. 290-291
(18) Ref (7), (JCPDS card data)
(19) Kostov,I & Minceva-Stefanova, J (1982), "Sulphide Minerals-Crystal Chemistry,
parageneses and systematics", E. Schweizerbart'sche Verlagsbuchhanlung :
Stuttgart, p. 48
(20) Ref (19), p. 49
Ref. (7), (Evans, H (1971»
(21) Ref (12), p. 384
(22) See Ni-Cu phase diagram in Ref (11).
(23) West, E (1982), "Copper and it's Alloys", John Wiley & Sons, p. 119
(24) Density range from JCPDS card data (See Ref (8).) .
(25) See Ref. (9) and (9a) .
(26) Ref (3), p. 315
(27) Wells, A (1984), "Structural Inorganic Chemistry", 5th ed.,Oxford University
Press : Oxford, p. 538
(28) Ref (3), p. 315
(29) Ref (10), (JCPDS card data)

(30) Ref (11), p. 10
(31) Wood, E (1964), "Crystals and Light", van Nostrand, p.80
(32) Ref (31), p. 81
(33) Wilcox, W (1969), Separation Science, ~, 95
224
(34) Brugman, C & Kerfoot, D (1986), Treatment of Nickel Copper Matte at Western
Platinum by the Sherritt Acid Leach Process, 25th Annual Conference of
Metallurgists, p. 2
(35) Ref (34), p. 3
(36) Cahn, R (1965), "Physical Metallurgy", North Holland, p. 294-295
(37) Whiston, C & Prichard, F (1987), "X-ray Methods", John Wiley & Sons, p.133
(38) Ref (37), p. 32
(39) Guinier, A (1952), "X-ray Crystallographic Technology", Hilger and Watts,
p. 212
(40) Ref (23), p. 119
(41) JCPDS Number : 08-0106
Gricaenko, Sludskaja & Ajdinjan (1953), Zapiski Vses. Mineral. Obsh., 82,
42-52
Structure : Ref (12), p. 49-51
(42) JCPDS Numbers given in Table 4.8-2. Cards can be found in :
Weissmann, S (Ed.) (1978), "Selected Powder Diffraction Data for Metals and
Alloys", Data Book, 1st ed., International Centre for Diffraction Data : USA,
Vol. I and II
(43) Morimoto, Koto & Shimazaki (1969), Am. Mineral., 54, 1256-1268
(44) JCPDS Number : 23-0962
See Ref (7) Cook, Jr. Thesis.
(45) JCPDS Number: 12-0041
National Bureau of Standards (U.S .) (1962), Monograph 25, Section 1, 37
Structure : Rajamani, V & Prewitt, C (1974), The crystal structure of millerite,
Can. Mineral., 12, 253-257
(46) Ref (12), p. 51
(47) Known nickel-iron alloys are : NiFe Known iron-platinum alloys are : PtFe (common), Pt3Fe (rare)
(48) Ref (34), p. 9
(49) Ref (34), p. 10
(50) Hofirek, Z (1988), The chemistry of the nickel-copper matte leach process
at Rustenburg Refiners (Rustenburg Refiners, Pty. Ltd.)

CHAPTER 5 THE PLATINUM GROUP METAL REFINERY
(1) Various private communications
Livingstone, S (1973), "The Chemistry of Ruthenium, Rhodium, Palladium,
Osmium, Iridium and Platinum", Pergamon Texts in Inorganic Chemistry, 25,
Pergamon Press, p. 1170-1173
(2) JCPDS Number : 10-0325
National Bureau of Standards (U.S .) (1960), Circular 539, 10,44
(3) JCPDS Number : 13-0157
MacKay (1960), Min. Mag. 32, 545
(4) See Ref (3).
(4a) For an excellent photo of ~-FeOOH crystals see :
Habashi, F (1986); "Principles of Extractive Metallurgy, Volume 3 :
Pyrometallurgy", Gordon and Breach Science Publishers, UK, p. 277
(5) Remy, H (1961), "Treatise on Inorganic Chemistry", Volume II, Elsevier
Publishing Company, p.273
(6) JCPDS Number : 17-0156
Cesbron (1964), Bull. Soc. franc. Mineral. Crist. 87, 125-143
225
(7) Mellor, J (1935), "A Comprehensive Treatise on Inorganic and Theoretical
Chemistry", Longmans : London, Volume XIV, Chapter LXVI (Iron), p.45-46
(8) See Ref (7).
(9) Wells, A (1984), "Structural Inorganic Chemistry", 5th ed.,Oxford University
Press : Oxford, p. 599
(10) Cabri, L (1981), "Platinum-Group Elements : Mineralogy, Geology, Recovery"
The Canadian Institute of Mining and Metallurgy, CIM Special V01ume 23 ,
Canada, p. 91 & p. 144
(11) JCPDS Number: 26-1139
Cabri et al. (1973), Can. Minerai. , 12, 21-25
(12) JCPDS Number : 04-0835
Swanson and Tatge (1953), NBS Circular 539, 1, 47
(13) JCPDS Number : 11-0646
(14) JCPDS Number : 20-0364
Mrose and Reichen (1967), Am. Mineral. , 52, 1582
(15) Brugman, C & Kerfoot, D (1986), Treatment of Nickel Copper Matte at Western
Platinum by the Sherritt Acid Leach Process, 25th Annual Conference of
Metallurgists, p. 10
(16) JCPDS Number : 06-0464
NBS (1955), Circular 539, 1, 13-14
(17) JCPDS Number : 35-1358

(18) Ref (9), p. 1297-1298
(19) JCPDS Number : 07-0138
Schubert et al. (1955), z. Metallkunde, 46, 692-715
(20) JCPDS Number: 06-0663
NBS (1955), Circular 539, ~, 5
Am. Mineral. (1976), Ql, 177
(21) Ref (10), p. 22
226
(22) Livingstone, S (1973), "The Chenpstry of Ruthenium, Rhodium, Palladium,
Osmium, Iridium and Platinum", Pergamon Texts in Inorganic Chemistry, Vol 25,
Pergamon Press, p. 1171 (Many other texts also give this information.)
(23) Avtokratova, T (1969), "Analytical Chemistry of Ruthenium", Ann Arbor
Humphrey Science Publishers : London, p. 4
Also Ref (22), p. 1194.
(24) Ref (9), p. 541
(25) Gutbier, A et al. (1916), z. anorg. Chem., 96, 182
(26) JCPDS Number : 21-1172
Boman (1970), Acta Chem. Scand., 24, 116
(27) JCPDS Number : 21-1315
Roy and Muller (1967), Bull. Am. Ceram. Soc., 46, 881
(28) JCPDS Number : 15-0870
NBS (U.S.) (1965), Monograph 25, Section 4, 19
(29) JCPDS Number : 23-1297
Boman (1970), Acta Chern. Scand., 24, 123-128
(30) Cotton, S & Hart, F (1984), "The Heavy Transition Elements", Macmillan Press:
London, p. 83
(31) JCPDS Number : 36-0242
(32) Ref (22), p. 1216
(33) JCPDS Number: 19-1047
Rummery and Heyding (1966), Can. J. Chem., 44
(34) See Ref (33).
See also Hulliger (1964), Nature, 204, 644.
(35) See Ref (33).
(36) JCPDS Number: 27-0504
Cabri, L et al. (1974), Can. Mineral., 12, 399-403
(37) JCPDS Number : 06-0598
NBS (1955), Circular 539, Vol. 4, 9-10
(38) Ref (10), p. 90

(39) JCPDS Number : 25-1408
Snetsinger (1973), Am. Mineral., 58, 189-194
F or radiation information see card and above reference.
(40) JCPDS Number : 19-1107
Sutarno et. al. (1966), Can. 1. Chern., 44
(41) See Ref (40).
(42) JCPDS Numbers given in Table 5.5.4-10
Mineral species source : Ref (10), p. 88-92
(43) Cabri, L et al. (1977), Can. Mineral.,.li, 385
See also card information (JCPDS Number 29-0974).
(44) JCPDS Number : 02-1194
Swjaginzeff and Brunowski (1932), z. Krist., 83, 188
(45) See Ref (44) and Ref (10), p. 160.
(46) Ref (10), p. 160
(47) JCPDS Number: 06-0515
Swanson et al. (1955), NBS Circular 539, 1,27
(48) Ref (22), p.1279
(49) JCPDS Number : 18-0972
Gronvold, et al. (1960), Acta Chern. Scand., 14, 1879-1893
227
(50) Sidgwick, N (1962), "The Chemical Elements and their Compounds", Vol. II,
Oxford University Press : Oxford, p. 1581
(51) JCPDS Number : 04-0802
Swanson and Tatge (1953), NBS Circular 539, 1, 31
(52) JCPDS Number: 05-0681
Swanson and Tatge (1953), NBS Circular 539, 1, 21
(53) McLaren, C et al. (1982), The platinum-group chemistry and mineralogy of the
UG-2 chromite layer of the Bushveld complex, Economic Geology, 77,
p. 1348-1366
(54) See Ref (53) and McLaren, C, A mineralogical investigation of the platinum
group minerals in the UG-2 layer of the Bushveld complex with special reference
to the recovery of the minerals from the ores. (Source : C McLaren, Dept. of
Geol., Rand Afrikaans University, PO Box 524, Johannesburg, 2000)
(55) Ref (10), p. 166
(56) Ref (10), p. 101
(57) JCPDS Number: 06-0480
NBS (1955), Circular 539, 1, 44-45
(58) Vogel, A (1982), "Vogel's Textbook of Macro and Semimicro Qualitative
Inorganic Analysis", 5th ed., Longman : u.K., p. 592

228
(59) See Ref. (60) .
(60) Cotton, S & Hart, F (1984), "The Heavy Transition Elements", Macmillan Press :
London, p. 140-141
(61) JCPDS Number: 05-0490
Swanson and Fuyat (1954), NBS Circular 539, J., 24
(62) JCPDS Number: 19-0605
Howie (1963), Mineralogy Society of America, Special Paper No. 1
(63) JCPDS Number : 20-0827
Cabri and Traill (1966), Can. Mineral., ~, 541-550
(64) Cabri, L (1981), " Platinum-Group Elements : Mineralogy, Geology, Recovery"
The Canadian Institute of Mining and Metallurgy, CIM Special Volume 23 ,
Canada, p. 147
(65) JCPDS Number : 05-0577
Swanson and Fuyat (1954), NBS Circular 539, J., 67
(66) The Merck Index (1989), Merck : USA, lIth ed., 5302, p. 853
(67) JCPDS Number : 34-0471
See also Ref. (68).
(68) Horowitz, H (1981), New oxide pyrochlores, Mat. Res. Bul., 16,489-496
Horowitz, H, Longo, J & Haberman, J : U.S . Patent 4, 124,539
(69) JCPDS Number : 26-1150
National Burea of Standards (1975), Monograph 25, Section 12, 23
(70) JCPDS Number : 04-0784
Swanson and Tatge (1953), NBS Circular 539, 1, 33
(71) JCPDS Number : 05-0628
Swanson and Fuyat (1953), NBS Circular 539, 2, 41
(72) JCPDS Number : 08-0448
NBS (1959) Circular 539, ~, 54
(73) JCPDS Number: 07-0007

229
APPENDIX 1
COHEN'S LEAST-SQUARES METHOD
The Bragg equation for calculating the unit cell dimensions of a cubic cell in the absence
of systematic errors is :
where 8 = (28 / 2)
h, k, 1 = Miller indices of the plane
A = (1..2 / 4ao2) A : wavelength of x-ray radiation (A) : ie. 1.78894A
ao : edge length of the cubic unit cell (A)
Cohen (1) has shown that if systemmatic errors, (dd / d), are present in the diffraction
data, and these variations are assumed to be proportional to cos28 for high angles, then
the difference between the true and the observed sin28 values (dsin28) will be equal to
Dsin228, where D is known as the 'drift' constant.
The Bragg equation in the presence of systemmatic errors thus becomes :
If two or more reflections are obtained, A and D can be calculated, and hence an
accurate value for ao'
The best results are however obtained by combining all the high angle data and
calculating A and D by the least-squares method. The equations used are :
where a. = (h2 + k2 + 12)
0= IOsin228
ALa. ·2 + D'La. ·O· = La. ·sin28 . I I I I I
ALa. ·O· + D'LO ·2 = LO ·sin28· I I I I I
(a factor of lOis introduced so that coefficients are of the same order of
magnitude)
D' = (D /10)

230
Thus :
from which an accurate value of ao can be calculated.
Using the Standard Powder Diffraction File data for copper one obtains an ao value of
3.6148A using the above method on all listed peaks and 6 decimals throughout the
calculation. The value quoted is 3.6150A. The corresponding values for nickel are
3.5239A (calculated), and 3.5238A (quoted).
(I) Cohen M (1935), Rev. Sci. Instr., 2, p. 68
See also : Barrett and Massalski (1980), "Structure of Metals", 3rd Rev Ed.,
Pergamon, UK, p. 146-147

231
APPENDIX 2
ISOLATION OF THE ALLOY PHASE
The isolation of the nickel-copper alloy phase from matte is difficult requiring the total
dissolution of the binary sulphide matrix (Ni3S2 + Cu2S). Samples of almost pure alloy
can however be isolated much more easily from first stage leach residue. The original
nickel sulphide component of the matrix (Ni3S2) is totally consumed in this leach. It
cannot however be assumed that all the original copper sulphide has been consumed. In
order to ensure that all the copper sulphides were consumed the following leach was
performed :
20.Og of first stage leach residue were placed in a solution of 60.0g thiourea in 500ml
1M HCI. The suspension was rapidly stirrered for 40 minutes at room temperature
using a glass rod. A magnetic stirrer was then introduced and stirring of the suspension
continued. Magnetic alloy particles collected on the stirrer-bar as a silvery-black
powder which was washed off into a crucible. After several collections the isolated
alloy powder was washed in ethanol, followed by ether, and air dried.
An EDAX analysis showed the alloy to be 79 wt% nickel and 21 wt% copper. This
agreed well with the value of 79.9 wt% nickel and 20.9 wt% copper calculated using
XPD data collected from the original matte. The alloy present in first stage leach
residue thus appeared to be identical with that present in the original matte.
Microscopic examination showed that not all the particles were well formed, although
some well formed cubic and octahedral crystals were observed. The crystals were
extremely small, this probably explaining the poor magnetic separation of this phase.

232
Two photographs of alloy crystals (cubic and octahedral), totally freed from the sulphide
matrix, obtained using an electron microscope are shown in Figures A and B. The small
size of the crystals should be noted.

233
Figure A An isolated cubic Ni-Cu crystal

234
Figure B An isolated octahedral Ni-Cu crystal


