
A POST-NORMAL SCIENCE APPROACH TO UNDERSTANDING THE REAL ISSUES,
CHALLENGES AND CONTEXTS OF MUNICIPAL SOLID WASTE (MSW) MANAGEMENT
IN DEVELOPING COUNTRIES – A CASE STUDY OF ABA-URBAN IN ABIA STATE,
NIGERIA.
By
Stanley Onyeonoziri Nwankpa
A thesis submitted in partial fulfilment of the requirements of the Queen
Margaret University, Edinburgh for the award of the degree of Doctor of
Philosophy (PhD)
May 2019

ii
ABSTRACT
Effective management of waste is a complex task requiring appropriate technical
solutions, sufficient organisational capacity and the collaboration of a wide range of
stakeholders. The more advanced, high-income economies and developed nations of the
world have evolved their current systems in a series of steps. It is now widely recognised
that it is counterproductive for developing countries to use strategies and policies
developed for high-income economies. There are no quick fixes. Therefore, it is
unrealistic for a developing country to expect to go from uncontrolled dumping of waste
to a ‘modern’ state of the art waste management system in one great leap. Rather, the
process should be locally sensitive, critical and creative and owned by the community of
concern. By adopting this approach, many cities and small towns in other developing
countries have recorded considerable progress while the same cannot be said of cities in
Nigeria, where there appears to be a lack of understanding and appreciation of the
enormity of the challenges posed by MSW.
The main aim of this study therefore, is to understand the real issues, challenges and
contexts of MSW management in developing countries, using the Nigerian city of Aba as
a case study. The study adopted a purely qualitative methodology, and by utilising the
approach of Post Normal Science (PNS) and Adaptive Methodology for Ecosystem
Sustainability and Health AMESH), particular attention was given to the oral testimonies
and lived experiences of the participants drawn from the wider peer community of
stakeholders of MSW management in the city.
The results provide the first historical review of MSW management in Aba and show that,
over the period reviewed; the MSW management processes remained rudimentary, often
involving the evacuation of refuse from one point to another. It also shows that currently,
indiscriminate dumping, littering and illegal dumping of refuse is common in the city.
Further analysis of the data revealed the inadequacies in the national sanitation policy
and the current MSW management system implemented by ASEPA – the agency
responsible for MSW management in the city. The level of planning and organisation of
MSW management activities was found to be shambolic and there were shortages in
manpower and availability of equipment needed to effectively collect and dispose waste.
The common method of waste disposal was found to be open dumping in dumpsites that
were unplanned and unsanitary. Despite these realities, the study found that contrary to

iii
the commonly held popular notion that residents of Aba prefer a dirty environment to a
clean one, most participants in this study showed a good understanding of the implication
of poor MSW management practices on public health, and expressed willingness to pay
higher sanitation fees if it will guarantee a cleaner environment.
To curb most of the conflicts that currently exist between ASEPA and other stakeholder
groups and move towards sustainable MSW management as indicated in the sustainable
development goals (SDGs) and millennium development goals (MDGs), the direction of
travel of MSW management in the city must change form a modernisation approach of
expending scarce public resources on imported sophisticated refuse collection and
transportation vehicles, that are unsuitable and does not stand the test of time for various
reasons; to adopting a local approach that encourages genuine participation of all
relevant stakeholders in the policy decision making, design, implementation and
evaluation of the MSW management system. Such approach will help improve the
livelihood of informal waste workers who are currently maligned, intimidated and
harassed by MSW management authorities.
ACKNOWLEDGEMENTS
I am forever grateful to God almighty for his unending love, care and grace.
iv
I wish to express my gratitude to my director of studies – Dr Eurig Scandrett. Without any
shadow of doubt, he is the best director of studies I could have had and I count myself
lucky to have worked with him. I hope, together, we are going to achieve much more with
all the projects we have planned.
To my co-supervisors – Prof. Claire Seaman and Suzanne Fustukian, I say thank you for
your guidance and support. I am truly grateful.
I must also thank Dr Karina Kielmann for the encouragement and support.
I am also grateful to Dr Martin Aniekan Ekanem - the man I call Papa-d-Papa. Without his
kindness, I possibly may not have embarked on this journey. Thank you for believing in
me.
Finally, my deepest sense of gratitude goes out to my beloved wife Ozioma Glad Stanley;
and my daughters – Michelle Ogechi Stanley and Elise Chidinma Stanley; for the love,
warmth, support, encouragement and prayers before, and throughout my studies. Long
may it continue….Amen!
DEDICATION
I heartily dedicate this work to God almighty, the author and finisher of my faith.

v

vi
DECLARATION
I declare that the work presented in this thesis is, to the best of my knowledge and belief,
original except as acknowledged in the text. The work was carried out in accordance with
the regulations and code of practice of Queen Margaret University, Edinburgh and the
material has not been submitted, in part or in whole, for any other degree at this or any
other university.
Name: Stanley Onyeonoziri Nwankpa
Signature: ……… ………………….
Date: May, 2019

vii
TABLE OF CONTENTS
ABSTRACT ..................................................................................................................................................... II
ACKNOWLEDGEMENTS ...............................................................................................................................III
DEDICATION ................................................................................................................................................ IV
DECLARATION ............................................................................................................................................. VI
TABLE OF CONTENTS ................................................................................................................................ VII
LIST OF FIGURES ....................................................................................................................................... XIII
LIST OF TABLES......................................................................................................................................... XIV
LISTS OF PICTURES .................................................................................................................................. XVII
LIST OF VIDEOS ....................................................................................................................................... XVIII
LIST OF ABBREVIATIONS ......................................................................................................................... XIX
CHAPTER ONE ............................................................................................................................................... 1
INTRODUCTION ..................................................................................................................................................... 1
1.1 Overview ...................................................................................................................................................... 1
1.2 Background Information ............................................................................................................................ 2
1.3 Justification ................................................................................................................................................. 5
1.4 Analytical Framework .................................................................................................................................. 6
1.5 Research Aims and Objectives ..................................................................................................................... 7
1.6 Outline of Thesis ........................................................................................................................................... 7
CHAPTER TWO .............................................................................................................................................. 9
LITERATURE REVIEW ............................................................................................................................................ 9
2.1 Introduction ................................................................................................................................................. 9
2.2 Waste and Solid Waste ................................................................................................................................ 9
2.2.1 Definition of Municipal Solid Waste (MSW) ............................................................................................ 10
2.2.2 MSW Management ................................................................................................................................. 10
2.3 Drivers of MSW management .................................................................................................................... 14
2.3.1 Historical review – drivers of waste management over the last millennium .......................................... 14
2.3.2 Historical Review – Drivers of the drivers ................................................................................................ 16
2.3.3 Contextual Review – current perspectives in developed countries ......................................................... 19
(a) Public Health ............................................................................................................................................... 19
(b) Environmental Protection ........................................................................................................................... 20
(c) Resource drivers .......................................................................................................................................... 20
(d) Institutional and Responsibility issues ........................................................................................................ 20
(e) Public awareness ........................................................................................................................................ 21
(f) Climate Change ........................................................................................................................................... 22
(g) Plastics Pollution ......................................................................................................................................... 22
2.3.4 Current Perspectives in developing countries ......................................................................................... 22
2.3.4.1 Public Health ........................................................................................................................................ 23
2.3.4.2 Environmental Protection .................................................................................................................... 24
2.3.4.3 Resource Management ........................................................................................................................ 25
2.3.5 Other drivers ........................................................................................................................................... 26
2.3.5.1 Technological Developments ............................................................................................................... 26
2.3.5.2 Regional and International drivers....................................................................................................... 27
viii
2.3.5.3 Socio-economic Drivers ........................................................................................................................ 27
2.3.5.4 Good Governance ................................................................................................................................ 27
2.3.5.5 The Waste Hierarchy ............................................................................................................................ 28
2.4 The Integrated Sustainable Waste Management (ISWM) ......................................................................... 29
2.4.1 Using the ISWM framework .................................................................................................................... 32
2.5 Governance Issues in ISWM ....................................................................................................................... 33
2.5.1 Inclusivity ................................................................................................................................................ 33
2.5.2 Financial Sustainability ........................................................................................................................... 34
2.5.3 Sound Institutions and Proactive Policies ................................................................................................ 36
2.6 ‘Wasteaware’ ISWM Benchmark Indicators .............................................................................................. 36
2.6.1 Benchmark Indicators - Physical Component .......................................................................................... 38
2.6.2 Benchmark Indicators – Governance Component ................................................................................... 38
2.7 MSW Management in the EEA ................................................................................................................... 39
2.7.1 National strategies in EEA countries and waste policy objectives .......................................................... 39
2.7.2 Institutional Contexts and Policy Instruments ................................................................................... 41
2.8 Overview of MSW management in developing countries and Africa ......................................................... 42
2.8.1 MSW Management in Ghana ................................................................................................................. 43
2.8.2 MSW Management in Kenya .................................................................................................................. 44
2.9 Nigeria – Background Information............................................................................................................. 46
2.9.1 Overview of MSW Management in Nigeria ............................................................................................ 48
2.9.2 Current status of MSW management in Nigeria ..................................................................................... 49
2.9.2.1 Waste Generation and Composition .................................................................................................... 49
2.9.2.2 Temporary Storage of MSW................................................................................................................. 51
2.9.2.3 Waste Collection and Transportation .................................................................................................. 51
2.9.2.3.1 Door to door/House to house collection ........................................................................................... 51
2.9.2.3.2 Kerbside ............................................................................................................................................ 52
2.9.2.3.3 Depot/Receptacle/Communal Facilities ............................................................................................ 52
2.9.2.4 Waste Treatment ................................................................................................................................. 54
2.9.2.5 Materials Recovery, Recycling and Composting .................................................................................. 54
(a) Itinerant waste pickers/buyers/cart pushers .............................................................................................. 55
(b) Scavengers .................................................................................................................................................. 55
(c) Middlemen/resource merchants ................................................................................................................. 56
(d) Recyclers ..................................................................................................................................................... 56
2.9.2.6 Waste Disposal..................................................................................................................................... 56
2.9.3 Aba – History and Background Information ........................................................................................... 57
2.9.3.1 MSW Management in Aba ................................................................................................................... 58
CHAPTER THREE ......................................................................................................................................... 60
RESEARCH METHODOLOGY .................................................................................................................................. 60
3.1 Introduction ............................................................................................................................................... 60
3.2 Theoretical underpinning of the study ....................................................................................................... 60
3.2.1 Municipal Solid Waste (MSW) Management Research .......................................................................... 61
3.2.2 Post Normal Science (PNS) ...................................................................................................................... 63
3.2.3 Adaptive Methodology for Ecosystem Sustainability and Health ........................................................... 65
3.3 The Research Design and Process .............................................................................................................. 67
3.3.1 Research website .................................................................................................................................... 68
3.3.2 Preliminary field study ............................................................................................................................ 69
3.3.3 Case Study ............................................................................................................................................... 71
3.3.3.1 Sampling Techniques ........................................................................................................................... 71

ix
3.3.3.2 The Study Area ..................................................................................................................................... 71
3.3.4 The Stakeholder Groups .......................................................................................................................... 72
3.3.4.1 The Government and Government Officials ......................................................................................... 73
3.3.4.2 Informal Recyclers/Waste Pickers ........................................................................................................ 73
3.3.4.3 Waste Management Contractors/Service Companies and their staff ................................................. 74
3.3.4.4 Law Enforcement and Proactive Institutions ....................................................................................... 74
3.3.4.5 Manufacturing and Production Companies ......................................................................................... 74
3.3.4.6 Traders and Market Unions ................................................................................................................. 75
3.3.4.7 General Public and Households ............................................................................................................ 75
3.3.5 Researcher Observation .......................................................................................................................... 75
3.3.6 Interviews ................................................................................................................................................ 76
3.4 Fieldwork and Data Collection ................................................................................................................... 78
3.4.1 Procedure ................................................................................................................................................ 79
3.4.1.1 Interviews ............................................................................................................................................. 80
3.4.1.2 Observations ........................................................................................................................................ 83
3.4.2 Ethical Consideration and Ethical Clearance ........................................................................................... 84
3.5 Organisation of data .................................................................................................................................. 84
3.5.1 Pseudonymisation ................................................................................................................................... 85
3.5.2 Transcription ........................................................................................................................................... 85
3.5.3 Thematic Coding of data ......................................................................................................................... 85
3.5.4 Thematic Analysis of data ....................................................................................................................... 86
3.5.5 Research Output ..................................................................................................................................... 87
CHAPTER FOUR ........................................................................................................................................... 87
THE HISTORY AND CONTEXTS OF MSW FROM THE PERSPECTIVES OF THE PARTICIPANTS ......................................... 87
4.0 Introduction ............................................................................................................................................... 87
4.1 Historical Review of MSW Management in Aba ........................................................................................ 88
4.1.1 Period 1 - Mbakwe’s Era (The era of Stability) ........................................................................................ 89
4.1.2 Period 2 – After Mbakwe (The Era of Decay) .......................................................................................... 91
4.1.3 Period 3 - During Ikpeazu’s tenure as DGM, ASEPA Aba Zone (The era of Adhoc remediation) ............. 94
4.1.4 Period 4 - After Ikpeazu’s tenure till date (The era of Oppression) ......................................................... 96
4.1.5 Summary ............................................................................................................................................... 102
CHAPTER FIVE ........................................................................................................................................... 104
CURRENT REALITIES AND CHALLENGES OF MSW MANAGEMENT IN ABA ............................................................... 104
5.0 Introduction ............................................................................................................................................. 104
5.1 Current realities and Challenges of waste collection, disposal and treatment ........................................ 104
5.1.1 ASEPA Aba zone, Key Officers, Structure and Operation ...................................................................... 104
5.1.2 Realities and Challenges related to Waste Generation ......................................................................... 108
5.1.2.1 Population .......................................................................................................................................... 108
5.1.2.2 Socio-economics ................................................................................................................................. 109
5.1.2.3 Government Policy ............................................................................................................................. 110
5.1.3 Realities and Challenges related to Waste Separation ......................................................................... 112
5.1.4 Realities and Challenges related to Waste Collection ........................................................................... 115
5.1.4.1 Indiscriminate Dumping/Littering ...................................................................................................... 116
5.1.4.2 Temporary Storage ............................................................................................................................ 120
(a) Transfer to the skip/secondary receptacle .............................................................................. 123
(b) Collection by informal waste recyclers/pickers ....................................................................... 125
(c) Illegal dumping and open burning ................................................................................................. 127
5.1.4 Realities and Challenges related to Waste Transfer and Transport ...................................................... 130

x
a. The skips ............................................................................................................................................. 130
b. Manpower ........................................................................................................................................... 131
c. Vehicles ............................................................................................................................................... 133
d. Routes and General Planning .......................................................................................................... 136
5.1.5 Realities and Challenges related to Waste Treatment .......................................................................... 137
5.1.6 Realities and Challenges related to Waste Disposal ............................................................................. 139
5.2 Current Drivers (Motives) and Driving Mechanisms of MSW Management in Aba ................................. 140
a. Public Health ...................................................................................................................................... 141
b. Source of Income ............................................................................................................................... 144
c. Spirituality (Christianity), Culture and Customs .......................................................................... 147
5.2.1 MSW Driving Mechanisms in Aba ......................................................................................................... 149
a. Policies and legal frameworks ........................................................................................................ 149
b. Public education and awareness .................................................................................................... 151
c. Technology ......................................................................................................................................... 151
d. Intimidation and harassment ......................................................................................................... 152
5.3 Implications of Poor MSW Management Practices on Public Health ...................................................... 152
5.4 Possible Economic Opportunities identified in MSW Management in Aba .............................................. 155
a. Sanitary Equipment .......................................................................................................................... 156
b. Waste Collection Service .................................................................................................................. 158
c. Waste Processing and Conversion .................................................................................................. 158
d. Sanitary Waste Disposal .................................................................................................................. 161
e. Human Resource Development and Training ............................................................................... 161
f. Monitoring and Enforcement .......................................................................................................... 162
g. Finance ................................................................................................................................................ 162
5.5 Profiling the Current Performance of MSW Management in Aba ........................................................... 163
5.6 Summary .................................................................................................................................................. 167
CHAPTER SIX ............................................................................................................................................. 169
MSW GOVERNANCE AND POTENTIAL AREAS OF CONFLICT BETWEEN STAKEHOLDER GROUPS ................................. 169
6.0 Introduction ............................................................................................................................................. 169
6.1 Governance .............................................................................................................................................. 169
6.1.1 Realities and Challenges relating to Inclusivity ..................................................................................... 169
Service users ................................................................................................................................................... 169
a. Equity of service provision ............................................................................................................... 169
b. Involvement in planning, policy formation, implementation and evaluation ......................... 170
c. Public awareness and education .................................................................................................... 171
d. Effectiveness of desired behaviour ................................................................................................. 173
Service Providers ........................................................................................................................................ 174
6.1.2 Financial Sustainability ......................................................................................................................... 175
6.1.3 Proactive Policies and Sound Institutions .............................................................................................. 179
6.2 Areas of Conflict between Stakeholders .................................................................................................. 182
a. Allocated/Stipulated Disposal Times ............................................................................................. 184
b. Rejection of the #50 (Fifty Naira) Waste Bag and Dissident Behaviour ................................... 185
c. Sanitation Levy and Funding Issues ............................................................................................... 186
d. Lack of Consultation and Perceived Neglect ................................................................................. 187
e. Perceived Lack of Service Provision for Levy Paid ....................................................................... 192
f. Non-recognition of Informal Waste Workers ................................................................................ 195
g. Lack of Monitoring and Enforcement and Focus on Fines and Penalties ................................. 197
h. Absence of Synergy and Conflicts between relevant Agencies of Government ........................ 198

xi
i. Imposition of Leaders on Market Traders’ Unions ....................................................................... 200
j. Intimidation and Harassment by Thugs working for ASEPA...................................................... 202
6.3 Oppression ............................................................................................................................................... 203
6.3.1 Overcoming Oppression ........................................................................................................................ 204
6.3.1.1 Public Education, Awareness and Sensitisation ................................................................................. 205
6.3.1.2 Advocacy and Environmentalism ....................................................................................................... 206
6.4 Summary .................................................................................................................................................. 207
CHAPTER SEVEN ....................................................................................................................................... 209
SUGGESTED SOLUTIONS BY PARTICIPANTS TOWARD AN ISWM SYSTEM IN ABA ...................................................... 209
7.0 Introduction ............................................................................................................................................. 209
7.1 Summary .................................................................................................................................................. 213
CHAPTER EIGHT ....................................................................................................................................... 215
DISCUSSION ...................................................................................................................................................... 215
8.0 Introduction ............................................................................................................................................. 215
8.1 Review of the Problem ............................................................................................................................. 215
8.2 Overview of Key Results ........................................................................................................................... 215
8.2.1 History of MSW Management in Aba ................................................................................................... 216
8.2.2 Aba Syndrome ....................................................................................................................................... 217
8.2.3 Realities and Challenges of MSW Collection, Treatment and Disposal ................................................. 219
8.2.4 Realities and Challenges of MSW Management Governance ............................................................... 227
8.2.5 Investment and Funding in MSW Management ................................................................................... 230
8.2.6 Operation and Integration of Informal Waste Workers ........................................................................ 233
CHAPTER NINE .......................................................................................................................................... 238
CONCLUSION AND RECOMMENDATIONS ............................................................................................................... 238
9.0 Summary .................................................................................................................................................. 238
9.1 Conclusion ................................................................................................................................................ 238
9.2 Challenges Encountered during the Study ............................................................................................... 240
9.3 Recommendations for Future Studies ...................................................................................................... 241
REFERENCES .............................................................................................................................................. 243
ANNEX ONE - VISION AND ACTION PLAN FOR SUSTAINABLE MSW MANAGEMENT IN ABA ............. 274
APPENDICES .............................................................................................................................................. 288
APPENDIX 1 - FOUR QUANTITATIVE INDICATORS FOR THE PHYSICAL COMPONENTS OF A MSW MANAGEMENT
SYSTEM ........................................................................................................................................................... 288
APPENDIX 2 - CRITERIA FOR ASSESSING THE QUALITY OF WASTE COLLECTION AND STREET CLEANING SERVICES ........ 289
APPENDIX 3 - CRITERIA FOR ASSESSING DEGREE OF ENVIRONMENTAL PROTECTION IN WASTE TREATMENT AND DISPOSAL
....................................................................................................................................................................... 290
APPENDIX 4 - CRITERIA FOR ASSESSING THE QUALITY OF PROVISION OF THE 3RS – REDUCE, REUSE AND RECYCLE...... 291
APPENDIX 5 - CRITERIA USED TO ASSESS THE DEGREE OF USER INCLUSIVITY ........................................................... 292
APPENDIX 6 - CRITERIA FOR ASSESSING THE DEGREE OF PROVIDER INCLUSIVITY ..................................................... 293
APPENDIX 7 - CRITERIA USED TO ASSESS THE DEGREE OF FINANCIAL SUSTAINABILITY ............................................. 294
APPENDIX 8 - CRITERIA USED IN ASSESSING THE ADEQUACY OF THE NATIONAL FRAMEWORK FOR MSW MANAGEMENT
....................................................................................................................................................................... 295
APPENDIX 9 - CRITERIA FOR ASSESSING THE DEGREE OF LOCAL INSTITUTIONAL COHERENCE .................................... 296
APPENDIX 10 – PILOT QUESTIONNAIRE .............................................................................................................. 297
APPENDIX 11 - DISTRICT MAP OF ABA ............................................................................................................... 300

xii
APPENDIX 12 - INFORMATION SHEET FOR POTENTIAL PARTICIPANTS ................................................................... 301
APPENDIX 13 - CONSENT FORM FOR PARTICIPANTS ............................................................................................. 302
APPENDIX 14 - AN EXAMPLE TRANSCRIPTION OF A SHORT INTERVIEW (PSEUDONYMISED) ..................................... 303
APPENDIX 15 - AN EXAMPLE TRANSCRIPTION OF AVERAGE LENGTH INTERVIEW (PSEUDONYMISED) ....................... 304
APPENDIX 16 - AN EXAMPLE TRANSCRIPTION OF A LONG INTERVIEW (PSEUDONYMISED) ....................................... 306
APPENDIX 17 - OBSERVATION NOTE .................................................................................................................. 318
APPENDIX 18 - OBSERVATION NOTE .................................................................................................................. 320
APPENDIX 19 - OBSERVATION NOTE .................................................................................................................. 321
APPENDIX 20 - ETHICAL APPROVAL FORM .......................................................................................................... 322

xiii
LIST OF FIGURES
Figure 2. 1: Phases in the development of modern waste management policy ................... 16
Figure 2. 2: The EU Waste Hierarchy ................................................................................................ 28
Figure 2. 3: First Conceptual Framework of ISWM ...................................................................... 30
Figure 2. 4: The ISWM analytical tool and development framework ..................................... 31
Figure 2. 5: ISWM - Two Overlapping Triangle ............................................................................. 31
Figure 2. 6: MSW landfilling rates in 32 EU countries in 2001 and 2010 . ............................. 41
Figure 2. 7: Map of Nigeria showing the Vegetation and Ecological zones ............................ 47
Figure 2. 8: Map of Nigeria showing Aba, other cities and country boundaries .................. 48
Figure 3. 1: PNS – Science for high decision stakes and system uncertainty…………………..64
Figure 3. 2: The Core Steps involved in AMESH ............................................................................ 66
Figure 3. 3: Flow chart for the research design and process ..................................................... 68
Figure 3. 4: Map of Aba urban ............................................................................................................. 72
Figure 3. 5: Social Media Campaign Poster ..................................................................................... 79
Figure 5. 1: The Organogram of ASEPA Aba zone …………………………………………………….. 105
Figure 5. 2: Ideal working of current MSW process in Aba ...................................................... 107
Figure 5. 3: Flowchart of MSW Collection in Aba ........................................................................ 115
Figure 5. 4: Wheelie Bins used for temporary storage of waste ............................................. 122
Figure 5. 5: Influence diagram showing the Implications of Poor MSW management
practices on Public Health ................................................................................................................. 154
Figure 5. 6: A Locally Fabricated Waste Skip ............................................................................... 157
Figure 5. 7: Locally fabricated public waste bins ......................................................................... 157
Figure 8. 1: Waste Collection Rates Correlate Positively with Income Levels…………….. 224
Figure 8. 2: Waste Collection Rates vary with Regions ............................................................. 224

xiv
LIST OF TABLES
Table 2. 1: A chronology of development of MSW management drivers in the UK ............ 14
Table 2. 2: Financial Sustainability – affordability and cost recovery in lower-middle to
high income cities .................................................................................................................................. 34
Table 2. 3: Specific Action Plan for ISWM in Nairobi .................................................................... 45
Table 2. 4: Waste composition (% by weight) in some Nigerian cities ................................... 50
Table 2. 5: Summary of waste collection, transportation and disposal vehicles operating
in Abuja ..................................................................................................................................................... 53
Table 3. 1: Some Inferences from preliminary field study .......................................................... 69
Table 3. 2: Researcher Observation and Links to Research Aims and Objectives ............... 75
Table 3. 3: Interview Questions and Links to Research Aims and Objectives ....................... 77
Table 3. 4: Breakdown of the Interviewees by stakeholder group........................................... 81
Table 4. 1: Four (4) Eras of MSW Management in Aba ................................................................ 88
Table 4. 2: Excerpt of Stakeholder Responses – Mbakwe’s Era ................................................. 89
Table 4. 3: Reasons given by Participants for a cleaner environment during Mbakwe’s era
..................................................................................................................................................................... 90
Table 4. 4: MSW- Related Legislative and Regulatory Instruments in Nigeria ..................... 91
Table 4. 5: Reasons given by Participants for poor state of MSW management between
1988 and 2013 ........................................................................................................................................ 94
Table 4. 6: Reasons for improved state of MSW management in Aba during the adhoc
remediation era ...................................................................................................................................... 96
Table 4. 7: Excerpt of Participant Responses – Era of Oppression ......................................... 100
Table 4. 8: Reasons given by Participants for the current poor state of MSW management
in Aba ....................................................................................................................................................... 102
Table 4. 9: Summary of the different Eras of MSW management in Aba .............................. 103
Table 5. 1: Excerpt from Stakeholders’ Response on Waste Generation Data in Aba ...... 108
Table 5. 2: Excerpt of Participants’ Responses on Waste Minimisation ............................... 111
Table 5. 3: Excerpt of Interviews with Stakeholders on Waste Separation ......................... 113
Table 5. 4: Participants views on indiscriminate dumping/littering .................................... 118
Table 5. 5: Observation note of a street vendor of fresh vegetables in Aba ........................ 118
Table 5. 6: Excerpt of Responses from Participants on Waste Storage and Handling ..... 120
Table 5. 7: Excerpt Responses from Participants on Waste Transfer ................................... 123
Table 5. 8: Observation note of waste transfer activities at Union Bank Junction, Aba ... 124
Table 5. 9: Participants responses relating to operation of informal waste workers ...... 126
Table 5. 10: Excerpt of Responses from Participants on Open Burning of Waste ............. 127
Table 5. 11: Excerpt of Responses from Participants relating to manpower, training and
equipment .............................................................................................................................................. 131
Table 5. 12: Excerpt of Observation of ASEPA staff on routine Evacuation of Waste in Aba
................................................................................................................................................................... 135
Table 5. 13: Excerpt of Responses from Participants on Waste Treatment ........................ 137

xv
Table 5. 14: Excerpt of Responses from Participants link Public Health to MSW
Management .......................................................................................................................................... 141
Table 5. 15: Comments from Participants expressing willingness to pay higher fees to
guarantee cleaner environment ...................................................................................................... 143
Table 5. 16: Excerpt of Responses from Informal Waste Workers ......................................... 145
Table 5. 17: Responses form Participants suggesting Spirituality and Culture as Motives
for MSW management ........................................................................................................................ 149
Table 5. 18: Some comments by Participants related to the Monthly Sanitation exercise in
Aba ............................................................................................................................................................ 150
Table 5. 19: Some common Ailments linked to Poor MSW Management by Participants
................................................................................................................................................................... 153
Table 5. 20: Responses from Informal Waste Workers on their Operations and Income 159
Table 5. 21: Benchmarking MSW Management in Aba using the ‘Wasteaware’ ISWM
Benchmark Indicators ........................................................................................................................ 165
Table 6. 1: Excerpt of Responses from Participants on Service User Involvement ........... 170
Table 6. 2: Excerpt of Responses from Participants on Public Awareness and Education
by EHDs and ASEPA ............................................................................................................................ 171
Table 6. 3: Excerpt of notes taken during Observation of ASEPA staffs on a routine
Awareness and Sensitisation exercise ........................................................................................... 172
Table 6. 4: Responses from Participants on public compliance .............................................. 173
Table 6. 5: Excerpt of Responses from Service Provider on Budget, Costs and Finance . 177
Table 6. 6: Excerpt of Responses from Participant on Financial Indiscipline ..................... 178
Table 6. 7: Excerpt of Participants Responses related to institutional coherence ............ 180
Table 6. 8: Responses from Participants on Stipulated Disposal Times ............................... 184
Table 6. 9: Responses from Participants relating to the #50 Bag and Dissident Behaviour
................................................................................................................................................................... 185
Table 6. 10: Responses from Participants relating to Service Fees ........................................ 186
Table 6. 11: Responses from Participants show lack of Consultation and Neglect ........... 188
Table 6. 12: Responses from Participants show a Perceived lack of Service Provision by
ASEPA ...................................................................................................................................................... 192
Table 6. 13: Responses from Informal Waste Workers on Intimidation, Harassment and
Extortion ................................................................................................................................................. 196
Table 6. 14: Responses from Participate suggest MSW Management Authorities focus on
Fines and Penalties at the Expense of Behavioural Change .................................................... 197
Table 6. 15: Responses from Participants suggest a lack of Synergy between Relevant
Agencies and Departments in MSW Management ..................................................................... 198
Table 6. 16: Comments by Traders show Anger over Imposition of Union Leaders......... 200
Table 6. 17: Members of a Union with Elected Leaders enjoy Collective Bargaining Power
................................................................................................................................................................... 201
Table 6. 18: Comments by Participants Intimidation and Harassment is widely used by
Thugs and agents working for ASEPA. .......................................................................................... 202

xvi
Table 7. 1: Possible Solutions Suggested by Participants ......................................................... 209
Table 8. 1: Responses from a key Participant on Waste Audit Information ........................ 225
Table 8. 2: Participants from TGGO cite Lack of Funds as Key Challenge in MSW
management .......................................................................................................................................... 230
Table 8. 3: Comments by Informal Waste Workers on Apprenticeship................................ 233
Table 8. 4: Insights on Informal Recycling and Informal Recycling Systems ...................... 234
Table 8. 5: Examples of Inclusive Recycling .................................................................................. 235

xvii
LISTS OF PICTURES
Picture 1: Heap of Garbage at Union Bank Junction, along Aba-Owerri Road, Aba ............. 3
Picture 2: Illegal Public Urinary and Dump at Aba Main Park (Park Road) ............................ 4
Picture 3: A Refuse-blocked gutter near Aba Main Park ............................................................. 98
Picture 4: Indiscriminate dumping of refuse and dilapidated road in Aba ........................... 99
Picture 5: Kent Street - a typical street in Aba with accumulated littering ......................... 117
Picture 6: A Gutter/Drainage along Aba-Owerri Road (Near Star Paper Mill) ................... 117
Picture 7: Gallery of photos for the observation of a street vendor ...................................... 120
Picture 8: Picture evidence of Open Waste Burning in Aba (I) ............................................... 129
Picture 9: Picture evidence of Open Waste Burning in Aba (II) ............................................. 129
Picture 10: An Improvised Waste Skip/Receptacle Point in Aba ........................................... 130
Picture 11: Broken down vehicles at ASEPA Aba operations HQ I ........................................ 134
Picture 12: Broken down vehicles at ASEPA Aba operations HQ II ....................................... 134
Picture 13: Refuse accumulation near a receptacle point on a Monday morning in Aba 137
Picture 14: Emelogu dumpsite in Aba ............................................................................................. 140
Picture 15: Informal Recycling (Re-use) - Plastics displayed for sale at Isi-Court, Aba .. 145
Picture 16: Gallery of Photos showing a clean and well maintained environment in Aba
................................................................................................................................................................... 148
Picture 17: Refuse collection along a busy Road in Aba ............................................................ 221
Picture 18: Environmental Blight caused by refuse in Aba ...................................................... 222

xviii
LIST OF VIDEOS
Video 1: Observation of Waste Evacuation Exercise in Aba ................................................... 135
Video 2: A short video of Emelogu dumpsite in Aba ................................................................. 139

xix
LIST OF ABBREVIATIONS
AfDB African Development Bank
AMESH Adaptive Methodology for Ecosystem Sustainability and Health
ANC African National Congress
ASEPA Abia State Environmental Protection Agency
BMW Biodegradable Municipal Waste
BSC Balanced Scorecard
BSE Bovine Spongiform Encephalopathy
CCN City Council of Nairobi
CEC Commission of the European Communities
CLO Compost-Like Output
CVA Contingent Valuation Approach
DEFRA Department for Environment, Food & Rural Affairs
DETR Department of the Environment, Trade and the Regions
DGM Deputy General Manager
DPSIR Driving Force-Pressure-State-Impact-Response
EAP Environment Action Programme
EEA European Economic Area
EEA European Environment Agency
EH Environmental Health
EHD Environmental Health Department
EHOs Environmental Health Officers
ESP Environmental Sanitation Policy

xx
FEPA Federal Environmental Protection Agency
FME Federal Ministry of Environment
FRN Federal Republic of Nigeria
GMO Genetically Modified Organisms
IDE Institute of Developing Economie
ISSER Institute of Statistical, Social and Economic Research
ISWM Integrated Sustainable Waste Management
KMA Kumasi Municipal Authority
LGAs Local Government Areas
MBT Mechanical Biological Treatment
MCD Municipal Corporation of Delhi
MDAs Ministries, Departments & Agencies
MDGs Millennium Development Goals
MENR Ministry of Environment and Natural Resources
MGM Microsoft Groove Music
MOU Memorandum of Understanding
MSW Municipal Solid Waste
NDMC New Delhi Municipal Council
NEPAD New Partnership for African Development
NGO Non-Governmental Organisation
NIMBY Not In My Back Yard
NPC National Population Census

xxi
NPM New Public Management
PIL Public Interest Litigation
PNS Post Normal Science
SDGs Sustainable Development Goals
SEPA Scottish Environmental Protection Agency
SMC Supreme Military Council
SME Small & Medium Enterprises
SSA Sub-Saharan Africa
UESP Urban Environmental and Sanitation Programme
UN United Nations
UNCED United Nations Conference on Environment and Development
UNDP United Nations Development Programme
UNEP United Nations Environment Programme
UN-HABITAT United Nations Human Settlement Programme
UNICEF United Nations International Children Emergency Fund
US EPA United States Environmental Protection Agency
USA United States of America
WAI-C War Against Indiscipline & Corruption
WCED World Commission on Environment and Development
WHO World Health Organisation
WtE Waste to Energy

1
CHAPTER ONE
Introduction
1.1 Overview
According to the United Nations Environmental Programme (UNEP), “Waste is a global
issue. If not properly dealt with, waste poses a threat to public health and the
environment. It is a growing issue linked directly to the way society produces and
consumes. It concerns everyone” (UNEP 2015, pg. 1). This is particularly the case in low
and lower-middle income countries (otherwise known as developing countries) where
the unhealthy disposal of solid waste is still one of the greatest challenges (Kofoworola
2007). At the Rio Earth Summit of 1992, the United Nations Conference on Environment
and Development (UNCED), among other things, recognised the integral and
interdependent nature of the earth. As part of the declarations, specifically principles 4
and 25, state “In order to achieve sustainable development, environmental protection
shall constitute an integral part of the development process and cannot be considered in
isolation from it” and “Peace, development and environmental protection are
interdependent and indivisible” respectively (UNCED 1992).
More recently, United Nations’ 2030 Sustainable Development Agenda recognised the
important role of sustainable waste management. Goal 11.6 aims to “By 2030, reduce the
adverse per capita environmental impact of cities, including by paying special attention
to air quality and municipal and other waste management” and Goal 12.4 aims to “By
2020, achieve the environmentally sound management of chemicals and all wastes
throughout their life cycle, in accordance with agreed international frameworks, and
significantly reduce their release to air, water and soil in order to minimize their adverse
impacts on human health and the environment” (UN 2018). These Sustainable
Development Goals (SDGs) are also interdependent.
Our activities on earth have always generated waste but managing the waste was never
a major issue when our population was relatively small and nomadic (Giusti 2009).
However, the quest for comfort and luxury of postmodern societies and the escalation of
urban centres, aided by urban population growth and rural to urban migration has
resulted in increasing waste generation and ultimately, a throwaway economy (Bongarts
2009; Turner 2009; Brown 2006). Historically, poor management of waste led to

2
contamination of water, soil and air, which significantly impacted public health. In
medieval times, epidemics associated with contaminated water decimated the
population of Europe and more recently, cholera was still a common occurrence. Some
direct health impacts of poor waste management are still observed especially in the
developing world (Giusti 2009; Wilson 2007).
1.2 Background Information
At the United Nations consultative meeting on expanding waste management services in
developing countries held in Tokyo, Japan in 2010, it was recognised that the main
challenge regarding waste management has changed perspective – from the older view
of ensuring minimum damage to public health and the environment to the manner in
which discarded resources are handled such that future generations are not deprived of
some or all of its value (Batagarawa 2011; Chandak 2010).
Municipal solid waste (MSW) can be classified based on its origin. The three (3) distinct
streams of MSW relevant for this study are:
i. Domestic waste (waste from households, food centres, markets, and
commercial premises)
ii. Industrial waste (excluding toxic waste that requires special handling)
iii. Institutional waste (waste from government establishments, schools, hospitals
and recreational facilities) (Ezechi et al 2017)
This research is a case study of Aba – a city in south eastern Nigeria known for its markets
and the craftsmanship of artisans. The state of MSW management in Aba is typical of most
Nigerian cities. City specific data necessary for adequate waste management planning are
unavailable. Though there have been several changes in government and in the
institutions responsible for the environment, the challenges of waste management have
become even more daunting in Aba. With a thriving manufacturing sector, albeit artisans,
and an estimated population of almost one million people, Aba is simply the commercial
hub of eastern Nigeria (Izugbara and Umoh 2004). Testament to this is the presence of
big markets such as Ariaria International Market, Ahia Ohuru (New Market) and Ekeoha
Shopping Complex (Aba Shopping Centre) which attract traders from all over Nigeria and
beyond. The location of Aba (Fig 2.8 in Pg. 44) and the transport (road) connectivity it
provides to several other cities and towns in Nigeria ensures Aba is pivotal to the road

3
transport network in the region, though poor maintenance, neglect and a lack of
investment in infrastructural developments have for long threatened the city’s capability
of living up to this billing. The Abia State Ministry of Environment through its parastatal
ASEPA (Abia State Environmental Protection Agency) is responsible for the
environmental upkeep of the city. One of its stated goals is “Pollution Control &
Environmental Sanitation” (Abia State Government 2014). Clearly, Pictures 1 and 2 below
show a city in dire need of actions to prevent an epidemic such as that which occurred in
Accra, Ghana in 2011 where indiscriminate dumping of plastics and uncollected waste
blocked drainages and caused flooding resulting in over 100 incidents of cholera and a
death toll of fourteen while 17,000 people lost their homes. Roads, waterways and
bridges were also destroyed (UNEP 2015). A brief history of the city of Aba and the state
of MSW management in the city are provided in Sections 2.9.3 and 2.9.3.1 respectively.
Picture 1: Heap of Garbage at Union Bank Junction, along Aba-Owerri Road, Aba
[Credit: Researcher]

4
Picture 2: Illegal Public Urinary and Dump at Aba Main Park (Park Road) [Credit: Researcher]
Earlier studies relating to waste management in Nigeria have focused more on issues
such as waste composition (Igoni et al 2007; Kofoworola 2007; John et al 2006),
perception and awareness (Babayemi and Dauda 2009; Longe et al 2009), state of the
environment (Anake et al 2009), regulations and governance (Nzeadibe et al 2010; Kalu
et al 2009), assessment of factors (Ezeah 2010) and development of a sustainability
appraisal tool (Batagarawa 2011), while other previous studies have also documented a
wide range of issues that affect MSW management in low and lower-middle income
countries. These include but not limited to: the implications of rapid urbanisation,
population growth and increasing poverty in the midst of economic growth (Ezeah 2010;
Daskalopolous 1998a); increasing waste generation rates, lack of workforce and
transport capacity for waste collection and disposal (leading to inefficient collection of
waste) and lack of land in urban centres (Guerrero et al 2013; Sarkhel and Banerjee
2010); family size, education level, household income levels, attitude to waste separation,
availability of active support, fee for collection service that is based on waste volume (as

5
against a flat rate for all service users), gender, peer influence and household location
(Scheinberg 2011; Ekere et al 2009; Sujauddin et al 2008; Zhuang et al 2008).
Hazra and Goel 2009, Minghua et al 2009, Moghadam et al 2009 and Burntley 2007,
identified lack of finance, poor organisational capabilities, and complexity and system
multidimensionality which includes poor route planning, improper bin collection
systems, poor or dilapidated infrastructures, poor roads, etc. as some of the challenges
facing regulatory authorities responsible for MSW management. The key stakeholders in
MSW management include national and local governments, municipal authorities, city
corporations, Non-Governmental Organisation (NGOs), households, private contractors,
ministries of health, environment, finance and economy, and recycling companies
(including informal recyclers and waste pickers) (Tai et al 2011; Geng et al 2009; Shekdar
2009; Sujauddin et al 2008).
Sharholy et al 2008 suggested organising the informal sector and promoting micro-
enterprises as an effective way of improving the affordability of waste collection services
while the restructuring of the waste management sector and source separation of waste
have been recommended as part of the solution to the MSW management problems in
Aba, Abia State, Nigeria (Ezechi et al 2017). It is important to mention that most of these
studies adopted a purely quantitative approach while Ezeah 2010 and Longe et al 2009
utilised a mixed method.
1.3 Justification
Based on the quantity of work undertaken on MSW management, one would expect a
marked improvement on the state of MSW management in developing (low and lower-
middles income) countries. However, the situation on the ground is different as
developing effective and efficient MSW management systems in developing countries has
proved elusive, and hence my interest in the topic.
According to Agwu 2012, a joint World Health Organisation (WHO) and United Nations
International Children Emergency Fund (UNICEF) report estimated that about 2.4 billion
people faced a risk of needless disease and death occasioned by poor sanitation by 2015.
The report also intimated that the spread of diseases such as cholera and diarrhoea,
which is fuelled by poor sanitation including decaying or non-existent sewage systems
and toilets, kills a child every 21 seconds, the worst hit being residents of fast growing
6
cities in Africa and Asia. Note that while sanitation may often be used in relation to the
safe management of liquid waste (including human excreta) and provision of clean water,
the broad definition of sanitation by the WHO include the safe management of solid and
animal wastes (“WHO”, n.d.).
The reason for the poor state of MSW management in cities in developing countries is
arguably linked to the fact that city-specific data on waste generation and composition is
largely unavailable or unreliable (Jha et al 2011; UN-HABITAT 2010a). There are no quick
fixes as it is now widely recognised that it is counterproductive for developing countries
to use strategies and policies developed for high-income economies (Coffey and Coad
2010; Konteh 2009; Wilson 2007). The traditional consultative methods where the
‘experts’ are required to prescribe solutions before public involvement have also been
shown to be grossly ineffective (Henry et al 2006).
Regulatory authorities must therefore embrace public participation, transparency in
decision making, networking, collaboration and co-operation with all stakeholders,
effective communication and accessibility of information as key elements of successful
MSW management systems (Marshall and Farahbakhsh 2013; Zarate et al 2008).
1.4 Analytical Framework
With these in mind and in accordance with principle 10 of the Rio Declaration (UNCED
1992), which states in part that “environmental issues are best handled with the
participation of all concerned citizens, at the relevant level” this study was specifically
designed to ensure the participation of all identified stakeholder groups in Aba-urban.
The first of its kind, the study aimed to understand the real issues and challenges of MSW
management in the city, taking into consideration, the different but valid perspectives
and contexts from the various stakeholders.
Consequently, and considering that MSW management systems are complex adaptive
eco-social systems affected by a huge number of factors, and with far reaching
implications on several groups of individuals (stakeholders) (UNEP 2015; UN HABITAT
2010a; Aye and Widjaya 2006; Cheng et al 2012), a post normal science approach was
adopted and the adaptive methodology for ecosystem sustainability and health was used
to capture and show the different valid perspectives and contexts of waste management
in Aba. Data collection was through guided unstructured interviews and researcher

7
observations. The Integrated Sustainable Waste Management (ISWM) framework and the
framework indicators developed by the UN-HABITAT (Wilson et al 2015; Wilson et al
2013a) were used as the guiding analytical framework (details in sections 2.3 and 2.6).
1.5 Research Aims and Objectives
To achieve the set research goals, the following research questions were developed:
i. What are the current realities and challenges of waste management in Aba?
ii. What approaches can be used to remedy the situation and to what extent?
To help answer these questions, the following aims and objectives were devised, along
with the specific activities
1: To analyse the current realities and challenges of waste collection, disposal and
treatment in Aba
a. To observe and assess the methods of waste disposal and treatment
b. To determine the main drivers of waste management in Aba
2: To evaluate the history and contexts of waste management from the perspectives
of the different stakeholders in the city
a. To evaluate the stakeholders’ perspectives of waste management
b. To determine and analyse the needs, activities and concerns of all stakeholders’ as
it relates to MSW management in the city
3: To identify potential areas of conflict between stakeholders
a. To analyse the relationship between stakeholders in terms of decision-making
powers
b. To assess the level of participation and involvement of the different stakeholders
c. To assess the existing framework of policies and institutions
4: To articulate a vision and action plan towards an integrated sustainable waste
management system
a. To analyse the findings from objectives 1-3 using the ISWM analytical framework
b. To draw up an action plan aimed at achieving integrated sustainable waste
management in Aba.
1.6 Outline of Thesis
In this chapter, the researcher accomplished the following:

8
Present an overview of the problem and challenges of MSW management in low
and lower-middle income (developing) countries
Provide a background information and the statement of the problem of MSW
management in Aba, Abia State Nigeria
Systematically outline his interest on the subject matter, and:
Explain the goals of his research and how he attempted to achieve them
The remaining chapters have been organised as follows:
Chapter 2 will put this study in the context of available relevant literature
Chapter 3 will provide details of the methodology and methods used.
Chapter 4 will present the evaluation of the history and contexts of MSW management in
Aba. It will address the second aims and objective of this study. the data collected and the
result of the analyses carried out. This will be divided into 2 sections – history and
contexts of MSW management; and the current realities and challenges of MSW
management in Aba.
Chapter 5 will address the first aims and objective and will present the analyses of the
current realities and challenges of waste collection, disposal and treatment.
Chapter 6 will focus on the ISWM governance and thus humans, institutions and policies
involved. Any potential areas of conflict identified will be presented here.
Chapter 7 will present a summary of suggestions by participants towards a better MSW
management system. Some of the suggestions are used by the researcher to articulate a
vision and action plan aimed at helping the city towards a sustainable MSW management
system. The vision and action plan is presented in Annex 1.
Chapter 8 will present the aggregation and discussion of the key results of the research.
Chapter 9 will present the conclusions drawn from the key results, highlight the
challenges encountered during the research and present the recommendations for future
research works.

9
CHAPTER TWO
Literature Review
2.1 Introduction
This chapter begins by outlining the definition and characteristics of solid waste,
municipal solid waste (MSW) and the management of MSW used in this study. It
continues by presenting a historical and contextual review of drivers of MSW
management followed by a highlight of the key features of the integrated sustainable
waste management (ISWM) including the stakeholders, elements and aspects; and how
they are linked to the three key drivers. The chapter concludes by presenting the state of
MSW management in the European Economic Area (EEA) and contrasts it with that in
other developing countries in Africa including Nigeria. The review follows a traditional
review system and is structured around the aims and objectives of this research.
Particular references are made to the ISWM framework and the works of the UN-
HABITAT on waste management in World’s Cities, Wilson, D.C, van de Klundert and
WASTE (the NGO), similar studies that emphasise an integrated local approach akin to
this study and other studies that relate MSW management to development, especially
governance and civic engagement.
2.2 Waste and Solid Waste
There are various definitions of what constitutes waste. However, most definitions agree
on the essential ingredients of the definition to include origin or source of the material,
characteristics, potential to cause harm to the environment and a negative or zero value
to the owner or producer (Ezeah 2010). Igoni et al (2007) defined waste as any material
which has no value to the producer which has been designated for disposal while the US
EPA (2012) described materials as solid waste if they are abandoned by being:
a. “Disposed of; or
b. Burned or incinerated; or
c. Accumulated, stored, or treated (but not recycled) before or in lieu of being
abandoned by being disposed of, burned, or incinerated”.
From the definition, materials that are to be recycled, those used in a manner constituting
disposal including being placed on a land and those burned for energy recovery (except

10
commercial products manufactured specifically for such purposes) also constitute solid
waste.
2.2.1 Definition of Municipal Solid Waste (MSW)
Definitions of MSW vary between countries (UN-HABITAT 2010a) but a common
definition is household waste and any other waste collected by an instituted waste
collection authority or its agents, including waste from parks, beaches, commercial
establishments, offices, industries and fly tipping (Ezeah 2010; Read 1999). In the EU
Landfill Directive (1999), MSW is defined as: waste from households, as well as other
waste which, because of its nature or composition, is similar to waste from households.
Cointreau (1982) and Igoni et al (2007) defined MSW as all non-air and sewage emissions
created and collected by private as well as public authorities within any municipality
from domestic, commercial and industrial (non-hazardous) sources. This definition is
similar to the working definition for this study which is adopted from the UN-HABITAT
(2010a) definition of MSW – “wastes generated by households, and wastes of a similar
nature generated by commercial and industrial premises, by institutions such as schools,
hospitals, care homes and prisons, and from public spaces such as streets, markets,
slaughter houses, public toilets, bus stops, parks, and gardens”. Thus, MSW may comprise
of biodegradable components including food and garden waste; paper, wood, textiles, and
non-degradable fractions such as glass, plastics, tyres and bottles (Ezeah 2010). This
definition includes all commercial and business wastes as MSW except wastes from
industrial processes and hazardous wastes. Industrial processes may include
agricultural, manufacturing, mining, etc. Hazardous wastes are wastes that require strict
controls from the point of production to its movement, management, and recovery or
disposal as mismanagement can cause greater harm to the environment and human
health than non-hazardous waste (DEFRA 2014a).
2.2.2 MSW Management
As urban populations continue to increase and consumption patterns change, MSW
management increasingly becomes an issue of global concern. So too are the health and
environmental concerns connected with MSW management (Breza-Boruta 2016; Dolar
et al 2016; Talalaj and Biedka 2015; Souza et al 2014; Marshall and Farahbakhsh 2013;
Marchand et al 2012). The management of MSW is one of the most important functions
of the municipal authority or a city government. It is a key utility service upon which the
11
public health and the external image of the city depend (Wilson et al 2015). Therefore,
collection of waste is regarded as a public good (service), deemed so important that the
law requires it is provided to the benefit of the whole society irrespective of whether or
not there is interest of the market to supply it or the users’ ability or willingness to pay
for it (Wilson et al 2013a; Batagarawa 2011; Cointreau-Levine and Program 1994). This
perhaps explains why some local authorities and municipalities spend as much as 20%
of their entire budget on MSW management (Wilson et al 2012; Wilson et al 2001). In
2012, about 246 million tons of MSW was produced in Europe, an equivalent of 487kg of
MSW per person per annum (Berg et al 2018). Caicedo-Concha et al (2016) estimated the
average daily global rate of MSW production of 1.2 kg per capita while the World Bank
estimates that by 2025, the volume of waste generated globally per annum will rise to 2.2
billion tonnes with an associated estimated cost of collection of $375.5 billion (The World
Bank 2012). This information suggests that if not checked, increases in urban population
will usually result in increases in quantities of waste generated, with an attendant waste
management costs; and if the waste is not adequately managed, it could result in sever
public health implications (Breza-Boruta 2016; Marchand et al 2012). Providing
solutions to these MSW management challenges present burning issues which are being
debated among scientists and policymakers (Chalhoub 2018; Guerrero et al 2013).
Achieving sustainable management of MSW could ensure environmental sustainability as
well as contribute to social inclusion and reduction in poverty, especially in developing
countries (Ferronato et al 2019; Lino and Ismail 2012). It is therefore of little surprise
that in the United Nations SDGs, sustainable MSW management in developing countries
is recognised as an avenue to the spread of global sustainable growth (Ferronato et al
2019; Rodic and Wilson 2017).
The current phase of modernisation in solid waste management began in the 1960s and
saw the developed countries begin in a series of steps (Wilson 2007). Open dumps were
phased out or upgraded to ‘controlled disposals’ and gradually, the standards of leachates
and gas control increased (Rushbrook and Pugh 1999). Gradually, these developed
countries have recorded significant improvements through key advancements in
technology, improved legislation and regulatory systems in waste management and the
adoption of a more sophisticated health surveillance mechanism (Giusti 2009). These
successes also involved the use of some kinds of system analyses including engineering

12
models, analysis platforms and assessment tools targeted mainly at strictly defined
engineered systems by MSW management agencies both as a tool for supporting decision
making in planning processes and for monitoring and optimising existing MSW
management systems (Marshall and Farahbakhsh 2013, Chang et al 2011). However,
while there is the explicit recognition and adoption of a systems approach – an
appreciation of the different elements of MSW management, their interconnectedness
and functions; to MSW management by developed countries, there is a lack of literature
on the adoption and application of similar approaches and complex, adaptive system
thinking to MSW management in developing countries (Seadon 2010). While this is not
by any means, a ‘cure all solution’, according to Waltner-Toews et al 2008, publicly
engaged systems thinking can help provide an understanding and create possible ways
for coping with complexity. In other words, while developed countries have improved
their MSW management systems through the adoption and implementation of
advancements in technology, engineering, health surveillance, and legislation, the same
cannot be said of their developing counterparts. However, while encouraging public
participation may not solve all the problems, Chambers (1983), Richards (1985), and
Long (2004) argue that the practical everyday knowledge of ordinary people can enrich
‘science’ and improve development practice.
Public health has often been linked with MSW management, especially the coverage and
quality of waste collection services (Wilson et al 2012; Marchand et al 2012; Wilson
2007). Other epidemiological studies identified the existence of an association between
human illnesses and proximity to a waste disposal site, or length of residence near such
a site (WHO 2015; Giusti 2009).Uncollected solid waste still present serious public health
issues in many developing countries. Direct effects include poor child health e.g.
diarrhoea caused by deficient hygiene and poor sanitation while indirect effects include
blocked drainages with the attendant spread of water borne diseases and flooding
(Wilson et al 2013a; Bartram and Cairncross 2010). Besides the public health benefits, a
clean city is also attractive to tourists, entrepreneurs and investors. Thus, as well as being
a key utility service upon which not only the public but also the financial health of a city
depends, the quality of MSW management is a proxy indicator of good governance
(Whiteman et al 2001). However, it is now widely recognised that it is counterproductive
for developing countries to simply copy and implement strategies developed for their

13
high income developed counterparts. Schubeler 1996, Henry et al 2006, Konteh 2009,
Coffey and Coad 2010 and UN-HABITAT 2010a all advocate for a locally sensitive,
creative and critical approach that is ‘owned’ by the community. They emphasise the
importance of the collaboration of a host of legitimate peers to enable the stakeholders
to frame their particular context which will help ensure the next appropriate step in MSW
management is taken. This context specificity, they said, is critical for the future of MSW
management. At the United Nations international consultative meeting on expanding
waste management services in developing countries held in Tokyo, Japan, in 2010, it was
agreed that the waste management challenge has changed from the older perspective of
“ensuring minimum damage to public health and environment in the process of handling
waste” to “the manner in which discarded resources will be handled such that future
generations are not deprived of some or all of its value” (Batagarawa 2011; Chandak
2010). As much as this statement is true, Wilson 2007 sounds a note of caution when he
said “If there is one key lesson that I have learned from 30 years in waste management, it
is that there are no ‘quick fixes’” (Wilson 2007, p205). He reiterates that all developed
countries have evolved their current systems in a series of steps and points out that it is
therefore very unrealistic for developing countries to expect to move from uncontrolled
dumping of waste to a ‘modern’ system of waste management in one great leap.
While this may not be an express indictment of the waste hierarchy which prescribes the
management option with the least perceived adverse environmental impact, it suggests
a progression towards sustainable development where the objectives of waste
management systems should reflect the stage at which each community, society or
country is at on its journey to development and to a sustainable waste management
system (Chalhoub 2018). It also reemphasises the need to adopt a local approach to
finding appropriate solutions by ensuring that local conditions and limitations are duly
considered in any proposed MSW management options (Hettiarachchi et al 2018). The
small and relatively remote city of Ghorahi in Nepal is a good example of what can be
achieved with limited local resources if all stakeholders are engaged. Their well sited and
managed waste facility incorporates waste sorting, recycling, sanitary landfill with
leachate collection and treatment, a buffer zone with forests, gardens and a bee farm to
shield the site from surrounding areas (UN-HABITAT 2010a). This is in complete
consonance with Principle 1 of the Rio Declaration which states that “human beings are

14
at the centre of concerns for sustainable development. They are entitled to a healthy and
productive life in harmony with nature” (UNCED 1992). The Ghorahi approach is
arguably a valid example of doing development differently through a political economy
approach (Booth et al 2016) as against the modernisation approach often pursued by
developing countries (Wilson et al 2007; Long 2004).
Clearly, achieving sustainable MSW management involves the evaluation and careful
management of several factors including but not limited to socio-economic, technological,
political, institutional and financial (Chalhooub 2018; Wilson et al 2012; Aye and Widjaya
2006; Cheng et al 2002). Added to the mix is the uncertainty and multiplicity of variables
related to different steps and phases of the MSW management system (Berg et al 2018;
Wilson et al 2015; De Feo and De Gisi 2010; Funtowicz and Ravetz 1990). Managing all of
these factors and variables alongside the actors (stakeholders) involved in MSW
management surely requires skills that cut across different spheres of development
science including urbanization and urban governance, politics and public policy, and civic
engagement (Ferronato et al 2019; Chalhoub 2018; Rodic and Wilson 2017; Nzeadibe and
Ajaero 2010; Funtowicz and Ravetz 1993).
The ISWM framework discussed in section 2.4 is an approach to MSW management that
satisfies the aforementioned demands and requirements for achieving sustainability in
MSW management.
2.3 Drivers of MSW management
By definition, drivers of MSW management simply mean “mechanisms or factors that
significantly impact development in solid waste management”. A good understanding of
these drivers – past and present, is perhaps the key to understanding how to move
forward in developing sustainable waste management systems around the globe (Wilson
2007).
2.3.1 Historical review – drivers of waste management over the last millennium
Drawn mainly from Wilson (2007), Table 2.1 below aims to provide a chronological
sequence of development of the drivers of MSW management in the last millennium with
particular focus on the UK.
Table 2. 1: A chronology of development of MSW management drivers in the UK

15
1000 -
1800
Attempts to clean up city streets which were commonly covered with foul
smelling mud (soil, household waste, animal and human excrement and
stagnant water)
‘Rakers’ employed/bought rights to provide MSW services (Girling 2005)
The rich refused to pay to clean up for the poor
Scarcity of materials was the main driver and a source of income (Woodward
1985)
1800
–
1850
Resource value of waste played an even more predominant role
With the industrial revolution, MSW became a very important raw material
Dust-yard system contracts and franchises (Velis 2004)
1850 -
1900
Overlap of the decline of dust trade and rise of public health and sanitation
movement
Erroneous ‘miasma’ theory which linked infectious diseases to poor sanitary
conditions
Public health Act of 1875 required households to place their waste in a
‘moveable receptacle’ and mandated local authorities to empty the
receptacles at least once a week
Better public health linked to improved national prosperity
1900 -
1970
Public health legislation continued to be main driver with emphasis on waste
collection
Disposal was predominantly uncontrolled
During and after the two world wars, resource value of materials drove
recycling
With technological developments, energy from waste became common in
Britain and Europe (Girling 2005)
The 1960s and 70s heralded the arrival of waste disposal on the political agenda in the
developed world with the emergence of environmental protection as a legitimate driver
(Wilson 2007). Figure 2.1 below is a schematic simplification of the four overlapping
phases in the development of waste management policy in Europe since 1970.

16
Figure 2. 1: Phases in the development of modern waste management policy (based on Wilson 1999)
Figure 2.1 above shows the gradual advancements in MSW management in the developed
world from the phasing out of open dumping (which constituted the control phase) to the
retrofitting of incinerators with electrostatic precipitators for dust control (technical fix
phase); and to the focus on the use of best available technique (which constituted the
integrated phase). In a continuum, the current phase is ‘closing the loop’ – a system of
decoupling waste growth from economic growth, with emphasis on sustainable
production and consumption (Wilson 2007).
2.3.2 Historical Review – Drivers of the drivers
The Public Health Act of 1848 and eventually the 1875 Public Health Act were driven by
public health concerns and the sanitation movement. However, the very organised and
effective dust-yard system which peaked in the 1820s, before the advent of relevant
legislation, was not driven by public health concerns but by the resource value of
household waste (Velis et al 2009). Early extensive and organised reuse and recycling of
waste materials reportedly occurred for many centuries (Cooper 2006; Strasser 2000;
Woodward 1985). Melosi 1981, Tarr 1996, Melosi 2000, Miller 2000, Louis 2004 all
contain reports of the systematic attention that early waste and resource management
received in the United States. Resource efficiency is thus not a new phenomenon even

17
though it retains a contemporary relevance in 21st century MSW management (Velis
2009; Wilson 2007).
The population of London grew rapidly from 1.1million in 1801 to 1.6million in 1821,
and 2.7million in 1851 (Ball and Sunderland 2001). This population increase drove the
increased demand for bricks and with the exhaustion of the local raw materials for brick
making in the early 19th century, coal ashes and soil became attractive substitutes
(Allinson 2003). Recall that household waste was high in coal ash as heating and cooking
was predominantly done with coal (Wilson 2007). In 1814 and 1815, soil was shipped to
Moscow for the rebuilding of the city after the fire of 1812 (Webb and Webb 1922). This
international trade helped sustain the high price and drive the continued demand such
that regular supply of soil was needed from northern cities such as Newcastle, to meet
local demand in London (Velis 2009).
The fine coal ash from household waste was also just as important in agriculture, as
fertiliser and soil improver (Webb and Webb 1922). While this may be partly attributable
to the rising urban population who needed to be fed, the Corn Laws of 1815 which taxed
imported grains and ensured a rise in the prices of home-grown cereals (Vamplew 1980)
helped drive this demand. With the repeal of the Corn Laws in 1846 and changes in land
use from cultivated to pasture land, the demand for fine coal ash in agriculture slowed
(Brawley 2006; Mayhew 1862) though other recycled materials with higher manure
content such as bones and animal-origin rags were still used as fertilisers and soil
improvers (Velis 2009; Gordon 1890).
From the narrative above, the importance of the value of waste materials was clearly
highlighted along with other drivers such as regulations, population, demand, supply,
international trade, etc. All of these and many more could together be loosely described
as economic drivers. However, the classification of drivers of MSW management overlaps,
and is never straight forward (Contreras et al 2010).
Likewise, public health concerns, public awareness, legislation and developments in
technology could be described as the main early social drivers. As early as 2000 BC,
concerns for public health, aesthetics and religion laid the foundation for early solid
waste management systems in ancient cities (Melosi 1981). By 500 BC, the Greeks had
the first organised municipal dump in the western world and had issued the first known

18
edict prohibiting throwing of garbage on the streets (Louis 2004) while the Chinese had
‘disposal police’ charged with enforcing disposal laws by 200 BC (Marshall and
Farahbakhsh 2013). Similar to the plague or Black Death in 14th century Europe, the
recurrence of deadly epidemic diseases and the ineffectiveness of early medical
interventions gave rise to evolving debates about the aetiology of the diseases and
increasing public concern about the quality of the living environment in the US (Louis
2004; Tchobanoglous et al 1978). Following the American industrial revolution, the
environmental conditions worsened as the urban population and number of cities
burgeoned. The yellow fever outbreak in Philadelphia in 1793 which claimed about 5600
lives (Pernick 1978) and the cholera epidemics in New York in 1832 and 1849 which
claimed about 150,000 lives caused massive public hysteria and created the impetus for
the organisation of developed systems for administering public health and urban
sanitation in the US (Louis 2004; Neira 1997). Like in Europe, the prevailing belief was
that filth, pollution and abject living conditions of the urban poor were primary causes of
diseases (Wilson 2007; Louis 2004). One of the main advocates of this now erroneous
anti-contagionism or miasmas theory was Sir Edwin Chadwick, whose work, though in
London, influenced many including in the US. The enactment of the British Public Health
Act and the establishment of State Boards of Health in the US with broad jurisdiction over
public health and sanitation were all influenced by the work of Sir Edwin Chadwick (Louis
2004; Pizzi 2002; Melosi 2000; Duffy 1990). After the construction of systems for water
supply and sewage management, priority shifted to solid waste management and the
earlier systems simply involved the removal of the solid waste away from human senses
either by dumping, burial, application on landfills, farm use (as animal feed) or dumping
in water (Melosi 1981, Louis 2004). As more people subscribed to the miasmas theory,
public awareness of the implications of unhygienic solid waste management grew and
more public money was invested in city-wide refuse management systems such as
incineration though landfilling of waste was still the most common method of disposal
(Wilson 2007; Louis 2004; Melosi 1981). However, prior to the 2000s, even in developed
country contexts, MSW management models focused primarily on economics and
environmental issues (Morrissey and Browne 2004).
Historically, the urban poor were more concerned with feeding themselves, and the rich
objected to paying to clean up for the poor (Wilson 2007). While this statement perhaps

19
provides an indication as to why social factors were not quite at the forefront of driving
early developments in MSW management, one factor that quickly gained prominence and
has remained relevant is environmental protection. Following the 2nd world war, rapid
growth in consumption from the 1960s resulted in increasing waste streams with high
plastic content (Wolsink 2010). Recall that landfilling was still the predominant method
of disposal of waste (Wilson 2007). The environmental movements of the 1960s – 1970s
ensured that waste disposal became a fixture on the political agenda in developed
countries and forced a shift in policy making in MSW management (Marshall and
Farahbakhsh 2013; Wolsink 2010; Wilson 2007). Beginning with addressing water
pollution and eliminating uncontrolled disposal of waste, the focus of the new legislations
driven by the environmental movements moved to raising environmental standards to
reduce the contamination of land, air and water (Marshall and Farahbakhsh 2013; UN-
HABITAT 2010a; Wilson 2007). Focus on increasing environmental standards continued
through the 1980s, and is still ongoing, tackling issues such as landfill gas and leachate
control, incinerator gas and dioxin control, and odour control for composting and
anaerobic digestion facilities (Marshall and Farahbakhsh 2013). The integrated policy
and integrative regulatory approaches encompassing technical, environmental, social,
political, economic, financial and institutional elements gained increasing attention from
the 1990s when it became evident that in order to realise the environmental protection
aims of MSW management, focus on environmental standards alone were not enough
(Marshall and Farahbakhsh 2013; Wilson 2007; McDougall et al 2001; van de Klundert
and Anschutz 1999).
2.3.3 Contextual Review – current perspectives in developed countries
(a) Public Health
In most of Europe, public health is no longer the main driver and is taken for granted
though it’s been used in the UK to argue against the introduction of fortnightly collections
(Wilson 2007). This is because waste collection which is linked to public health is now
somewhat inherent in MSW management systems in Europe. However, while the
quantity of waste landfilled in many EU countries continues to decrease as a result of
changes in MSW treatment strategies (Berg et al 2018, Brennan et al 2016), figures for
2012 showed that 34% of the total waste generated in the 28 EU countries were sent to
landfills (Brennan et al 2016). The effects of landfill sites on the public health of those

20
who live in close proximity to such sites (Berg et al 2018; WHO 2015; Marchand et al
2012; Giusti 2009) have been highlighted previously in section 2.2.2. Therefore, while
countries of small land areas and high population densities such as Japan may find
landfilling an unsustainable method of MSW management, other countries with low
population densities, sparsely inhabited land and large areas of unused desert may find
landfilling a very viable MSW management option (Chalhoub 2018; Huang et al 2017;
Zhao et al 2016; Benson 2007).
(b) Environmental Protection
Environmental protection was the main driver behind the phasing out of uncontrolled
disposal of waste. The compaction and daily covering of landfills and the retrofitting of
waste incinerators with electrostatic precipitators for dust control during the control
phase of the 1970s were driven by environmental control (Brennan et al 2016; Wilson
2007). This was then followed by emphasis on gradually increasing technical standards
beginning with leachate and gas control from landfills, reduction in dioxin and other trace
gas levels from incineration plants and then to things like odour control for anaerobic
digestion and in-vessel composting plants.
(c) Resource drivers
Unlike in the 1800s, when resources were scarce and the value of recovered materials
from waste was a major driver, the emphasis this time is driven by statutory targets, the
notion that it is the ‘right thing’ to do rather than the value of the recovered material
covering the costs of doing so (Wilson 2007). This concept has been mainly driven by the
EU Waste Hierarchy (discussed further in section 2.3.5.5), which was first introduced in
the EU’s 2nd Environment Action Programme (EAP) in 1977 (CEC 1977). It recommends
a move away from disposal to the more sustainable options of reduction, reuse, recycling
and energy recovery (Berg et al 2018; Brennan et al 2016).
The current concept of resource management is driven by ‘closing the loop’ – a pattern of
sustainable consumption and production; a focus on decoupling waste growth from
economic growth; an integrated product policy, and a shift upstream to product design
(Chalhoub 2018; Wilson 2007).
(d) Institutional and Responsibility issues
In most countries, the responsibility of managing MSW rest with the public sector
(Batagarawa 2011). For example, it is managed by the ministry of environment in
21
Singapore (Bai and Sutanto 2002); by the municipal authority in Mumbai, India (Rathi
2006); and by the local authorities in Kenya (Henry et al. 2006). In England and Wales, it
is the responsibility of the city and county councils in conjunction with the Department
for environment, food and rural affairs (DEFRA) while the Environmental Protection
Agency (EPA) is responsible in the USA (Leeds 2010).
However, even though the private sector has become much more involved in the
provision of waste management services, it has not affected the responsibility of
municipalities in this regard. However, due to a change in emphasis from waste collection
to a more sophisticated and sound environmental management service delivery, there
has been a growth in inter-municipal co-operation in order to achieve economies of scale
(Wilson 2007).
As can be seen in Figure 2.1 (pp.15), the 1990s saw the shift to the integrated policy
approach which required looking at the political, social, institutional, economic and
financial aspects together with the technical and environmental rather than the one
dimensional regulatory approach of the technical fix which focused on increasing
environmental standards (Wilson 2007).
(e) Public awareness
Public awareness and education can be regarded as a driver in its own right, and an
important one too. Considering that negative public perceptions of poor practices in the
past such as burning and polluting incinerators have inevitably led to a Not-In-My-Back-
Yard (NIMBY) reaction to proposals for new waste management facilities irrespective of
how clean or sustainable they may be, it is good to know that environmental issues such
as climate change, resource and waste management are now being accorded a place on
the political agenda of many countries (Wilson 2007). This is particularly important and
has become an active area of applied research and rightly so because the move towards
a better resource management including repair and reuse, more recycling, home
composting, etc. all require behavioural change (Sharp 2006). Some regard public
awareness as the most desirable driving factor in that it implies an increased concern on
peoples’ standards of living and consumption (Diaz and Otoma 2013).

22
(f) Climate Change
Climate change is topical and a more recent environmental driver emphasising a move
away from the landfilling of biodegradable waste which is a major source of methane
emissions and a renewed focus on the recovery of energy from waste (Marshall and
Farahbakhsh 2013; UN-HABITAT 2010a). Rising global concern over climate change led
to worldwide pressure and advocacy which in-turn led to a shift in MSW management
policy focus to waste prevention and target achievement measures such as extended
producer responsibility, diversion from landfill, compost and recycling goals, ban on the
landfilling of recyclables, etc. (UN-HABITAT 2010a; Wilson 2007).
(g) Plastics Pollution
Since it was first observed and documented in the early 1970s, plastics pollution on the
surface of the ocean has increasingly become an issue of great concern (Hajbane and
Pattiaratchi 2017; Andrady 2011; Carpenter and Smith 1972). Previous studies cite land-
based sources, particularly urban areas as the major source of all marine plastics
pollution (Vegteretal 2014; Jambeck et al 2015). The main threats posed to marine life by
these pelagic plastics include entanglement, ingestion and the introduction of invasive
rafting communities living on the surface of the plastics (Hajbane and Pattiaratchi 2017;
Andrady 2011; Gregory 2009). Also, hydrophobic fragments of plastics leach
contaminants and attract additional lipid soluble pollutants e.g. persistent organic
pollutants (POPs), aqueous metals and endocrine disrupting chemicals (Rochman, 2015;
Rochman et al 2014; Cole et al 2011; Derraik, 2002) which can bio-magnify upwards
through the marine food chain when ingested by biota, and thus pose great danger to
human health through our collective dependence on marine foods (Hajbane and
Pattiaratchi 2017; Seltenrich 2015; Erren et al 2015).
2.3.4 Current Perspectives in developing countries
The ISWM framework identifies three key drivers for MSW management. Similar to the
three pillars of sustainability – social, environmental and economic; these three key
drivers are necessary for any MSW management system to be sustainable. The three key
drivers are:
i. Public health – achieved through a good and effective waste collection service
(social)

23
ii. Environmental protection – especially during waste treatment and disposal
(environment)
iii. Resource management – ‘closing the loop’ by returning both materials and
nutrients to beneficial use (economic)
2.3.4.1 Public Health
Efficient collection and safe disposal of waste are essential to public health (Cointreau-
Levine and Program 1994). Alongside the management of human excreta, they constitute
the most vital urban environmental services (Wilson et al 2013b). Of concern to these
vital services is public health. For instance, cholera epidemics in the nineteenth century
led to the development of fairly comprehensive municipal solid waste management
services in major cities in Europe and United States of America (USA) (Wilson 2007; Tarr
1984). However, uncollected municipal solid waste is still a huge public health concern
in developing countries. In 1994, uncollected waste reportedly caused a major flood in
Surat, India resulting in an outbreak of a plague-like disease that killed 56 people and
affected over 1000 others. The outbreak was partly attributed to rats breeding on
uncollected refuse that was blocking the drainages and waterways (Gupta 2010). The
health data from a UN-HABITAT report also showed that children who live in households
where solid waste is dumped or burned within the vicinity, reported a significantly higher
rate of diarrhoea and acute respiratory infections compared to children who live in the
same city but in areas where regular waste collection services are provided (Wilson
2007).
Waste collection is therefore a public good (service) - required by law, due to its
importance, that it be provided for the benefit of the entire society irrespective of
whether or not there is interest in the market to supply it or if the users’ are willing or
able to pay for it (Wilson et al 2013b). The key indicator is thus the collection coverage
or the percentage of the population with access to waste collection services. In tropical
climates, effective collection generally means providing daily collection services and this
may consume 10 – 20% of an already hard-pressed city’s budget (Wilson et al 2001).
While figures from the UN-HABITAT report showed a marked improvement in collection
coverage in the 20 reference cities compared to older studies, it is noteworthy to mention
that these reports do not highlight the huge gaps that still exist between those that have

24
access to collection services and those that have no access at all (Wilson et al 2013b;
Scheinberg et al 2010).
2.3.4.2 Environmental Protection
Before the emergence of the environmental movement in the 1960s, the philosophy of
waste disposal was ‘out of sight, out of mind’. Most waste was disposed of with very little
or no control at all: to land, as open dumping; to air, by burning; or to water, by
discharging solid and liquid wastes to surface, groundwater or ocean (UN HABITAT 2014;
UN-HABITAT 2010a). Over the last 30 – 40 years though, countries and cities seeking to
take control of growing waste quantities in order to maintain a clean environment have
gradually built up experience on what works for them.
Though environmental protection is still relatively low on the public and political agenda
of many developing countries, things are beginning to change for the better (UNEP 2015;
Wilson 2007). The move towards a more modern and sustainable waste disposal system
usually involves a step by step process which begins with phasing out uncontrolled
disposal, then introducing and gradually increasing the environmental standards for a
disposal facility (Chalhoub 2018; UN-HABITAT 2010a; Rushbrook and Pugh 1999). It
must be emphasised that all technologies and equipment used are appropriate and
adapted to the local conditions. There are success stories such as those of the small city
of Ghorahi in Nepal highlighted above, and others such as Moshi (Tanzania) and Bamako
(Mali).
Legislation is important though studies have shown that this is often in place but
enforcement continues to be weak (Tvedten and Candiracci 2018; UN-HABITAT 2014).
In the absence of strong legislation, competition between cities to provide a ‘clean city’
with good municipal environmental infrastructure, often in order to attract (foreign)
investment can be a key driver in this area. This has been the case in India where the
jostling for foreign information technology investment is very strong between cities. Very
related, and a key driver reported for cities in countries such as China, Egypt and Russia
is the prestige of hosting an international sporting event (Guo et al 2005), and the
promotion of tourism, which has been particularly important in the Caribbean (Wilson
2007).
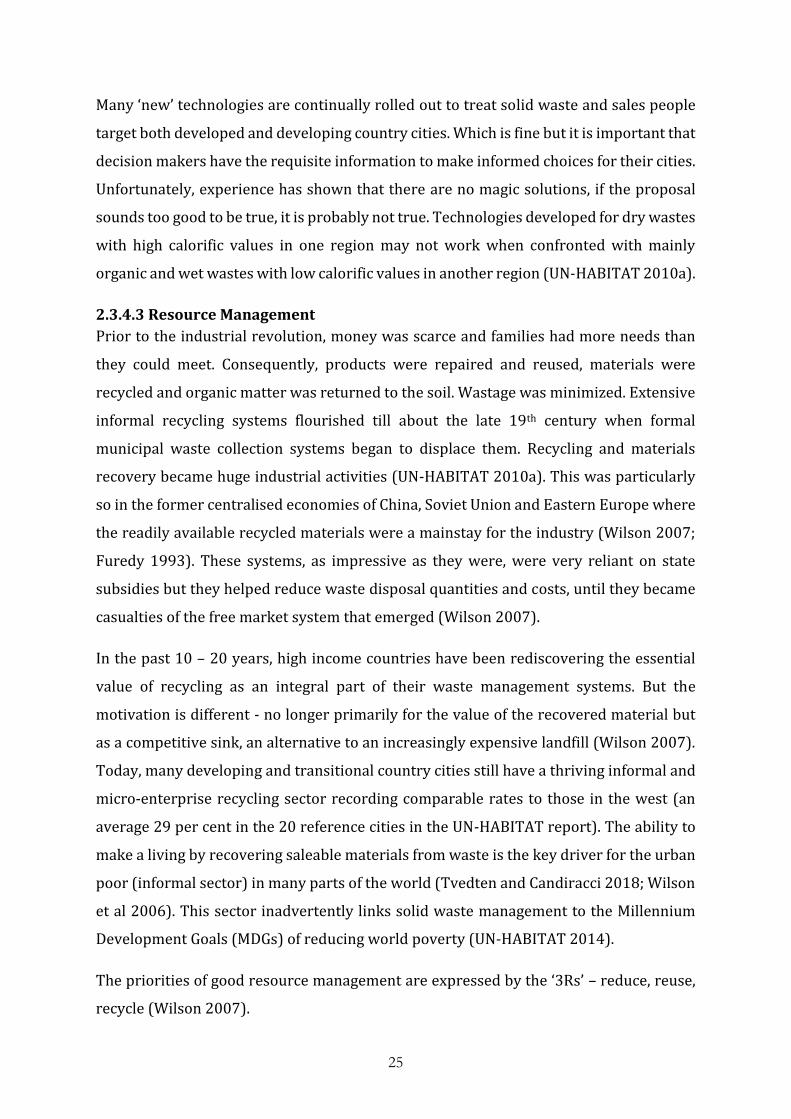
25
Many ‘new’ technologies are continually rolled out to treat solid waste and sales people
target both developed and developing country cities. Which is fine but it is important that
decision makers have the requisite information to make informed choices for their cities.
Unfortunately, experience has shown that there are no magic solutions, if the proposal
sounds too good to be true, it is probably not true. Technologies developed for dry wastes
with high calorific values in one region may not work when confronted with mainly
organic and wet wastes with low calorific values in another region (UN-HABITAT 2010a).
2.3.4.3 Resource Management
Prior to the industrial revolution, money was scarce and families had more needs than
they could meet. Consequently, products were repaired and reused, materials were
recycled and organic matter was returned to the soil. Wastage was minimized. Extensive
informal recycling systems flourished till about the late 19th century when formal
municipal waste collection systems began to displace them. Recycling and materials
recovery became huge industrial activities (UN-HABITAT 2010a). This was particularly
so in the former centralised economies of China, Soviet Union and Eastern Europe where
the readily available recycled materials were a mainstay for the industry (Wilson 2007;
Furedy 1993). These systems, as impressive as they were, were very reliant on state
subsidies but they helped reduce waste disposal quantities and costs, until they became
casualties of the free market system that emerged (Wilson 2007).
In the past 10 – 20 years, high income countries have been rediscovering the essential
value of recycling as an integral part of their waste management systems. But the
motivation is different - no longer primarily for the value of the recovered material but
as a competitive sink, an alternative to an increasingly expensive landfill (Wilson 2007).
Today, many developing and transitional country cities still have a thriving informal and
micro-enterprise recycling sector recording comparable rates to those in the west (an
average 29 per cent in the 20 reference cities in the UN-HABITAT report). The ability to
make a living by recovering saleable materials from waste is the key driver for the urban
poor (informal sector) in many parts of the world (Tvedten and Candiracci 2018; Wilson
et al 2006). This sector inadvertently links solid waste management to the Millennium
Development Goals (MDGs) of reducing world poverty (UN-HABITAT 2014).
The priorities of good resource management are expressed by the ‘3Rs’ – reduce, reuse,
recycle (Wilson 2007).

26
Reduce – the quantities of waste being generated. This is the new focus in high
income cities but it is important for rapidly growing cities in both middle and low income
cities to control their waste growth.
Reuse – products that can be reused, refurbished, repaired, or fabricated to have
longer useful lives
Recycle – where they strengthen local, regional or global production, recycle
materials that can be extracted or recovered and return them to industrial value chains
while nutrients are returned to the soil though composting or digestion of organic waste.
So it is safe to say that while resource management has become the main focus of MSW
management in most developed countries, their counterparts in the developing world are
still battling to contain the challenges of public health arising from poor MSW
management. In other words, it can be argued that MSW management systems in
developed countries are able to successfully operate on policies that are economic
oriented because historically, they have embedded into their MSW management systems,
the structures, institutions and processes necessary to ensure the attainment of basic
social (public health) and environmental standards.
2.3.5 Other drivers
As stated earlier, the classification of the drivers of the development of MSW management
is not straightforward. Other authors have also referred to the following as drivers.
2.3.5.1 Technological Developments
Though this has been mentioned briefly under different drivers, technological
developments have been mentioned by some authors as a relevant driver of MSW
management. Contreras et al 2010 notes that technological developments were an
important driver in shaping the earlier stages of MSW management during
industrialisation. Mechanical sweepers, compactor garbage vehicles, scales to record the
amount of waste collected and disposed and engineering drainage to remove water from
waste disposal sites were a few technological developments that helped drive most US
cities to organised MSW management in the 1930s (Contreras et al 2010, Montville 2001,
Melosi 2000).

27
2.3.5.2 Regional and International drivers
International trading of recycled materials has developed and is fast becoming a major
driver for MSW management. The inflow of recyclable waste into China and other Asian
economies from developed economies are huge and thus have huge implications for the
local recycling and incineration plants (Contreras et al 2010). According to statistics from
the Chinese custom department, 4.1 million tonnes of plastic waste, 12.3 million tonnes
of used paper, and 10.2 million tonnes of aluminium scrap were imported in 2004. These
figures accounted for more than 90% of imports with Asia (34.8%), Europe (15.2%),
North America (34.2%), and neighbouring countries (8.3%) (Terazono et al 2004). A
Japanese Institute of Developing Economies (IDE 2005) report shows that between 1990
and 2003, the amount of paper waste imported by China and Thailand increased from
423 and 214 thousand tonnes to 9382 and 1098 thousand tonnes respectively. Other
similar trades include waste imports from Germany and Norway by Danish cements
industries for combustion of cement kilns (Rasmussen and Reimann 2004).
2.3.5.3 Socio-economic Drivers
Urbanisation, population growth (especially urban population growth), changing
consumption patterns and economic developments are a few of the socio-economic
factors that have been cited as having major implications on MSW management
(Contreras et al 2010; Ezeah 2010; Visvanathan and Trankler 2004; Mendes 2003;
Daskalopolous 1998b). Other socio-economic factors include family size, education level,
household income levels, attitude to waste separation, availability of active support and
fee for collection service that is based on waste volume (as against a flat rate for all service
users), gender, peer influence and household location, to mention but a few (Scheinberg
2011; Ekere et al 2009; Sujauddin et al 2008; Zhuang et al 2008).
The analysis of socio-economic related issues is thus of paramount importance in the
development of MSW management policies (Contreras et al 2010).
2.3.5.4 Good Governance
MSW management is a public good (service) and by law should be provided by the
government whether or not the users can pay for it because the public health and
arguably financial health of the people depend on it (Wilson et al 2013b). If a city is dirty,
it could be that the local administration is ineffective or the residents could be accused of
littering. However, a clean city is attractive to tourists and investors and therefore the

28
quality of waste management services is a good proxy indicator of the quality of
governance (UN-HABITAT 2010a; Whiteman et al 2001).
2.3.5.5 The Waste Hierarchy
The initial idea of the waste hierarchy was borne out of the Dutch’s government shortage
of landfill sites (Wolsink 2010). It was first introduced in the European Union’s Second
Environmental Action Programme in 1977 as a model of waste management priorities
based on the “Ladder of Lansink” – a hierarchy of waste handling techniques going from
prevention to reuse, reduction, recycling, energy recovery, treatment (e.g. incineration),
and landfill (Marshall and Farahbakhsh 2013; Price and Joseph 2000). See Figure 2.2
below.
Figure 2. 2: The EU Waste Hierarchy (based on EEA 2013)
Therefore, as can be seen from Figure 2.2 above, the EU waste management policy
requires that member countries prioritise and promote prevention of waste while
minimising landfilling which is still the predominant disposal method (EEA 2013).
Thus, the waste hierarchy can be described as a priority ordering for waste management
options, based on assumed environmental impacts or benefits of the materials on a

29
‘cradle’ to ‘grave’ basis (Hultman and Corvellec 2012; van de Klundert and Anschutz
2001).
However, some critiques of the waste hierarchy have argued that it does not make room
for the combination of techniques or account for costs or specific constraints (McDougall
et al 2001) while others have reported that the application of the waste hierarchy is
inappropriate in situations where less than 10 Euros is spent per capita per year on MSW
management services (Batagarawa 2011; Brunner and Fellner 2007; Seadon 2006). It is
therefore difficult to implement, much more so because waste managers in industries and
government have little control over production decisions that should encourage the
higher level priorities such as prevention and minimisation (Gertsakis and Lewis 2003).
This is particularly so in under developed and developing countries where most of the
products found in the waste stream are imported, meaning that the local and national
governments in those countries will not have the necessary influence over product
design. What is therefore required is an assessment of the context-specific system as a
whole (Marshall and Farahbakhsh 2013). By leveraging on the ISWM framework,
decision makers in MSW management can design locally adapted systems most suitable
for their situations.
2.4 The Integrated Sustainable Waste Management (ISWM)
Sustainable development came to global reckoning through the Brundtland report titled
‘Our Common Future’ published by the World Commission on Environment and
Development (WCED) in 1987 (WCED 1987). The action plan on sustainable
development agreed in Rio de Janeiro, Brazil in 1992 at the United Nations Conference
on Environment and Development (UNCED) has also been influential in MSW
management (Wilson et al 2013b).
The ISWM concept was first developed by WASTE, a Dutch non-governmental
organisation (NGO) led by van de Klundert and WASTE’s Southern partner organisations
in the mid-1980s before being further developed by the Collaborative Working Group
(CWG) in solid waste management in low and middle-income countries in the mid-1990s
(Wilson et al 2013b; UN-HABITAT 2010a). The first conceptual framework for integrated
MSW management in developing countries which was developed at a workshop
convened in Ittingen, Switzerland in 1995 is shown in Figure 2.3 below (Wilson et al

30
2013b). Each side of the cube shows one of the three dimensions of the ISWM – the Who,
What and How.
Figure 2. 3: First Conceptual Framework of ISWM (Wilson et al 2013b)
The conceptual framework (Figure 2.3 above) was further developed into the ISWM
analytical tool and development framework shown in Figure 2.4 below. Like the
conceptual framework, the ISWM analytical tool and development framework maintains
the three dimensions - the ‘Who’ being the stakeholders; the ‘What’ as the elements; and
the ‘How’ as the aspects (Wilson et al 2013b).
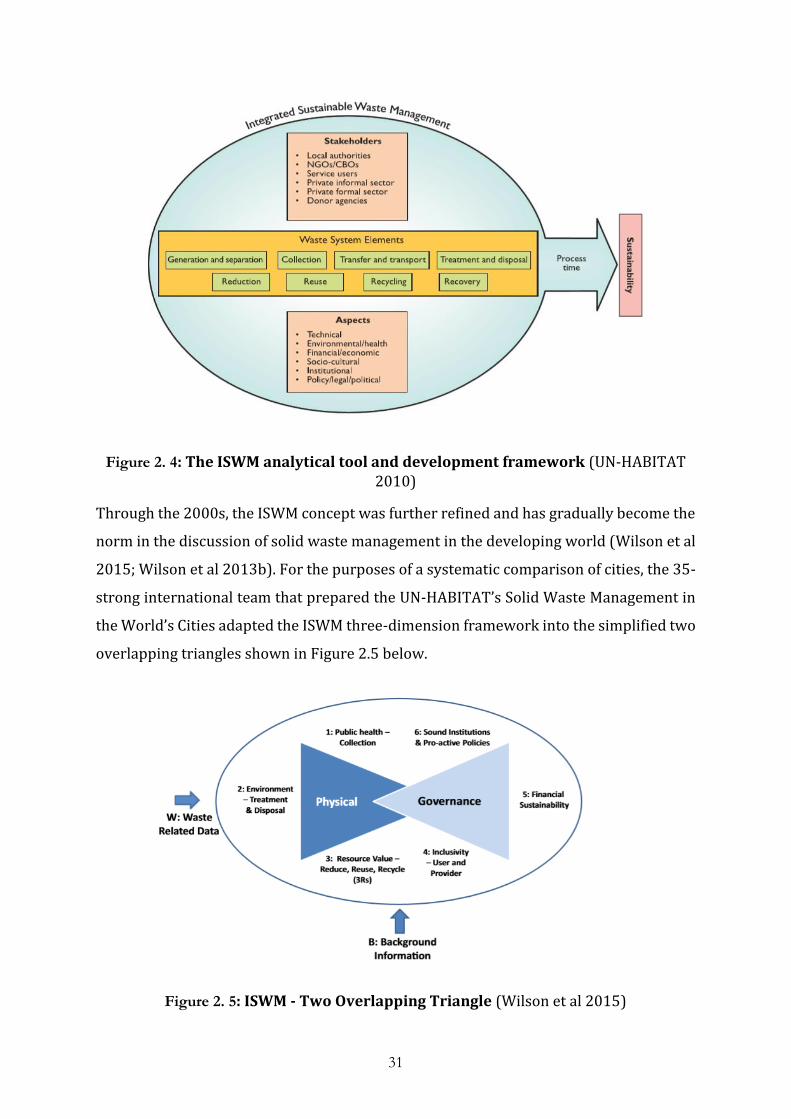
31
Figure 2. 4: The ISWM analytical tool and development framework (UN-HABITAT 2010)
Through the 2000s, the ISWM concept was further refined and has gradually become the
norm in the discussion of solid waste management in the developing world (Wilson et al
2015; Wilson et al 2013b). For the purposes of a systematic comparison of cities, the 35-
strong international team that prepared the UN-HABITAT’s Solid Waste Management in
the World’s Cities adapted the ISWM three-dimension framework into the simplified two
overlapping triangles shown in Figure 2.5 below.
Figure 2. 5: ISWM - Two Overlapping Triangle (Wilson et al 2015)

32
The ISWM is a systems approach to MSW management that recognises three very
important dimensions that must be addressed when developing a new or changing a
MSW management system (UN-HABITAT 2010a). In the simplified two-overlapping
triangle framework, the three dimensions are also covered. The ‘What’ which is the
elements form the first triangle (physical) while the ‘Who’ (stakeholders) and the ‘How’
(aspects) form the second triangle (governance).
The first triangle focuses on the key physical elements which are linked to three key
drivers of MSW management that must be addressed for the ISWM system to work well
and sustainably over a long term (Wilson et al 2013b). These are: Public health (linked to
waste collection); Environmental protection (linked to waste disposal); and Resource
management (linked to the 3Rs – Reduce, Reuse and Recycle).
Thus, the ISWM is an integrated and multidisciplinary approach that aims to integrate
the various stakeholders, a variety of aspects, collection, treatment and disposal options
adapted to specific habitat scales and the MSW management system and other urban
systems such as the drainage, energy and urban agriculture (van de Klundert and
Anschutz 2001).
2.4.1 Using the ISWM framework
The ISWM framework is very useful both as an assessment tool (used in assessing
existing MSW management systems) and as a development tool (for establishing a new
MSW management where none exists) (van de Klundert and Anschutz 2001; Wilson et al
2001). In order to make appropriate decisions in either case, it is important to:
a. Understand the waste – this involves knowing the types of waste, the quantities,
where they are generated, who generates them (households, schools, hospitals,
businesses, etc.), the composition of the waste, etc. These determine the best
treatment options and provide information on how to plan the system to ensure
all the waste are collected and handled appropriately (van de Klundert and
Anschutz 2001).
b. Understand the city and relevant neighbourhood: It is equally important to
understand the physical infrastructure of the city as well as the neighbourhood
including the nature of the roads and traffic conditions, the types of buildings and
locations of MSW management facilities (if available) of possible places to site

33
them (if developing a new system), etc. Again, this will help inform the design and
choice of means of transporting the waste, the frequency of collection, etc. (van de
Klundert and Anschutz 2001; Wilson et al 2001).
c. Understand the citizens and clients of the waste management system – This is
important in order to know the needs of the users (or would-be users) of the
system, their preferences, willingness to cooperate, etc. (van de Klundert and
Anschutz 2001). For instance, source separation and recycling will not work
where citizens choose not to cooperate.
d. Understand all the waste management activities in the city – This involves
knowing all the formal and informal service providers and their activities. This is
very important in understanding the current performance (where there is an
existing MSW management system) or assessing the performance of a new system
(van de Klundert and Anschutz 2001).
In practice, the ISWM does follow the ‘cradle’ to ‘grave’ environmental impact/benefit
consideration of the waste hierarchy. However, as well as taking an integrated approach
that considers all aspects of the waste management – physical (discussed above) and
governance (discussed below), ISWM allows for pluralism of approach and advocates for
the tailoring of these approaches to local conditions.
2.5 Governance Issues in ISWM
Just as the first triangle focuses on the physical elements, the second triangle focuses on
the governance strategies (otherwise termed ISWM software), that all need to be
addressed in order to deliver a well-functioning system (Muhammad and Salihi 2018;
Wilson et al 2013b; Wilson et al 2012). These are: inclusivity (of all stakeholders);
financial sustainability; and sound institutions and proactive policies. The 35
professionals that worked on the original Habitat project (UN-HABITAT 2009) observed
that where MSW management systems failed, it was often not because of the technical
reasons but mainly due to politics, economics and institutions (Wilson et al 2012). This
observation perhaps reemphasises the importance of the governance issues.
2.5.1 Inclusivity
Figure 2.4 shows some of the stakeholders in MSW. Often, the stakeholders can be
classified into users (including the waste generators and clients such as households,
offices, businesses, hotels, restaurants, hospitals, schools, etc.); providers (including the

34
municipal council department and or formal and informal private sector enterprises such
as road sweepers, waste pickers, etc.); and external (including the national government,
neighbouring municipalities, producer responsibility organisations, donor agencies, etc.
(Wilson et al 2013a; Rodic et al 2010; Scheinberg et al 2010; UN-HABITAT 2010a).
Though the municipal authority is often legally responsible for MSW management in a
city, it cannot deliver on that responsibility on its own without the active involvement of
the other stakeholders in the prescription and implementation of measures and policies
(Rodic et al 2017; Brennan et al 2016; Wilson et al 2013b). According to Rodic et al (2010)
and Scheinberg et al (2010), some examples of good user inclusivity include:
communication and consultation of users in strategic planning and siting of facilities;
communication and involvement of users in the organisation of day-to-day services; and
institutionalising inclusivity through a solid waste ‘platform’ while extending service
provision to ensure the participation of private formal and informal service providers is
a good example of provider inclusivity (Memon 2010; IJgosse et al 2004a; Wilson et al
2001). Strengthening citizen participation in non-electoral issues such as MSW
management has become an important aspect of democratic development in West Africa
(Krawczyk and Sweet-Cushman 2016) as it helps in mitigating the implications of poor
governance by improving the management of public resources, reducing corruption by
improving the accountability of public officers and political leaders, positively impact
democracy by promoting the inclusion of marginalised groups (Michels and De Graaf
2010; Haque 2003; Avritzer 2002). Citizen participation also helps in building civic skills
and conceptions of democratic citizenship as well as aid improved policy outcomes and
policy feedback (Krawczyk and Sweet-Cushman 2016).
2.5.2 Financial Sustainability
The provision of MSW management services in cities in developing countries is
expensive, costing up to $75 or more per capita per annum and comprising up to 0 – 15%
of total municipal budget (Wilson et al 2012; Brunner and Fellner 2007). Table 2.2 below
shows the affordability and cost recovery data of lower-middle to high income cities
drawn from 20 reference cities of the UN-HABITAT’s study.
Table 2. 2: Financial Sustainability – affordability and cost recovery in lower-middle to high income cities (based on Wilson et al 2013b)
35
Income
level
City MSW
management
budget per
capita (US$)
City
Average
budget
per capita
as % of
GNI per
capita
MSW
management
fee as % of
household
income
%
population
that pays
for
collection
Reported
cost
recovery
% by way
of fees
Lower-
middle
10 0.69 0.26 28 27
Upper-
middle
33 0.59 1.4 56 36
High 75 0.17 0.44 91 81
Clearly, the table shows that as the income level reduces, both the percentage population
of people paying for MSW collection and the percentage of the total cost recovered by
way of fees payment by users also reduces. This perhaps explains why financial
sustainability is one of the biggest challenges of sustainable MSW management in
developing countries (Rodic and Wilson 2017; Wilson et al 2013b). Being a public good
(service) that should be provided in any case, it also means more pressure on already
stretched public funds. As mentioned earlier, one way of improving democracy and
governance, especially in West Africa is by encouraging citizen participation as it aids the
inclusion of marginalised groups as well as make public servants and political leaders
more accountable (Krawczyk and Sweet-Cushman 2016). When the MSW management
processes and policies are clear and transparent, there is a better chance of attracting
investment and participation from a wider array of groups including private investors,
NGOs, community interest groups, etc. (UNEP 2015; The World Bank 2012).
However, even in slums, it is also reported that people are often willing to pay for
appropriate levels of collection services especially if they were consulted on the service
levels and the charging systems were transparent (Wilson et al 2013b). Other cost
recovery methods reportedly used in cities such as Belo Horizonte (Brazil, Kunming
(China) and Lusaka (Zambia) include a combination of sources such as budgets from
national (or central) governments, franchise fees and property taxes and the sale of land

36
and equipment (Wilson et al 2012; Rodic et al 2010). In Ghorahi (Nepal), no waste
management fee is to households while in Moshi (Tanzania), a cross-subsidising policy
that exempts poor people from paying is in operation (Wilson et al 2013b).
The key to achieving financial sustainability in MSW management thus appear to be the
engagement and involvement of the different stakeholders and ensuring the services are
adequately adapted to local conditions. Furthermore, because the provision of MSW
management services is prone to ‘free rider’ behaviour, it is practically impossible to
exclude non-payers (Rodic et al 2010). Therefore, the role of the management authority
must remain strong, if not in providing the service then in regulating the service (Wilson
et al 2012).
2.5.3 Sound Institutions and Proactive Policies
To ensure the provision of adequate levels of MSW management in a city, the municipal
authorities must address underlying issues such as management structure, labour
practices, contract procedures, accounting, equity, cost recovery, corruption, etc.
(Abdulredha et al 2018; Muhammad and Salihi 2018; Rodic and Wilson 2017; Wilson et
al 2013b). Often, it is necessary to involve the private sector in the service delivery as a
way of achieving costs savings, improve service quality and coverage but relevant
municipal authorities must still take responsibility and ensure the agreed levels of
services are delivered. To achieve this, transparency, competition, accountability and the
elimination of corruption are the necessary conditions for a successful private sector
involvement (Coad 2005; Cointreau and Coad 2000). While Wilson et al 2013b argues
that authorities in-charge of MSW management in developing countries are increasingly
becoming customer oriented and accountable through various locally adapted
participation and complaint procedures, Scheinberg et al 2010 suggests that dispersing
MSW management functions widely through the municipality such that no single
department or manager controls all the component functions and budgets could help
improve institutional coherence and financial autonomy.
2.6 ‘Wasteaware’ ISWM Benchmark Indicators
The management of MSW is one of the most important responsibilities of a city
government (Abdulredha et al 2018; Muhammad and Salihi 2018; Wilson et al 2015). In
order to judge a city’s MSW management performance, provide information for decision
making, monitor changes over time and prioritise service improvements considering the

37
limited funds available, it is necessary to have appropriate benchmark indicators.
Benchmark indicators that are internationally consistent also make it possible to
compare MSW management performance of different cities irrespective of their income
level. It can also be used in comparing policy approaches in countries that are similar or
in developing cooperation efforts, better protection of public health and environment and
better urban governance (Wilson et al 2015).
Whereas interest in performance indicators have been long-standing, until recently,
attempts at developing internationally consistent indicators suitable for comparing MSW
performance in cities in all parts of the world were not that successful (Wilson et al 2015).
Most of the attention has been on developing indicators for certain aspects of the MSW
management system in high income countries e.g. indicators for: waste prevention (Wilts
2012), zero waste management systems (Zaman and Lehmann 2013), extended producer
responsibility systems (Wen et al 2009), tracking compliance with European Union
requirements (Nicoli 2012; Cifrian et al 2010; Fragkou et al 2010), ranking of the
performance of US cities (Greene and Tonjes 2014) and waste collection (Huang et al
2011; Karagiannidis et al 2004). While others have focused on developing countries e.g.
indicators for: 3R (reduce, reuse, recycle) policies to transition from waste management
to resource management (Hotta 2014), recycling systems (Suttibak and Nitivattananon
2008), selective collection for recycling (Bringhentia et al 2011), and comparing
technologies for waste treatment, recycling and disposal (Menikpura et al 2013). Other
benchmark indicators and theoretical frameworks that have been previously proposed
include: indicator set for use in Ireland (Desmond 2006), application of the dashboard of
sustainability (Beccali et al 2007), indicator set using the Driving Force-Pressure-State-
Impact-Response (DPSIR) model (Armijo et al 2011), Balanced Scorecard (BSC) approach
(Guimeraes et al 2010) and the ‘Garbometer’ (Munizaga and Garcia 2013).
According to Scheinberg et al 2010, a recent notable attempt at developing benchmark
indicators and applying them to compare cities both North and South involved a large
international team collecting new data in 20 ‘representative’ reference cities in low,
middle, and high income countries in all six inhabited continents of the world. This
culminated in the UN-HABITAT’s report on the state of solid waste management in
World’s Cities and a set of ISWM benchmark indicators defined for waste systems
covering both the physical and governance aspects (Wilson et al 2015). Wilson et al 2012

38
further undertook a detailed comparison of the results from the 20 reference cities. The
‘wasteaware’ ISWM benchmark indicators discussed below are developed from the
original UN-HABITAT’s ISWM benchmark indicator and has been extensively tested in
more and more cities. It remains the broadest in terms of coverage of both physical and
governance aspects of the MSW system, and the only indicators that have not only the
ambition to be, but also the experience of having been applied across the full range of
income levels (Wilson et al 2015).
2.6.1 Benchmark Indicators - Physical Component
The ‘Wasteaware’ ISWM indicators contains four (4) quantitative indicators for the three
physical components (public health, environmental protection and resource
management). This is shown in Appendix 1 while Appendices 2, 3 and 4 show three
multi-attribute composite indicators of the quality of service for the three physical
components – quality of waste collection, degree of environmental protection and quality
of resource management (the 3Rs) respectively (Abdulredha et al 2018; Muhammad and
Salihi 2018; Rodic and Wilson 2017; Wilson et al 2015).
These benchmark indicators provide detailed criteria for assessing the physical
components of MSW management systems irrespective of the cities income level or
location in a consistent manner. However, the criteria for the quality of service provision
are still open to subjective interpretation of the assessor though following the guideline
in the user manual will help ensure the reduction of subjective bias. This is also applicable
to the benchmark indicators for the governance aspects discussed below.
2.6.2 Benchmark Indicators – Governance Component
For any attempts to modernise the MSW management system to be effective, great
attention must be paid to the governance aspect (Rodic and Wilson 2017; Scheinberg et
al 2010). Therefore, indicators for the governance aspects are qualitative, multi-criteria,
multi-attribute and composite indicators (Abdulredha et al 2018; Muhammad and Salihi
2018; Wilson et al 2015).
Appendices 5 and 6 show the indicators for inclusivity for service users and providers
respectively. This addresses the issues of involvement, interest and influence of the key
stakeholders of the MSW management services. Appendices 7, 8 and 9 show the
indicators used in assessing the financial sustainability; and national framework for MSW
39
management and local institutional coherence respectively. The national framework and
local institutional coherence together provide the indicators for assessing sound
institutions and proactive policies. The tables (appendices 1 – 9) are adapted from Wilson
et al 2015.
2.7 MSW Management in the EEA
The implementation of Waste Policies is one of the key priorities of the European
Commission as evidenced by its proposal for a Roadmap to a resource efficient Europe
and a 7th Environmental Action Programme, in 2011 and 2012 respectively (EEA 2013).
Binding targets for recycling municipal waste and diverting biodegradable municipal
waste from landfill were set in EU’s Landfill Directive (1999) and Waste Directive
Framework (2008). Besides concerns about landfill capacity in some countries, the
rationale was also based on identified environmental impacts of landfilling, including
emission of methane and other greenhouse gases (GHGs), and pollution of groundwater,
surface water and soil (EEA 2009). Though recent analysis by the EEA showed that
marked differences in MSW management performance still exist between countries in the
European Economic Area and between regions within the same country (EEA 2013), EU
policies such as the Landfill Directive have been credited with successes in most EU
countries {except in German and the Flemish region of Belgium where the process of
diverting waste from landfills had started before the adoption of the Landfill Directive},
for:
(a) Promoting the diversion of waste, especially biodegradable waste, from landfills
through a combination of long and short term targets for member countries; and
(b) Providing the flexibility required by member states to try alternative policies and
measures to match national and regional realities, and adapt policies in light of their
experiences (EEA 2013).
Consequently, as well as focused on waste diversion as against waste disposal, the EU
Landfill Directive also makes provisions for tailoring waste management options to suit
local situations.
2.7.1 National strategies in EEA countries and waste policy objectives
Landfilling has massive disamenity and economic costs as well as high environmental and
sanitary impacts (DEFRA 2005; Pearce 2004). Therefore, strategies in most member
40
states are aimed at achieving the objectives set in EU policies as depicted in the EU waste
hierarchy in Figure 2.2. Separate collection of biodegradable waste and some measures
to increase the costs of landfilling are common amongst most EU countries but while
Estonia, Hungary and Finland are shifting focus to increasing their capacities in
incineration, MBT and recycling in order to reduce the amounts to landfill, countries such
as Germany and the Fleming region of Belgium have already reduced landfill to about 1%
and have banned the incineration of certain waste streams such as unsorted household
waste and waste containing >3% organic content. In Italy, the northern region favour
incineration while the southern region favours MBT. In the Fleming region of Belgium
efforts are geared towards promoting home composting and Germany is moving towards
dedicated incineration with energy recovery (EEA 2013). Generally speaking, EEA
countries can be grouped into 3 categories according to strategies used to divert waste
from landfill, relative shares of landfill, material recovery (recycling and composting),
and incineration (Mazzanti and Zoboli 2008; EEA 2007). These are countries with:
i. high levels of both materials recovery and incineration and relatively low
landfill levels
ii. high materials recovery and medium incineration and medium dependence on
landfill
iii. low levels of both materials recovery and incineration and relatively high
landfill levels
Though there is evidence of significant shift from landfilling towards the top of the waste
hierarchy, landfilling is still the predominant option in Europe (Berg et al 2018;
Pomberger et al 2017). Countries such as Germany, Netherlands, Denmark, Sweden and
Belgium have already achieved very low levels of landfilling along with high levels of
incineration and material recovery, but others such as Greece, Bulgaria, Croatia, Latvia
and Romania are still very reliant on landfills (EEA 2013; Mazzani and Zoboli 2008).
Figure 2.6 below shows MSW landfilling rates in 32 EU countries in 2001 and 2010.
Studies by the EEA (2013) also showed that MSW management performance is better in
countries where some economic incentives (e.g. ‘pay –as-you-throw’ schemes where
charges are based on the weight of residual waste, the size of residual waste bin or
frequency of collection) are offered to households to encourage recycling. This is not to

41
suggest that the success of the implementation of one policy or a combination of policies
in one country guaranties the success or otherwise of the same policy or combination of
policies in another country.
Whereas policy variables such as EU directives and national or regional waste strategies
are credited with successes in improving recycling and materials recovery rates,
urbanisation and increasing population densities are important socio-economic factors
enabling the diversion of waste from landfills (EEA 2009). However, Mazzanti and Zoboli
(2008) are of the opinion that current EU policies and national strategies have no effect
on waste generation and as such, waste generation has continued to increase with
economic growth, a position reaffirmed in studies by the EEA (2013).
Figure 2. 6: MSW landfilling rates in 32 EU countries in 2001 and 2010 (Credit: EEA 2013).
2.7.2 Institutional Contexts and Policy Instruments
In most EU countries, the Ministry of Environment develops and implements a National
Waste Plan but the responsibility for waste collection, transport, treatment and disposal

42
mostly lie with the municipalities, local authorities or regions as the case may be (Berg et
al 2018). In Finland, households and enterprises can have direct contractual agreements
with waste service providers to collect, treat and dispose their waste though the local
authorities still set the conditions under which the waste service operators carry out
these duties, including the maximum amount they can charge. Cooperation between
municipalities and local authorities are common as they often pull resources and share
waste management expertise (EEA 2009).
The political structure in Germany is more similar to that in Nigeria – Federal, State and
Local, but there is no National Waste Plan instead each State develops a waste
management plan for its area while the national Ministry of Environment sets priorities,
enacts laws, oversees strategic planning, information and public relations and defines
requirements for waste facilities. Local authorities and municipalities still oversee waste
collection, transport, treatment and disposal as well as develop measures to promote
waste prevention and recovery and construct and operate waste disposal facilities (EEA
2009).
EU countries employ a range of policy instruments to achieve their waste management
objectives. Most common ones include separate collection of certain classes of waste -
food, bio-waste, paper, glass, plastics; introduction of MSW disposal charge also known
as Landfill Tax (paid by Landfill operators), waste management levy on households and
enterprises (in UK this is included in council taxes and business rates), ban on landfilling
of certain waste types, etc. (Berg et al 2018; EEA 2009).
2.8 Overview of MSW management in developing countries and Africa
A study of the state of solid waste management in four African countries by the African
Development Bank (2002) revealed that: no country in Africa has detailed solid waste
management legislation yet; solid waste management in most countries of Africa is
characterised by inefficient collection methods, insufficient coverage of the collection
area and improper disposal methods; city-specific data for waste characterisation in
these countries are generally unavailable; and a general lack of regulatory initiatives in
management and minimisation of waste. Over a decade on, the situation has not changed
much except in cities such as Lusaka and Nairobi where local MSW management systems,
mainly driven by public health concerns, are being pursued (UN-HABITAT 2010b). Lately,
governments in Africa and other developing nations are beginning to realise the negative

43
effects of poor waste management, and are starting to put in place policies, institutions
and programmes aimed at abating the situation (Ezeah 2010; FME 2005). However, most
municipal, local or regional authorities who have the primary responsibility of ensuring
adequate MSW management seldom have the full complement of qualified - planners,
managers, technical and field staff to work with (Ezeah 2010; Agunwamba 1998).
Consequently, there is poor representation for waste management at the decision making
level resulting in poor funding and diminished operational capabilities (Henry et al
2006). This causes dumping of waste at any convenient space and over time, these
accumulate to open dumps while some block drainages. Open burning give rise to several
respiratory infections while several water borne diseases are the results of flooding
(Wilson et al 2013b; Ezeah 2010; UN-HABITAT 2010b).
2.8.1 MSW Management in Ghana
Like in most other countries around the world, city authorities in Ghana have been
responsible for providing MSW management services to their residents (Owusu-Sekyere
et al 2015). For example, upon the establishment of the Accra City Council (ACC) in 1898
in accordance with the provisions of the Town Council Ordinance of 1894, it was charged
with the responsibility of providing refuse and sanitation management services (Acquah
1958). Through the services of a few community sanitary inspectors, the council provided
systematic waste collection and disposal services and by 1925, public dustbins that were
emptied by two pushcarts had been introduced. In 1929, incinerators were introduced
though they broke down in 1970 due to increased quantities of waste generation (Oteng-
Ababio 2013). The breakdown of the incinerators culminated in uncontrolled dumping
at Aborfu, Achimota and Abeta (Owusu-Sekyere et al 2015).
With increasing financial burden on the councils and guided by the following: the Local
Government Act (1994), Act 462, the Environmental Sanitation Policy (ESP) of 1999, the
Environmental Protection Agency Act 490, Environmental Assessment Regulation LI
1652 and Environmental Assessment Procedure; which until then were the main policies
and legal frameworks guiding solid waste management in Ghana, the policy thrust was
shifted towards a private sector-led participation in the 1990s (Owusu-Sekyere et al
2015). In collaboration with The World Bank, the Ghana government established Urban
Environmental and Sanitation Programme (UESP) across five major cities in the country
in 1999 (The World Bank 1999). In the hope of achieving service efficiencies that were

44
lacking in public service-led delivery, solid waste collection services were contracted out
or franchises sold to private operators (Post et al 2003; Cointreau and Coad 2000). This
New Public Management (NPM) market friendly mechanism which decentralised local
service delivery mirrors European models and are still in predominant (KMA 2010;
Issahaku 2000).
This attempt by city-managers in sub Saharan Africa (SSA) to solve MSW management
problems by forming alliance with cities in the developed Global North which in essence
translates to copying of European policies is regarded in Ghana as ‘sister-city’ initiatives
(Oteng-Ababio 2012). While it may be laudable to learn from historical drivers of waste
management in the developed world, the so called ‘technical assistance’ from these
temperate regions has ensured that SSA countries have become dumping grounds for
technologies nearing their end-of-life (Ali 2010; Wilson et al 2006). Consequently, even
though the revised MSW management policies reflect the priorities of the Millennium
Development Goals (MDGs), the New Partnership for African Development (NEPAD) and
Ghana’s Poverty Reduction Strategy, MSW management in Accra and Kumasi (the two
largest cities in the country), are still characterised by mountains of uncollected waste,
gutters choked with waste and beaches strewn with plastic waste (ISSER 2012; UN-
HABITAT 2010a).
2.8.2 MSW Management in Kenya
According to a study by African Development Bank (AfDB) in 2002, the ministries of
Environment and Natural Resources (MENR), and Local Government in Kenya have the
responsibilities of formulating environmental policy and regulations, enforcement and
evaluation as well as issuing of operational licenses and permits to would-be waste
operators (Ezeah 2010; AfDB 2002). While detailed historical information is unavailable
for MSW management in Kenya, Gicheha 1990 reports that MSW collection rates of about
90% were the norm up to the mid-1970s. However, the expansion of industries, rural to
urban migration, improved standard of living and advancement in technology culminated
in increased waste generation. That, and the breakdown of waste collection vehicles due
to lack of maintenance ensured the waste collection rates in Nairobi dwindled to about
20% in the 1980s (Njorege et al 2014; Gicheha 1990). All of the collected waste was
deposited at Dandora open dumpsite, located some 7.5km from the city centre (Esho
1997). UN-HABITAT 2010a reports that about 1000 waste pickers live on the Dandora

45
dumpsite. Though there is no integration between these waste pickers and City Council
of Nairobi (CCN) employees, a recovery rate of about 20% was also reported.
Going by MSW management in Nairobi which is reportedly representative of MSW
management situation in Kenya (Njorege et al 2014), MSW in Kenya is characterised by
rising waste generation quantities that has doubled over ten (10) years, inefficient
collection systems and un-sanitary disposal of waste (UNEP 2010). In 2009, in an attempt
to tackle the challenges posed by the poor waste management situation in Nairobi, the
Kenya government collaborated with the United Nations Environment Programme
(UNEP) to develop an integrated sustainable waste management plan for Nairobi. Upon
initiation of the project, a national task team was formed, stakeholders were widely
consulted and local universities took hundreds of samples of waste to determine the
origin, composition and estimate quantities. The 1st draft of the findings is UNEP 2010.
Amongst other things, the findings reveal that about 51% of the waste stream was
organic, 38% recyclable (paper, plastic, glass, metal) and 11% classed as ‘other’. The
study also reported that about 50% of the residents of Nairobi did not have access to any
waste collection service even though there was significant growth of small private sector
waste collectors in the city. Another interesting finding by the study was that while the
city’s budget was steadily increasing, budget allocation for MSW management was
steadily decreasing. Table 2.3 below present specific actions aimed at achieving ISWM in
Nairobi.
Table 2. 3: Specific Action Plan for ISWM in Nairobi (based on UNEP 2010)
Theme Specific Action
Strategic Alignment and
recognition of partners
Strategic alignment
DoE mission
Recognition of partners
Waste information system
Waste reduction and
source separation
End-of-life levies for problematic wastes
Source separation of recyclable and pure organic
wastes with incentives
Streamlined (weight-based) collection fees
Awareness campaigns and education
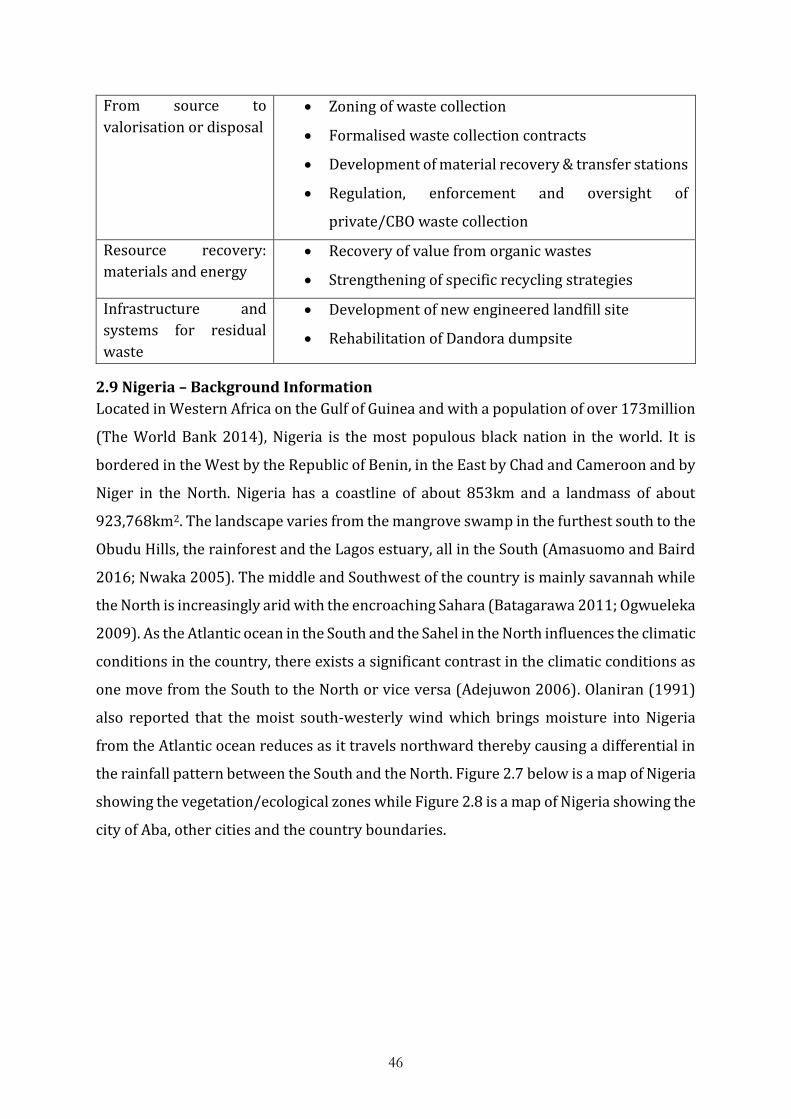
46
From source to
valorisation or disposal
Zoning of waste collection
Formalised waste collection contracts
Development of material recovery & transfer stations
Regulation, enforcement and oversight of
private/CBO waste collection
Resource recovery:
materials and energy
Recovery of value from organic wastes
Strengthening of specific recycling strategies
Infrastructure and
systems for residual
waste
Development of new engineered landfill site
Rehabilitation of Dandora dumpsite
2.9 Nigeria – Background Information
Located in Western Africa on the Gulf of Guinea and with a population of over 173million
(The World Bank 2014), Nigeria is the most populous black nation in the world. It is
bordered in the West by the Republic of Benin, in the East by Chad and Cameroon and by
Niger in the North. Nigeria has a coastline of about 853km and a landmass of about
923,768km2. The landscape varies from the mangrove swamp in the furthest south to the
Obudu Hills, the rainforest and the Lagos estuary, all in the South (Amasuomo and Baird
2016; Nwaka 2005). The middle and Southwest of the country is mainly savannah while
the North is increasingly arid with the encroaching Sahara (Batagarawa 2011; Ogwueleka
2009). As the Atlantic ocean in the South and the Sahel in the North influences the climatic
conditions in the country, there exists a significant contrast in the climatic conditions as
one move from the South to the North or vice versa (Adejuwon 2006). Olaniran (1991)
also reported that the moist south-westerly wind which brings moisture into Nigeria
from the Atlantic ocean reduces as it travels northward thereby causing a differential in
the rainfall pattern between the South and the North. Figure 2.7 below is a map of Nigeria
showing the vegetation/ecological zones while Figure 2.8 is a map of Nigeria showing the
city of Aba, other cities and the country boundaries.

47
Figure 2. 7: Map of Nigeria showing the Vegetation and Ecological zones (based on Adejuwon 2006)

48
Figure 2. 8: Map of Nigeria showing Aba, other cities and country boundaries (based on www.mapsofworld.com/nigeria)
The gross National Income per Capita is $2,450 while average life expectancy at birth for
male and female is 54 (WHO 2012). 46% of the population lives below the poverty line,
the labour force of about 53million is just below 31%, enrolment into primary school is
at 85% while literacy level is an estimated 68% and urban population is about 48% (The
World bank 2014; Ogwueleka 2009; Nwaka 2005).
Nigeria operates a federal system of government with the Federal Government at the
apex - made up of The Executive, Legislative and Judicial arms. There are 6 geopolitical
zones – South-South (SS), South-East (SE), South-West (SW), North-Central (NC), North-
West (NW) and North-East (NE); a total of 36 states, (the State Government, again with
the 3 arms of government present) and one Federal Capital Territory (FCT) administered
by an appointed Federal Minister. These are further divided into 774 local government
areas (LGAs) (Ogwueleka 2009). The Local Governments also have the 3 arms of
government, headed by a local government Chairman. The diversity in customs, religion,
languages and even conflicts is huge with about 374-394 different ethnic groups
identified (Batagarawa 2011).
2.9.1 Overview of MSW Management in Nigeria
The Public Health Act of 1909, the Township Ordinance No. 29 of 1917 and the Town and
Country Planning Ordinance of 1946 were the earliest forms of environmental legislation
introduced in Nigeria by the colonial administration (Ezeah 2010; Adama 2007) but
Adelagan (2004) contends that those policies were either not clearly formulated to curb
the harmful effects of industrialisation on the environment or they were poorly
implemented or enforced. As a result, the study insists that the formative years of
environmental legislation and management in Nigeria lacked clear objectives and
strategies.
In the post-colonial era, Decree 58 of 1988 established the Federal Environmental
Protection Agency (FEPA) to tackle the problems of pollution and waste management
(Walling et al 2004). In 1991, legal frameworks such as - the National Protection
Management of Solid and Hazardous Wastes Regulations, the Pollution Abatement in
Industries and Facilities generating Wastes Regulations, and the General Guidelines for
Pollution Abatement in Industries, were introduced to manage solid waste (Okorodudu-

49
Fubara 1998) and in 1999, the Federal Ministry of Environment absorbed FEPA and took
over its role of administering and enforcing environmental laws in Nigeria as well as
carry out public relations activities related to environmental issues (Batagarawa 2011;
Adewole 2009). Over the years, other policies, frameworks and strategies with
environmental, waste management and sustainable development connotations include
Agenda 21, Vision 2010 and Vision 2020 (Walling et al 2004; Adelagan 2004) and in 2005,
the FME issued its policy guideline on solid waste management (FME 2005) which
prescribed roles for the different tiers of government as well as private institutions and
the general public.
Poverty, rapid industrialisation, high population growth rate and underfunding of state
and local agencies have been mentioned as some of the main factors militating against
sustainable waste management in Nigeria (Ezeah 2010; Akoni 2007).
2.9.2 Current status of MSW management in Nigeria
Generally, MSW management in Nigeria is often characterised by several inefficiencies,
general lack of planning, shortage of skilled manpower and negligence (Ezechi et al 2017;
Nzeadibe et al 2012; Ezeah 2010; Imam et al 2008). The following sections discuss
aspects of MSW management in Nigeria.
2.9.2.1 Waste Generation and Composition
The availability of reliable information on the quantity and composition of MSW is
invaluable as it aids the effective planning of waste management infrastructure. It also
shows the percentage of waste that can be recycled, reused, composted and or
biologically stabilised (Dennison et al 1996). Unfortunately, this information is generally
scarce in Nigeria and other developing countries (Wilson et al 2009), making the
calculation of waste generation rate very inconclusive (Batagarawa 2011). However,
Solomon (2009) puts the average national waste generation rate at 0.49Kg per person
per day with households accounting for about 90% of total urban waste generated while
figures obtained for Abuja (0.57Kg per person per day) was higher but still within the
range (0.1 to 1.2Kg per person per day) for developing countries (Batagarawa 2011).
Studies by Afon (2007), Afon and Okewole (2007) and Imam et al (2008) agree with
similar studies in various other countries that MSW generation Nigeria is also affected by
time of the year, traditions, income, household size, environmental awareness and
concern, etc. Other studies such as Anake et al (2009), Igoni et al (2007) and Ogbonna et

50
al (2007) all show that wastes from Nigerian cities have high organic content (see Table
2.4 below).
Table 2. 4: Waste composition (% by weight) in some Nigerian cities (based on Batagarawa 2011)
Category/City Abuja Port Harcourt Oyo Maiduguri Kaduna
Organic waste 57 23 30 46 30
Plastic 18 11 19 12.7 20
Paper 11 15 14 5.7 15
Metal 5 9 6 10.7 15
Glass 4 9 - 5.8 5
Textile 2 6 4.4 4 5
Ashes, dust,
stones
- 1 10.3 13 -
Other 2 - - 2 10
Garden waste - 10 16.2 - -
Carton - 16 - - -
The observable differences in the waste composition could be attributed to changes in
the socio-economic dynamics of the population sampled such as income, level of
education, household size, etc. (Ezeah 2010; Afroz et al 2010; Bandara 2007; Rushbrook
and Pugh 1999). Other contributory factors may include seasonal variations (Imam et al
2008), environmental awareness and concern (Afroz et al 2011) and possibly, differences
in methods of measurement and categorisation. However, it is important to note that, like
waste from other developing countries, the composition is high in organic matter
(Hettiarachchi et al 2018; Muhammad and salihi 2018; UNEP 2015)
Perhaps, it is important to mention that in the absence of any targeted government policy
to decouple economic development from waste arising; continued population growth will
ultimately result in increasing waste generation (Berg et al 2018; Chalhoub et al 2018;
Brennan et al 2016; Ezeah 2010).

51
2.9.2.2 Temporary Storage of MSW
Previous studies on MSW in Nigeria found that in most urban centres and cities, standard
waste collection receptacles are rarely available for households and as a result, they use
whatever container available for waste storage (Batagarawa 2011; Imam et al 2008;
Abdullahi et al 2008). In Abuja, the federal capital territory, an estimated 42% of the
population still use ‘flimsy’ open containers for the storage of their waste while others
use plastic bags, 120L or 240L containers (Ezeah 2010; Imam et al 2008). Due to
prevailing high temperatures, the waste decay rather rapidly, with undesirable
environmental consequences including but not limited to release of gases and pollutants,
odour nuisance and pest infestation (Berg et al 2018; Breza-Boruta 2016; Marchand et al
2012; Ezeah 2010).
However, other studies imply that about 50% of households in cities have no temporary
storage facilities of their own and as such use communal disposal sites as temporary
storage (Batagarawa 2011). For these people, waste is transferred from the point of
generation to these sites by household members or contracted waste collectors (Dauda
and Osita 2003). The communal disposal sites are often characterised by presence of
rodents and strong unpleasant odour.
2.9.2.3 Waste Collection and Transportation
Waste collection often involves the emptying of bins and or bin bags (temporary
storages) from within a settlement area while transportation refers to the haulage of the
collected waste to the treatment or disposal facility (Den Boer et al 2007). Due to the
unplanned nature of most cities, MSW collection is very daunting and expensive
(Olowomoye 1991). This gives rise to different methods and modes of collection in
different areas or cities and often involves either direct collection by the state, local
government or management agency or indirect collection by appointed private
contractors or informal waste managers for a fee (Batagarawa 2011). The most common
methods of collection include:
2.9.2.3.1 Door to door/House to house collection
This involves the collection of waste often stored in temporary storages from within
individual households/premises by private organisations including informal waste
workers. The different categories of informal waste workers involved in MSW
management in Nigeria are discussed further in section 2.9.2.5. Often, there are

52
contractual agreements between parties (Abdullahi et al 2008). This system of waste
collection often requires a good level of planning and management, accessibility, and a
significant outlay in manpower and equipment (Ezeah 2010).
2.9.2.3.2 Kerbside
With kerbside collection system, households in a given settlement are responsible for
bringing their waste to the kerbs on or before the scheduled collection date, from where
the waste is uplifted by the MSW management authority (Batagarawa 2011). Oftentimes,
kerbside collection in Nigeria is irregular (Imam et al 2008).
2.9.2.3.3 Depot/Receptacle/Communal Facilities
Similar to kerbside system, the communal/depot system is often utilised where access to
many houses is limited (Ezeah 2010). It requires households to bring their waste to the
designated point usually purpose-built structures, skips or even a shallow trench where
waste is dumped directly on the ground (Batagarawa 2011; Ezeah 2010; Dauda and Osita
2003).
The collection and transportation of waste is both labour and capital intensive (Rogic and
Wilson 2017; UNEP 2015; The World Bank 2012), often accounting for between 70% and
80% of the total cost of MSW management in Nigeria (Imam et al 2008). As stated earlier
in section 2.9.2.1, waste composition in Nigeria is often high in organic matter. This
means that compaction vehicles offer very little or no advantage in terms of increasing
waste density (Imam et al 2008). Therefore, the efficient collection and transportation of
waste should involve a careful selection of vehicles taking into account the local road
conditions, servicing requirements, availability of spare parts, maintenance costs, traffic
density, haulage distances, etc. (Nzeadibe and ajaero 2010; Imam et al 2008).
Unfortunately, for a variety of reasons and like every other aspect or elements of MSW
management, waste collection and transport in Nigeria is often characterised as
inefficient, insufficient and improper (Muhammad and Salihi 2018). One of the main
reasons often cited is the prevailing preference of MSW management authorities in
Nigerian cities to splash significant sums of money in importing waste collection and
transportation equipment (Abdulredha et al 2018; Imam et al 2008). One example is the
reported spending of Seven Hundred Million Naira (about US$5.5m) in 2006 by the Abia
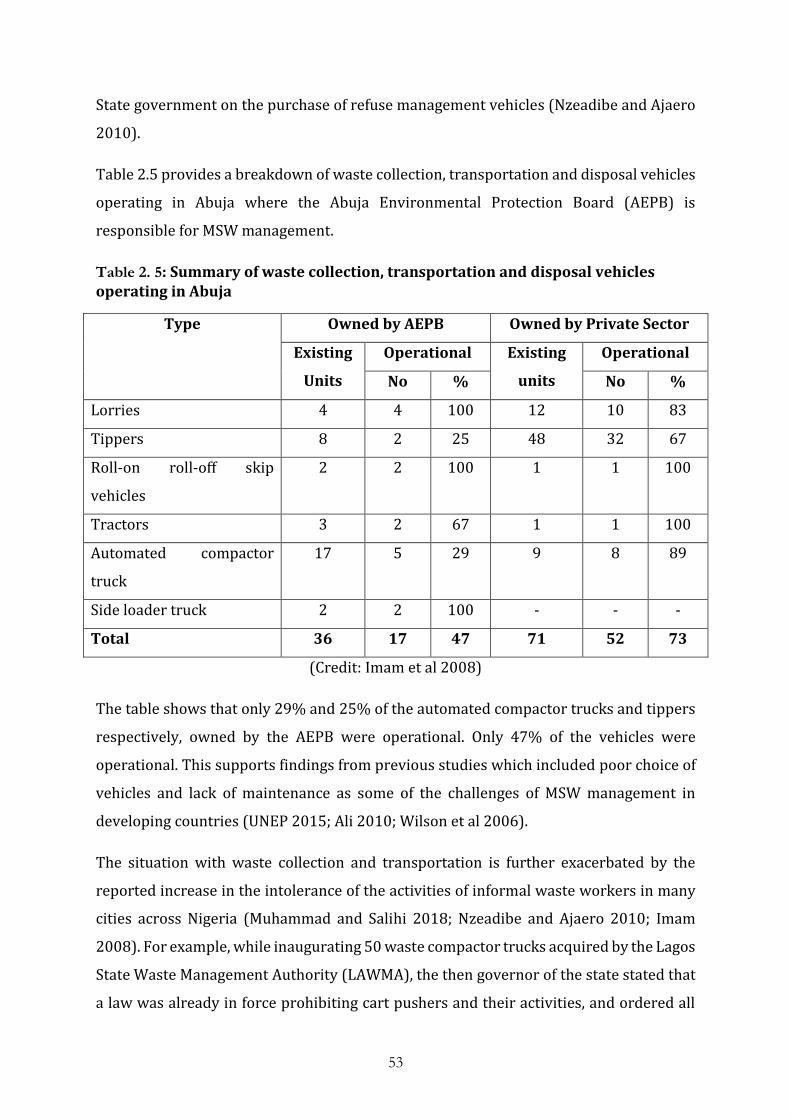
53
State government on the purchase of refuse management vehicles (Nzeadibe and Ajaero
2010).
Table 2.5 provides a breakdown of waste collection, transportation and disposal vehicles
operating in Abuja where the Abuja Environmental Protection Board (AEPB) is
responsible for MSW management.
Table 2. 5: Summary of waste collection, transportation and disposal vehicles operating in Abuja
Type Owned by AEPB Owned by Private Sector
Existing
Units
Operational Existing
units
Operational
No % No %
Lorries 4 4 100 12 10 83
Tippers 8 2 25 48 32 67
Roll-on roll-off skip
vehicles
2 2 100 1 1 100
Tractors 3 2 67 1 1 100
Automated compactor
truck
17 5 29 9 8 89
Side loader truck 2 2 100 - - -
Total 36 17 47 71 52 73
(Credit: Imam et al 2008)
The table shows that only 29% and 25% of the automated compactor trucks and tippers
respectively, owned by the AEPB were operational. Only 47% of the vehicles were
operational. This supports findings from previous studies which included poor choice of
vehicles and lack of maintenance as some of the challenges of MSW management in
developing countries (UNEP 2015; Ali 2010; Wilson et al 2006).
The situation with waste collection and transportation is further exacerbated by the
reported increase in the intolerance of the activities of informal waste workers in many
cities across Nigeria (Muhammad and Salihi 2018; Nzeadibe and Ajaero 2010; Imam
2008). For example, while inaugurating 50 waste compactor trucks acquired by the Lagos
State Waste Management Authority (LAWMA), the then governor of the state stated that
a law was already in force prohibiting cart pushers and their activities, and ordered all
54
cart pushers in the metropolis to leave the state by 31st of December 2008 (Nzeadibe and
Ajaero 2010; Aderibigbe 2008).
Add other administrative challenges such as underfunding of agencies responsible for
waste management, lack of qualified staff and unavailability of data for planning; the
overwhelming outcome is indiscriminate dumping of refuse with the attendant public
health and environmental challenges previously highlighted (Muhammad and Salihi
2018; Ezeah 2010; Nzeadibe and Ajaero 2010). These uncontrolled dumps are thus the
attraction of informal recyclers, scavengers, or itinerant waste pickers (popularly known
by other local names such as Mai-botlle, Ndi-ebulu, Baro-boys, etc in different parts of the
country). These people, forced by economic pressures, scavenge the dumps in search of
‘high’ value papers, glass, metals and plastics. (Afon 2007; Kofoworola 2007; Agunwamba
2003).
2.9.2.4 Waste Treatment
In the strictest sense of the definition, waste treatment is almost non-existent in Nigeria
as even the waste collected by the MSW management authorities goes straight to disposal
sites without treatment (Ezechi et al 2017; Ezeah 2010; Imam et al 2008; Abdullahi et al
2008). However, it is safe to say that the most common treatment practiced in Nigeria is
open burning (Batagarawa 2011; Imam et al 2008). Open burning happens at designated
dumpsites, at illegal dumpsites and is commonly practiced by households and individuals
(Nzeadibe and Ajaero 2010).
2.9.2.5 Materials Recovery, Recycling and Composting
Unfortunately, due to poor governance and other related issues highlighted previously
(Izugbara and Umoh 2004, Ekugo 1998; Agunwamba 1998), both the local government
councils with primary responsibility for MSW management in Nigeria (FME 2000;
Federal Republic of Nigeria 1999) and the specialised agencies and taskforces established
as intervention measures in MSW management by both states and federal governments
(Nzeadibe and Ajaero 2010) have not lived up to expectations. Though there are several
socio-economic and environmental benefits of materials recovery, recycling and
composting to the local population and environment (Kofoworola 2007; Afon 2007;
Agunwamba 2003), the perceived apathy of the government and relevant agencies in
Nigeria towards materials recovery have ensured that there are no statutory structures
or requirements for materials recovery in MSW management, there are no designated

55
officials responsible for recycling and there are no incentives to the public to recycle their
waste (Nzeadibe and Ajaero 2010) These and a choice between starvation and surviving
have forced many amongst the urban poor into the informal MSW management sector
(Ezeah 2010; Nzeadibe and Ajaero 2010; Roberts et al 2009). An estimated 3000
(Nzeadibe and Iwuoha 2008) to 5000 (Adebola 2006a) operate in the city of Lagos,
earning well over the US$1 benchmark per day and in some cases earning more than the
statutory minimum wage in Nigeria (Nzeadibe and Ajaero 2010; Nzeadibe and Iwuoha
2008; Agunwamba 2003; Adeyemi et al 2001). The numbers may be smaller in smaller
cities for example an estimated 600 people are involved in this sector in Aba (Nzeadibe
et al 2012) but these informal MSW workers account for all materials recovery and
recycling activities in Nigeria but yet they are treated with social opprobrium (Nzeadibe
2009; Nzeadibe and Iwuoha 2008; Adebola 2006b).
The informal waste MSW workers operate in different modes and formats. These include:
(Muhammad and Salihi 2018; Nzeadibe and Ajaero 2010; Abdullahi et al 2008;
Kofoworola 2007; Adebola 2006b; Agunwamba 2003)
(a) Itinerant waste pickers/buyers/cart pushers
This group often operate with push carts, wheel barrows, tricycles or motor vehicles from
street to street, and or house to house picking and buying wastes of value which they in-
turn sell to middlemen or resource merchants. They tend to specialise in a few kinds of
materials such as plastics, drink tins, aluminium, metals, etc. (Batagarawa 2011; Wilson
et al 2009). There are also other cart pushers that move from house to house collecting
wastes from households or businesses on contractual bases. The waste they collect are
sometimes sorted for valuable waste which are sold on to middlemen, while the remnant
is disposed at communal disposal sites, taken to designated dumpsite or dumped
indiscriminately.
(b) Scavengers
This group operate mainly at designated dumpsites, bins and illegal dumpsites. They
scavenge the sites for wastes of value which are also sold on to middlemen. Sometimes,
these scavengers have contractual agreements (even if not written) with middlemen, to
source specific materials. Prices are often agreed based on the quality and quantity of the
finds. Wilson et al 2009 reports that some scavengers are found among formal waste

56
collection crews and could recover materials of interest from vehicles transporting
waste.
(c) Middlemen/resource merchants
The middlemen or resource merchants are usually waste dealers who buy the waste
collected by scavengers at dumpsites or in their shops. They also buy from cart pusher
and itinerant pickers/buyers. The materials bought are often sold on to private
individuals and small scale local producers for re-use, or in bulk to recyclers.
(d) Recyclers
This group includes all micro, small scale and medium scale entities that convert
recovered materials such as paper, plastics, aluminium, metals, etc. to valuable products
or raw materials for other industrial processes.
The urgent need to find a means of supporting and regulating the informal waste sector
in Nigeria is indeed a challenge to policy makers and MSW managers (Nzeadibe 2009).
Meeting this need is necessary to forestall the adverse implications of current hostilities
my MSW managers and authorities toward the informal sector (Muhammad and Salihi
2018; Batagarawa 2011; Nwaka 2005). It will also ensure that the contribution of the
sector to MSW management is accounted for as well as contribute to toward achieving
the relevant MDGs and SDGs in poverty eradication and governance.
2.9.2.6 Waste Disposal
The predominant waste disposal method practiced in Nigeria is open dumping (Abdullahi
et al 2018; Muhammad and Salihi 2018; Ezechi et al 2017; Ukpong et al 2015; Batagarawa
2011; Nzeadibe and Ajaero 2010; Ezeah 2010; etc.). Open dumps or dumpsites are often
burrow pits that arose from excavation of sand for construction purposes (Abdullahi et
al 2008; Dauda and Osita 2003). These abandoned pits are often acquired and designated
as official dumpsites. It is important to note that unlike in landfills (which are often
purposefully built); there is no planning involved in open dumpsites in Nigeria (Nzeadibe
et al 2012; Ezeah 2010; Imam et al 2008). MSW management authorities often transport
all the waste they collect to designated dumpsites (Ezechi et al 2017; Nzeadibe and Ajaero
2010; Izugbara and Umoh 2004). Waste dumped in these designated dumpsites is
counted as controlled disposal (Wilson et al 2013b). Most times, staffs from the MSW
management authority are assigned different duties and are responsible for manning the
sites (Agunwamba 1998). Sometimes, it is also possible to find heavy machinery such as

57
caterpillars and other earth moving equipment at these sites. They are often used to push
the dumped waste away from the roads or to push burnt, rotting and older waste further
inside to make way for new waste to be dumped.
There are also illegal dumpsites which could be abandoned pits but not (yet) designated
by government as official dumpsite, undeveloped plots, street corners, abandoned
building sites, etc. Sometimes, MSW management authorities have enforcement agents
who patrol the illegal dumpsites to apprehend defaulters dumping waste on the sites.
2.9.3 Aba – History and Background Information
Historically, Aba urban or Aba city was made up of several villages such as Umuokpoji,
Eziukwu, Obuda, Ogbor, Abayi, etc. as shown on the district map of Aba in appendix 11.
These villages were merged together for administrative convenience by the British. The
British established a military post in Aba in 1915 after conquering the initial anti-colonial
revolt by the locals (The Aro Expedition). They (British) also constructed a railroad
linking Aba to Port Harcourt, for easy transportation of agricultural produce (palm oil,
palm kernels, cassava, vegetables, etc.). In 1929, the historic Aba Women Riot – a protest
to the census and taxation of women in the area by the colonial administration, took place
in Aba (Van Allen 1975). By 1930, Aba was largely established as an urban community
with thriving industries in textiles, breweries, soaps, etc. (Van Allen 1975).
Currently, Aba is a city in Abia State – one of the 36 states in Nigeria. Popularly known as
the ‘Japan of Africa’ - a credit to her artisans and quality handicrafts, Aba is the
commercial and industrial centre of South-Eastern Nigeria (Ajero and Chigbo 2012).
Ariaria International Market, located in Aba metropolis is perhaps the largest cosmetics
market in West Africa while Aba shopping centre is possibly the biggest electronics mall
in south eastern Nigeria. Many of the industries are involved in Pharmaceuticals, brewery
products, plastics, cosmetics, etc. (Ukpong et al 2015). Abia State Polytechnic, Aba; Rhema
University, Aba and School of Health Technology are the popular higher education
institutions located in the city (Ukpong et al 2015).
With an estimated population close to one million, the city occupies an area of about
40,000km2 and is located between longitude 7o19|E and 5o10|N (Amadi and Nwankwoala
2013; Ezechi et al 2017; Umunnakwe et al 2013; Ajero and Chigbo 2012; Izugbara and
Umoh 2004). Popular areas in the city such as Factory road, Aba Town hall, Umungasi,

58
Ndi-Egoro, Abayi, Ogbor Hill, Urratta, Obohia, Ngwa Road, Eziukwu, Faulks road, etc. are
all located within four local government areas; namely – Aba North, Aba South, Obingwa
and Osisioma Ngwa (Ezechi et al 2017). There are two distinct climatic seasons – the
rainy season (April to October) and dry season (November to March) (Amadi and
Nwankwoala 2013).Average mean temperatures range between 24 – 34oC with a relative
humidity of 70% and 90% in dry and rainy seasons respectively (Ukpong et al 2015;
Ezechi et al 2017). Oil wells in Ukwa and Ugwunagbo villages separate Aba from Port
Harcourt in Rivers State (the oil capital of Nigeria – a distance of about 43 miles) and as
such the trading of petroleum products such as kerosene, cooking gas, petrol and diesel
is very popular with numerous filling stations located along most major roads and streets
in the city. The city also has a network of roads leading to other states including Akwa
Ibom, Enugu, Imo, Enugu, etc. (Ezechi et al 2017; Ukpong et al 2015). The native language
spoken by the locals is Igbo (Ukpong et al 2015).
2.9.3.1 MSW Management in Aba
For some time now, the MSW management situation in Aba, like in many Nigerian cities
and urban areas have reached alarming and critical dimensions (Izugbara and Umoh
2004; Ekugo 1998; Nwankwo 1994; Adedibu 1986; Sule 1982). The attendant deaths and
illnesses from diarrhoea, respiratory and lung diseases, malaria, parasitic worms, typhoid
fever, cholera, etc. caused in no small measures by poor MSW management practices have
implications on the social, political and economic development of the population
(Izugbara and Umoh 2004; Izugbara and Okon 2000; Izugbara and Ukwayi 2002).
The Abia State Environmental Protection Agency (ASEPA) has primary responsibility of
waste management in the Aba (Ajero and Chigbo 2012). However, like in many Nigerian
cities, MSW management is very low on the governance agenda (Nzeadibe et al 2012).
The result is poor or weak implementation of the national environmental sanitation
policy in the state (Odoemena and Ofodu 2016; Eneh 2011). Though there are several
factors such as lack of organisational capacity, limited and dilapidated infrastructure, lack
of skilled manpower and lack of commitment (Izugbara and Umoh 2004, Abila and
Kantola 2013), ASEPA cites poor funding as its major hindrance to providing effective
MSW management services in the city (Ukpong et al 2015). Consequently, and like many
other MSW management authorities in Nigeria, ASEPA adopts a task-force approach - the
environmental sanitation day (every last Saturday of the month), mandates all residents
59
to carry out a clean-up of their immediate surroundings (Izugbara and Umoh 2004). The
‘environmental sanitation day’ is perhaps the only MSW management policy known by
the public in Aba and most other Nigerian cities but garbage from the clean-up exercise,
like other waste generated in the city which are indiscriminately dumped end up at the
roadsides (Izugbara and Umoh 2004). On the roadsides, the garbage rots, some eaten by
animals, others scavenged by informal waste recyclers, while the rest are washed off by
rain water and floods (Ogbonna et al 2002).
An estimated 236,703 tonnes of waste generated in the city monthly (Ezechi et al 2017;
Abila and Kantola 2013). Out of this, up to 25 tonnes of waste are dumped at each of two
(2) open dumpsites operated by ASEPA in Aba, daily (Ukpong et al 2015). There are also
illegal dumps scattered all over different locations in the city (Odoemena and Ofodu
2016). While the dumping of waste in the open dumpsites and illegal dumpsites result in
soil contamination, emission of GHGs, LFGs, and production of leachates which
contaminate the ground water, along with the attendant health implications other
indiscriminately dumped waste also cause environmental blight and thus reduce the
aesthetic value of the urban environment (Ukpong et al 2015).
The estimated population of informal waste pickers in Aba is 600 (Nzeadibe et al 2012).
Together, they account for all materials recycling and recovery activities in the city.
However, they are not recognised as stakeholders in MSW by the authorities and are even
treated with social opprobrium (Nzeadibe 2009; Nzeadibe and Iwuoha 2008).
60
CHAPTER THREE
Research Methodology
3.1 Introduction
This research was designed to understand the ‘real’ issues, challenges and contexts of
MSW management in Aba. ‘Real’ here emphasises focus on the actors (stakeholders) who
by living in the case study area, have lived experiences of the subject of study. This
research is post normal science (PNS) in nature which means that it involves the inclusion
of a wide range of stakeholders in the research process and recognises the value of
history (personal experiences as recounted by participants). It is therefore, a
phenomenological study.
The rest of this chapter sets out the strategy adopted in order to achieve the aims and
objectives of this research as elucidated in section 1.5. The chapter is arranged in
sections. Each section contributes to describing the steps and actions taken by the
researcher from choosing the research methods through to data analysis and planned
research outputs.
3.2 Theoretical underpinning of the study
Principle 10 of the United Nations Conference on Environment and Development held in
Rio de Janeiro in 1992 (UNCED 1992) states that “Environmental issues are best handled
with participation of all concerned citizens, at the relevant level”. Thus, the engagement
and involvement of all concerned citizens (stakeholders) became the most important
factor in designing this study. This decision was further strengthened after a review of
the literature on municipal solid waste (MSW) management studies (discussed further
below in section 3.2.1). For this reason, PNS was chosen as the most suitable approach.
The next major issue was the method of enquiry that will appreciate the various valid
perspectives from the different stakeholder groups. This was important to ensure the

61
problems and issues were those raised by the concerned citizens and not just the
researcher’s views and perceptions. Considering the complexity of a MSW management
system due to high uncertainty, high number of variables, high decision stakes involved
and the objective to create a vision and action plan, the adaptive methodology for
ecosystem sustainability and health (AMESH) was chosen. AMESH have been explained
in more detail in the section 3.2.3.
The final theoretical underpinning was a framework, robust enough, for analysing the
issues and challenges identified. The integrated sustainable waste management (ISWM)
framework was chosen for this task as it is the most comprehensive framework that has
been developed and used for similar purposes in other cities (Abdulredha et al 2018;
Wilson et al 2013b). Once these challenges and issues were analysed and understood, the
vision and action plan was created from the views and proposals elicited from the
concerned citizens. The ISWM framework was discussed in more detail in Chapter 2,
section 2.4.
3.2.1 Municipal Solid Waste (MSW) Management Research
Complex systems are best understood through multiple perspectives and methodological
pluralism (Neudoerffer et al 2005). Investigations into MSW management usually have
broad outlook and overlap several academic disciplines from the applied to the social
sciences (Olowomeye 1991). Evidence from previous studies have shown that data
generated from MSW management investigations usually vary from finite statistical
(quantitative) data to the more generally descriptive information common to most
investigations involving human subjects (Ezeah 2010). However, after a thorough
consideration of the nature of this study and its objectives, a wholly qualitative approach
was chosen. This approach, though more time consuming and expensive, is humanistic
and holistic in that it focuses on the personal, subjective and experiential knowledge and
seeks to contextualise the behaviours of participants and their ways of doing things
(Kielmann et al 2011). This approach is deemed very essential in ensuring that this
research impresses on its aims and objectives as well as contribute uniquely to the
existing body of knowledge considering that most previous studies in this area have
mainly focused on the quantitative. The few studies involving qualitative methodologies
were not designed to look at the whole spectrum of waste management and thus not
holistic. It is therefore noteworthy to mention that while this is not an attempt to relegate

62
the import of quantitative data in waste management, it is a positive step towards
providing the complete set of information that is much needed for waste management
policy makers and managers to ensure a better MSW management performance.
Globally, a lot of studies have been focused on MSW management systems. Consequently,
we have come to know a lot too including several factors that affect the rate of waste
generation, the common challenges of effective and efficient MSW management systems
as well as a wide range of possible solutions. However, developing effective and efficient
MSW management systems in developing countries continues to prove very difficult and
elusive.
The full range of research methodological approaches – quantitative, qualitative and
mixed methods, have been utilised in previous studies focused on MSW management. The
most common methods of data collection included questionnaire surveys, field
measurements, observations, interviews and focus group discussions. For example, in
analysing the barriers and success factors affecting the adoption of sustainable
management of MSW in Abuja, Nigeria (Ezeah 2010), the researcher employed a mixed
method methodology collecting relevant data via field measurements, questionnaire
surveys and focus group discussions. Nzeadibe et al 2012 also used a mixed methods
methodology to assess vulnerability and quality of life of waste pickers in Aba, Nigeria.
There data collection methods included ethnographic interviews, questionnaire survey,
focus group discussions and field observations. Batagarawa 2011 used a quantitative
methodology and questionnaire survey as data collection method in development and
evaluation of index based tool for appraising the sustainability of waste management in
Nigeria. All the aforementioned methodologies and data collection methods are well
established and any one or combination of them could have been chosen for this study
too. However, the researcher believes that the scope of this study required a more
rigorous and adaptive method with particular focus on the stakeholders in terms of
capturing their perspectives, complaints and needs because those are the ingredients
required to fully understand the issues and challenges. Also, unlike the studies
enumerated above and so many other similar studies on MSW management in Nigeria,
this study appreciates MSW management systems as an eco-social system. This means
that while parts of the system can be studied in isolation (as is the case with the studies
enumerated above), any sustainable solutions should consider all parts of the system.

63
Therefore to make any sort of progress in developing an effective and efficient MSW
management system in Aba, Nigeria and other similar cities in developing countries, an
integrated local approach such as the one adopted here is necessary. This approach
ensures that regulatory authorities embrace public participation, transparency in
decision making, networking, collaboration and co-operation with all stakeholders. It
adds effective communication and accessibility of information as key elements of
successful MSW management systems. Something advocated by the UNCED and
supported by Zarate et al 2008, Marshall and Farahbakhsh 2013, and widely adopted by
the UN-HABITAT project.
This PNS approach may be contrary to the mind-set of traditional science or normal
science which expects regularity, simplicity and certainty in the phenomena and
interventions or solutions proffered. But traditional science and normal science have
been partly responsible for the current state of intellectual triumph but yet socio-
economic peril in tackling MSW management problems in developing countries. PNS is
more suited as it focuses on quality assurance by embracing uncertainties and multiple
perspectives; and recognises that the decision stakes are high (Funtowicz and Ravetz
1990).
3.2.2 Post Normal Science (PNS)
Post-Normal Science (PNS) is a ‘new’ – not by age but acceptability, conception of the
management of complex science-related issues. It is a problem solving framework that
focuses on those aspects that are often neglected by traditional science practices such as
uncertainty, value loading, multiple legitimate perspectives, incomplete control and
urgency of decisions (Funtowicz and Ravetz 1991). As a theory, PNS links epistemology
and governance. It recognises uncertainty and the existence of multiple valid
perspectives through the extension of the peer community (stakeholders). So unlike
applied (core) science that relies on the ‘truth’, PNS relies on ‘quality’ (Funtowicz et al
2000). In context, a PNS task may be a policy-related research, science-related decision
making or creative technical-social innovation (Funtowicz and Ravetz 2003). These
characteristics typify most environmental science researches and in particular, MSW
management studies like this present study. Figure 3.1 below illustrates how decision
stakes and level of uncertainty determine the choice of science.

64
Figure 3. 1: PNS – Science for high decision stakes and system uncertainty (after Funtowicz and Ravetz 2003)
As a tool, PNS operates around diverse extended peer communities and so serves as a
democratising technique in drawing and evaluating the legitimacy of various
perspectives about an issue. As demonstrated by Fetalvero et al 2013, it is “a workable
framework in fostering environmentalism and in addressing socio-scientific issues that
are high-stake and high-risk in nature”. In their evaluation of the Seveso incident of 1976,
the Bovine Spongiform Encephalopathy (BSE), commonly known as the mad cow disease,
and the licensing of Genetically Modified Organisms (GMO), De Marchi and Ravetz 1999
demonstrated, in a continuum, how the key themes of PNS - uncertainty (which is a key
factor in risk assessment/management); procedures and participation (involvement of
stakeholders at the earliest stages of discussions); and finally problems for governance
(a policy framework that compliments science with other considerations) were
employed in handling each crisis. They showed that in handling issues with high
uncertainties, unquantifiable risks and high decision stakes, real progress can only be

65
made through committed dialogue and building of trust between government and the lay
critics. They concluded that PNS was very important in risk management and could be
extended to various other areas of governance.
Given that there can be varying descriptions and several valid perspectives, it is difficult
to select what to include and what to leave out. In a system such as MSW management, it
is not also appropriate to rely on expert scientists to determine what is important and
desirable for everyone else (Waltner-Toews 2004). Thus as a theory, PNS was found to
be the most suitable choice for achieving all the goals set out for this study. A few other
theories considered include grounded theory, systems theory and behavioural science
theory. By using PNS, it was still possible to view MSW management as an eco-social
system. None of the other theories would have allowed for the inclusion of the extended
peer community (stakeholders) in a way that satisfies the need for a local approach.
Grounded theory does offer that freedom of starting off without much restriction in terms
of predetermined objectives but its suitability and applicability in solving MSW
management issues were not convincing.
3.2.3 Adaptive Methodology for Ecosystem Sustainability and Health
The Adaptive Methodology for Ecosystem Sustainability and Health (AMESH) is one of
the more established methodologies used in participatory action research (Neudoerffer
et al 2005). The AMESH methodology emerged from studies in Nepal, Peru, Kenya and
Canada seeking to define complex eco-social system of study; explore goals and visions
for the future to develop action plans; and consider how current institutional
arrangements affect decision making (Waltner-Toews et al 2004; Kay et al 1999). Those
goals are analogous to the goals of this study.
AMESH is flexible and adaptable, and that was very important to me because I needed a
method that affords me and my participants a suitable medium for quality exchanges so
that while I elicited relevant data from them, I also gave them the necessary information
they needed to understand their roles as members of the extended peer group and the
responsibilities that will engender the required change. Diagrammatically, Figure 3.2
below shows the various steps involved when using AMESH.

66
Figure 3. 2: The Core Steps involved in AMESH (after Waltner-Toews 2004)
This system is similar to and has been adapted from a medically based assessment and
treatment process. The research design, processes and activities were carefully built
around steps 1 to 3. In the words of Kay and Schindler (1994), using an ecosystem
approach means ‘changing in a fundamental way how we govern ourselves, how we
design and operate our decision-making processes and institutions, and how we
approach the business of environmental science and management’. That is in summary,
the long term goal of this research and AMESH was adjudged a perfect fit and thus the
most suitable methodology after trialling and experimenting with a few other
methodologies. Q-methodology was considered but it was practically impossible to adapt
and expand it to the extent that a complex system such as MSW management could be
holistically studied without discarding several valid perspectives. The Contingent
Valuation Approach (CVA) was also too limited in capacity and much focused on
economics and hypothetical costs.

67
3.3 The Research Design and Process
Having decided on the theory and methodology, it became pertinent to plan the research
activities that will help in achieving the set goals and objectives. A sequence of actions,
activities and steps necessary to do so are set out below.
a. Describe the system and present the situation (initially through secondary and
historic data) i.e. Literature review.
b. Carry out workshops, surveys and or further review of literature to identify
stakeholders (peer communities), issues and policy and governance questions
c. Historic review to elicit from the stakeholders how the current situation came to
be
d. Use qualitative investigative methods to explore causal structures from various
valid perspectives and relevant epistemologies
e. Create meta-narratives and qualitative depictions that can be used to identify
connections and trade-offs
f. Negotiate policies and or synthesise action plans
g. Close the ‘loop’ as the system and actions deemed feasible and desirable are
altered accordingly i.e. repeat the process from (a) as variables change.
As shown in Figure 3.3 below, Stage 1 involved steps (a) and (b). Through thorough
literature review, a preliminary field visit to the case study area, telephone calls, informal
chats and use of a pilot questionnaire administered on visitors of the research website
(www.waste.org.ng); the MSW management system in Aba was described and presented,
and the extended peer communities (stakeholders) and the key research questions were
identified.
Stage 2 involved steps (c) and (d). This is the data collection stage. By using guided
unstructured interviews, qualitative information was gathered through audio recordings
and notes taken during interviews with the stakeholders. As expected, these recordings
and notes once analysed formed the various valid perspectives of the issues. Through
personal observations and field notes, more details were obtained that in most cases
validated the information obtained from the stakeholders.
Stage 3 involved steps (e), (f) and (g). Once data saturation was reached, data collection
was stopped. This was achieved once no new leads or information was obtained from
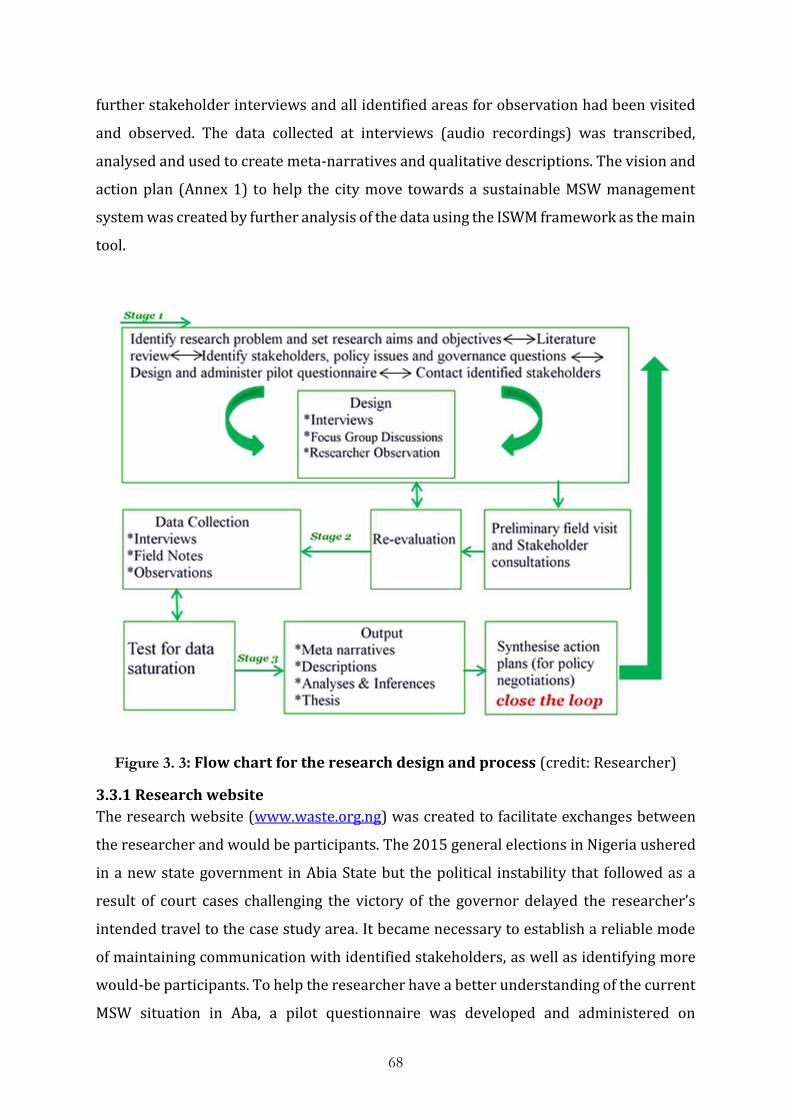
68
further stakeholder interviews and all identified areas for observation had been visited
and observed. The data collected at interviews (audio recordings) was transcribed,
analysed and used to create meta-narratives and qualitative descriptions. The vision and
action plan (Annex 1) to help the city move towards a sustainable MSW management
system was created by further analysis of the data using the ISWM framework as the main
tool.
Figure 3. 3: Flow chart for the research design and process (credit: Researcher)
3.3.1 Research website
The research website (www.waste.org.ng) was created to facilitate exchanges between
the researcher and would be participants. The 2015 general elections in Nigeria ushered
in a new state government in Abia State but the political instability that followed as a
result of court cases challenging the victory of the governor delayed the researcher’s
intended travel to the case study area. It became necessary to establish a reliable mode
of maintaining communication with identified stakeholders, as well as identifying more
would-be participants. To help the researcher have a better understanding of the current
MSW situation in Aba, a pilot questionnaire was developed and administered on

69
participants through the research website (www.waste.org.ng/quiz/waste-mgt-survey-
aba). The pilot questionnaire is also attached as appendix 10. The data obtained from the
pilot questionnaire did not form part of the data analysis for research output(s).
3.3.2 Preliminary field study
The preliminary field study was designed and intended to give the researcher first-hand
knowledge of the current state of the waste management situation in the city. In addition
to literature review and pilot questionnaire, this was part of the research design and
processes undertaken to help present the situation.
The researcher spent a total of 3 weeks in the study area between January and February
2016. During this time, emphasis was on identifying and establishing contacts with key
stakeholders and proposed participants and also using researcher observations to collect
useful primary data. In order to test proposed methods of data collection and sampling
techniques, some informal unstructured interviews were carried out too. (The research
website: www.waste.org.ng contains some picture evidences of the researcher
observation). Table 3.1 below shows some of the findings from the preliminary field
study.
Table 3. 1: Some Inferences from preliminary field study
MSW
management
Aspect
Inference
1 Governance Local councils do not play any role in waste collection/related
services
2 Governance The state government (through ASEPA - its agency entrusted
with waste management services and environmental
protection) decides what and how waste is collected,
transported and disposed.
3 Governance Existing proactive institutions are not consulted for inputs into
waste management decisions
4 Governance There appeared to be conflicts between members of staff of
ASEPA and the Environmental Health Department of local

70
councils. This seems to be a result of lack of clear delineation
of duties of both departments.
5 Governance The general public appeared to have next to no knowledge of
existing policy regulations such as duties and responsibilities,
complaints procedure, and fines for flouting such regulations
due to absence of communications between the government
and its agencies on one hand, and the general public and
service users on the other.
6 Physical Observable evidences of indiscriminate dumping and littering
were very common in various locations in the city.
7 Physical There were no provisions for standard (or even any sort of
formal) waste bins for households, businesses and the general
public
8 Physical Waste skips (where available at recommended waste points)
were left to overflow before they are carted away to dumpsites
9 Physical There was no evidence of any sort of waste processing in place.
All waste collected were transported to open dumpsite. Open
burning of waste was also common.
1
0
Physical There was an apparent lack of coordination and established
system in managing the waste generated in the city
1
1
Physical Most drainage systems were clogged with refuse
1
2
Physical/Governan
ce
Staff of both ASEPA and Environmental Health appeared to be
inadequately engaged as they were seen loitering in numbers
during work hours
1
3
Governance The researcher was informed that the environmental health
department and ASEPA instituted and ran parallel mobile
courts for prosecution of waste management and sanitation
offenders with emphasis on extortion of money from those
apprehended.

71
The information gathered was used to develop a cohort of probes for the different
stakeholder groups using guided unstructured interviews and also to identify relevant
areas for the researcher observations. The different probes (or questions) and researcher
observations were systematically linked with research objectives.
3.3.3 Case Study
This research is a problem solving based learning. In order to achieve set goals and
objectives, there was the need to carry out an in-depth and detailed examination of the
problem. The case study method is one of the most established and common methods
used in this situation (Wisker 2008). The city of Aba is thus chosen as the case study area
as it fits the criteria for the phenomenon of study and out of a genuine interest in finding
a lasting solution to a problem that has bedevilled the city for a very long time.
3.3.3.1 Sampling Techniques
Sample sizes for qualitative researches are relatively small, purposefully selected to
obtain rich information and representative (not statistically) of the broad types of
participants compared to sample sizes for quantitative studies that are usually large, can
be randomly selected and statistically representative (Kielmann et al 2011).
The main sampling techniques used in this study are:
Judgement/purposeful sampling - This sampling method was used to choose certain
participants due to their positions and specific roles relating to the phenomenon of study.
Examples include leaders of market groups, government appointees and staff of the MSW
management agency. Once the identified participants were interviewed, they were
encouraged to recommend others who may be interested in taking part in the study.
Those suggested were then approached and their responses recorded (Kielmann et al
2011; Robson 2002).
Random sampling – This sampling technique was used to compliment the previous
techniques discussed in (a) above. It was particularly used with the general public and
household stakeholder group (discussed further in section 3.3.4.7).
3.3.3.2 The Study Area
Aba is a typical Nigerian city. There is clear evidence of continued disregard to original
plan and design of the city, rapid urban population growth leading to high population
density, abundance of health challenges arising from poor MSW management and poor

72
application of environmental management policies. This situation is exacerbated by the
lack of quality and reliable data on MSW management. Figure 3.4 shows the main urban
area including popular streets - Azikiwe, Asa, Ngwa and Jubilee roads; neighbourhoods –
Ehere, Ogbor Hill; and landmarks – Enyimba International Stadium, Water Side Bridge
and Aba Amusement Park.
Aba is predominantly a commercial hub. Section 2.9.3 provides more background
information of the city while Appendix 11 is a district map of the city. All of the data were
collected in Aba except one interview with a senior government official that was held in
his office at government house in Umuahia, the state capital.
Figure 3. 4: Map of Aba urban
(https://www.google.com/maps/place/Aba,+Nigeria/@5.1070479,7.3764198,15.25z)
3.3.4 The Stakeholder Groups
PNS involves extended peer community (stakeholders) and the objectives of this study
require a very local approach. The identification of the stakeholders is thus a key factor
in the design of this research as well as the achievement of its goals and objectives. All
identified participants have been grouped into the following 7 stakeholder groups:
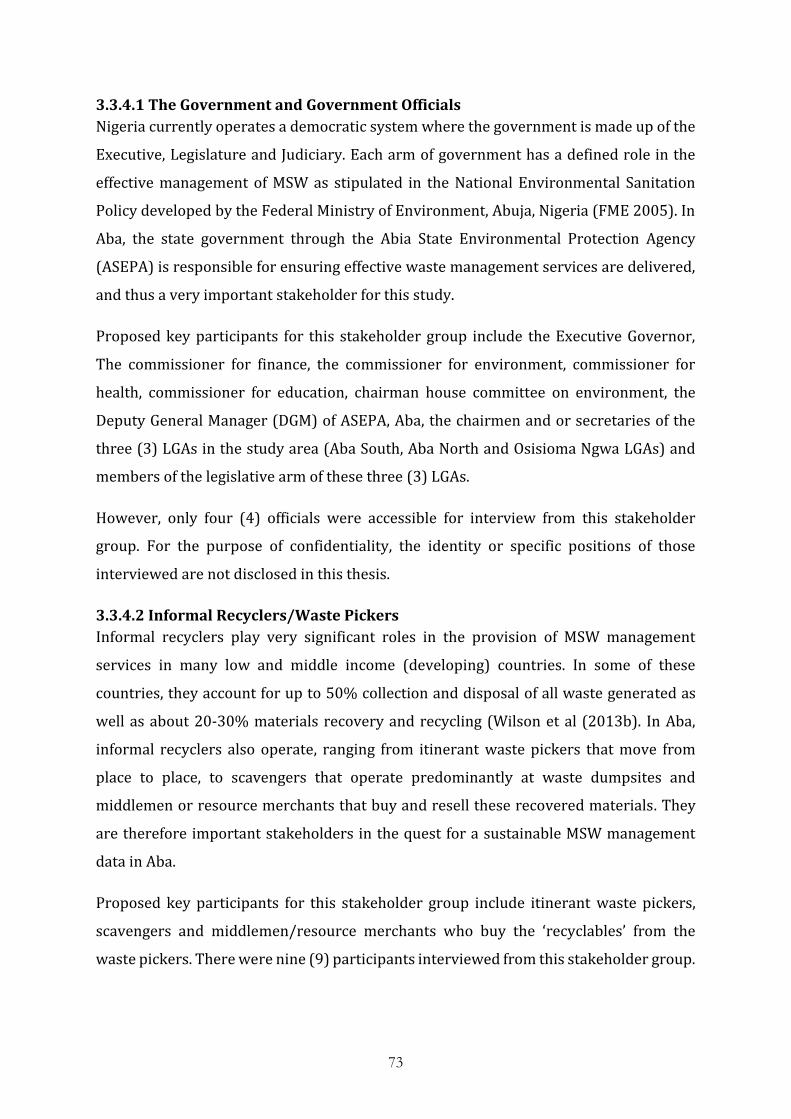
73
3.3.4.1 The Government and Government Officials
Nigeria currently operates a democratic system where the government is made up of the
Executive, Legislature and Judiciary. Each arm of government has a defined role in the
effective management of MSW as stipulated in the National Environmental Sanitation
Policy developed by the Federal Ministry of Environment, Abuja, Nigeria (FME 2005). In
Aba, the state government through the Abia State Environmental Protection Agency
(ASEPA) is responsible for ensuring effective waste management services are delivered,
and thus a very important stakeholder for this study.
Proposed key participants for this stakeholder group include the Executive Governor,
The commissioner for finance, the commissioner for environment, commissioner for
health, commissioner for education, chairman house committee on environment, the
Deputy General Manager (DGM) of ASEPA, Aba, the chairmen and or secretaries of the
three (3) LGAs in the study area (Aba South, Aba North and Osisioma Ngwa LGAs) and
members of the legislative arm of these three (3) LGAs.
However, only four (4) officials were accessible for interview from this stakeholder
group. For the purpose of confidentiality, the identity or specific positions of those
interviewed are not disclosed in this thesis.
3.3.4.2 Informal Recyclers/Waste Pickers
Informal recyclers play very significant roles in the provision of MSW management
services in many low and middle income (developing) countries. In some of these
countries, they account for up to 50% collection and disposal of all waste generated as
well as about 20-30% materials recovery and recycling (Wilson et al (2013b). In Aba,
informal recyclers also operate, ranging from itinerant waste pickers that move from
place to place, to scavengers that operate predominantly at waste dumpsites and
middlemen or resource merchants that buy and resell these recovered materials. They
are therefore important stakeholders in the quest for a sustainable MSW management
data in Aba.
Proposed key participants for this stakeholder group include itinerant waste pickers,
scavengers and middlemen/resource merchants who buy the ‘recyclables’ from the
waste pickers. There were nine (9) participants interviewed from this stakeholder group.

74
3.3.4.3 Waste Management Contractors/Service Companies and their staff
ASEPA works with contractors and service companies. Some simply lend their trucks and
or personnel to the establishment while others offer MSW management services to
businesses such as fast food eateries and similar establishments in the city. Others are
required to carry out certain specific jobs by the agency, including revenue collection and
enforcement. There are also road sweepers employed on ad-hoc basis and are
predominantly old and vulnerable women.
The key participants identified for this group include owners and managers of these
waste management and services companies as well as their staff, and adhoc staff of
ASEPA. Seven (7) participants were interviewed from this stakeholder group.
3.3.4.4 Law Enforcement and Proactive Institutions
Sound proactive institutions play a major role in ensuring a strong and transparent
institutional framework which is essential in good governance of MSW management
(Wilson et al 2013a) while effective law enforcement ensures there are systems in place
to deter people from violating waste management laws and policies, identify, rehabilitate
and punish offenders fairly and systematically.
The key participants identified for this stakeholder group include the head and staff of
department of environmental health, the executive secretaries and staff of the town
planning authorities of the 3 LGAs involved, the members of the task force on
environment, the magistrates of the mobile court on environment, the general manager
of Abia State Water Board, private law firms, NGOs, the civil defence and the Nigerian
Police. There were ten (10) participants interviewed from this stakeholder group.
3.3.4.5 Manufacturing and Production Companies
The one most obvious single challenge to environmental sanitation in Aba is the volume
of empty plastic sachets of what is popularly called ‘pure water’. It is everywhere – on the
roads, in the gutters, etc. Other major culprits are wastes from food packaging and
wrapping such as paper, cardboards and polymeric materials; and organic and inorganic
debris. There is also abundance of companies and businesses generating these classes of
waste in the city such as water packaging companies, fast food houses and other eateries,
roadside markets and even hawkers. Together, they form the key participants for this
stakeholder group. Seven (7) participants were interviewed for the study from this
group.

75
3.3.4.6 Traders and Market Unions
Aba is a city well known for the number of markets and range of wares available on offer.
It is the commercial hub of Eastern Nigeria. It is also a common knowledge that traders
and market unions are a very influential group and play pivotal roles in the politics of the
state. Most entrepreneurs and private business persons belong to one trade or market
union in the city.
The key participants identified for this stakeholder group include traders and members
of the market unions of Ariaria International Market, Ahia Ohuru (New Market) and Aba
Shopping Centre (Ekeoha). All three (3) markets are situated within Aba urban. Others
include traders and artisans in stalls not located within the aforementioned markets but
within the city centre in areas such as Azikiwe road, Asa road, Cameroon road, Park road,
Pound road, Hospital road, etc. There were nine (9) participants interviewed from this
stakeholder group.
3.3.4.7 General Public and Households
Data from the preliminary field study revealed that households are responsible for taking
their wastes to the waste skips (where available). Others take their wastes to ‘illegal’
dumpsites. The general public simply use any available space for disposing waste.
The key participants identified for this stakeholder group include every resident of the
city that consents to giving their opinion and providing feedback to the researcher.
Therefore some members of the other stakeholder groups will double as members of this
group. Twelve (12) participants were interviewed from this stakeholder group.
3.3.5 Researcher Observation
For this study, participants were observed overtly and covertly, depending on the
situation, employing unstructured and semi structured observation techniques. Most of
the data collected through observation are in the form of pictures with some descriptive
texts where necessary. The main purpose of the researcher observation was to serve as
a triangulation to validate data collected through interviews.
Table 3.2 below shows the aspects observed and how they link into the research
objectives and goals. An actual observation exercise is also detailed in the data collection
section.
Table 3. 2: Researcher Observation and Links to Research Aims and Objectives
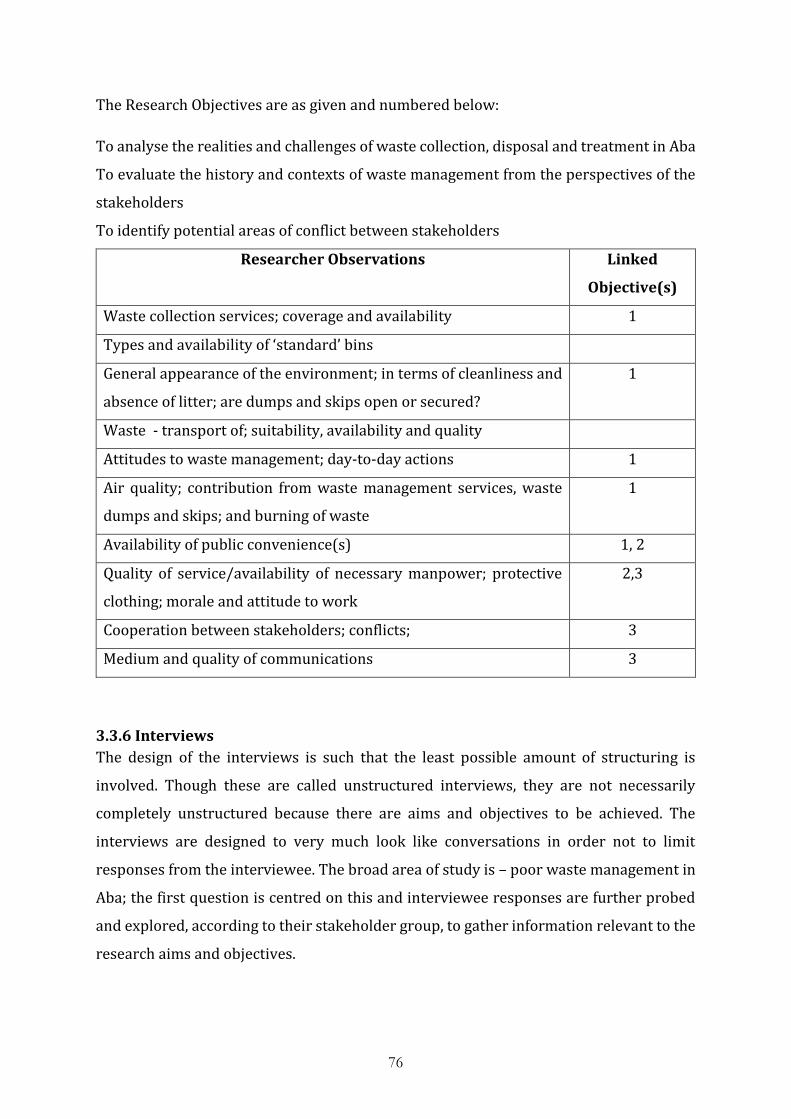
76
The Research Objectives are as given and numbered below:
To analyse the realities and challenges of waste collection, disposal and treatment in Aba
To evaluate the history and contexts of waste management from the perspectives of the
stakeholders
To identify potential areas of conflict between stakeholders
Researcher Observations Linked
Objective(s)
Waste collection services; coverage and availability 1
Types and availability of ‘standard’ bins
General appearance of the environment; in terms of cleanliness and
absence of litter; are dumps and skips open or secured?
1
Waste - transport of; suitability, availability and quality
Attitudes to waste management; day-to-day actions 1
Air quality; contribution from waste management services, waste
dumps and skips; and burning of waste
1
Availability of public convenience(s) 1, 2
Quality of service/availability of necessary manpower; protective
clothing; morale and attitude to work
2,3
Cooperation between stakeholders; conflicts; 3
Medium and quality of communications 3
3.3.6 Interviews
The design of the interviews is such that the least possible amount of structuring is
involved. Though these are called unstructured interviews, they are not necessarily
completely unstructured because there are aims and objectives to be achieved. The
interviews are designed to very much look like conversations in order not to limit
responses from the interviewee. The broad area of study is – poor waste management in
Aba; the first question is centred on this and interviewee responses are further probed
and explored, according to their stakeholder group, to gather information relevant to the
research aims and objectives.
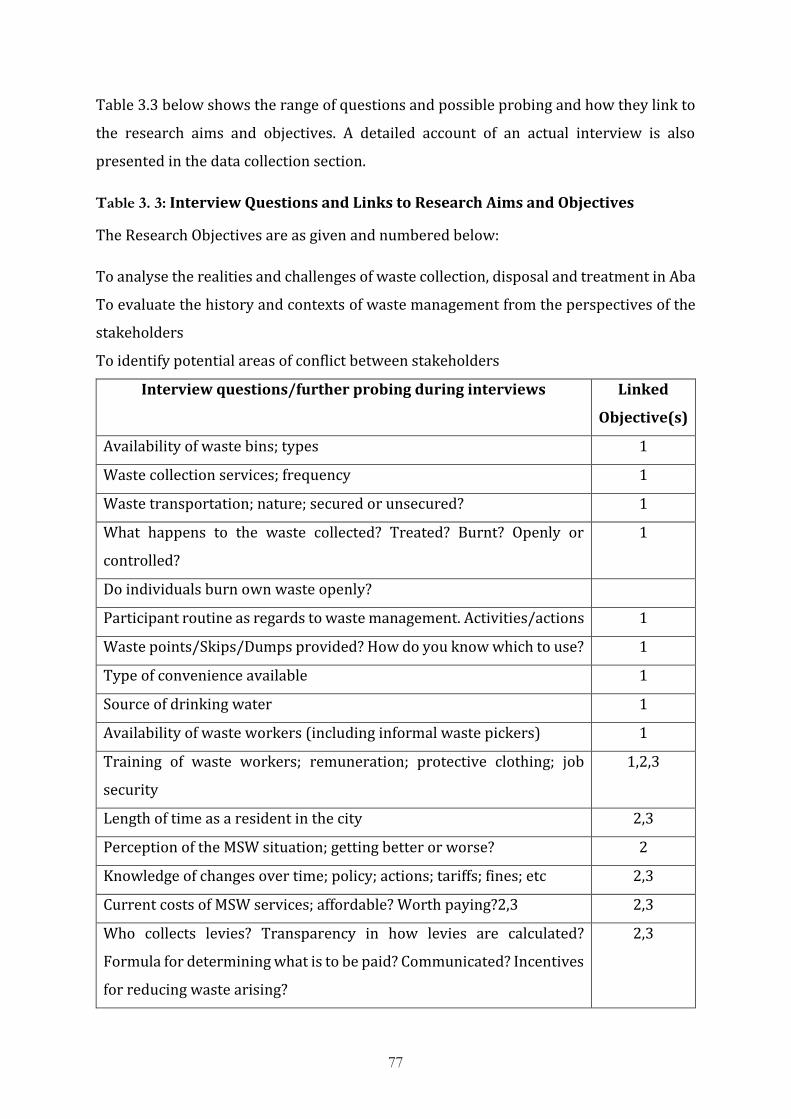
77
Table 3.3 below shows the range of questions and possible probing and how they link to
the research aims and objectives. A detailed account of an actual interview is also
presented in the data collection section.
Table 3. 3: Interview Questions and Links to Research Aims and Objectives
The Research Objectives are as given and numbered below:
To analyse the realities and challenges of waste collection, disposal and treatment in Aba
To evaluate the history and contexts of waste management from the perspectives of the
stakeholders
To identify potential areas of conflict between stakeholders
Interview questions/further probing during interviews Linked
Objective(s)
Availability of waste bins; types 1
Waste collection services; frequency 1
Waste transportation; nature; secured or unsecured? 1
What happens to the waste collected? Treated? Burnt? Openly or
controlled?
1
Do individuals burn own waste openly?
Participant routine as regards to waste management. Activities/actions 1
Waste points/Skips/Dumps provided? How do you know which to use? 1
Type of convenience available 1
Source of drinking water 1
Availability of waste workers (including informal waste pickers) 1
Training of waste workers; remuneration; protective clothing; job
security
1,2,3
Length of time as a resident in the city 2,3
Perception of the MSW situation; getting better or worse? 2
Knowledge of changes over time; policy; actions; tariffs; fines; etc 2,3
Current costs of MSW services; affordable? Worth paying?2,3 2,3
Who collects levies? Transparency in how levies are calculated?
Formula for determining what is to be paid? Communicated? Incentives
for reducing waste arising?
2,3

78
What will be a better or desirable level of MSW management 2
Need and concerns towards your desirable MSW management 2
Personal contribution/knowledge of responsibility to an efficient MSW
management. If you know your responsibilities, do you live up to them?
If not, why?
2
What should be done differently for better MSW management 2
Clear policy on sanitation and waste management available? Budgets
and project goals? Are these communicated to stakeholders
3
Consultations. Are stakeholders adequately involved and consulted in
reaching policy goals and objectives?
3
Are there neighbourhood groups, NGOs, public-private partnerships,
etc. concerned with better MSW management? Support from
government? Prohibited? Are you a member?
3
MSW management contracts and jobs publicly advertised? Open
bidding? Community partnerships encouraged participate? Private-
Public Partnerships?
3
MSW services monitoring – who supervises? Clear mandates? Adequate
training provided to both supervisors and contractors?
3
Clear delineation of duties between relevant departments and staff?
Cooperation between stakeholders promoted?
3
Periodic reviews carried out? Reports? Communicated? 3
3.4 Fieldwork and Data Collection
The fieldwork and data collection exercise lasted a period of 7 weeks between October
and November 2017. Though it was originally planned for early 2016, it was delayed due
to political instability necessitated by ensuing legal tussles between state politicians that
arose from the 2015 general elections held in Nigeria. However, it did mean that the
researcher was afforded more time to consolidate the contacts with would-be
participants. Part of this strategy was a social media campaign aimed at arousing the
interest of residents in the city. Figure 3.5 below shows a poster used for one of such
social media campaigns. The feedback and responses received from such exercises were
used in retuning the research design.

79
Figure 3. 5: Social Media Campaign Poster (Credit: Researcher)
Once in the study area, the first step was to reach out to the stakeholders whose contact
details had been obtained through email conversations, telephone calls, social media and
word of mouth, and where possible, interview times and locations were agreed. I also
recruited and trained 2 new graduates of Environmental Management (EM) and
Electrical and Electronics Engineering (EEE) as assistants on my methodology and
research objectives and goals. Through role play with the research assistants, the
researcher recreated the several scenarios by having each of the assistants act as an
interviewee from the different stakeholder groups. By doing this, the researcher was able
to master what probes to use for each stakeholder group. This was very important as the
researcher did not want to use any interview guide during the interviews. It also helped
the researcher to practice and master the tone for the questions and probes so as not to
ask leading questions or show any preconceived ideas or thoughts. These assistants also
accompanied the researcher and sat in the first few interviews (with the permission of
the interviewees).
3.4.1 Procedure
Part of the general procedures while in the field for data collection included identifying
the location for each interview or observation, dressing appropriately depending on the
location and the participant involved, planning the logistics and transportation to the
location and ensuring the availability of a fully charged audio recorder with a fully

80
charged mobile phone with audio recording capability as back-up, (which also doubled
as a camera for capturing picture and video evidence where appropriate), a notebook and
writing pens. Fully charged replacement batteries for the audio recorder were also
carried at all times.
While most of the government officials did not keep to the agreed times, it was always
important to reach the appointment location at least 10 minutes before the agreed time.
Before concluding the data collection, it became very clear that waiting for the
interviewee (especially participants from the government stakeholder group), for at least
2 hours was a norm rather than the exception. In some cases, the interviewee will not
turn up and the interview had to be rescheduled through telephone calls. Sometimes,
even that did not work and the interview was forfeited. For most other stakeholder
groups, time keeping was very impressive though sometimes we were interrupted by
either customers (in the case of the traders and market unions, and production and
manufacturing companies) or by acquaintances or general background noises (as in the
case with participants from general public and households; and informal recyclers and
waste pickers stakeholder groups).
Generally, the daily schedule was determined by who was available. On days when there
were no appointments booked-in for interviews, the researcher carried out planned
observations and or approached members of the households and general public
stakeholder group. It is noteworthy to mention here that many would-be participants
vehemently refused to give their opinions once MSW management was mentioned. Some
cited fear of victimisation by government authorities while others insisted that nothing
will ever change in the city irrespective of their opinions. Many insisted that corruption
was the bane of the problems and that they had lost faith in the present crop of politicians.
Some were simply dismissive with a gesture while others referred the researcher to some
of the worse off areas of the city in terms of MSW management (in relation to present
location of the researcher) and to interview people there instead.
3.4.1.1 Interviews
Each interview began with the exchange of pleasantries between the researcher and the
interviewee. This was quickly followed by what this study termed ‘formal disclosure’ – a
quick introduction of the researcher, the research and goal and the approach (guided
unstructured interview that allows for a 2-way information exchange with audio

81
recording and note taking). Interviewees were also informed that no question was
compulsory including personal identification details. The interviewee was then offered a
copy of the information sheet and consent was requested. All interviewees gave oral
consent before the interview proceeded. Where the participant declined to consent, the
interview was immediately ended with what the study termed ‘closing remarks’ – a vote
of thanks for the attention paid by the participant and apologies for the time taken
followed by an expression of hope that the city will achieve improved MSW management.
Appendices 12 and 13 show the information sheet and consent form respectively.
Once consent was given by the participant and the personal identification details
obtained or declined (some interviewees gave consent for the interview to proceed but
declined giving their personal identification or contact details including names and or
emails), the interview will then proceed with an open question about the participant’s
view of waste management in Aba. The next and subsequent probes will depend on the
participant’s response and stakeholder group. Because the researcher had had extensive
preparation and practice, an interview guide was not needed. This was important in
maintaining a natural flow to the conversation and ensured the participants felt at ease
(Kielmann et al 2011).
A total of 58 interviews were completed. Table 3.4 below provides a breakdown for the
different stakeholder groups, the pseudonyms used to identify the various groups and
the participant numbers (id) assigned.
Table 3. 4: Breakdown of the Interviewees by stakeholder group
Stakeholder Group Pseudony
m
No of
Participants
Interviewed
Assigned
identification
numbers (id)
% of
total
sample
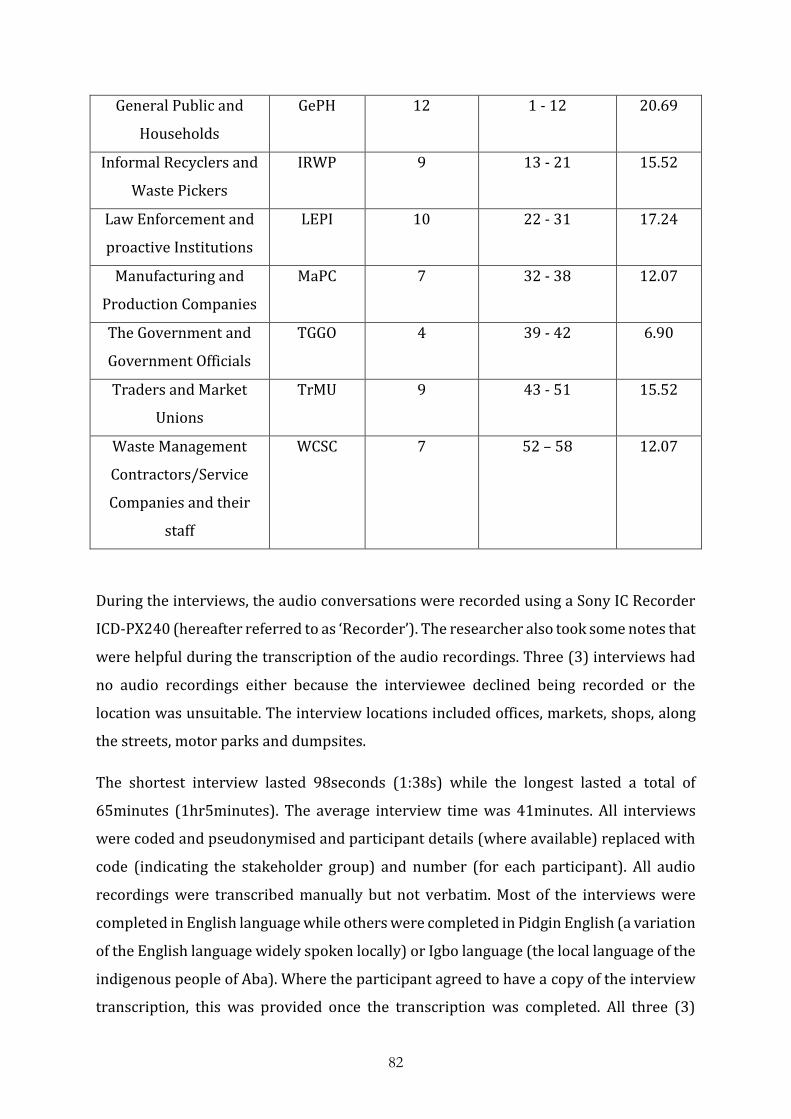
82
General Public and
Households
GePH 12 1 - 12 20.69
Informal Recyclers and
Waste Pickers
IRWP 9 13 - 21 15.52
Law Enforcement and
proactive Institutions
LEPI 10 22 - 31 17.24
Manufacturing and
Production Companies
MaPC 7 32 - 38 12.07
The Government and
Government Officials
TGGO 4 39 - 42 6.90
Traders and Market
Unions
TrMU 9 43 - 51 15.52
Waste Management
Contractors/Service
Companies and their
staff
WCSC 7 52 – 58 12.07
During the interviews, the audio conversations were recorded using a Sony IC Recorder
ICD-PX240 (hereafter referred to as ‘Recorder’). The researcher also took some notes that
were helpful during the transcription of the audio recordings. Three (3) interviews had
no audio recordings either because the interviewee declined being recorded or the
location was unsuitable. The interview locations included offices, markets, shops, along
the streets, motor parks and dumpsites.
The shortest interview lasted 98seconds (1:38s) while the longest lasted a total of
65minutes (1hr5minutes). The average interview time was 41minutes. All interviews
were coded and pseudonymised and participant details (where available) replaced with
code (indicating the stakeholder group) and number (for each participant). All audio
recordings were transcribed manually but not verbatim. Most of the interviews were
completed in English language while others were completed in Pidgin English (a variation
of the English language widely spoken locally) or Igbo language (the local language of the
indigenous people of Aba). Where the participant agreed to have a copy of the interview
transcription, this was provided once the transcription was completed. All three (3)

83
participants who requested a copy of the transcriptions accepted the copies as a true
representation of the interview. Appendices 14, 15 and 16 are examples of
pseudonymised transcription of a short, average and long interview respectively.
3.4.1.2 Observations
The researcher observation was a key part of the data collection and possibly the most
challenging too. Because the research had lived in the city, it was important that the
researcher’s observation was not affected by the previous lived experiences.
Consequently, before starting recorded observations, the researcher spent numerous
hours and several days conducting casual observation exercises. These exercises were
helpful in replacing the researcher’s previous lived experiences with new information
that was current and representative.
All the observations were direct but depending on the situation, a covert or overt
observation method was used. The researcher also used semi-structured and
unstructured observations. This was necessary to ensure all areas relevant to provide the
needed information was duly observed.
An example of a semi-structured overt observation was when the researcher
accompanied a MSW evacuation team on a daily schedule. The researcher wanted to
know everything about how their day-to-day job was executed; what equipment they had
and used; if they wore personal protective equipment (PPE), and so on and so forth. The
researcher contacted the officer in charge at the agency (ASEPA) and an appointment was
agreed. Before proceeding to the field for the day’s job, the researcher was formally
introduced to the team by the officer. He also gave the researcher the opportunity to
explain the objectives of the observation exercise and study to the team. Appendix 17
shows the observation notes from that exercise. On another day, the researcher decided
to observe how residents disposed their waste at the designated receptacle points. This
was an example of semi-structured covert observation as the participants were not
formally informed that they were being observed. Appendix 18 shows the observation
notes for that exercise.
On another eventful day, the researcher decided to walk from the junction where he
usually got a taxi to the city centre as there was traffic jam. On approaching an area where
there was a local market for food stuff, the researcher saw an elderly lady selling fresh

84
vegetables on the street from a basket she had attached to her bicycle. The researcher
stopped and began writing down his observations. This was an example of unstructured
covert observation and Appendix 19 shows the notes for this observation exercise.
3.4.2 Ethical Consideration and Ethical Clearance
Participation in this research was voluntary. The process was non-invasive and no
sensitive personal data were sought from the participants. The privacy and
confidentiality of all participants were respected at all times. The information sheet
containing the details of the research was provided to all prospective participants and a
consent form administered. All the participants gave oral consent but none signed the
consent form. Most participants confirmed they had learned a few new beneficial things
about MSW management by taking part in the research process. They also expressed
hope that their opinions will be considered in any future plans and policy changes in MSW
management in the city. No guarantees or incentives were offered for participation.
However, in order to reciprocate the efforts of the participants and as a show of
appreciation for the time invested in making this research a success, the researcher plans
to provide feedback on the research findings to each participant to ensure they benefit
from the research. This will be done a planned visit to the case study area once the final
steps of the research have been concluded. Furthermore, due to the expressed
despondency and vulnerability of some of the stakeholder groups, plans are now in the
pipeline to institute some sort of advocacy to tackle some of the very serious issues
raised. For participants that demanded a copy of their interview transcript, such was also
made available through email within the agreed timeline.
All relevant data collected have been stored in accordance with QMU recommendations
for data storage as stipulated in Research and Ethics Guideline Section 1, Paragraph 2.4.2.
The Ethical Approval form submitted for this research is attached as Appendix 20.
3.5 Organisation of data
At the end of each day, all the audio recordings from the day’s interviews were
transferred from the ‘Recorder’ to an ASUS laptop computer (hereafter referred to as
‘Laptop’). The notes taken during the interview contained the identification details that
were used to match up the audio files to the respective interviews. This information was
used to pseudonymise the data before copies of the audio files were then saved unto the
researcher’s Onedrive (an online data service provided by Microsoft) account as backup.

85
3.5.1 Pseudonymisation
Pseudonymisation here simply means removing all interviewee personal details and
replacing them with a pseudonym and participation number. The data thus become
anonymous to everyone else except the researcher who can still identify the interviewees
using the notes taken during the interviews i.e. where such details were made available
in the first instance. Pseudonymisation involved 2 parts – a mnemonic that identified the
interviewee’s stakeholder group and a serial number for each interviewee in the
stakeholder group.
3.5.2 Transcription
All the interview audios were manually transcribed by the researcher using the
intelligent transcript method. The transcription was effected using Microsoft Groove
Music (MGM) and Microsoft Word applications. The process often involved several play-
backs of the audio files on MGM and typing on Microsoft Word. The MGM offered the
functionality of an interactive screen with pause, rewind and drag-back; slow play speed,
etc. options which were very handy in completing the task. After each transcription, the
researcher then listened to each interview audio one more time, this time without the
transcribed notes but with just a pen and paper, taking notes of all the points that were
made by the interviewee. This new notes were then used to check the transcribed notes
for any points missed.
3.5.3 Thematic Coding of data
Once the transcribing of the interview recordings was finished, the raw data was made
into a 160-page Microsoft Word document. The thematic coding of the data was a two-
stage process. The first involved reading through the interview transcriptions (raw data)
over and over again to familiarise oneself with the data (Creswell 2007; Braun and Clarke
2006). The second was to apply codes by asking the following questions: what is going
on? What are the participants saying? What are the participants doing? What do the
actions and statements mean or take for granted? What structures and contexts support
or impede these actions and statements? (Charmaz 2003). Some of the codes used were
simply common words that appeared in participant responses (Gibbs 2007) such as
ASEPA, services, corruption, nepotism, manpower, skips, sickness, pollution, population,
professional, payment, enforcement, recycling, responsibility, harassment, taskforce,
drainage, dumpsite, waste, etc. Others included values, rules, norms and narratives
expressed by participants and those developed by the researcher which related to the

86
research questions and objectives (Gibbs 207). Examples include house to house
collection, waste management professionals, waste separation at source, open burning,
western world, environmental health officers, etc. A total of 142 codes were developed
and applied on the raw data. This was done using different highlighting schemes and
colour coding on Microsoft Word. Once the entire document was coded, the texts were
collated according to the applied codes with the pseudonym and number indicated
representing the stakeholder group and participant identification number (id)
respectively. A coding list containing the definition of each code was also created to assist
the research in the next step of identifying themes.
3.5.4 Thematic Analysis of data
Once the coding was completed and checked over a few times for errors, the next step
was to identify common themes. The first step was to use the coding list to find
relationships between codes that had been applied. This was done by synthesising the
code definitions and applying the suggestion of Ryan and Bernard (2003) by identifying
repetitions, metaphors and analogies, similarities and differences such as comparisons,
missing data, linguistic connectors, indigenous typologies and transitions. This inductive
approach allowed the research findings to emerge from frequent, dominant or significant
themes inherent in the data (Thomas 2003). Still using Microsoft Word, all texts for
similar codes that had been combined to form a theme were copied and combined into
one document for analysis. For example, codes that had ASEPA, manpower, service,
responsibility, government, etc. were combined in the analysis for the broader theme of
MSW management service constraints, challenges and investment options. The initial
syntheses of the codes into sub-themes which were then combined further to form
themes were completed using a combination of mind maps and thematic sketches. During
the actual analysis of the coded and copied texts, responses that were not applicable were
identified and marked as ‘outliers’ and used in other themes where they were applicable.
After the initial collation of the codes, eight initial themes were identified. This was in line
with reports from Thomas (2003) which suggests that most inductive studies report a
model of 3 to 8 main categories in the findings. Deductively, by applying the ISWM
framework upon which the research questions and objectives had been previously
developed, the 8 themes were then summarised into the following six main themes or
findings: Historical review of MSW management in Aba; Realities and challenges related

87
to aspects of MSW management; Aba Syndrome and knowledge of MSW management;
Realities and challenges related to the governance of MSW; ASEPA operations and
relationship with other stakeholder groups; and The operations and role of informal
waste workers.
Once the main themes had been identified, the codes were collated again, this time
according to the stakeholder groups. The data was analysed again to find out if there were
agreements or disagreements amongst members of the same and different stakeholder
group. All the data coding and thematic analysis were done manually, without the use of
any qualitative analytic software.
3.5.5 Research Output
The main research output of this study will be the thesis. This will be a collection of
descriptive essays and qualitative depictions such as influence diagrams, charts, tables
and pictures arranged in form of chapters. The main result chapters are chapters 4, 5, 6
and 7 and together, they present the outcome of the data analysis and provide answers
to the research questions. In Chapter 8, the researcher discusses the main findings and
contextualises same with relevant literature.
Other research outputs will be in the form of research papers published in peer reviewed
journals and on the research website. There are also plans to make the vision and action
plan (Annex 1) into a handbook for waste managers and policy makers.
CHAPTER FOUR
The History and Contexts of MSW from the Perspectives of the Participants
4.0 Introduction
This chapter presents the history and contexts of MSW management in Aba by recounting
the stories told by the participants. Where relevant, their accounts will be supported with
observations made by the researcher and picture evidences. The chapter will address the
second aims and objectives of this study (as detailed in pg. 7).

88
4.1 Historical Review of MSW Management in Aba
Historical reviews of the MSW management practices or systems in cities around the
world tend to revolve around the drivers of the observed changes. In the UN Habitat’s
book – solid waste management in the world cities, the section titled ‘learning from
history’ focused on the drivers. Most publications by David Wilson on history of MSW
management follow the same pattern. It is thus a good practice to historically review
MSW management along the lines of changes in the driver.
However, it is often commonly said in Nigeria that Nigerians do not attach much value to
history - something which can be argued as being partly responsible for the dearth of
relevant academic literature on the subject of this section. Thus, in order not to lose the
value of the stories gathered from the stakeholders in this study and to ensure that it
contributes to closing the obvious gap in literature on the subject matter, this section will
be dedicated to the history, contexts and perspectives of MSW management in Aba while
a separate section will be dedicated to the drivers, or motives, of MSW in the city.
In order to recount these stories accurately and make sense of the rich information they
contain, it is necessary to define four (4) different timelines. These timelines have been
chosen by the researcher to correspond to the most common reference points referred
to by the stakeholders in this study. Table 4.1 below shows the different timelines (eras).
Table 4. 1: Four (4) Eras of MSW Management in Aba
Timeline Era
Years up to 1987/1988 Mbakwe’s era – Era of Stability
1988 - 2013 After Mbakwe but before Okezie Ikpeazu became DGM of
ASEPA Aba Zone – Era of Decay
2013 – 2014 Okezie Ikpeazu as DGM – Era of Adhoc Remediation

89
2014 to date After Okezie Ikpeazu’s tenure as DGM – Era of
Oppression
4.1.1 Period 1 - Mbakwe’s Era (The era of Stability)
Chief S.O Mbakwe was the governor of old Imo State from 1979 to 1983. Abia State was
carved out of the old Imo State in 1991. Most participants referred to this period
(Mbakwe’s tenure as governor) as a time when government in the state had a sense of
purpose. They enthused that there was a clear policy, determination, drive and
commitment by the government of the time to keep the environment clean and protect
the lives of the masses. Table 4.2 below is an excerpt from stakeholder interviews.
Table 4. 2: Excerpt of Stakeholder Responses – Mbakwe’s Era
Participant id Comments
9 We should not be littering waste here and there. The truth is that this
government has no program. During Mbakwe’s time, there was a
program called ‘Keep Imo a Beautiful Society’ which was positively
pursued.
22 I’m in my late 40s now. As a kid, I saw Environmental Health Officers
(EHOs) from local governments coming to fumigate our gutters. I also
participated as a member of the War Against Indiscipline and
Corruption (WAI-C) brigade. We usually went round Aba excavating
refuse and de-silting the gutters, something they now give out as
major contracts to political cronies for huge pay and yet it does not
get done.
The WAI-C was a headline program of the then Supreme Military Council (SMC) headed
by Major General Muhammadu Buhari and his second-in-command Major General
Babatunde Idiagbon. Stories of overzealous military personnel beating up civilians for
offenses such as not queuing up or littering were common but as the states were also
mandated to implement the WAI-C, it meant that public officials were held accountable
and responsible when they failed in their duties. The participant (id = 22) continued –
“Even though then, the population was not as much as it is now, bearing in mind the small

90
population and the efficiency of the (waste management) professionals that were used
then, the Aba environment was very clean”. He went on “I know that I met an
environmental system where you see the EHOs do not just sit in their local governments
waiting for allocations to be shared as salaries; these people go (went) about noting
houses that are dirty and once your house is noted as being dirty, the next thing that
happens is that police will come to arrest the landlord. And what the landlord will do is
to bring out the erring tenant who will be sanctioned. Most times, it attracted quit notices
to people”. These stories were somewhat a recurring decimal and another participant (id
= 1) even told of how women found culpable by EHOs on inspection were treated as
outcasts in the community as other members of the community resented, avoided and
“treated them with odium”.
It is interesting to note that most participants agreed that the actual process of managing
waste in the city during the Mbakwe era is similar to what is still in use now though one
participant (id = 7) highlighted that during this era, the waste was dumped on the ground
at specific places as there were no skips. However, he added that the heaps of waste were
timely and regularly evacuated unlike what is obtainable now. All the participants were
of the opinion that the Aba environment was cleaner during this era, and by analysing
their responses, the researcher identified the responsibility for each of the main reasons
given as justification by the participants. These are shown in Table 4.3 below.
Table 4. 3: Reasons given by Participants for a cleaner environment during Mbakwe’s era
Reason Responsibility
Sincere and purposeful leadership The government, policy makers
Clear policy on waste management The government, policy makers
Use of trained professionals (EHOs) The government, policy makers
Enforcement and deterrent The government, policy makers
High level of discipline All stakeholders
Support groups e.g. WAI-C brigade All stakeholders
Low population density All stakeholders
Public waste bins at strategic locations The government, policy makers

91
One major factor referred to by many participants as a reason for the worsening state of
cleanliness was population. One participant (id = 7), captured the opinion of many very
succinctly when he said “Aba used to be cleaner but the increase in population has put a
lot of pressure. The process employed now is better (referring to the use of skips against
the practice of dumping the refuse on the ground) but it’s not punctual or regular and
that’s why it seems it’s not working. The timing needs to be improved to ensure the skips
don’t overflow”.
4.1.2 Period 2 – After Mbakwe (The Era of Decay)
The timeline for this period has been designated as 1988 to 2013. In essence, it could be
anytime from 1984 as many stakeholders argue that the then SMC did not fund the
ministries adequately to maintain the level of services they were providing but rather
used military might to crack down on civilians. There is some truth in that as it is on
record that the then SMC ran an austerity economic policy. Others put the genesis of this
period to about earlier 1990s when Nigeria had become deep rooted in military rule.
Whatever the timeline was, most participants opined that this period saw the beginning
and sustenance of the decay in MSW management that is still being felt today in cities all
over Nigeria. The National Environmental Sanitation Policy – a policy document
developed by the Federal Ministry of Environment (FME) in 2005 throws more light on
this when it says in section 1.2.4 (pg. 12) “In the immediate post-independence era (1961-
1980), legislation and authority on Environmental Sanitation were derived from the
Nigerian Constitution as stated in the concurrent, exclusive and residual lists.
Nonetheless, routine house to house inspection was still effective in the maintenance of
environmental sanitation. However, political interference with the statutory role of
Sanitary Inspectors led to the collapse of the house to house inspection programme and
contributed to the poor sanitary conditions in the country”.
What followed was a litany of legislative and regulatory instruments (Table 4.4 below)
developed at different tiers of government in an attempt to address the worsening
sanitation situation.
Table 4. 4: MSW- Related Legislative and Regulatory Instruments in Nigeria
Title of Legislation/Regulatory Instrument
1 Harmful (Toxic) Waste Criminal Provision Decree 42 of 1988
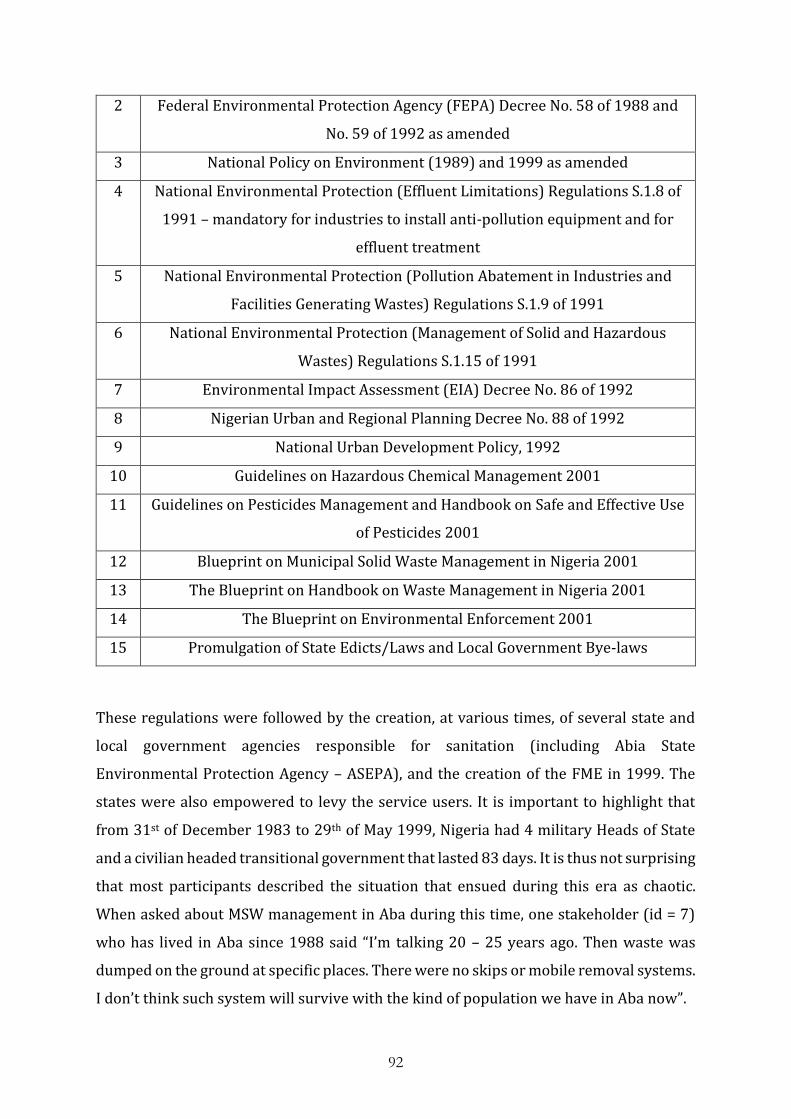
92
2 Federal Environmental Protection Agency (FEPA) Decree No. 58 of 1988 and
No. 59 of 1992 as amended
3 National Policy on Environment (1989) and 1999 as amended
4 National Environmental Protection (Effluent Limitations) Regulations S.1.8 of
1991 – mandatory for industries to install anti-pollution equipment and for
effluent treatment
5 National Environmental Protection (Pollution Abatement in Industries and
Facilities Generating Wastes) Regulations S.1.9 of 1991
6 National Environmental Protection (Management of Solid and Hazardous
Wastes) Regulations S.1.15 of 1991
7 Environmental Impact Assessment (EIA) Decree No. 86 of 1992
8 Nigerian Urban and Regional Planning Decree No. 88 of 1992
9 National Urban Development Policy, 1992
10 Guidelines on Hazardous Chemical Management 2001
11 Guidelines on Pesticides Management and Handbook on Safe and Effective Use
of Pesticides 2001
12 Blueprint on Municipal Solid Waste Management in Nigeria 2001
13 The Blueprint on Handbook on Waste Management in Nigeria 2001
14 The Blueprint on Environmental Enforcement 2001
15 Promulgation of State Edicts/Laws and Local Government Bye-laws
These regulations were followed by the creation, at various times, of several state and
local government agencies responsible for sanitation (including Abia State
Environmental Protection Agency – ASEPA), and the creation of the FME in 1999. The
states were also empowered to levy the service users. It is important to highlight that
from 31st of December 1983 to 29th of May 1999, Nigeria had 4 military Heads of State
and a civilian headed transitional government that lasted 83 days. It is thus not surprising
that most participants described the situation that ensued during this era as chaotic.
When asked about MSW management in Aba during this time, one stakeholder (id = 7)
who has lived in Aba since 1988 said “I’m talking 20 – 25 years ago. Then waste was
dumped on the ground at specific places. There were no skips or mobile removal systems.
I don’t think such system will survive with the kind of population we have in Aba now”.
93
According to Chukwuemeka et al (2002), corruption in Nigeria manifests in several forms
including, but not restricted to, inflation of official contract fees, dolling out of public
funds to political allies and cronies in the guise of contracts, kickbacks on public
procurements and outright embezzlement of public funds. Many participants in this
study narrated how corruption and nepotism slowly but steadily grew through the
military regimes to the point now where it pervades the entire public service. It is
corruption that the participants blame for the dilapidation in infrastructure. Many argued
that with the diversion of public money into private purses, the existing infrastructures
were left to rot away as they were not maintained. It is not difficult to see why corruption
is also blamed for the loss of discipline and disillusionment of both public sector workers
and members of the public as reflected in the following responses by participants. When
asked how the MSW management situation has changed in the last 20 years, one
participant (id = 9) said “It has gotten much worse. There was a time this street was being
swept by road cleaners. Now, from year to year, nothing; 5 years, nothing. It is like this
because the present democracy that is almost 20 years has no program, no positive and
practical program. They may claim to have ASEPA and what have you, but they are all
empty claims that can be likened to building a house without foundation” while another
(id = 28) added “Before I get into that, the whole country is in a mess. Salaries are not
being paid and morale is very low. Most staffs now call in sick and you cannot force
anyone to work when they are sick”.
This period in review also saw the designation of every last Saturday of the month as the
monthly environmental sanitation day. This was enshrined in the national environmental
sanitation policy and was to be implemented by states and local governments. A
participant (id = 38), who functions as a senior government officer said “by policy there
is also a monthly environmental day every last Saturday of the month aimed at helping
get waste that was not properly disposed to the designated places”. As well-meaning as
an environmental sanitation day may seem, it appears to be an acceptance of the failures
in the system and an attempt to shift the responsibility to the service users. This will be
discussed further in section 2 under ‘Monthly Environmental Sanitation Day’. Table 4.5
below is a summary of the reasons given by the stakeholders for the poor state of MSW
management in Aba during this period.

94
Table 4. 5: Reasons given by Participants for poor state of MSW management between 1988 and 2013
Reason Responsibility
Absence of strong, purposeful leadership The government, policy
makers
Proliferation of corruption All stakeholders
Inadequate funding The government, policy
makers
Dilapidating infrastructure and MSW management
equipment
The government, policy
makers
Absence of a clear focused policy on MSW
management
The government, policy
makers
Indiscipline and indifferent attitude All stakeholders
Dearth of support groups All stakeholders
Indiscriminate dumping of refuse Service users
Oppression and apparent state of despair The government, policy
makers
4.1.3 Period 3 - During Ikpeazu’s tenure as DGM, ASEPA Aba Zone (The era of
Adhoc remediation)
Okezie Ikpeazu is the current governor of Abia State. He holds a PhD in Biochemical
Pharmacology and was appointed Deputy General Manager (DGM) of ASEPA Aba Zone in
June 2013 by the then governor of Abia State. A position he resigned in October 2014 to
become a gubernatorial candidate.
Part of the outcomes of the decay period preceding this was the creation of ASEPA.
Analysis of the data collected during this study shows that ASEPA has the overall mandate
of managing MSW in the entire State. It was also put under the direct supervision of the
state governor, who appoints members of the Abia State Environmental Protection
(ASEP) Board with very little oversight function. The entire state was divided into 2 zones
– Aba and Umuahia (the 2 main cities in the state). These zones covered the adjoining
environs too. Consequently, MSW management was no longer a responsibility of the local
governments. It also meant that the Ministry of Environment was no longer responsible
95
for MSW management in Abia State. ASEPA, current structure and the implications of this
structural change are discussed further in section 4.2.
In his position as the DGM of ASEPA Aba Zone, Ikpeazu could be said to be responsible
for MSW management in Aba. According to the feedback from relevant stakeholders, with
his senior management staff, the DGM was expected to set the zone’s strategic focus and
operational processes. He controlled the revenue and could hire and fire staff for the
zone. While he was expected to report to the governor on a monthly basis, he only really
had recourse to the governor if his zone needed more funds. Several participants
narrated that at this time; refuse heaps occupied even major streets in the city for
upwards of 2 weeks before they were eventually evacuated. The mandate was clear.
With the city almost overrun by refuse and the stake so high, Ikpeazu (and his team)
embarked on several remedial approaches to save the city from the menace of MSW.
Some of these measures included irregular street to street collection services; sustained
evacuation of refuse from unofficial dumpsites and the introduction of secondary refuse
collection points (skips) and heightened monitoring and enforcement activities. When
asked for a personal opinion on MSW management in the city, a participant (id = 33)
responded thus “I think ASEPA has lost total control compared to when the present
governor was the head of ASEPA. In my street, people dump waste on the street because
there is no designated point nearby (the closest is over 2 miles away). Some people dump
in the gutter and others use any bush close to them”. When asked what was different in
how waste was managed when the present governor (Ikpeazu) was the head of ASEPA
and now, the stakeholder continued thus “there was street collection service. People
eagerly awaited those ASEPA vehicles as if they were celebrities. The environment was
cleaner and people were happy”. Another participant (id = 30) enthused “I have lived all
my life here in Aba the exception being when I was studying. I have practiced here (as a
legal professional) for about 12 years. There was a time it (the MSW management
situation) was very bad. Those days, Aba was known as ‘Aba dirty’ but since the present
governor served as ASEPA boss, I won’t say they have fallen much short”. A participant
(id = 42), who functions as senior member of staff at the agency (id = 42) added “before
the present governor’s tenure as the DGM ASEPA Aba, refuse dumps used to take over
almost all the major roads in Aba including Asa Road, and they will be there 2 or 3 days
before they are carted away. Now, those heaps get removed on daily basis.

96
It is important to point out that Ikpeazu’s approach to MSW management in the city was
mainly adhoc. The comments lend credit to this position too. It could be argued that the
approach was suitable at the time as it proved successful. That much is recognised and
appreciated by stakeholders going by the following participant responses: (id=4) “The
best has not been given with respect to waste management in Aba. A huge success was
recorded when the present governor was the ASEPA manager. Waste is no longer being
carted away appropriately as it used to be. Waste receptacles are getting overfilled and
more wastes dumped on the ground”. He continued: “That man was always in the field
and he gained popularity from what he did as head of ASEPA. That’s partly why he became
the governor. Now he’s the governor, he may not know what goes on in the field. We need
to find out if the problem is coming from ASEPA as a sector or from the centre (state
government)”.
However, the underlying problems inherited from the previous period including
corruption, dilapidated infrastructure, indiscipline, etc. remained and that perhaps partly
explains why the success recorded during that period has not been sustained to date.
Table 4.6 below summarises the reasons given by participants for the improved state of
MSW management in Aba during the era in review.
Table 4. 6: Reasons for improved state of MSW management in Aba during the adhoc remediation era
Reason Responsibility
Purposeful leadership The government, policy makers
Improved monitoring, enforcement and
deterrence
The government, policy makers
Improved staff discipline and morale The government, policy makers
Public compliance and goodwill Service users
4.1.4 Period 4 - After Ikpeazu’s tenure till date (The era of Oppression)
The current leadership of ASEPA continued with the basic operating processes
introduced during Period 3 with a few minor tweaks such as the introduction of a time
restriction to when refuse can be dumped at the secondary collection points (skips) and
the introduction of bin bags which the service users are expected to buy from the agency.
They have also expanded the role of the agency staff to include such duties as health

97
education and abatement of nuisances – roles which are also in the primary remit of
EHOs. This is discussed in more details in section 4.2.
Surprisingly, or rather unsurprisingly based on some of the previous comments by
stakeholders, the agency has not lived up to the expectation of the people and that is not
because the expectations are unreasonable. There are serious accusations of nepotism
and corruption, ineptitude, gross inefficiency and even oppression levelled against the
current leadership of the agency. One participant (id=41), who functions as a senior
member of staff of the agency said “The salaries we receive are not even what we are paid
on paper – I can tell you that those receiving twenty thousand naira (#20,000.00) are
recorded as fifty thousand naira (#50,000.00) on paper. You can ask anyone who knows
the inner working here. The level of corruption is untold”. The researcher was also
authoritatively informed that in one department at the agency, there were 35 to 40 names
of staff on that department’s payroll, that are paid regularly but do not turn up for work.
When the researcher enquired if those people can be called ‘ghost workers’ (a common
term used in Nigeria to describe staff that draw salaries but do not carry out their duties),
there was great laughter first and then the participant responded thus: “we are not saying
they are ghosts, they come and take their salaries but they don’t work. I am just giving
you true information. I can be fired tomorrow but the truth has to be told”.
On the service front, the researcher noted that all the gutters observed in the city were
filled with refuse. Indiscriminate dumping was rife and there were no refuse bins at
strategic points for use by the public. Consequently, odour nuisance and vermin
infestation was of obvious concern. Pictures 3 and 4 below are original images captured
by the researcher in the city.

98
Picture 3: A Refuse-blocked gutter near Aba Main Park [Credit: Researcher]

99
Picture 4: Indiscriminate dumping of refuse and dilapidated road in Aba [Credit: Researcher]
Many participants decried the current state of MSW management in the city. Many
condemned the introduction of time restrictions while others lamented over the few
number of designated secondary collection points (skips) available. The biggest issue
though for the participants was the apparent lack of service provision on the part of the
agency even after collecting multiple levies supposedly meant for such services. All the
traders in the markets and malls that were interviewed stated that they paid between
one thousand (#1000.00) and three thousand Naira (#3000.00) annually for sanitation
and because the agency does not provide the service paid for, they have to pay informal
waste pickers each time they hand over their waste to the pickers. Some say they pay as
much as two hundred (#200) daily depending on the quantity of waste they hand over.
The story was the same for all the service user groups interviewed. The situation meant
that most participants felt oppressed by the agency in particular and the government in
general. Table 4.7 below is an excerpt from stakeholders’ responses.

100
Table 4. 7: Excerpt of Participant Responses – Era of Oppression
Participant id Comments
45 “Government contracts the revenue collection to individuals but the
worst part is that once they collect the revenue, they disappear. You
are left to pay private people to dispose your waste”.
“Government is just using the waste management portfolio to
generate funds from the masses. They do not understand what it
takes to provide the waste management services needed”.
48 See, when I pay for electricity bill, I expect electricity supply every
day. Likewise, when I pay for sanitation, I expect service from them
(ASEPA). That’s all; nobody is asking them for favours.
47 “There was a time ASEPA used to go round with their truck and
people will be throwing their waste into the trucks. At least, that was
service everyone could see. Now they tell you they have some
buckets somewhere and you have to take your waste there. For us
here, I cannot leave my work to go and throw my refuse there
because it is far”.
“They usually come in a very terrible way – with police and even
thugs and they will apprehend everyone they find in the vicinity. All
those people (apprehended) will bail themselves and also pay the
levy”.
49 “The truth is that if it is a government that has respect for people’s
right, they will seek the views and opinions of people in this market.
But this government don’t care; they just enforce whatever they
decide”.
“We know this government; they are just after their pockets”.
44 Traders pay #1000 per shop to ASEPA for waste management
through the market’s task force on sanitation but ASEPA does not
provide any service so traders spend even more money, #100 to
#200 weekly to dispose their waste through informal waste pickers
43 “You get nothing for the #1000 but you have to pay it”.
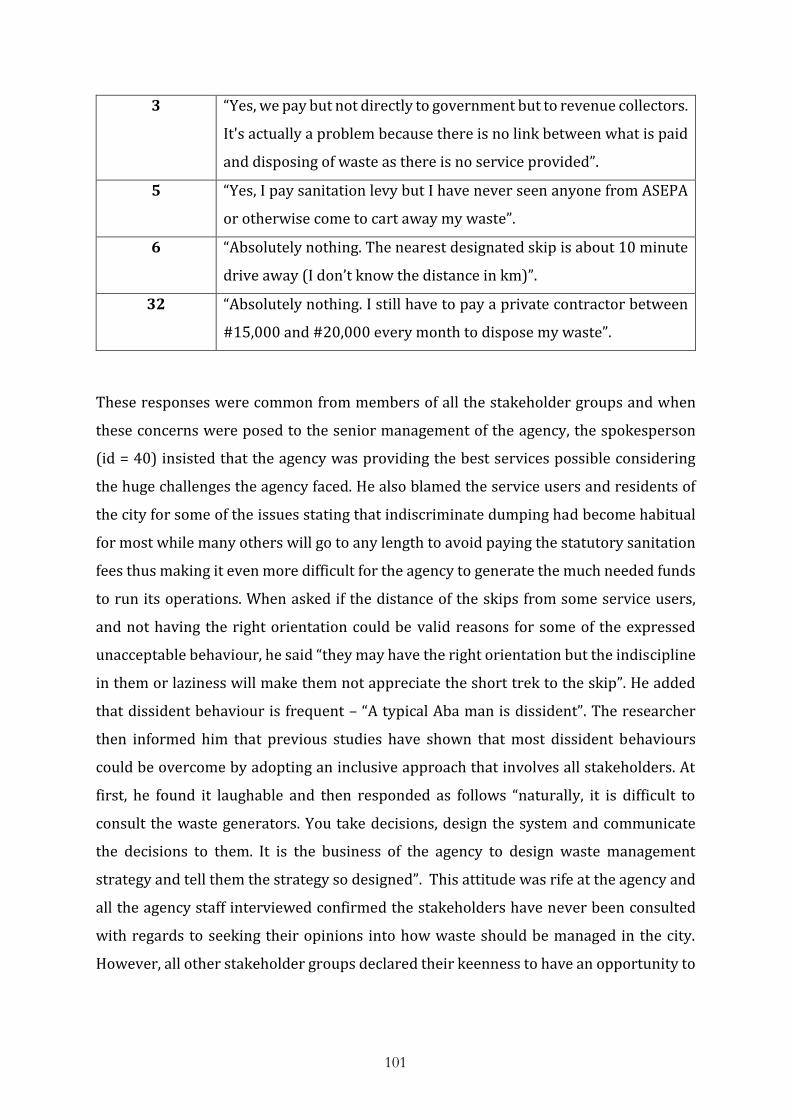
101
3 “Yes, we pay but not directly to government but to revenue collectors.
It's actually a problem because there is no link between what is paid
and disposing of waste as there is no service provided”.
5 “Yes, I pay sanitation levy but I have never seen anyone from ASEPA
or otherwise come to cart away my waste”.
6 “Absolutely nothing. The nearest designated skip is about 10 minute
drive away (I don’t know the distance in km)”.
32 “Absolutely nothing. I still have to pay a private contractor between
#15,000 and #20,000 every month to dispose my waste”.
These responses were common from members of all the stakeholder groups and when
these concerns were posed to the senior management of the agency, the spokesperson
(id = 40) insisted that the agency was providing the best services possible considering
the huge challenges the agency faced. He also blamed the service users and residents of
the city for some of the issues stating that indiscriminate dumping had become habitual
for most while many others will go to any length to avoid paying the statutory sanitation
fees thus making it even more difficult for the agency to generate the much needed funds
to run its operations. When asked if the distance of the skips from some service users,
and not having the right orientation could be valid reasons for some of the expressed
unacceptable behaviour, he said “they may have the right orientation but the indiscipline
in them or laziness will make them not appreciate the short trek to the skip”. He added
that dissident behaviour is frequent – “A typical Aba man is dissident”. The researcher
then informed him that previous studies have shown that most dissident behaviours
could be overcome by adopting an inclusive approach that involves all stakeholders. At
first, he found it laughable and then responded as follows “naturally, it is difficult to
consult the waste generators. You take decisions, design the system and communicate
the decisions to them. It is the business of the agency to design waste management
strategy and tell them the strategy so designed”. This attitude was rife at the agency and
all the agency staff interviewed confirmed the stakeholders have never been consulted
with regards to seeking their opinions into how waste should be managed in the city.
However, all other stakeholder groups declared their keenness to have an opportunity to

102
give their opinions and contribute to the design of the MSW management process of the
city. The issue of power relations and inclusivity is discussed in more detail in Chapter 6.
In light of the responses received from participants and what was observed in the city, it
is justifiable to say that most of the problems described in Period 2 (the era of decay) still
persist to date. One may argue that there is a clear policy in that all the stakeholders that
responded knew their responsibilities in terms of the requirement to take their waste to
the skips and perhaps more importantly, the need to pay their levies. What is also obvious
is that the policy is not working. With very few designated points, the distance to a skip
is far and inaccessible to most service users. The poor state of local roads and the absence
of use of standard temporary storage bins compound the problem of accessibility to
service users. Consequently, participants’ assessments of the agency were scathing and
understandably so. Table 4.8 below summarises the stakeholders’ reasons for the current
state of MSW management in Aba.
Table 4. 8: Reasons given by Participants for the current poor state of MSW management in Aba
Reason Responsibility
Pervasive level of Corruption The government, Policy
makers
Lack of Enforcement and high levels of indiscipline All stakeholders
Unsuitable MSW management policy The government, Policy
makers
Oppression and apparent state of despair The government, Policy
makers
Dilapidated infrastructure and equipment The government, Policy
makers
Indiscriminate dumping of refuse All stakeholders
Poverty, poor awareness and general lack of
information
All stakeholders
4.1.5 Summary
In an attempt to carry out a review of the history and contexts of MSW management in
Aba, stakeholders’ responses were used to identify four (4) key periods/timelines with

103
unique characteristics that could be of immense benefit in understanding, and perhaps,
contribute to solving the current problems of poor MSW management in the city.
Analyses of the stories told by stakeholders in the city reveal the crucial role of a strong
and focused leadership in achieving good MSW management. This agrees with previous
reports from cities such as Ghorahi (Nepal), Kunming (China) and Bangaluru (India),
where strong and committed leaderships and genuine citizens’ participation in the
design, implementation and evaluation of MSW management processes helped overcome
financial constraints. The stories and responses from participants also highlighted the
negative impact of pervasive levels of corruption and nepotism, dilapidated
infrastructure and equipment, and loss of discipline and morale on the state of MSW
management in Aba. Most of the challenges of MSW management in the city today, it is
safe to say, are historic and the genesis could be traced back to mid or late 1980s.
Throughout the period in review, the approaches to MSW management have remained
rudimentary – predominantly involving the evacuation of refuse from one point to
another without any form of treatment or processing. Recent efforts at achieving a better
or acceptable level of MSW management can be best described as palliative as most of the
historical problems and challenges have either been overlooked or ignored by the
government and policy makers. Table 4.9 below summarizes the different eras reviewed.
Table 4. 9: Summary of the different Eras of MSW management in Aba
Era Mbakwe (Era of
stability)
After Mbakwe (Era of decay)
Okezie Ikpeazu as
DGM ASEPA Aba zone
(Era of adhoc remediation)
Current (Era of
oppression)
Time period Post-colonial to 1988
1988 to May 2013
June 2013 to October 2014
November 2014 to date
Positives Strong, committed
and focused leadership;
Support groups;
Discipline
None Strong leadership,
commitment, monitoring
and enforcement
Willingness of service users to
pay; clear mandate
Negatives Rudimentary systems of
MSW management
Indiscipline; proliferation
of corruption;
Adhoc approach; underlying
Oppression of the masses;
Corruption; nepotism;

104
lack of leadership
problems not tackled
unprofessionalism; indiscipline and
lack of commitment
CHAPTER FIVE
Current Realities and Challenges of MSW Management in Aba
5.0 Introduction
In chapter 3, the researcher presented a list of researcher observations and interview
questions that were devised to ensure the aims of this research were achieved. These are
shown in Tables 3.2 and 3.3 (pp. 70 and 71 respectively). These questions and probes
were designed to cover all areas of MSW management as shown in the ISWM framework
(Figure 2.4, pp.29) and linked to specific aims and objectives of this study. This chapter
addresses the first aims and objectives of this study (pg.7).
5.1 Current realities and Challenges of waste collection, disposal and treatment
The ISWM framework is further simplified into the ‘two overlapping triangles’ analytical
framework shown in Figure 2.5 (pp.29). Clearly, collection, treatment and disposal are
covered in the first triangle – physical.
However, before presenting the current realities and challenges, the next section will
present further details of the agency responsible for MSW management in the city and
the current MSW management process. The purpose is to highlight what the ideal process
entails so as to contrast it with the realities on the ground.
5.1.1 ASEPA Aba zone, Key Officers, Structure and Operation
As mentioned in section 4.1.2, part of the steps taken to curb the declining state of
environmental cleanliness and MSW management in Nigerian cities was the setting of
environmental protection and refuse management agencies at state levels (FME 2005).
Data collected during this research confirms that ASEPA has the full responsibility of
MSW management in the state, and unlike in other states in Nigeria such as Lagos, where
the environmental protection and MSW management agency is under the ministry of
environment (Nzeadibe and Ajaero 2010), ASEPA is directly under the office of the
executive governor of Abia State. As mentioned in section 4.1.3, Figure 5.1 shows that the
DGM has the overall control of the day to day running of the agency in the zone. The ASEP
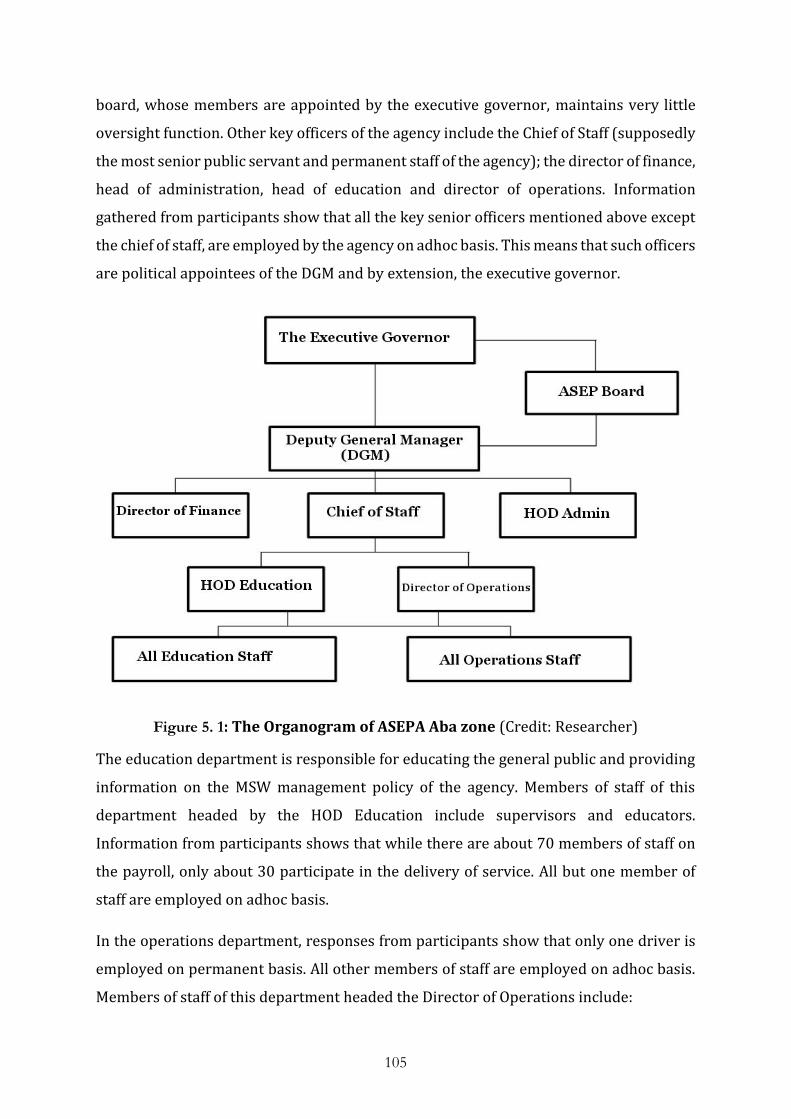
105
board, whose members are appointed by the executive governor, maintains very little
oversight function. Other key officers of the agency include the Chief of Staff (supposedly
the most senior public servant and permanent staff of the agency); the director of finance,
head of administration, head of education and director of operations. Information
gathered from participants show that all the key senior officers mentioned above except
the chief of staff, are employed by the agency on adhoc basis. This means that such officers
are political appointees of the DGM and by extension, the executive governor.
Figure 5. 1: The Organogram of ASEPA Aba zone (Credit: Researcher)
The education department is responsible for educating the general public and providing
information on the MSW management policy of the agency. Members of staff of this
department headed by the HOD Education include supervisors and educators.
Information from participants shows that while there are about 70 members of staff on
the payroll, only about 30 participate in the delivery of service. All but one member of
staff are employed on adhoc basis.
In the operations department, responses from participants show that only one driver is
employed on permanent basis. All other members of staff are employed on adhoc basis.
Members of staff of this department headed the Director of Operations include:

106
Operators - those who operate the different equipment such as compactors, pay-loaders,
excavators, roll-off trucks, etc.
Road Sweepers – those who sweep the streets.
Evacuators – those who follow the trucks, tippers and compactors.
Bucket Minders – those stationed at every designated point (skip) to ensure no refuse is
littered round the bucket and to close the bucket when it is full. The closing of the bucket
means using ropes to tie around the bucket (see picture 10, pg. 121), signalling that more
refuse should not be dumped into it.
Mechanics – those who repair and service the vehicles, machinery, equipment, etc.
Supervisors – they supervise the evacuators and bucket minders.
According to the information obtained from participants, the agency also engages 27
contractors called ‘revenue consultants’ (RCs). Each revenue consultant manages one
zone and each zone is an area of the city without accessible road. As well as collecting
revenues from residents in each zone, each contractor is in principle, required to organise
and effect the evacuation of refuse from their zone. Analysis of the data collected shows
that the current MSW management policy implemented in the city by ASEPA is a 2-stage
process that should work as shown in Figure 5.2 below.

107
Figure 5. 2: Ideal working of current MSW process in Aba (Credit: Researcher)
Figure 5.2 shows how the current MSW management process implemented by ASEPA Aba
zone should ideally work. In the words of one of the participants (id = 40), who functions
as a senior officer at ASEPA, “government provides buckets placed at several points
(secondary collection points), where experience has shown that waste generation is high.
The people are required to take their waste to the points and government will evacuate
these buckets to the dumpsites”. Another participant (id = 39), who functions as an
assistant in the governor’s office added “by policy, there is also a monthly environmental
day every last Saturday of the month aimed at helping get waste that was not properly
disposed to the designated places”. Various participants from the TGGO stakeholder
group confirmed that ASEPA sells each plastic waste bag for fifty Naira (#50.00) and
residents in areas with designated points are expected to bag their waste before
depositing same at the skip while the RC for each of the 27 zones in areas without
accessible road is expected to collect the bagged waste from residents in their zone. In
reality, the situation is different as shown in the following sections in this chapter.

108
5.1.2 Realities and Challenges related to Waste Generation
Several factors have been found to affect the quantity and composition of waste
generated in a city. In a study in the city of Dar-es Salaam in Tanzania, Senzige et al (2014)
found it to be highly dependent on population and socioeconomic status of the residents
of the city. Other commonly reported factors include income level, education level,
household size, cultural patterns, personal attitudes, the cost and frequency of MSW
management service, etc. (Afroz et al 2011; Al-Momani 1994; Grossmann et al 1974).
Therefore broadly speaking, population, socio-economics and government policy on
MSW management are key determinants of waste generation.
5.1.2.1 Population
The official gazette of the Federal Republic of Nigeria (FRN) released in 2009 for the 2006
National Population Census (NPC) puts the population of Aba (Aba North and South) at
534,265 (FRN 2009). Like for every other useful metric, it is difficult to get an official
population figure of the city that is reliable. However, most estimates put the current
population of Aba Urban (comprising Aba north and south and parts of Obingwa and
Osiosioma Ngwa areas) at well above One million. However, the World Population
Review (2018) puts the figure at 897,560. This figure is justifiable and conservative
considering that the World Bank annual population growth rate for Nigeria has averaged
a little over 2.6 since the last census of 2006 (The World Bank 2018).
For someone who lived in Aba for a long time, the increased population density is almost
palpable. This much is also supported by various responses from participants in the
previous chapter (4) that blamed the worsening state of MSW management on the
increased population of the city. On the other hand, while a visual check on the state of
the environment suggests a similar rise in the quantity of waste generated, there are no
records to back up this viewpoint. The agency claims the amount of waste they evacuate
has continued to rise as estimated by the number of skips they have to evacuate daily.
Table 5.1 below show responses from 2 senior officers of the agency (ASEPA) when asked
if they had records of quantity of waste generated or evacuated in the city:
Table 5. 1: Excerpt from Stakeholders’ Response on Waste Generation Data in Aba
Participant
id
Comments

109
40 I am very sure Aba generates well over a thousand metric tonnes of
waste daily. Each of our buckets (secondary collection point) is 30
tonnes and we evacuate 30 to 35 buckets daily
42 No, we don’t have records but we have about 30 receptacle points,
each weighs about 10 tonnes, which we cart away every day and some
receptacles are emptied about 2 or 3 times daily.
These estimates differ markedly and consequently are not reliable bases for adopting a
position on the subject matter. There is also no historic data to compare with so as to
ascertain the implication of the obvious increases in population on the waste generation.
However, it is not uncommon to assume that the waste generation amount will be on the
increase considering that there are no efforts e.g. government policy aimed at preventing
such trend. This situation aligns with previous reports that MSW generation in Nigeria
grows at a faster rate than MSW management agencies can cope (Muhammad and Salihi
2018; Ogwueleka 2009).
5.1.2.2 Socio-economics
Several socio-economic factors that affect waste generation have been listed in 5.1.2
above. Like in most cities around the world, service usage for MSW management services
in Aba is billed per household (and per shop in markets). But like for population, reliable
data on the number of households and average size of households in the city is also
unavailable thus making it difficult to estimate the waste generation rate using this
indicator. In developed cities around the world, there are certain inherent processes in
the system that helps city councils ascertain the number of households in the area such
as registration for medical services, council tax, school places, etc. Even landlords and
letting agencies provide relevant details of new tenants to the councils. In Aba, and many
other cities in Nigeria, these processes are not present in the current systems thus making
it almost impossible to keep a record of that nature.
Income levels are also an important determinant of waste generation. Majority of the
residents of the city are artisans and traders. It is difficult to ascertain the income levels
of this group of people as there are no processes intrinsic in the system to encourage such
110
declaration as is the case with civil servants or other salaried employees. There are also
low cadre civil servants and other salaried workers in the city, but their incomes are
generally low considering that minimum wage is a paltry Eighteen Thousand Naira
(#18,000.00 per month). However, going by the feedbacks received and all indicators
observed, it is safe to say that majority of the residents are on very low incomes. A
participant (id = 22) who functions as a practicing private solicitor in the city had this to
say “They have so impoverished us that every other average man you see in Aba is a poor
man, including myself. In Aba, out of 100% of the population, I make bold to tell you that
98% are poor”. He went on to explain with valid scenarios of minimum wage, salaries of
sitting magistrates and average family earnings. Most salaried workers in the city
especially those in public employment also lamented the irregular receipt of their
salaries. Most workers stated they were owed an average of 5 months salaries.
Previous studies established that high income levels usually translated to higher waste
generation rates (Senzige et al 2014). This is also supported by the I=PAT equation;
where
I = Impact (Waste generation is an impact)
P = Population
A = Affluence; and
T = Technology
Therefore, in the case of Aba, affluence cannot be considered a stand-alone contributing
factor to the increasing quantities of waste generated.
5.1.2.3 Government Policy
In 2015, a policy paper by the Department for Environment Food & Rural Affairs (DEFRA)
also known as the Environmental Agency stated that about 177million tonnes of waste
was generated every year in England alone. The paper went on to say that the situation
demonstrated a poor use of resources that was costing businesses and households’
money (DEFRA 2015). In order to help people and organisations leverage on the
opportunities to save money by reducing waste, the government published a Waste
Prevention Programme for England. The programme set out to, amongst other things,
“encourage businesses to contribute to a more sustainable economy by building waste

111
reduction into design, offering alternative business models and delivering new and
improved products and services” (DEFRA 2015). Other policy measures by government
to encourage waste minimisation in the UK includes promotion of waste minimisation
clubs, education of households, landfill tax and service usage billing based on the quantity
of waste generated (Ezeah 2010; Clarkson et al 2002).
It is important to distinguish between pre-consumption and post-consumption waste
minimisation here. Cox et al (2010) defines pre-consumption waste minimisation as
‘strict avoidance’. This involves a conscientious effort to avoid producing waste in the
first instance. At consumer levels, it could involve steps like reusing shopping bags,
mending old clothes and reusing them instead of buying new ones, preparing the correct
quantities of food as at when needed to avoid waste, etc. At manufacturing levels, it
includes redesigning products to ensure durability, reducing the amount of packaging or
using more efficient systems in manufacturing. Arguably, material recovery would be
easier and more profitable if the products were designed bearing in mind their next stage
following use (Rodic et al 2010). On the other hand, post-consumption waste
minimisation includes steps such as composting, donating old stuffs and recycling (Diaz
and Otoma 2013). Government policy is particularly essential if required changes are to
be made at manufacturing levels.
However, in Nigeria the National Environmental Sanitation Policy (FME 2005) does not
mention pre-consumption waste minimisation in particular nor consider any form of
waste minimisation as a strategy for MSW management. Consequently, there are no
provisions for states and or local governments, whose responsibility it is to implement
the policy, to pursue waste minimisation. This apparent lack of policy direction towards
the minimisation of waste was also confirmed in the interviews with one of the most
senior government officers responsible for MSW management in the state and a senior
management staff of ASEPA as shown in the following conversations:
Table 5. 2: Excerpt of Participants’ Responses on Waste Minimisation
Question Answer
Participant id = 39
Are there policies geared towards
encouraging people to reduce the
The people lack the necessary understanding
because the people see waste management as

112
amount of waste they generate?
Obviously, this will reduce the
quantity of waste the government
(ASEPA) will have to manage, and as
you mentioned it’s costing the
government a lot to manage.
the responsibility of the government.
However, behavioural change, including
waste minimisation and placing some value
on the waste generated is something the
governor is looking at. It is something I have
also advocated for since I’ve been here.
Participant id = 40
Moving forward, what is the goal of the
agency? What does the agency hope to
achieve in the next 12 – 18 months?
What else except to give the city a good waste
management service. Until we can recycle
waste, we have not arrived yet.
So the ultimate goal is to start
recycling of waste?
Yes, granted that the waste collection and
evacuation processes have been perfected.
We are looking at the proposals for recycling.
With the senior management staff of the agency (ASEPA), the researcher had to explain
the concept of waste minimisation and how it offers a better MSW management option
than recycling which is seen as the ultimate goal by ASEPA.
Further chats with staff of ASEPA and EHOs showed a deeper problem than the feedbacks
above perhaps suggests. All the staff interviewed had no knowledge of waste
minimisation.
The current billing system for MSW management services (sanitation fees) does not also
take into account the quantity of waste generated by a service user. This is also
understandable as there are no strategies for enforcing such regulations in the current
system. However, there appears to be a lesson to be learned from the operations of the
informal waste pickers who charge users based on the quantity of waste they hand over
as described in 5.1.4 (realities and challenges related to waste collection).
5.1.3 Realities and Challenges related to Waste Separation
Source separation or sorting of waste is commonly regarded as a key step to minimising
waste and enhancing recycling and disposal efficiency (Kuusiola et al 2012; Zhang et al
2012). In 2008, certain municipalities in Japan separated waste into over 25 categories
(Matsumoto 2011). However, the simplest waste separation or sorting system at source

113
involves separation into two (2) categories – biodegradables (organic) and non-
biodegradable (inorganic) (Agarwal et al 2015). Again, several factors have been found
to affect the waste separation behaviours of residents. In Suzhou, China, Zhang and Wen
2014 reported the main determinants of residents’ source separation of solid waste to be
age, availability of source separation facilities and government preferential policies
aimed at encouraging source separation. A similar study in Shanghai reported similar
findings and also restated the importance of effective communications between the
government and local residents in ensuring the success of waste separation at source
(Zhang et al 2012). The study also reported the importance of pilot studies in
communities prior to rolling out such programmes.
Currently, in Aba (and Abia State in general), there is no official policy on source
separation of waste in operation. Fortunately, there appears to be a fair level of optimism
amongst stakeholders and service users going by this excerpt from interviews in Table
5.3 below.
Table 5. 3: Excerpt of Interviews with Stakeholders on Waste Separation
Question Interview
Participant id = 1
Do you have access to
standard bins or any kind of
bin at all?
Yes, obtained through connections at ASEPA. It is not
affordable for households. Trash bags and bins are
stashed in a room at ASEPA office as people are not
buying
So everything you generate
as waste goes in there? Do
you separate it?
No separation. I knew you will ask me that question. And
everything (waste) they (ASEPA) pack (evacuate) ends
in the landfill along Umuahia express road. Sometimes,
it spills out taking over an entire lane along the express
way
Participant id = 2
We’ve been going back to
the government for almost
everything so far. What
about the people? How
I have some knowledge of waste separation and waste
hierarchy. I know that in western states (meaning
developing countries), recycling is common but here,
the government has not come to appreciate the need for

114
would you rate your own
knowledge of modern waste
management practices such
as separation and waste
hierarchy?
such practices and so the people have not done too.
Government need new policies to initiate and encourage
these changes. New conservation actions, activities and
policies are needed and you’ll see people motivated to
take up these new practices.
Participant id = 5
So how do you manage your
waste?
Luckily, I have a good space behind my building so I use
it to separate my waste. I burn off the combustibles,
throw the degradable into my garden to decay and serve
as manure, and send the rest of the stuff like tins away.
It is also noteworthy to highlight the contribution and role of itinerant waste pickers and
buyers who transverse the length and breadth of the city collecting and buying wastes of
value from residents. Some of the most common types of valorised waste collected in Aba
by these people include cardboard paper, waterproof sheets, plastic bottles, drink cans
and other metals such as aluminium, copper, etc. After collection, most of these materials
are sold on to middlemen who in turn retail them to individuals or small scale local
manufacturers who predominantly reuse the materials in packaging of their products.
The metals are mainly sold on to recycling companies by the middlemen.
There are also other groups of informal waste pickers that scavenge the dumps for wastes
of value. In Aba, this set of waste pickers have formalised associations and each
association is often stationed at a specific operating dumpsite. Anyone wishing to speak
to any member of the association on site (at the dump) must first get permission from the
leader of the group. The researcher also discovered that the waste pickers were subjected
to certain levies and registration formalities by the agency (ASEPA) who also enforces
certain strict confidentiality rules. The most common types of waste scavenged by this
group include leather, glass and plastic bottles, waterproof sheets, etc. and any other
material that a middleman may request to be scavenged by the waste picker. The price is
often agreed between the two parties and some form of deposit paid by the middleman
to secure the deal.
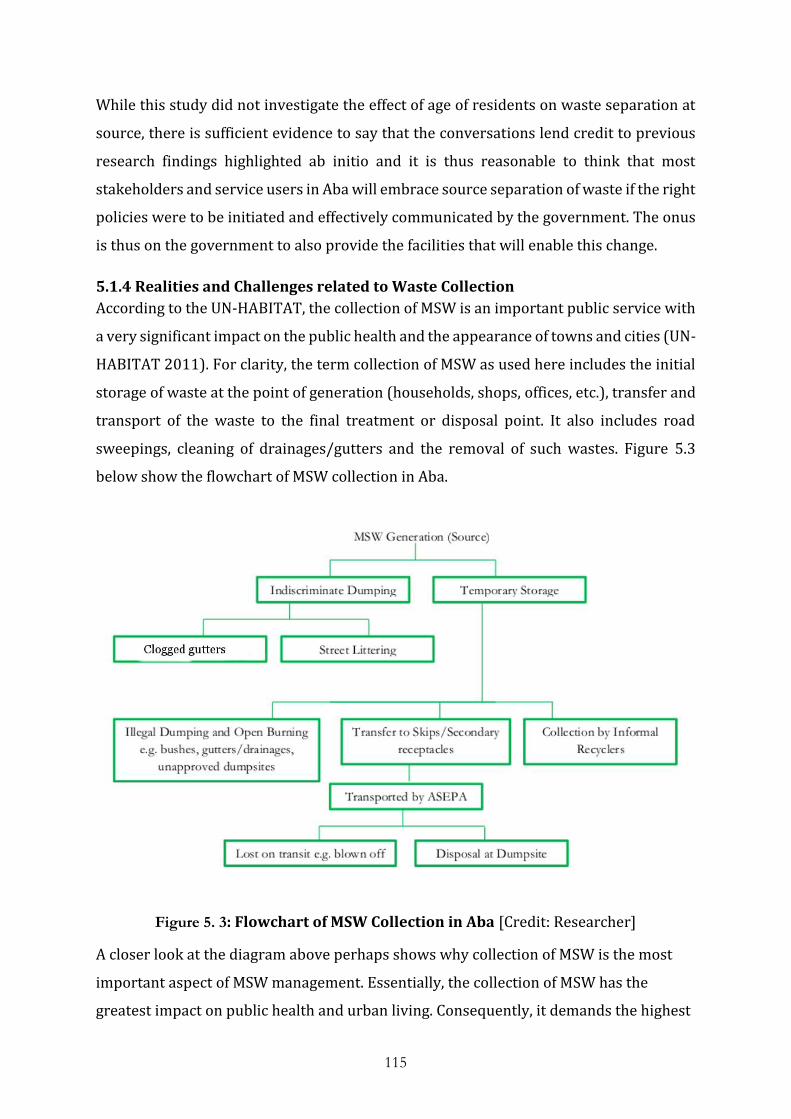
115
While this study did not investigate the effect of age of residents on waste separation at
source, there is sufficient evidence to say that the conversations lend credit to previous
research findings highlighted ab initio and it is thus reasonable to think that most
stakeholders and service users in Aba will embrace source separation of waste if the right
policies were to be initiated and effectively communicated by the government. The onus
is thus on the government to also provide the facilities that will enable this change.
5.1.4 Realities and Challenges related to Waste Collection
According to the UN-HABITAT, the collection of MSW is an important public service with
a very significant impact on the public health and the appearance of towns and cities (UN-
HABITAT 2011). For clarity, the term collection of MSW as used here includes the initial
storage of waste at the point of generation (households, shops, offices, etc.), transfer and
transport of the waste to the final treatment or disposal point. It also includes road
sweepings, cleaning of drainages/gutters and the removal of such wastes. Figure 5.3
below show the flowchart of MSW collection in Aba.
Figure 5. 3: Flowchart of MSW Collection in Aba [Credit: Researcher]
A closer look at the diagram above perhaps shows why collection of MSW is the most
important aspect of MSW management. Essentially, the collection of MSW has the
greatest impact on public health and urban living. Consequently, it demands the highest

116
budget allocation compared to any other aspect of MSW management (UN-HABITAT
2010a).
5.1.4.1 Indiscriminate Dumping/Littering
To someone visiting Aba urban for the first time, the first things of note experienced will
be the adverse smell in the air, the huge amounts of litter and debris on the streets and
drainages; and the seemingly haphazard noisy movement of people and motorists. Most
people on the streets appear to be in a hurry.
On a closer observation, it is not very difficult to find reasons for the situation. Accepted
that there are recidivists in Aba like in most other cities around the world, the basic
facilities and processes to prevent indiscriminate dumping/littering are lacking. All over
the city, there are no public waste baskets or bins. This situation is exacerbated by the
daily influx of people, mainly traders and shoppers, from neighbouring cities and states
who troop into the markets in Aba to purchase their wares. Most of these visitors often
eat on the move and it is common to see all kinds of litter being thrown off from moving
vehicles. The residents too are high on the practice as the researcher regularly observed
people throwing whatever they deemed waste unto the street or into the gutters. Even
members of staff of ASEPA were also observed to be on the act of indiscriminate dumping.
Aside the 4 major markets in the city – Ahia Ohuru (New Market), Ariaria, Cemetery and
Eke Oha (Aba Shipping Centre), there are shops and stalls in every nook and cranny of
the city. However, the researcher observed that the singular most contributory factor to
the alarming state of indiscriminate dumping/littering is the prevalence of street
hawking in the city. Hawkers are ubiquitous in Aba and they sell virtually everything from
rat poison to ‘pure water’. With the observed poor state of roads and the overcrowding
of the major streets in the city with slow moving vehicles and tricycles, Aba is a street
hawker’s paradise. The waste generated from these exchanges is predominantly
packaging materials and food waste. The waste continues to accumulate on the streets
and in the gutters pending the next monthly clean-up exercise which holds every last
Saturday of the month, when the waste is supposed to be evacuated to the dumpsites (see
Fig 5.2). Pictures 5 and 6 are original photos captured by the researcher of a typical street
and gutter/drainage respectively, in Aba.

117
Picture 5: Kent Street - a typical street in Aba with accumulated littering [Credit: Researcher]
Picture 6: A Gutter/Drainage along Aba-Owerri Road (Near Star Paper Mill) [Credit: Researcher]
The level of indiscriminate dumping/littering in Aba is so intense that some stakeholders
opined that residents prefer a dirty environment to a clean one. The notoriety of the city
of Aba as a dirty place and the usual reference to the inhabitants as people who prefer a

118
dirty place is one that has developed over time. It is thus historic (Odoemena and Ofodu
2016). The researcher has coined the term ‘Aba Syndrome’ to denote this commonly held
notion. Table 5.4 below shows some responses from participants supporting their views
on Aba Syndrome. Table 5.5 is an excerpt from the researcher’s observation note
following the observation of the activities of a street vendor of fresh vegetables near
Umungasi market in Aba, and together with Picture 7, which is a gallery of photos taken
by the researcher during the observation, provide first hand evidence of indiscriminate
dumping/littering in the city.
Table 5. 4: Participants views on indiscriminate dumping/littering
Participant id Comments
22 There are people called recidivists. For some, it’s habitual not to do
the right thing even if you provide the necessary conditions.
7 Also our people have formed the habit of indiscriminate littering
with little or no regard
41 Aba residents are very stubborn, not ready to learn and very
unwilling to corporate and they just mess up the environment. They
are terrible.
39 The people lack the necessary understanding because the people
see waste management as the responsibility of the government.
The truth is that the societal behaviour we have here will make
London as dirty as you see Aba. An average man here does not care
how they manage their waste. You’ll observe people throw their
waste indiscriminately.
45 I think it’s difficult for people to avoid indiscriminate littering
because it is not something they were taught as kids. It has almost
become a norm to most people.
40 A typical Aba man is dissident in nature
They may have the right orientation but the indiscipline in them or
laziness will make them not appreciate the short trek to the skip
Table 5. 5: Observation note of a street vendor of fresh vegetables in Aba

119
Trader had her stock in a basket on a bicycle
Buyers separated the leaves from the vegetable stem and dropped the stems on the
street
There were several openings on the drains that posed great risk as people could easily
fall inside the gutter through them
Suddenly a task force appeared and tries to confiscate the trader’s goods. The trader
and the buyers ran away with the goods
A member of the task force was stood by the spot and yelled instructions at the trader
to stay inside the market and not on the street
The trader soon returned to gather the refuse from her earlier activities together but
she did not pack the refuse away. The refuse remained on the street
The trader finished selling her vegetables and left without evacuating the refuse she
had earlier gathered together

120
Picture 7: Gallery of photos for the observation of a street vendor [Credit: Researcher]
Whereas all the participants from the TGGO stakeholder group blamed the notion of Aba
Syndrome for the prevalence of indiscriminate dumping and littering, a few participants
from the other stakeholder groups argued that while residents of Aba could be said to be
stubborn, more sensitisation and public education was required to curb the unwanted
practice. They argued that ASEPA had not done enough to ‘carry the people along’. Other
reasons advanced by participants included neglect by the government, lack of
consultation with service users, dilapidated infrastructure especially roads, distance
from the few government approved designated disposal points, absence of waste bins at
strategic locations for use by the public, and lack of enforcement.
5.1.4.2 Temporary Storage
Most households in the city have some form of temporary storage for their waste. In most
cases this is an improvised bin – container, sack or even a dedicated corner within the
compound or premises. The same applies to most traders in the markets, street shops
and stalls. Some traders have small open baskets which are emptied into the improvised
bin once full or at the end of the day. All the offices visited in the course of the study had
a waste basket which was again, emptied into a larger improvised bin usually a sack.
Table 5.6 below is an excerpt from interviews with stakeholders regarding the types of
bin they used for temporary storage. This study noted that service users were not buying
the plastic bags from ASEPA which are sold at #50 each, with which they are required to
bag their waste before taking same to the skip.
Table 5. 6: Excerpt of Responses from Participants on Waste Storage and Handling
Question Answer
Participant id = 3
As a resident of Aba, do you have standard
bins for storing your waste? If yes, how did
you come about it?
I use improvised bins not standard. I use
nylons and throw them in the general
collection skips or sometimes in the bush.
Participant id = 1
Do you have access to a standard bins or
any kind of bin at all?
Yes, obtained through connections at
ASEPA. It is not affordable to the public
Participant id = 26

121
You said your role is limited as ASEPA has
almost full responsibility. Currently, what
role does the environmental health
department play in waste management in
Aba?
We carry out inspection and if we discover
nuisances, we serve abatement notices.
Part of the inspection of the premises is to
check if residents have ‘standard’ waste
bin because if there is none, then there is a
greater tendency of indiscriminate
dumping
So basically your role is restricted to
inspection. Is that correct?
Yes
From responses I have gathered so far and
from observation too, that number of
premises that have this ‘standard’ bins is
very minute. Does it mean the department
is not inspecting these premises or does it
mean the people are not complying to the
notices being served?
Let me be very sincere, the performance in
terms of inspection is not encouraging. I
know people buy the ‘standard’ bin from
ASEPA but they don’t put it to actual use.
They just buy it and keep it to present to
officials. You’ll observe that when people
are going to the designated disposal
points with their waste, they rarely come
with standard bins
That’s exactly my point and I have a
problem with that. If I have a ‘standard’
bin which is a big bucket, I don’t see how I
can carry it to a distance of 2 to 2.5 miles
to the nearest designated waste disposal
point
That is right. Another problem is bad
roads. It makes it impossible for residents
to carry their ‘standard’ bins to the
designated points as well as for the refuse
trucks to access most of the residents.
Participant id = 10
Do you have a standard waste bin or any
kind of bin at all?
I have somewhere I pack my refuse and
once the weather is dry, I burn it.
Participant id = 43
Do you have a standard waste bin? Yes. Every trader is expected to have one
but there is also a central one for all the
market to use.
Participant id = 47

122
Do you have a standard waste bin? Not standard but I have a place I pack my
refuse and once the water proof
(polyethylene sack) is full, I will call one of
these informal waste pickers to cart it
away.
The responses above shows that standard waste bins such as ‘wheeling bins’ (Figure 5.4)
that are commonly used for temporary storage are not available to service users in the
city. While the researcher thinks that that there is no place for such bins in the current
MSW management system as it will be out of place for service users to wheel such bins to
the skips, the introduction of such standard bins may help promote the habit of bagging
waste, which could then be stored safely temporarily in the bins, pending when the bags
are taken to the skips.
Figure 5. 4: Wheelie Bins used for temporary storage of waste [Credit: www.theworkplacedepot.co.uk/wheelie-bin]

123
Once the improvised bin was full or there was enough waste to warrant the transfer of
the waste, there are usually three (3) common options available to the service users
though not all three options are available to every service user group. These are:
(a) Transfer to the skip/secondary receptacle
ASEPA runs a system of secondary collection points where skips are placed at each point
and service users are expected to take their wastes to the skips. The agency says there
are about 30 such skips located strategically at locations where experience have shown
that large quantities of waste are generated regularly. This study noticed that some
designated points had about 3 skips while most had 2 skips. In all, the total number of
designated points counted was 14. The agency declined to answer when asked how many
designated points they operated in total but rather restated that they had about 30 skips
which are evacuated regularly.
All households can drop off their wastes at these skips during the specified times of 5pm
to 9pm daily at no extra costs. However, these skips are manned by ‘bucket minders’
during the specified hours and no one is allowed to drop waste there outside of those
hours. Anyone dropping off large quantities of waste (as defined by the bucket minder)
must pay a bribe, ranging from #100 to #2000 (One Hundred to Two Thousand Naira)
depending on the quantity of waste to be disposed, to the bucket minder before they are
allowed to drop their waste in the skip as evidenced by this excerpt in Table 5.7 below.
Table 5. 7: Excerpt Responses from Participants on Waste Transfer
Question Answer
Stakeholder 30
How much do you pay
specifically to ASEPA for
waste management?
I will have to visit my receipts
What services do you get
for the fee?
We don’t get any service. We dispose our garbage twice
a week – Tuesdays and Fridays and when our driver
takes the waste to the skip, they (ASEPA – i.e. the bucket
minder) collect a compulsory #100 (One Hundred
Naira). Failure to pay the #100 will result in the driver

124
coming back with the waste; they will not allow him to
drop it.
Stakeholder 32
How much do you pay to
ASEPA?
I don’t want to frighten you but it runs into millions. No
waste truck has ever come here to pick up any waste.
They use the statutory powers that empower them to
collect the fee and once they get it, it is assumed their job
is done and they leave you with your waste. It does not
matter to them how you dispose your waste. Ask anyone
in the industry.
I agree with you as that is
the common feedback I
have been getting. What
will normally be in your
waste stream?
I don’t normally have waste to be honest because I have
installed several systems that reuse what will ordinarily
be classed as waste. My waste will result as a matter of
carelessness or accident.
Okay. I understand that
aspect. What about papers,
polyethylene and things
like that?
This is the area I have problem with. We generate those
papers, empty packaging, etc. etc. I have to hire trucks to
evacuate these from our waste enclosure to the
dumpsite where ASEPA also dump theirs and for each
trip, I have to pay #2000 after paying my statutory fee.
Table 5.8 below is also a summary of the notes taken during an observation exercise of
activities at the receptacle point/skip at Union Bank Junction, Aba by the researcher.
Table 5. 8: Observation note of waste transfer activities at Union Bank Junction, Aba
At all times of the observation, a man (the bucket minder) was standing beside the
waste skip.
15 adults (ages ranging from 18 to 50, 12 female and 3 male) came with their waste in
a bucket and emptied it into the ASEPA skip, and left with the buckets.
A lady came with her waste in a bag and emptied the bag into the skip and left with the
bag.
Someone came with a bag full of waste and threw the bag into the skip and left.

125
Some children (numbering about 7) came with their waste in buckets and made their
way onto the waste skip to empty their buckets. They left with the buckets.
Another group of kids (numbering about 8 – 10), they climbed onto the skip to empty
their waste and were ordered by the bucket minder to jump and mash on the waste,
presumably to compress it.
A man carrying a wheelbarrow full of waste bags came and gradually emptied his bags
into the waste skip. Afterwards, he went over the bucket minder and gave him some
money and left.
Someone drove by and flung his waste bag in the direction of the waste skip and sped
off.
A man came with his bag full of waste and flung it on the ground. The bucket minder
went over and cautioned him and then swept the waste that had fallen on the ground
around the skip together and packed same onto the skip.
A man came with a wheelbarrow full of waste bags. After emptying same into the skip,
he brought out his broom and swept around the skip and packed the dirt onto the skip.
He then went over to the bucket minder, paid him some money and left.
A lady drove to the skip with her waste bags in the car boot. She emptied them onto the
skip and left.
The waste skip was now full and the refuse was falling on the ground uncontrollably.
Suddenly the entire place was deserted.
The time now was 9:05 pm and the researcher retired.
Besides the issue of extortion at the skips, the number of designated points available to
the entire residents of the city (the researcher counter 14 separate designated points but
ASEPA treats the 30 skips as if they were 30 different points), is far too few. Consequently,
several residents of the city will have to travel several miles before reaching their nearest
skip. In response to this, ASEPA informed the researcher that while there were plans in
the pipeline to roll out more skips and street collection services, it is currently the duty
of the revenue consultants (RCs) to ensure waste was evacuated from such areas without
accessible roads (see Fig 5.2). However, it is clear that much more will have to be done
by all involved if more wastes are to reach the skips.
(b) Collection by informal waste recyclers/pickers

126
Informal waste workers in Aba operate in different modes (see section 2.9.2.5).
Responses from participants in this study confirm that their services are often not
available to most households as they often concentrate on the markets, street shop
clusters and adjoining areas, and some wealthy suburbs (see table 5.9 below).
Table 5. 9: Participants responses relating to operation of informal waste workers
Participant id Comments
3 You can get some of those in the markets but not in the residential
area like this
31 Because there are many offices around here, they always come
around and many people will bring their bins and pay the boys to
take the waste.
37 As you can see, this place has been swept this morning. We will
now pay somebody (informal waste worker) to cart away the
refuse. Where they dump it, I don’t know. How is it fair that we also
pay ASEPA for doing nothing?
46 We pay them #30 or #50 daily depending on the quantity of waste
we give them to dispose
47 I usually pay them #100 to #150 weekly depending on the
quantity of waste.
48 Ranges from #100 depending on the quantity of refuse I give them
and that is at least every 2 days, sometimes every day.
This study observed that itinerant waste pickers/buyers/cart pushers in Aba go about
with their wheelbarrows or modified carts. They will often blow their distinctive horns
intermittently to attract the attention of would-be customers. Some collect or buy
recyclables such as cardboards, fabrics, plastics, etc. which they sell on to middlemen.
Others collect all kinds of waste from customers who pay them according to the quantity
of waste to dispose. Many participants from the TrMU stakeholder group lamented that
some informal waste workers indulged in illegal dumping of the waste they collect but
because ASEPA does not provide the services for which they (service users) paid for, they
(service users) were helpless as their priority was ensuring the waste was taken out of
their immediate vicinity.

127
(c) Illegal dumping and open burning
Illegal dumping is the dumping of waste or refuse in sites which have not been approved
by ASEPA as a designated dumpsite. As highlighted in section 2.9.2.6, illegal dumpsites
include abandoned pits that have not yet been approved as dumpsites, gutters,
undeveloped plots, street corners, abandoned building sites, etc. Many participants in this
study recounted stories of people dumping their waste in the gutters. They said the
practice was common when it rained. The researcher observed that various types of
illegal dumpsites were common in most streets in the city. It is common knowledge that
biodegradable waste decompose faster under tropical conditions. The researcher is of the
opinion that the unpleasant smell from these decomposing waste contribute to the foul
smell that pervades most areas of the city at all times. Such sites are also a good breeding
ground for flies which are reportedly vectors of several infectious diseases (UN-HABITAT
2011).
Open burning of waste is also commonplace in Aba. Responses from participants (Table
5.10) as well as Pictures 8 and 9, confirm the practice is prevalent. Picture 8 shows a
burning heap of refuse in the city centre, along Asa Road while Picture 9 shows a place
that appears to be repeatedly used for open burning of waste. The researcher thinks that
many who engage in the practice do so in order to ‘get rid of the waste’ but inadvertently,
they contribute to the poor air quality observed to be a constant feature in the city
throughout the duration of the study.
Table 5. 10: Excerpt of Responses from Participants on Open Burning of Waste
Question Answer
Participant id = 11
In this area, do people
also burn their waste
openly?
Yes, that is very common here.
Participant id = 9
In this area, do people
burn their waste openly?
Yes, they burn it every day. People burn toilet wastes,
waterproofs (polyethylene materials), etc. and for me it
causes me instant catarrh which will linger for a very long
time

128
Participant id = 24
What about waste
burning? Do people burn
their waste?
Yes, when we go for inspections, we see people burning
their waste
Participant id = 45
What about waste
burning? Do people burn
their waste openly here?
There was a time the road was very bad and we used to
gather our waste on the potholes and burn it. But since
the road was rehabilitated, you dare not burn waste on
the road. You will be rebuked as enemy of the
government and accused of trying to sabotage
government by destroying the road
Okay. So the focus in such
a situation will be the
road, not the health
implications of open
burning of waste?
Thank you. That is what I was coming to. You know the
air pollution that burning waste openly causes. So many
sicknesses and ailments can be attributed to air pollution
which is common here.
Participant id = 50
Do people burn their
waste openly in this
area?
People burn their waste so openly and sometimes you are
forced to flee from your own place when your neighbours
start burning their waste
Participant id = 10
Do you burn your waste
openly?
Not every waste. We burn the water proofs because it
does not rot even after a million years in the soil.
Participant id = 6
Do people burn their
waste openly in this
area?
Yes, they do. Actually, we do so too

129
Picture 8: Picture evidence of Open Waste Burning in Aba (I) [Credit: Researcher]
Picture 9: Picture evidence of Open Waste Burning in Aba (II) [Credit: Researcher]

130
5.1.4 Realities and Challenges related to Waste Transfer and Transport
The evacuation of waste from the skips is the signature service provided by ASEPA to the
service users. Besides the inadequacy of the number of skips available highlighted above,
the actual process and activity of carting away of the refuse in the skips is also bedevilled
by several challenges. These include:
a. The skips
The skips used as secondary receptacles are of very poor quality. They are open and have
no tailgate nor any sort of lid to secure the waste deposited in them. The immediate
vicinity of every receptacle point observed was filled with the stench from decomposing
waste. Vermin infestation was rife and of utmost concern to public safety. Often times,
the bucket minders at several receptacle points were seen using ropes to close-off the
open side of the skips so more and more waste could be deposited as shown in Picture 8
below.
Picture 10: An Improvised Waste Skip/Receptacle Point in Aba [Credit: Researcher]

131
During the carting away of the waste from the skips, staff of the agency used shovels and
baskets to scoop the waste from the skips unto the compactor truck or tipper truck. Once
loaded, the tipper truck would drive off and because the waste was not covered, several
waste items were seen littering the road while the leachate from the fast decomposing
organic content of the waste continuously leached unto the road surface with its
attendant disgusting smell. Lighter items were been blown off through the open top
constituting further environmental blight and hazard.
b. Manpower
MSW management reportedly employs six (6) workers per 1000 population in
developing countries (UN-HABITAT 2010a). Nzeadibe et al (2012) estimated the number
of informal waste workers in Aba to be about 600. If we worked with a conservative
estimate of 800,000 as the population of the city of Aba, it means there should be about
4800 workers employed in the MSW management sector. Though the agency declined to
provide the actual number of its workforce, it is understood (from sources who wished
to remain anonymous) that less than three hundred (300) people are on the payroll of
the agency. A significant number of these are alleged to only appear to collect salaries
without doing any jobs whatsoever.
The environmental health departments (EHDs) of the three (3) local government councils
in the study area employ a combined estimated 600 people. Though they now reportedly
have very limited roles (as discussed in section 4.3), a combined possible total workforce
of 1500 (ASEPA staff, EHD staff and informal workers) is still very far off the expected
4800 going by the UN-HABITAT report (2010a).
Moreover, the challenge is perhaps beyond staff numbers going by the current state of
the environment. Responses from participants also suggest that the prerequisite training,
organisational capacity and necessary equipment required for the jobs are not available.
Others argued that employment into these roles were often given to political cronies and
thugs sympathetic or loyal to the politicians in power. Table 5.11 is an excerpt from
participants relating to manpower, training and equipment.
Table 5. 11: Excerpt of Responses from Participants relating to manpower, training and equipment

132
Participant
id
Comments
40 The biggest challenge is that of funding. We hardly have enough
equipment to carry out the job effectively.
All of that and compactors, bulldozers, pay loaders. We make use of all
these.
They only receive on-the-job- training. The agency has not engaged any
professional trainers.
42 The biggest challenge is equipment.
There are people everywhere looking for jobs so if we have
equipment, we’ll employ more people. For instance, if we had several
compactors you will see them going street by street
52 Initially when I started this job some years back, I was employed by
Duru (the former executive chairman of Aba South LGA), and he used
to provide high visibility clothing, nose masks, helmet, hand gloves,
shovels, brooms and everything we require for the job.
I provide my broom, my shovel, my bucket and everything.
54 No. You train yourself
28 Absolute no training, not even a seminar of any sort.
25 No training opportunities. We occasionally have seminars - 2 in the last
10 years that I have been here to be precise.
Yes, the major challenge is funding. We struggle to raise funds to fulfil
our duties. We often do personal contribution from staff to raise money
to procure the materials we need for our job.
22 I don’t know how somebody who doesn’t have any basic knowledge
of what a clean environment ought to be could manage an
establishment as sensitive as Abia State Environmental Protection
Agency (ASEPA).

133
The people that are supposed to work in the field will all be political
thugs who will be there for what they call ‘empowerment’, collecting
salaries for nothing.
2 Yes. There’s lack of manpower and lack of facilities and equipment.
Removal trucks are in very bad shape.
One of the participants (id = 42), who functions as a senior officer at ASEPA explained
that the main factor limiting the employment of more manpower is the unavailability of
necessary equipment. He explained that each staff in the operations department is
attached to a vehicle for waste evacuation, and in the absence of such functional vehicles,
more staff cannot be employed.
c. Vehicles
As seen from the interview excerpt above, according to ASEPA the vehicles needed for
effective evacuation of waste from the skips include trucks, pay-loaders and compactors.
While there are legitimate needs for equipment and vehicles to ensure effective delivery
of MSW management services in the city, a visit to the operational headquarters of the
agency at the ministry of works compound along Ikot Ekpene Road, Aba reveals a more
sinister problem. The common mistakes made by administrators of MSW management
services in developing countries where huge amounts of money are spent on acquiring
sophisticated equipment and vehicles such as those used in cities in developed countries,
with the view that same results as seen in those cities will be reproduced back home have
often been reported in previous studies (Abdulredha et al 2018; UN-HABITAT 2011;
Nzeadibe and Ajaero 2010; Imam et al 2008). The case of Aba is a testimony to those
reports. The compound at Ikot Ekpene Road is littered with all manner of broken
dilapidated sophisticated MSW management machinery including trucks, compactors,
caterpillars, etc. rotting away under the tropical rain and sunshine, a clear evidence of the
abject lack of maintenance culture on the part of the management of ASEPA, as alleged by
some participants who wished to remain anonymous.
Though employees of the agency prohibit the taking of pictures of the broken down
vehicles, pictures 11 and 12 were covertly taken as evidence.

134
Picture 11: Broken down vehicles at ASEPA Aba operations HQ I [Credit: Researcher]
Picture 12: Broken down vehicles at ASEPA Aba operations HQ II [Credit: Researcher]
The few trucks that are still operational are more of threats to the environment as they
pollute the air with thick clouds of carbon monoxide. Majority of the roads in the city are
not passable with these vehicles and as such they are simply not suitable for most areas
of the city.

135
Table 5.12 below is an excerpt of observation notes taken by the researcher on
observation of the staff of ASEPA during the evacuation of refuse from the skips at Asa
Road by Jubilee, while Video 1 was recorded during the exercise.
Table 5. 12: Excerpt of Observation of ASEPA staff on routine Evacuation of Waste in Aba
There was no signage to warn motorists and passers-by that work was going on
The refuse truck, skips and ASEPA staff were effectively blocking one lane each side of
the road thus causing huge traffic jam and nuisance
Clear evidence of noise, odour and particulate matter nuisance
All 3 skips at the receptacle point were overflowing with huge heap of refuse dump
along the road demarcation
Staff were using (previously used and unwashed or disinfected) baskets and shovels to
scoop and empty refuse into the standby truck
As the truck was on standby, thick black smoke covered the area, further contributing
to poor visibility and air pollution
On interacting with a supervisor, he informed the researcher that PPEs were provided
once in a while but some of the staff countered that they have never been given any
since they joined
Once the truck was full, the driver departed with one other worker while the remaining
group of staff and the supervisor sat beside the road waiting for their return from the
waste dumpsite
Some of the waiting staff were seen throwing empty water sachets they had just
finished drinking from indiscriminately on to the street
Video 1: Observation of Waste Evacuation Exercise in Aba [Credit: Researcher]

136
d. Routes and General Planning
The researcher’s observations revealed an apparent lack of proper planning of not only
routes for the carting away of the refuse but also of all aspects of the exercise. The staff
were not organised into any formal teams nor were they aware of where and when they
were supposed to be working. This meant that several frontline staff members were
always found loitering within the ministry of works compound of the agency during
supposedly working hours. It appeared that everything was done on adhoc basis as there
were no timetables (see Video 1).
For an agency that is apparently short-staffed, the level of laxity observed among all
cadres of staff was surprising. The obvious lack of commitment and poor levels of staff
morale could not go unnoticed on Monday mornings when huge amounts of waste
brought to the skips overflow into adjoining areas and even threaten to obstruct free
movement of vehicles on some major roads. Picture 13 below suggests more planning is
needed to effectively evacuate waste from the receptacle points especially during and
after weekends.

137
Picture 13: Refuse accumulation near a receptacle point on a Monday morning in Aba [Credit: Researcher]
5.1.5 Realities and Challenges related to Waste Treatment
Generally speaking, the main aims of the treatment of MSW include volume reduction,
and materials and energy recovery (Golomeova et al 2013). Also, the process of waste
treatment should equate to a reduced environmental impact compared to untreated
waste. The more common treatment types of MSW available include recycling,
composting, mechanical biological treatment (MBT), incineration, etc.
In Aba, there is currently no requirement by policy to treat waste. The researcher was
reliably informed by a senior member of staff of ASEPA that though there are plans in
the pipeline to begin recycling of waste, currently all the waste carted away from the
skips and around the city were dumped at one of three (3) dumpsites operated by the
agency. This was also corroborated by other stakeholder groups and through
observation. Table 5.13 below is an excerpt from interviews with stakeholders
regarding waste treatment in Aba.
Table 5. 13: Excerpt of Responses from Participants on Waste Treatment

138
Question Answer
Participant id = 40
Is there any form of
treatment of the waste?
We seldom fumigate the secondary and final dumpsites.
No other form of treatment.
The researcher explains
waste treatment and gives
examples to include
recycling, incineration,
composting, etc. and then
asks –
Do you do any of those?
No
Participant id = 39
What is the system of
waste management in
place in Aba?
I’ve been in position for 2 years. Ongoing waste
management policy is led by the state government
through ASEPA and under direct supervision of the state
governor unlike in other states where it is directly under
the supervision of the ministry of environment……..
The process is simple – government provides buckets
placed at several points (secondary collection points),
the people are required to take their waste to the points
and government will evacuate these buckets to the
dumpsites. You can get more details regarding the day to
day operations from the DGM.
Participant id = 26
Does ASEPA carry out any
form of waste separation
or treatment?
Waste should be separated using colour codes but we
have not graduated to that yet. The only sorting is done
by scavengers at the dumpsites.
Participant id = 1
So everything you
generate as waste goes in
there, no separation?
No separation. I knew you’ll ask me that question.
And everything they pack ends in the dumpsite along
Umuahia express road. Sometimes, it spills out, taking
over an entire lane along the express way.

139
5.1.6 Realities and Challenges related to Waste Disposal
As previously stated, all wastes collected by the agency in Aba are disposed at any one of
three dumpsites operated by the agency. These dumpsites were converted from empty
borrow pits that resulted from excavation of sands for construction. They were not
designed to be dumpsites or landfills and as such were inappropriate for such purpose.
One of the dumpsites was situated along a busy expressway linking Port Harcourt to
Enugu through Aba. Besides the odour nuisance and physical blight it causes, it was
reported by participants that waste often overflowed onto the roads. When the
researcher travelled through the route, the side of the road where the dumpsite was
located was cordoned off as the section of the road had become impassable.
A visit to the Emelogu Street dumpsite in Ogbor Hill area revealed an even greater
problem. The dumpsite was located in a place that could be described as the centre of the
community with sprawling residential and commercial properties in close proximity. The
odour emanating from the site could be perceived from at least a mile away. At the site,
vultures and other birds of prey were plenty in number. Two broken caterpillar machines
parked on the side of the road while one caterpillar was seen scattering the loads from
two refuse trucks that had just dumped contents on the site. Thick cloud of black smoke
filled the air as the caterpillar bellowed gingerly along the sinking terrain. Yet, the site
was a beehive of activity for scavengers who were seen picking out ‘valuables’. These set
of scavengers basically lived on the dumpsite as a group and they informed the researcher
of a ban on taking of photos and recording of videos to avoid confiscation by ASEPA thugs
in supervision of the area. Notwithstanding the threat, the following images - video 2 and
picture 14 were captured by the researcher.
Video 2: A short video of Emelogu dumpsite in Aba [Credit: Researcher]

140
Picture 14: Emelogu dumpsite in Aba [Credit: Researcher]
Besides the huge public health concerns, the site could only be accessed through a narrow
strip of road. Considering that the Ogbor Hill area is one of the worst areas of the city in
terms of vehicular traffic movement occasioned by a combination of high population
density and a concentration of other commercial activities such as several markets for
food and fresh produce, timber, etc. the location of the dumpsite was perhaps
unjustifiable.
5.2 Current Drivers (Motives) and Driving Mechanisms of MSW Management in
Aba
Before highlighting the current motives of MSW in Aba, it is necessary to offer a clear
definition of the term ‘motive’ as used here and make a case for differentiating it from
what is termed here as ‘driving mechanisms’. In the researcher’s opinion, both terms have
often been commonly referred to as ‘drivers’ or ‘development drivers’ in previous
literature on MSW management such as Zaman and Lehmann 2013, Contreras et al 2010,
Agamuthu et al 2009 and even in Wilson 2007 (See Chapter 2 above).

141
In Wilson 2007, ‘drivers’ of MSW was rightly defined as “mechanisms or factors that
significantly impact development in solid waste management” and it also stated that
understanding these ‘drivers’ was necessary to developing sustainable waste
management systems around the world. However, in a place like Aba (and Nigeria in
particular and perhaps in most other developing countries by extension), the discussions
should begin with identifying the ‘motives’ of MSW management. Motives here are
defined as the reason, motivation and or rationale for MSW management. It answers the
basic questions of ‘why’? Why does the city need MSW management? Why should huge
amounts of money be spent on it? It explains why people (should) manage their waste.
For a set MSW system to work, the motives have to be accounted for in the development
drivers (or what is termed driving mechanisms in this thesis). For instance, no reasonable
government will spend huge public funds on developing a state of the art MSW
management system just because the technology has been made available but a
government can take such decision if it feels a state of the art MSW management system
will help improve public health. In which case, improvement of public health becomes the
motive and technology (state of the art MSW management system) becomes the driving
mechanism.
With this distinction in mind, here are the motives of MSW management observed and
expressed by stakeholders in Aba.
a. Public Health
Perhaps against the commonly held belief or notion that people in Aba prefer a dirty
environment, every stakeholder that participated in this research recognised good health
as the main reason they have to clean their environment and ensure proper management
of their waste. Many stakeholders linked the current prevalence of diseases such as
typhoid fever, malaria and hepatitis to the poor state of the immediate environment while
others recalled that the said sicknesses were not common features in the society when
the general state of the environment was considerably cleaner (for example during the
Mbakwe era, section 4.1). Table 5.14 below is an excerpt of some responses by
stakeholders interviewed.
Table 5. 14: Excerpt of Responses from Participants link Public Health to MSW Management

142
Participant
id
Comments
7 As a person I wish for a better approach and a better management because
there is serious health hazard.
8 I understand the need to live in a clean environment and that means I
should manage my waste properly and I think I have been doing that
because it is for my good first before that of any other person.
Organic waste can be a breeding ground for so many vermin and rodents,
so it is important that you tidy your environment to ensure it is not a
breeding ground.
36 The bank takes ambience very seriously and you can see our immediate
environment is very clean.
9 We should be hygiene conscious. We should not be littering waste here
and there.
I’m not a medical doctor but I know that the susceptibility to sickness we
have now is not the same as before when we were children, when
everywhere was very clean. I know when EHOs (Environmental Health
Officers) were going around fumigating our surroundings. People were
rarely sick then. Now sickness and death are so common. These are
related to the air we breathe and the environment we live in.
51 Every human knows the good of staying in a clean environment and the
bad of staying in a dirty environment. If you stay in a clean environment,
you will not have staph infections and things like that. In a dirty
environment, you will be having several bad infections.
55 These people forget that our environment says a lot about whom we are
– our perception, health, cleanliness; it’s an identity of whom we are, and
how we behave
49 I am sure we will be happy to pay because the smell in this market drives
some of customers away. If the market was made very clean, more
customers will come.
46 Absolutely. I am sure all the traders will pay because at the end of the day,
everyone wants a cleaner market

143
2 When this happens, we’ll get a cleaner and healthier environment.
Yes, these sicknesses arise because there are not enough waste workers
to patrol, monitor and enforce policies and to apprehend defaulters.
It can be said without ambiguity that public health is the most common motive of MSW
management in the city amongst the participants. This is against the common notion of
‘Aba Syndrome’ which suggests that residents of the city prefer a dirty environment to a
cleaner one. Furthermore, when asked if they will be willing to pay higher sanitation fees
to the authorities in order to guarantee a cleaner environment, most participants
expressed their willingness and readiness to pay, as shown in Table 5.15 below.
Table 5. 15: Comments from Participants expressing willingness to pay higher fees to guarantee cleaner environment
Participant id Comment 2 There’s enough money but if they decide to collect more, we don’t
have a choice. People will pay much more if better services will be
guaranteed.
3 Yes, I will. It's difficult for people to pay now but that is because
service is not being rendered. I'll be happy to pay more if indeed a
better service will be rendered.
11 Why not. They should start by providing service and once they do,
trust me, Aba people will pay and I will be more than happy to pay.
29 Currently I pay #50 weekly to someone who disposes my waste (i.e.
#2600 annually) and then I pay #1000 to ASEPA. So I am happy to
pay more to ASEPA so long as I get the same level of service or better.
If they are going to collect my waste which means I have no other
expenses for waste, why will I not pay that money to them to make
things work?
31 If they collect waste from house to house, people will be happy to
pay much more so long as the place is clean
56 If government provides the services of clearing the refuse, the
people are always willing to pay.

144
34 The problem is when people pay them and they don’t provide any
service. Once they work, people will pay.
A few participants who declined to express their willingness to pay a higher fee argued
that the money they currently pay is enough for ASEPA to provide the level of service that
should guarantee a cleaner environment than is currently obtainable in the city. Others
insisted that they have lost all faith and trust in ASEPA and do not believe they can offer
anything better than they do even if they (ASEPA) are given all the money in the world.
However, even participants in this group agreed with the others that poor MSW
management was a concern for public health in the city. The implications of poor MSW
management on public health is discussed further in section 5.3.
b. Source of Income
For some stakeholders such as the informal waste pickers and buyers, MSW management
is their livelihood and the only source of income. For some others, it is the family business
and for a few others like young teens, it is a means to some other ends such as raising
money for school fees, etc. as shown by the conversation with informal waste workers in
Table 5.16. Picture 13 below was taken by the researcher on a visit to a plastic recycling
shop at Isi-Court, Aba, Abia State, Nigeria. It shows the display of wares (used plastics) by
a middleman (see section 2.9.2.5) for sale to the public.
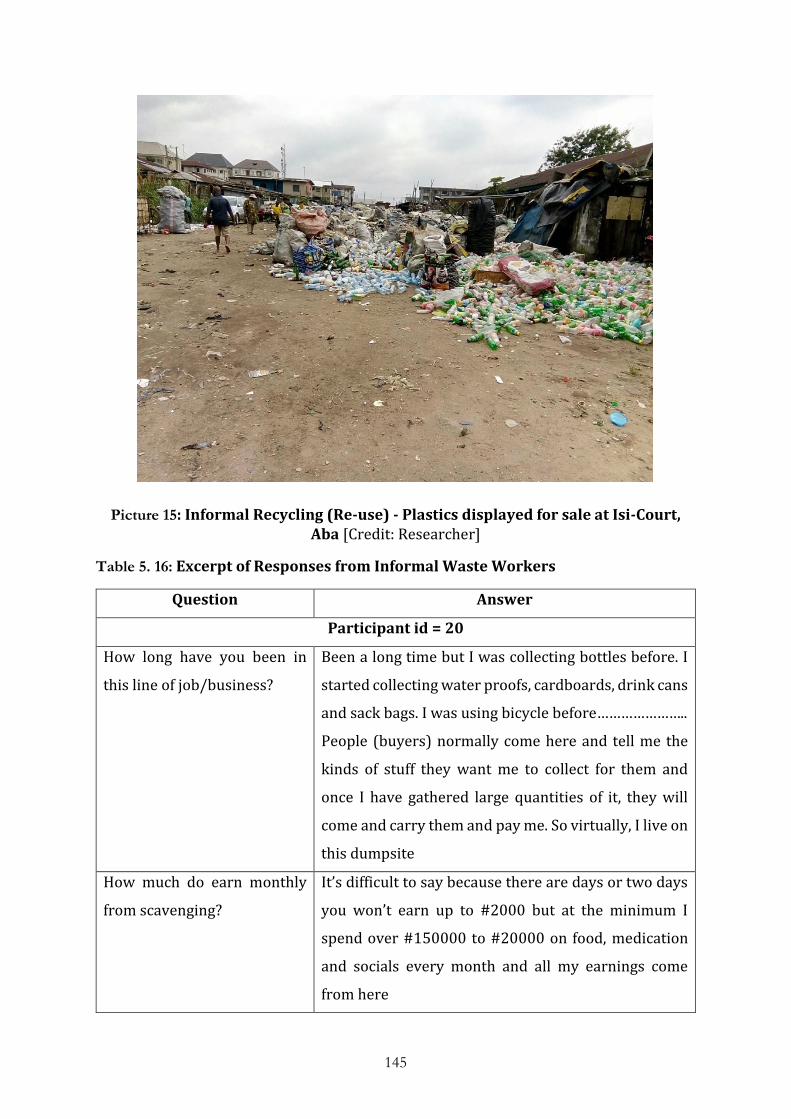
145
Picture 15: Informal Recycling (Re-use) - Plastics displayed for sale at Isi-Court, Aba [Credit: Researcher]
Table 5. 16: Excerpt of Responses from Informal Waste Workers
Question Answer
Participant id = 20
How long have you been in
this line of job/business?
Been a long time but I was collecting bottles before. I
started collecting water proofs, cardboards, drink cans
and sack bags. I was using bicycle before…………………..
People (buyers) normally come here and tell me the
kinds of stuff they want me to collect for them and
once I have gathered large quantities of it, they will
come and carry them and pay me. So virtually, I live on
this dumpsite
How much do earn monthly
from scavenging?
It’s difficult to say because there are days or two days
you won’t earn up to #2000 but at the minimum I
spend over #150000 to #20000 on food, medication
and socials every month and all my earnings come
from here

146
In terms of the job, what do
you think anyone or
government can do to help
you make more money or
make the job easier or safer?
All I can think is if someone can bring a contract for
more materials and may be offer higher prices per kilo
of the items I collect.
Participant id = 19
What kind of stuff do you
pick or collect?
I collect cardboards
What do you do with them
after collecting
I sell them to people that buy them at Old Court (a
cluster for middlemen that deal on resalable waste
materials)
How much do they pay? They pay #13 per kilo
How old are you? I am 15 years old
Are you doing it for someone
or for yourself?
It’s for me. I want to raise money to go to school.
Participant id = 15
So how much business is it?
How do you make it a
business?
It’s a good business but we need sponsor (financier).
Sometimes the people you give money to buy in the
field can run away with your money. So there’s the
issue of trust too.
One person cannot run the business on his/her own.
You must have people involved.
I’ve been in this business and in this very line a long
time (over 30 years). It’s the only business I know
and do. It’s my only source of income.
Indications also show that the government views MSW management as a source of
revenue. Besides that this was commonly alleged by different stakeholder groups and
partly justified by the absence of a commensurate service for the fees paid by users, most
government plans and actions in MSW management are mainly for the purposes of
raising money. The monopoly of the sale of bin bags and waste bins by ASEPA and the

147
agency’s determination that future plans of waste recycling will be a revenue source for
the government are other examples to support this position.
This motive is very different from resource management because the focus or interest of
the waste pickers is not related to the wider implications of efficient resource use and
neither is it driven by scarcity of the materials collected as previously reported (Wilson
et al 2015; Wilson et al 2012; Rodic et al 2010; Wilson 2007). It is simply their job and
the major source of income.
c. Spirituality (Christianity), Culture and Customs
As mentioned earlier (section 5.1.4.1), indiscriminate dumping and littering is prevalent
in the city. However, the researcher observed that the immediate vicinities of private
spaces were considerably clean compared to areas considered as public spaces. Still,
there were two (2) places observed to be extremely different in terms of level of
cleanliness. The entire compound and the immediate external surroundings were very
well kept and maintained (Picture 16). Consequently, the researcher enquired further to
know why the 2 places were different and how such standards were achieved. It turned
out that the 2 places were owned by religious organisations (churches) – The Church of
Latter Day Saints Aba Temple (along Okpu Umuobo Road, Aba) and The Diocesan
Headquarters of St. Michael’s Cathedral (along St Michael Road, Aba). Picture 16 is a
gallery of images taken by the researcher in the 2 locations.

148
Picture 16: Gallery of Photos showing a clean and well maintained environment in Aba [Credit: Researcher]
From the responses given by the 2 officers responsible for maintaining the grounds at the
2 locations, the researcher found spirituality to be the main thrust or motive. The 2
officers (participant is = 55 and 57) explained that “cleanliness is next to Godliness”. They
enthused that as their places were a place of worship, cleanliness and tranquillity was of
utmost importance. Both explained that in order to promote to the world the image of
God they preached, it was not enough to maintain such standards only on the inside of
the church premises but also on the outside. Along with spirituality, some other
participants cited culture as a motive of ensuring that their immediate surrounding was
adequately clean as shown in Table 5.17 below.
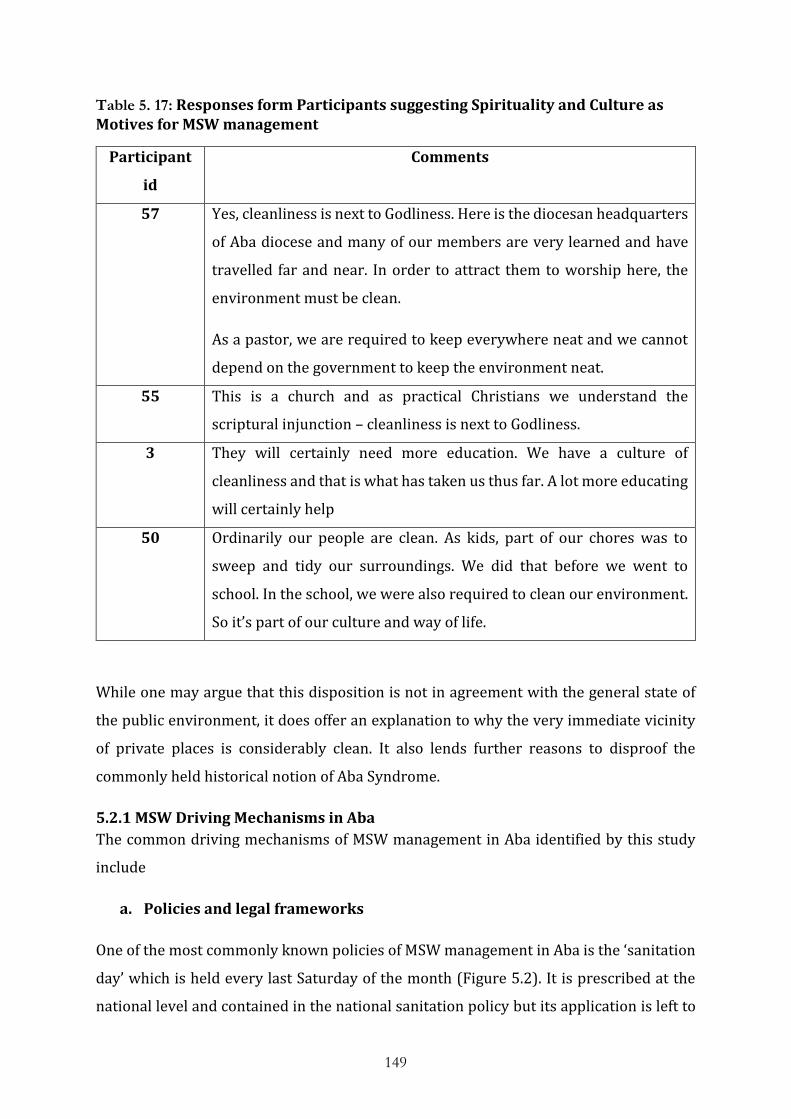
149
Table 5. 17: Responses form Participants suggesting Spirituality and Culture as Motives for MSW management
Participant
id
Comments
57 Yes, cleanliness is next to Godliness. Here is the diocesan headquarters
of Aba diocese and many of our members are very learned and have
travelled far and near. In order to attract them to worship here, the
environment must be clean.
As a pastor, we are required to keep everywhere neat and we cannot
depend on the government to keep the environment neat.
55 This is a church and as practical Christians we understand the
scriptural injunction – cleanliness is next to Godliness.
3 They will certainly need more education. We have a culture of
cleanliness and that is what has taken us thus far. A lot more educating
will certainly help
50 Ordinarily our people are clean. As kids, part of our chores was to
sweep and tidy our surroundings. We did that before we went to
school. In the school, we were also required to clean our environment.
So it’s part of our culture and way of life.
While one may argue that this disposition is not in agreement with the general state of
the public environment, it does offer an explanation to why the very immediate vicinity
of private places is considerably clean. It also lends further reasons to disproof the
commonly held historical notion of Aba Syndrome.
5.2.1 MSW Driving Mechanisms in Aba
The common driving mechanisms of MSW management in Aba identified by this study
include
a. Policies and legal frameworks
One of the most commonly known policies of MSW management in Aba is the ‘sanitation
day’ which is held every last Saturday of the month (Figure 5.2). It is prescribed at the
national level and contained in the national sanitation policy but its application is left to

150
the states. In Aba, the monthly sanitation day can be said to be central to the MSW
management process implemented by ASEPA as all waste that are not properly disposed
are expected to be properly disposed on that day. Many participants reported high levels
of public co-operation going by the number of people that take part in the cleaning up of
their surroundings. However, some participants stated that most of the waste that are
gathered by the public from cleaning of their surroundings on the sanitation day are left
to rot along the streets while others are washed back into the gutters during rainfall
because ASEPA and the local government authorities fail in the evacuation of such waste
as prescribed by the policy. Many participants, including senior officers of the EHDs at
the local governments confirmed that both ASEPA and the local government authorities
were more concerned about the fines and penalties that will accrue from would-be
defaulters. They maintained that the monthly sanitation exercise have been converted by
those in power to just another avenue to extort money from the public rather than an
opportunity to instil public discipline and compliance. Some of the comments by
participants are shown in Table 5.18 below.
Table 5. 18: Some comments by Participants related to the Monthly Sanitation exercise in Aba
Participant id Comment
7 There’s so much inefficiency in the system. During monthly
clean-up, we clean the drainages but they (ASEPA) do not
clear the rubbish and once there’s rainfall, it will all go back
to the drainage.
27 We see that on clean-up days when there is enforcement,
people will do as expected.
26 For the local governments, the emphasis is always on
raising money. Every drive on the sanitation day is geared
towards making money from would-be defaulters and not
to engender change.
However, participants from ASEPA maintained that funding and lack of vehicles were the
major challenges affecting the efficiency of MSW management services including the
evacuation of refuse gathered on monthly sanitation days. They insisted that the arrest,

151
and subsequent fine imposed on defaulters of the monthly sanitation exercise was aimed
at discouraging people from defaulting.
b. Public education and awareness
Public education and awareness is perhaps one of the most important and most effective
tools in driving changes in MSW management (Wilson 2007; Wilson 1999). Historically,
the public are reported to be sceptical about MSW systems especially when it relates to
citing MSW management facilities such as incinerators, Waste to Energy plants, landfills,
etc. (Ezeah 2010; Wilson 2007; Tonglet et al 2004). The analyses of the responses from
participants in this study support previous reports which suggest that when the public
understand the motives behind what they are being asked to do and may be some
implications of not doing them, then it is easier to achieve a positive behavioural or
attitudinal change (Abila and Kantola 2013).
Clearly, there are efforts by members of staff of the education department of ASEPA and
the EHDs of the local governments to educate the public on the need for effective MSW
management and compliance with stipulated MSW management policy. However, the
efforts are not concerted and the information provided was found to be grossly
inadequate. This study found that the members of staff lacked the prerequisite training
and level of knowledge to effectively carry out the responsibilities required of them. The
situation was exacerbated further by the wrangling between the two responsible bodies
(see Table 6.2).
c. Technology
The agency (ASEPA) has in its armoury some compactors, trucks, pay loaders,
caterpillars, etc. Participants from the agency claim these machines are necessary for
effective MSW management in the city. They insist that these technological machines help
them to evacuate waste faster than they would without. This study is all for developing
existing local technology and against investing huge sums of public funds in acquiring
more high tech machineries developed abroad. This approach, the study believes, is in
line with the political economy appraisal approach that is important in achieving
sustainable development (Booth et al 2016; Long 2004), and against the modernisation
approach which is often favoured by MSW management decision makers in developing
countries (Wilson et al 2015; Nzeadibe and Ajaero 2010; Long 2004).

152
d. Intimidation and harassment
Many participants reported several incidences of harassment and intimidation by ASEPA
and those working for the agency. Most of these incidences reportedly occurred in
relation to the collection of sanitation levies and on sanitation days. Others alleged that
this method was often used by people parading as officers of ASEPA and their thugs, to
extort money from traders and shop owners. Analyses of the responses from participants
suggest that intimidation and harassment can be classed as a driving mechanism used by
ASEPA. This is discussed further in Chapter 6.
5.3 Implications of Poor MSW Management Practices on Public Health
As highlighted in the literature review (Chapter 2), the conclusion from the assessment
of literature on the adverse health effects of poor MSW management practices on the
general public and waste workers is insufficient and inconclusive (Giusti 2009). While
there have been calls for further cohort studies involving direct human exposure
measurements and supported by data on health effect and susceptibility biomarkers, it is
perilous to disregard the reported linkages between poor waste management practices
and public health (Ayomoh et al 2007).
In Aba, the prevalence of odour nuisance, pest infestations, air pollution and general
environmental blight occasioned by poor solid waste management is very obvious for
everyone to see (Odoemena and Ofodu 2016). Even though this study was not focused on
identifying direct links between MSW management or absence of it, and certain ailments
or health conditions, the responses from stakeholders suggest a correlation between
poor MSW management in the city and public health. As shown in Table 5.15, most
participants linked poor MSW management to public health and in Table 5.19 below,
participants highlighted some of the most common ailments that could be associated with
poor MSW management.

153
Table 5. 19: Some common Ailments linked to Poor MSW Management by Participants
Participant id Comments
2 Yes. These sicknesses arise because there are not enough waste
workers to patrol, monitor and enforce policies and to apprehend
defaulters.
Our gutters do not carry water they were built for anymore as they
are blocked. Mosquitoes from the gutters bite us every time and we
all know mosquitoes cause malaria.
29 The most common is malaria, typhoid, hepatitis, cough, diarrhoea
and checking of blood pressure.
Our environment might be one of the causes of typhoid – eating
contaminated food. Hepatitis is caused by accumulation of malaria in
the liver.
20 My number one sickness is tiredness, general weakness of the body
and malaria.
9 Yes, they burn it every day. People burn toilet wastes, waterproofs,
etc. and for me it causes me instant catarrh which will linger for a
very long time.
Most stakeholders reckon that they only became aware of the names of certain ailments
and diseases such as typhoid, hepatitis, etc. in the last 10 to 20 years, and they posit that
the timing corresponds with the period when MSW management and the entire
environmental condition of the city deteriorated. While extensive cohort studies may be
needed to categorically establish the links between poor MSW management practices and
specific diseases in the city (Giusti 2009), available literature suggests that the above
mentioned ailments such as malaria, hepatitis, typhoid, etc. are related to poor sanitation,
and hepatitis have been shown to be prevalent amongst waste workers in Iran (Marchand
et al 2012; Gupta 2010; Gregory 2009). The influence diagram (Figure 5.5 below)
summarizes the identified impacts on health of poor MSW management practices in Aba.
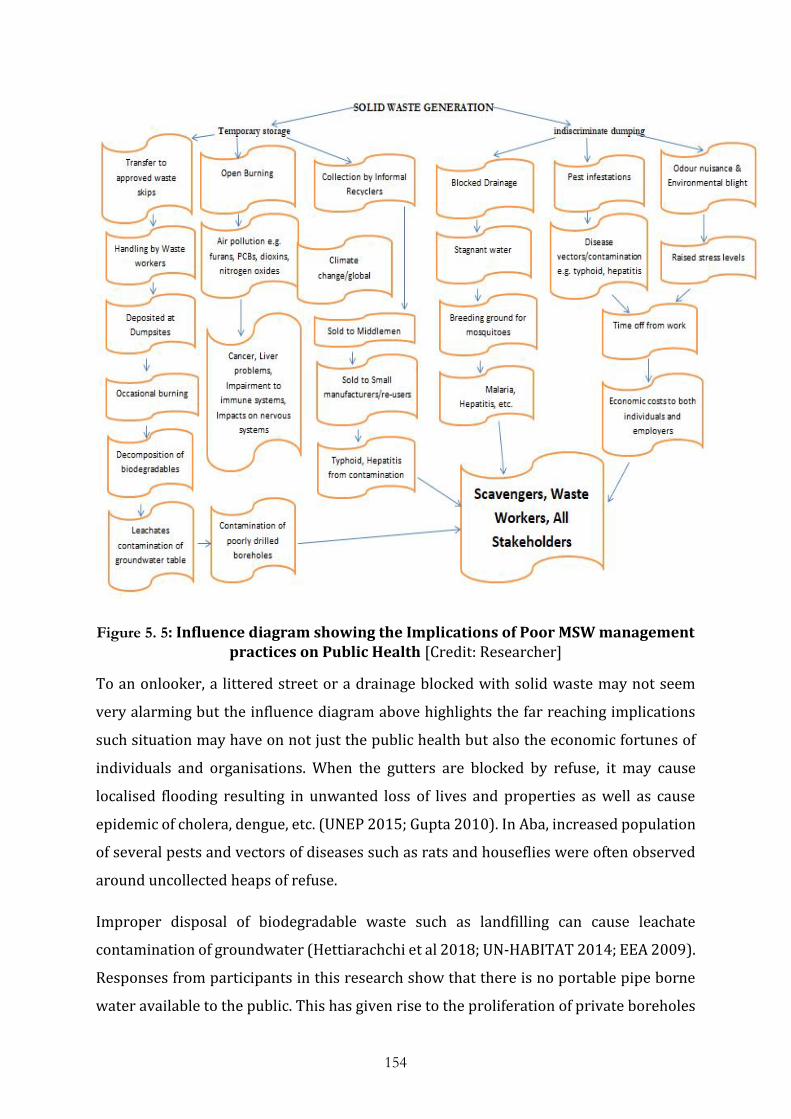
154
Figure 5. 5: Influence diagram showing the Implications of Poor MSW management practices on Public Health [Credit: Researcher]
To an onlooker, a littered street or a drainage blocked with solid waste may not seem
very alarming but the influence diagram above highlights the far reaching implications
such situation may have on not just the public health but also the economic fortunes of
individuals and organisations. When the gutters are blocked by refuse, it may cause
localised flooding resulting in unwanted loss of lives and properties as well as cause
epidemic of cholera, dengue, etc. (UNEP 2015; Gupta 2010). In Aba, increased population
of several pests and vectors of diseases such as rats and houseflies were often observed
around uncollected heaps of refuse.
Improper disposal of biodegradable waste such as landfilling can cause leachate
contamination of groundwater (Hettiarachchi et al 2018; UN-HABITAT 2014; EEA 2009).
Responses from participants in this research show that there is no portable pipe borne
water available to the public. This has given rise to the proliferation of private boreholes

155
as many now depend on them for their drinking water. Many participants stated that the
standards of most of the privately owned boreholes were very poor. There are also other
risks such as the effects of improperly disposed hazardous wastes containing substances
such as heavy metals on agriculture and food production (Ezeah et al 2009). This raises
further concerns over contamination (Giusti 2009). Added to the mix are the effects of
open burning of waste which include poor air quality and the release into the atmosphere,
of pollutants such as dioxins (Marchand et al 2012; Pheby et al 2002). Previous studies
and reports highlighted that often, these conditions posed more danger to the health of
children (WHO 2015; UN-HABITAT 2010a).
Indirect economic costs of poor MSW management practices include labour hours lost
due to employees’ affected taking time off work while direct economic costs to those
affected may include costs of buying medication, lost income, etc.
5.4 Possible Economic Opportunities identified in MSW Management in Aba
The importance of adequate funding in ensuring the smooth and effective delivery of
good MSW management services can never be overemphasised (Muhammad and Salihi
2018; Wilson et al 2015; Rodic et al 2010). As stated earlier, MSW management is an
intensive service that requires huge amounts and steady flow of cash. For the system to
be sustainable, procedures must be put in place to ensure that the short term and long
term funding costs are met (Wilson et al 2012). Part of this planning must also take into
account expected changes in demography that may affect waste generation rates, urban
growth or expansions that may involve increase in the areas from which waste collection
services are provided etc. (Rodic et al 2010; UN-HABITAT 2010b).
In Aba, this study found that the level of planning for the MSW management services can
be described as abysmal at best. There are no budgets (or if there are, they are treated as
top secret), and everything relating to funding or revenue is shrouded in secrecy. With
rapidly deteriorating equipment and a pervasive culture of neglect and poor maintenance
of existing equipment and machinery, the capacity of the management agency (ASEPA)
to effectively render MSW management services in the city is hugely inhibited (Ezeah and
Roberts 2012; Imam et al 2008). This situation means there are more openings and
opportunities in the sector as a large section of the city population demand this service.
This study found that the opportunities will be worth much more if the right policies and
processes are put in place to outlaw indiscriminate dumping. This could be through a

156
combination of an effective public education emphasising the health implications of poor
MSW management practices and a strict enforcement regime to serve as deterrent (Ezeah
2010; Nzeadibe and Ajaero 2010; Ezeah et al 2009; Adebola 2006a).
Currently, up and down the length and breadth of the MSW management chain, the
following economically viable opportunities were identified. It is noteworthy to mention
that all of these opportunities depend largely on the willingness of the government to
liberalise the sector and allow participation of interested private and community based
groups in MSW management service provision (Ezeah and Roberts 2012). Currently, the
understanding from the studies carried out is that government is actively seeking
partnerships and investments that will transform the MSW management sector in the
state. Would-be investors will desire that there are adequate policies and laws in place to
protect their investments (Nzeadibe and Ajaero 2010).
a. Sanitary Equipment
The observation of this study is that the city of Aba is under resourced in terms of basic
sanitary materials and equipment. On the 4th of December 2016, a popular television
channel in Nigeria (Channels TV) carried headline news that all stakeholders in MSW
management in Aba would have welcomed rapturously. The title was “Abia Polytechnic
Makes Waste Management Bins for State Govt.” The broadcast went further to emphasise
the state governor’s commitment to make Abia State “the number one state and SME
capital of Nigeria” (Channels Television 2016). However, till date, most residents and
households in the city do not have standard sanitary waste bins. As highlighted earlier,
the waste skips used by ASEPA are not fit for purpose. For health and safety reasons,
households should have and use the kinds of sanitary waste bins shown in Figure 5.4, and
all ASEPA skips should at the minimum look like these locally fabricated samples below.

157
Figure 5. 6: A Locally Fabricated Waste Skip [Credit: http://www.nairaland.com/3496166/abia-
polytechnic-manufactured-asepa-bins]
There should also be a massive deployment of public waste bins such as those shown
below to discourage indiscriminate dumping in public places.
Figure 5. 7: Locally fabricated public waste bins [Credit:
http://www.nairaland.com/3496166/abia-polytechnic-manufactured-asepa-bins]
There are several ways of achieving these results but it must start by encouraging the
participation of the wider stakeholder groups including but not limited to private
158
investors, community based groups, informal waste workers, all service user groups, etc.
(Wilson et al 2015; Rodic et al 2010). Manufacturing these sanitary bins locally will
present significant economic opportunities to would-be investors considering expected
demand and the estimated population of nearly one million people.
b. Waste Collection Service
Currently, MSW is not collected from house to house in the city and most residents do not
have access to any sort of MSW management services. Besides the teeming residential
population that is currently not served, most business people and market traders
expressed desire to have a reliable trustworthy service provision that guarantees the
waste they pay to be collected is not indiscriminately dumped afterwards.
Responses from participants (Table 5.15) show service users are often willing to pay for
the services if provided, and many expressed preference for a house-to-house MSW
collection service to the current system. There may be lessons to learn from informal
waste workers especially the itinerant waste pickers/buyers who currently offer similar
services in selected areas in the city. The population of the city and the expressed
willingness to pay by participants suggest waste collection service provision represent a
viable economic opportunity in the city (Ezeah 2010).
c. Waste Processing and Conversion
Currently, several informal waste recyclers operate in different formats in Aba (2.9.2.5).
Most operate at barely subsistence levels going by the researcher’s observations of their
operations and their stated incomes (see Table 5.16 and Table 5.20). Others who deal
mainly on scrap metals operate at a much higher level as their trade requires higher levels
of capital. Responses from these informal waste workers indicate that the scrap metals
are sourced from several cities in the south of Nigeria, brought to base in Aba and then
transported to metal processing companies located in Delta or Lagos states. The
participants lamented the lack of processing companies in Aba even though their trade
have thrived in Aba for more than 40 years. They said it costs significant amounts of
money to transport the stock from Aba to the locations for processing. These participants
also reported extortion by the police and other law enforcement agents in the country
who usually mount roadblocks and see dealers of scrap metals as easy targets for

159
extortion and harassment. Issues relating to conflicts of interest are discussed further in
chapter 6.
Table 5. 20: Responses from Informal Waste Workers on their Operations and Income
Participant
id
Comments
14 Yes. It will help (referring to organisation of the informal waste
sector). Currently it is more a game of luck.
We buy blindly and thus depend on the companies buying to make any
profit.
Usually, a trader will have so many boys in the field buying stock for
him. Sometimes, the further your boys go, the more stock they can buy
and thus the more business you do
16 Yes, they bring it here and I buy
This is where I sell them. Do you not see buyers here? (a few people
were checking some of the items and haggling prices). It’s these
people here that also buy it from me. That’s how we sell here.
18 The pickers bring them. We buy 4 for #5 (4 pieces for Five Naira) {£1
> #450}
Retails to: People that use them for kunu, zobo (local drinks), izal
(local disinfectant), local bleaches, soaps, etc.
20 It’s difficult to say because there are days or 2 days you will not earn
up to #2000 but at the minimum I spend over #15,000 to #20,000 on
food, medication and socials every month and all my earnings come
from here.
13 We have a store just nearby here. We stock the scraps there until we
accumulate enough quantity say 1 tonne or 2 tonnes before they are
lifted.
It’s by the weight, the heavier the metal the higher the price. There are
different metals too – Iron, Brass, Aluminium, Copper, Shoe break, etc.
15 You need to have 2, 3 4 or 5 different people buying scraps for you in
the field. They can go as far as Calabar sometimes. When you

160
aggregate all they buy, you can have up to 12 – 20 tonnes and then you
load it in trailer and transport it to the company that buys it (Asaba,
Benin, Lagos, or the new one that just opened in Obehe).
17 We don’t have fixed prices. We assess them once you bring them here
and then we decide how much to pay you.
From the responses, the study finds that proper organisation and regulation of the
informal waste sector will contribute immensely to the economic viability of the activities
of the participants as has been previously reported (Wilson et al 2015; UN-HABITAT
2014; Scheinberg 2011; Rodic et al 2010; Ezeah et al 2009). It is also important to note
the importance of quantity as a driving factor. The middlemen and the recycling
companies often require the materials that are of interest to them in significant
quantities, so much so that those dealers who can afford it have ‘boys’ who travel to other
cities within Southern Nigeria to source the materials so as to be able to amass enough
quantities for a trip to the (recycling) factory.
Based on the researcher’s local knowledge of the city and the challenges highlighted by
the informal waste workers that participated in the study, this study finds that
establishing a waste processing/conversion plant that mirrors those in Lagos, Asaba and
Warri, where the participants currently transport their wares to, will be economically
viable given the central location of Aba and its proximity and road connectivity to several
cities in the south of Nigeria.
This study also thinks it will be interesting to explore the opportunities in establishing a
waste to energy (WtE) plant considering the observed shortage in electricity supply in
the city compared to demand. Going by the guidelines provided by the International Solid
Waste Association on waste to energy in low and middle income countries, the initial
readings may not be very promising but considering that a steady regular uninterrupted
supply of electricity could command premium pricing from consumers, it is worth
consideration (ISWA 2013). There could also be further benefits accruing to the operator
of such plant considering that MSW management authorities in neighbouring cities and
states may require the services of the plant thus providing it with regular free raw
materials (waste) and possibly income from charges for treating the waste.
161
d. Sanitary Waste Disposal
Currently, waste is indiscriminately dumped. From Abayi to Ogbor Hill, Ngwa Road to
Port Harcourt Road and environs, empty spaces and streets in the city are potential waste
dumps going by the spate at which refuse dumps were observed in the neighbourhoods.
This study is of the opinion that unless something is done very quickly to arrest the
situation, it may spiral out of control. Even the waste collected by ASEPA is disposed
uncontrollably in dumpsites that are not properly planned and thus unsanitary. To arrest
the outbreak of an epidemic, there is need to institute a sanitary waste disposal regime
in the city. This means that all waste produced in the city has to be handled, transported
and disposed in a way that not only guarantees the sanitary condition of the environment
but also those of the waste generators and waste workers.
This study identifies the establishment and operation of a sanitary landfill or landfills as
of utmost importance in actualising a sustainable MSW management in the city (SEPA
2017; Sharholy et al 2008). It will ensure that the actual cost of waste disposal is properly
taken into consideration in decision making and thus help in the safeguarding of the
environment (Scheinberg et al 2010; Seadon 2010). It will also help to drive resource
efficiency measures.
Constructing a sanitary landfill will cost considerable amount of money but with the right
policies and systems in place, it could provide viable economic opportunities (EEA 2009;
EEA 2013) and contribute immensely to limiting the effects of poor waste disposal
practices (Giusti 2009).
e. Human Resource Development and Training
One of the major problems identified through this study is the use of non-professionals
and poorly skilled staff by ASEPA and EHDs. To make any significant progress in MSW
management, there need to be a cohesive effort aimed at developing the requisite human
resources that is currently almost non-existent. From top to bottom, MSW management
roles need to be filled with trained personnel appropriate for each role. Field workers
and other specialist positions also need to be filled with people with the requisite skills
and training.

162
As highlighted earlier in section 5.1.4(b), trainings are not provided to staff of the
different agencies and departments concerned with MSW management. For these, and
the many more employees that will be required to deliver the much needed effective
services, a lot of teaching and training will be required. That is a huge economic
opportunity for those with the capacity and know-how to provide the sort of
development and trainings required.
f. Monitoring and Enforcement
The lack of monitoring and enforcement was also cited by many stakeholders as some of
the key issues and challenges in MSW management. Thus there is an economic
opportunity for anyone or organisation with the capacity of providing such services or
developing technological gadgets that may be deployed to aid monitoring and thus
enhance enforcement.
g. Finance
Finance is the lens through which every economic activity is perused and as mentioned
previously, financial sustainability is of paramount importance in the governance of MSW
management (Wilson et al 2015; UN-HABITAT 2014; Rodic et al 2010). For a corruption-
laden Nigerian government agency, finance is even more paramount. The study found
that current arrangements between ASEPA and revenue consultants (contractors) are
not sustainable. The level of secrecy surrounding the arrangements and the observed
determination on the part of agency (ASEPA) leaders to avoid providing any details of
such arrangements confirms them as phoney. That said, judging by the current system of
MSW management, it is expected to be in the best interest of the agency and the
government to realise as much money as possible from the service users. This study is of
the opinion that there is a great opportunity available for a finance solution that will
ensure that all service users of MSW management services pay for the services rendered
e.g. a payment app that allows service users to pay directly to the ASEPA with added
functionalities such as the ability to request service, report sighting of uncollected heap
of refuse, etc. The same applies for finance solutions that will leverage the collection of
statutory fines in MSW management and associated penalties e.g. an app payment can
help identify repeat offenders by flagging them during a payment, etc.
163
5.5 Profiling the Current Performance of MSW Management in Aba
The current realities and challenges of MSW management in Aba have been presented in
previous sections in this chapter. The researcher believes it is helpful to profile the city’s
MSW management performance using an established and acceptable method such as the
‘Wasteaware’ ISWM benchmark indicators (Wilson et al 2012). This will make it possible
and easier to compare the city’s MSW performance to those of other cities in developing
countries, with similar income levels. It is also a first attempt at profiling MSW
management performance in Aba using the ‘Wasteaware’ ISWM benchmark indicator
model. The profiling also provides an easy to understand summary of the current MSW
management situation in the city and makes it easy for anyone with vested interest to
identify areas with satisfactory performance, and those needing priority attention for
improvement (Wilson et al 2015).
Due to the unavailability of some vital information, this profiling does not show values
for the sub-indicators and values used are subjective to the researcher’s observations
during the study. Muhammad and Salihi (2018) used similar approach in profiling the
performance of MSW management in Kano, Nigeria.
Profile
Country: Nigeria
Background Information on City
Country Income level: World Bank Income category – Lower middle; Gross national
income (GNI) per capita $5,680 (The World Bank 2017)
Population of the city: 897,560
Key Waste related data
MSW Generation (tonnes per year): Not available
MSW per capita: Not available
Waste composition: 4 key fractions – as % of total waste generated
Organic: Not available; Paper: Not available; Plastics: Not available; Metals: Not available

164
Physical Components
Waste Collection coverage: based strictly on the percentage of the city with access to
skips as observed during the study - 20%
Waste captured by the system: Only a fraction of the waste generated in the city goes into
the MSW management system. The majority of the waste in littered indiscriminately.
25% is a generous estimate.
Quality of waste collection service: Based on stakeholder feedback, public opinion and
field observations, a score of <10% is given as almost everyone was grossly dissatisfied
with ASEPA.
Controlled treatment and disposal: 0%
Degree of environmental protection in waste treatment and disposal: 0%
Recycling rate: There are no official records of the quantity of materials recycled.
However, the researcher estimates that most metals find their way into the recycling path
of the scrap metal dealers. The question though is what percentage of the waste
generated is metals? <5%
Quality of 3Rs – Reduce, reuse, recycle- provision: There is nothing on reduce and the
only reuse activities are those by informal waste pickers. A lot of reuse-able materials
such as those picked or bought by informal waste pickers end up in the drainage and
illegal dumps. <10%
Governance Factors
User inclusivity: Absolute zero – 0%
Provider inclusivity: Absolute zero – 0%
Financial sustainability: Even in the face of the current failings and inadequate service
provision to which the public are subjected, there is a surprisingly high willingness to pay
expressed by most people. This and the fact that many people showed evidence of their
payment of current levies points to the likelihood of financial sustainability of the sector.
The main problem though is the inherent corruption and nepotism which ensures cost
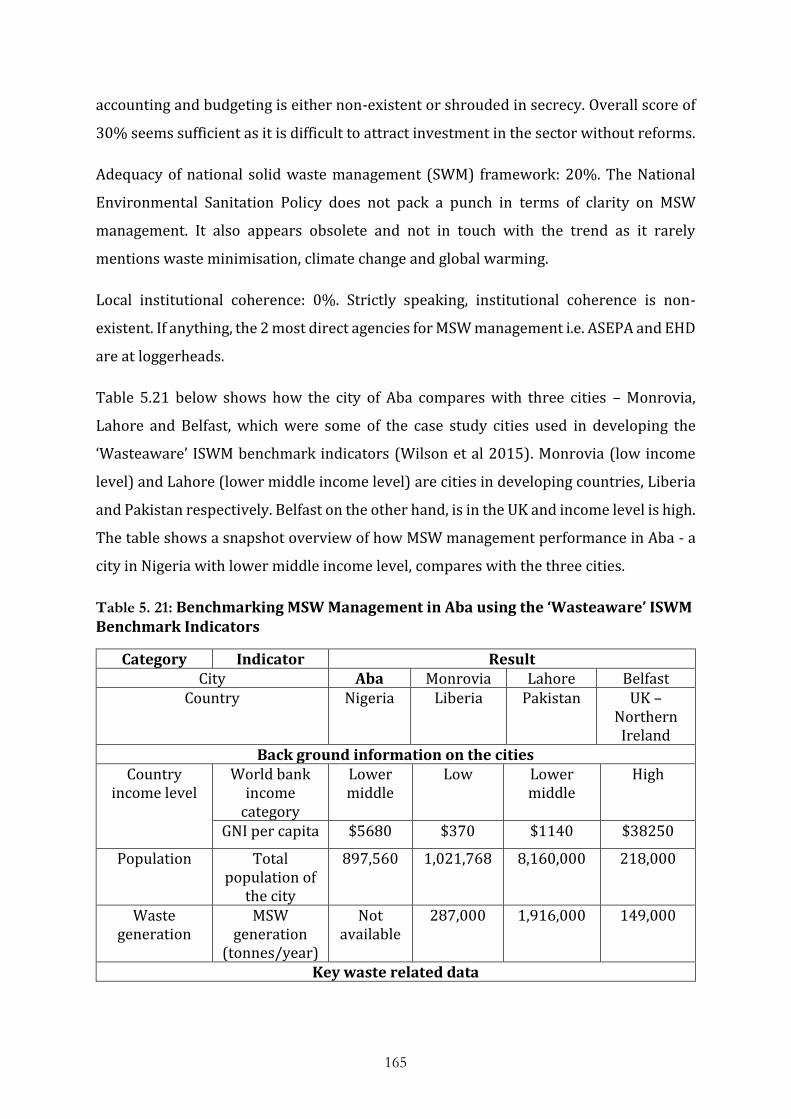
165
accounting and budgeting is either non-existent or shrouded in secrecy. Overall score of
30% seems sufficient as it is difficult to attract investment in the sector without reforms.
Adequacy of national solid waste management (SWM) framework: 20%. The National
Environmental Sanitation Policy does not pack a punch in terms of clarity on MSW
management. It also appears obsolete and not in touch with the trend as it rarely
mentions waste minimisation, climate change and global warming.
Local institutional coherence: 0%. Strictly speaking, institutional coherence is non-
existent. If anything, the 2 most direct agencies for MSW management i.e. ASEPA and EHD
are at loggerheads.
Table 5.21 below shows how the city of Aba compares with three cities – Monrovia,
Lahore and Belfast, which were some of the case study cities used in developing the
‘Wasteaware’ ISWM benchmark indicators (Wilson et al 2015). Monrovia (low income
level) and Lahore (lower middle income level) are cities in developing countries, Liberia
and Pakistan respectively. Belfast on the other hand, is in the UK and income level is high.
The table shows a snapshot overview of how MSW management performance in Aba - a
city in Nigeria with lower middle income level, compares with the three cities.
Table 5. 21: Benchmarking MSW Management in Aba using the ‘Wasteaware’ ISWM Benchmark Indicators
Category Indicator Result City Aba Monrovia Lahore Belfast
Country Nigeria Liberia Pakistan UK – Northern Ireland
Back ground information on the cities Country
income level World bank
income category
Lower middle
Low Lower middle
High
GNI per capita $5680 $370 $1140 $38250
Population Total population of
the city
897,560 1,021,768 8,160,000 218,000
Waste generation
MSW generation
(tonnes/year)
Not available
287,000 1,916,000 149,000
Key waste related data

166
Waste per capita
MSW per capita Kg per
year
Not available
230 219 683
Waste composition: 4 key fractions – as % of total waste generated Organic Organics (food
and green wastes)
Not available
50% 65% 35.1%
Paper Paper and card
Not available
5% 2% 21%
Plastics Plastics Not available
13% 12% 6%
Metals Metals Not available
2% 0.1% 3.3%
Physical Components
Public Health - Waste
Collection
Waste collection coverage
20% (L)
33% (L)
77% (M)
100% (H)
Waste captured by the system
25% (L)
30% (L)
80% (M)
98% (M/H)
Quality of waste
collection service
10% (L)
58% (M)
58% (M)
100% (H)
Environmental control –
waste treatment and
disposal
Controlled treatment and
disposal
0% (L)
70% (L/M)
8% (L)
98% (H)
Degree of environmental protection in
waste treatment and
disposal
0% (L)
45% (M)
37% (L/M)
100% (H)
Resource
management – reduce, reuse and recycle
Recycling rate <5% (L)
8% (L)
35% (M)
35% (M)
Quality of 3Rs – Reduce,
reuse, recycle - provision
<10% (L)
33% (L/M)
17% (L)
83% (H)
Governance Factors
Inclusivity User
inclusivity 0% (L)
67% (M/H
37% (L/M)
79% (M/H)
Provider inclusivity
0% (L)
60% (M)
50% (M)
80% (M/H)
Financial sustainability
Financial sustainability
30% (L)
46% (M)
54% (M)
100% (H)

167
Sound institutions,
proactive policies
Adequacy of national SWM
framework
20% (L)
17% (L)
29% (L/M)
66% (M/H)
Local institutional coherence
0% (L)
46% (M)
62% (M/H)
100% (H)
Key: Performance and colour coding – Low (L) = Red; Low/Medium (L/M) = Red/Amber;
Medium (M) = Amber; Medium/High (M/H) = Amber/Green; High (H) = Green.
[Credit Researcher]
5.6 Summary
ASEPA Aba zone is responsible for managing MSW in Aba. The agency cites poor funding
and lack of equipment as its major challenges. However, the realities from the analyses of
responses from participants and observations by the researcher show that the challenges
related to the elements of MSW management are perhaps much wider. Current guidelines
and policy for MSW management as set at the federal level does not consider waste
minimisation. The current system of MSW collection as implemented by ASEPA Aba zone
involves the use of secondary receptacles, where service users are expected to drop-off
their waste pending evacuation by the agency. However, the system is riddled with
inefficiencies in planning, manpower and resource allocations. The monthly sanitation
exercise which should be a safety net for removing improperly disposed waste does not
also work as it should.
Consequently, indiscriminate dumping, littering and illegal dumping are pervasive in the
city. Decomposing heaps of refuse and open burning of waste give rise to various
concerns related to public health including pest infestation, blocking/clogging of gutters,
poor air quality, etc. and other attendant consequences such as diseases, environmental
blight, localised flooding, etc. Officially, there is no waste treatment and the most common
disposal option practiced by the authorities is open dumping in dumpsites that are
unplanned and unsanitary.
The study found it unsuitable to use the term ‘drivers’ to describe what affects MSW
management in Aba so instead the term ‘motive’ was proposed. The common motives
identified were public health, source of income, spirituality, culture and customs. The
study also identified policies and legal frameworks, public education and awareness,

168
technology and intimidation and harassment as the driving mechanisms used by the
agency in administering MSW management in the city.
On comparison, Aba performed worse than Monrovia and Lahore – 2 cities in developing
countries with similar income levels; when profiled using the ‘Wasteaware’ ISWM
benchmark indicators. However, the identified inefficiencies and the expressed
willingness to pay for better levels of service by most participants mean there are
possible viable economic opportunities for would-be investors, given an appropriate
operating environment. The areas identified that could present the most viable economic
opportunities include production and supply of sanitary equipment, waste collection,
waste processing and conversion, sanitary waste disposal, human resource development
and training, monitoring and enforcement, and finance.

169
CHAPTER SIX
MSW Governance and Potential areas of Conflict between Stakeholder
Groups
6.0 Introduction
In chapter five, the realities and challenges related to the elements of MSW management
were presented. This chapter will focus on the second overlapping triangle concerned
with MSW management governance – aspects and stakeholders, in ISWM (Wilson et al
2015). The potential areas of conflict between service providers and service users as
identified through the analyses of responses by relevant participants and observations
by the researcher will also be highlighted.
6.1 Governance
Often times, poor governance is the main reason why MSW and other urban systems fail
(Wilson et al 2013b; Rodic et al 2010). Governance issues in MSW management focuses
on stakeholders and aspects from Figure 2.4 (pp.29). It is the human, and otherwise soft,
component of the analytical framework and includes policy or policies, the institutions,
economics, finance, technology, etc. that are involved in the MSW management system in
the city. For simplification, these are organised into three (3) sub-headings or indicators
– Inclusivity, Financial Sustainability and Proactive Policies and Institutions.
6.1.1 Realities and Challenges relating to Inclusivity
Inclusivity refers to the level of involvement, interest and influence of key stakeholder
groups in planning, policy formulation, implementation and evaluation of MSW
management in the city. Stakeholders include service users and service providers
(Wilson et al 2015; Scheinberg et al 2010).
Service users
Several factors determine the level of inclusivity in the MSW management system. For
users of the service, this has been found to include: equity of service provision,
involvement in planning, policy formation, implementation and evaluation (Al Sabbagh
et al 2012; Wilson et al 2012). Further details on the ISWM indicators for service user
inclusivity are shown in Appendix 6.
a. Equity of service provision
There is equity of service when all users of the service irrespective of what part of the
city they live have access to a good level of service they can afford, that meets their

170
expressed needs as well as protect public health and environmental quality (Wilson et al
2015).
Going by the responses of participants in this study and what was observed by the
researcher, it is safe to say that the level of MSW management services in the city is not
good. To most participants, it does not meet their needs and there are very obvious public
health concerns. The system of MSW management in place appears to disenfranchise
many service-fee paying users who reckon they do not get any service for their pay.
Similar findings were also reported in Kano where many residents do not have access to
the MSW management they pay for (Muhammad and Salihi 2018). Considering the
significant quantities of waste observed in the gutters, the level of indiscriminate
dumping and littering, and the poor air quality, of which offensive smell from rotting
waste and fumes from open burning of waste are contributory factors, this study finds
that there is no equity in service provision.
b. Involvement in planning, policy formation, implementation and evaluation
All the participants in this study stated that they have never been consulted on any issues
relating to MSW management by the agency. The participants from the TGGO stakeholder
group, who are the service providers and by extension, policy makers also confirmed that
they do not consult service users. As can be seen from excerpts from the interviews with
senior officers of the agency (Table 6.1), there is an apparent disregard to views and
opinions of service users.
Table 6. 1: Excerpt of Responses from Participants on Service User Involvement
Question Answer
Participant id = 39
That brings me to proper
stakeholder consultations.
Has there been any such
discussions or forums where
everyone has come together
to deliberate?
I believe in participatory government. I believe
everyone has a right to be heard out but I must say we
have not done this. We will do something like that once
we have the resources. The only consultations we have
had weren’t in the perspective you are talking about
but only when we had resistance to siting of waste
dumps in the communities

171
Participant id = 40
Ok. When these decisions are
taken, are the other
stakeholders consulted for
inputs towards may be
developing the process or the
running of it?
Naturally, it is difficult to consult the waste generators.
You take decisions, design the system and
communicate the decisions to them. It is the business
of the agency to design waste management strategy
and tell them the strategy so designed.
If any of them has anything to add, they can come
forward with such.
Clearly the stance and attitude expressed above is not in line with Principle 10 of the 1992
Rio Convention which states in part that “environmental issues are best handled with the
participation of all concerned citizens, at the relevant level”.
c. Public awareness and education
Public awareness and education has become an important factor and driver of changes
and developments in MSW management and rightly so. If we consider that most
developments towards a better environmental protection and resource management
such as repair, reuse, recycle, compost, etc. all require some kind of behavioural change,
then it is not too difficult to see why public awareness and education has such an
important role (Abdulredha et al 2018; Scheinberg et al 2010). By extension, principle 10
of the Rio Convention also places some importance on public awareness and education.
In Aba, responses from participants (Table 6.2) suggest current efforts at providing
public awareness and education are not streamlined as members of staff of the EHDs and
ASEPA run parallel services aimed at achieving the same purpose. Further investigations
by the researcher revealed wider problems and conflicts between the 2 bodies as
discussed further in section 4.3.
Table 6. 2: Excerpt of Responses from Participants on Public Awareness and Education by EHDs and ASEPA
Participant id Comments

172
41 The normal thing is that we should work together but they cannot
make the sacrifices we make here. The common perception is that
in civil service nobody cares, it’s nobody’s business.
The forces should be combined or make a clear differentiation in
the duties of both. That is not within my control.
40 Well, conflicts to the extent that we both can abate the same
nuisance. We are not looking at the conflicts for now because the
law, to a great extent, defines roles for every one of us.
26 Absolutely, there are conflicts. The situation ends up confusing
even the people because they seem not to know whose advice to
follow
24 Another challenge is duplication of duties. This creates confusion
for even the citizenry as they do not know whether to follow the
EHOs or ASEPA.
25 Streamlining the activities of both organisations will help a lot.
Excerpt from observation notes (6.3) taken by the researcher while accompanying ASEPA
staff on a routine awareness and sensitisation exercise in one of the markets shows that
beside the alleged friction between the 2 government bodies (EHDs and ASEPA), there
are obvious gaps in the knowledge of those saddled with the responsibility of educating
the public as well as issues related to attitude and commitment.
Table 6. 3: Excerpt of notes taken during Observation of ASEPA staffs on a routine Awareness and Sensitisation exercise
• Start time was 11am.
• There were about 15 staffs participating in the exercise.
• They had one small hand-held megaphone.
• They all went in one group while the person holding the megaphone spoke.
• The speaker admonished the traders in the area to ensure they cleaned the area
to avoid odour nuisance.
• He also told the traders to use the designated refuse skips to dispose such
refuse.
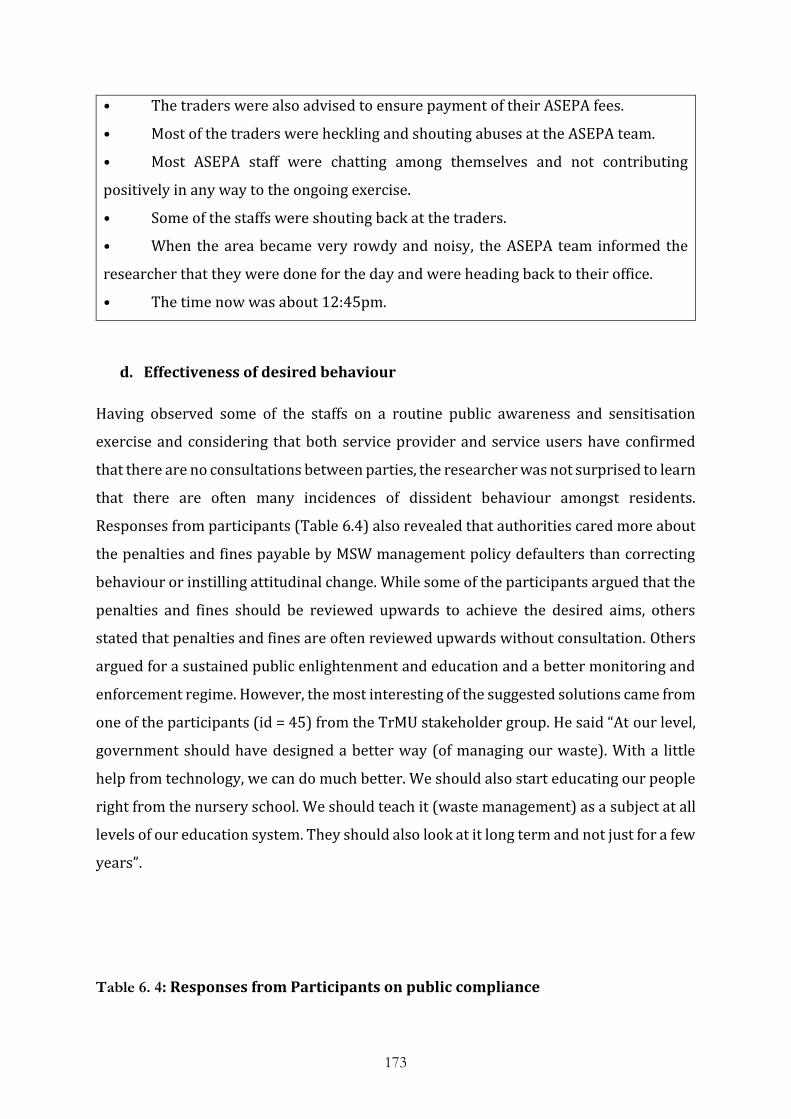
173
• The traders were also advised to ensure payment of their ASEPA fees.
• Most of the traders were heckling and shouting abuses at the ASEPA team.
• Most ASEPA staff were chatting among themselves and not contributing
positively in any way to the ongoing exercise.
• Some of the staffs were shouting back at the traders.
• When the area became very rowdy and noisy, the ASEPA team informed the
researcher that they were done for the day and were heading back to their office.
• The time now was about 12:45pm.
d. Effectiveness of desired behaviour
Having observed some of the staffs on a routine public awareness and sensitisation
exercise and considering that both service provider and service users have confirmed
that there are no consultations between parties, the researcher was not surprised to learn
that there are often many incidences of dissident behaviour amongst residents.
Responses from participants (Table 6.4) also revealed that authorities cared more about
the penalties and fines payable by MSW management policy defaulters than correcting
behaviour or instilling attitudinal change. While some of the participants argued that the
penalties and fines should be reviewed upwards to achieve the desired aims, others
stated that penalties and fines are often reviewed upwards without consultation. Others
argued for a sustained public enlightenment and education and a better monitoring and
enforcement regime. However, the most interesting of the suggested solutions came from
one of the participants (id = 45) from the TrMU stakeholder group. He said “At our level,
government should have designed a better way (of managing our waste). With a little
help from technology, we can do much better. We should also start educating our people
right from the nursery school. We should teach it (waste management) as a subject at all
levels of our education system. They should also look at it long term and not just for a few
years”.
Table 6. 4: Responses from Participants on public compliance

174
Participant
id
Comment
22 If you arrest an environmental offender and bring the person to court,
rather than set an example with the person, the magistrate is more
interested in the fine the person will pay to the government because
the government is looking for money to pay the political thugs. It is
only the poor people who cannot pay the fines that are thrown into
the cell.
Only the poor and those without connection to people in power get
punished for MSW management offences.
24 ASEPA also uses ‘fire brigade’ approach. Their emphasis is always on
fines and levies and not really on educating people. This approach
does not solve the problem as the people do not learn even after
paying penalties or fines.
5 You will be apprehended and charged to court. There, you will pay a
hefty fine and also pay the fee
26 For the local governments, the emphasis is always on raising money.
Every drive on the sanitation day is geared towards making money
from would-be defaulters and not to engender change
32 You can’t challenge them and there is nothing you can do. If we don’t
pay, they won’t even allow you to open this place. They will come with
their thugs to harass you and destabilise your business
Service Providers
The main indicators of inclusivity on the part of service providers of MSW management
in the ISWM analytical framework revolve around the involvement, encouragement and
acknowledgement of the roles and interests of both the public and private and or formal
and informal/community groups (Al Sabbagh et al 2012; Scheinberg et al 2010).
According to the UN-HABITAT report (2010a), the informal and micro-enterprise
recycling sector in some developing and transitional countries have recorded average
recycling rates of 29% in the last 10 – 20 years. These figures are reportedly similar to

175
those recorded in some developed countries. In many developing countries around the
world, private sector participation in MSW management service provision is the norm
(Guerrero et al 2013; Al Sabbagh et al 2012). But in Aba, so many people make a living
dealing on materials regarded commonly as waste. These informal waste workers
operate in different modes (see section 2.9.2.5 and table 5.9) and they are responsible for
all the reuse and recycling activities in the city. However, there is no provision in the
current system to recognise and quantify their inputs to the MSW management efforts.
To make matters worse, the government through ASEPA does nothing but disparage
these people.
The researcher was duly informed of an exercise carried out by ASEPA to have a register
of all informal waste pickers and scavengers operating in the city. To be on the said
register and thus to be allowed to operate as an informal waste picker in the city, each
waste picker was mandated to pay #500 (five hundred Naira) and was to be issued with
an identity card. At the time of this study, the identity card had not been issued to those
who paid the said levy. So the registration exercise was not for the purposes of having a
record of their contribution to resource management efforts of MSW but rather because
the agency viewed the group as criminals, accused of dumping human corpses on the
agency operated dumpsites as well as suspects for other sundry offences. Most of the
informal waste workers recounted stories of the agency’s high handedness, extortion and
incessant harassment with the use of thugs, police and other law enforcement agents.
This is discussed further in section 6.2 (j).
6.1.2 Financial Sustainability
An effective MSW management system is often a structured set of components that
include collection, transport, resource recovery, processing and disposal each of which
could be provided by a separate actor in the system (Rodic et al 2010). In a tropical city,
effective collection of MSW could mean daily collection and could cost 10 to 20% of a
city’s budget (Wilson et al 2001). Furthermore, because MSW management is a public
service, which by law should be provided for all regardless of the interest of the market
to supply the service or users’ ability or willingness to pay for the services supplied
(Wilson et al 2013b; Rodic et al 2010), it is essential to have adequate financial planning
in place.

176
Some of the indicators of financial sustainability as developed for the ISWM framework
include transparent cost accounting procedures, adequacy of the total budget, local cost
recovery from service users, affordability of user charges, pricing of disposal and access
to capital investment (Wilson et al 2015, Rodic et al 2010). The cost accounting
procedures should accurately detail the full costs of the MSW management services as
well as the relative cost of the different activities within the MSW management while the
budget should be adequate to cover the full costs of running the services. The records
should also be open to public scrutiny. This means that the role of government in either
service provision or regulation remains central to whether or not the MSW system
succeeds (Rodic et al 2010).
Consequently, city governments adopt different strategies in order to achieve set goals.
In Kano state, the government almost completely provides the funds for the operation
and maintenance of MSW management services in the city with private operators directly
charging the small fraction of service users they serve (Muhammad and Salihi 2018). In
some other cities in developing countries such as Kunming (China), Bengaluru (India)
and Managua (Nicaragua), the service fees are intentionally kept very low and no punitive
measures are applied on non-payers even though only about 40-50% actually pay the
fees (Rodic et al 2010). In Abia State, a government official (participant id = 39) told the
researcher that the government was more inclined to providing MSW management
services to the people irrespective of whether or not they are paid for by the users.
However, this is not reconcilable with responses from participants in the study and what
was observed by the researcher in Aba. Inefficiency and insufficiency characterised the
services provided by ASEPA so much that participants decried the fees paid to ASEPA for
services as they spent additional sums on informal waste workers for the same services.
For most participants, their regret over the charges was not hinged on affordability but
rather on perceived lack of service on the part of ASEPA as discussed further in section
6.2(e).
On budgets and costs of running the MSW management system, each of the participants
from the TGGO stakeholder group were quick to cite lack of funds as the main mitigating
factor to the provision of efficient MSW management services in Aba. However, they
refused to provide any information relating to the size of the budget, expenditure, margin
of shortfall (if any), actual costs of running the service or total receipts from service user

177
charges. Table 6.5 below provide some of the exchanges between the researcher and
some participants from the relevant stakeholder group.
Table 6. 5: Excerpt of Responses from Service Provider on Budget, Costs and Finance
Question Answer
Participant id = 39
What is the budget for managing
waste in Aba
I don’t have access to that information but I
know it’s huge. I also know the biggest
challenge we have in managing waste properly
is because of the huge amount of funds required
What revenue or percentage of the
costs does government expect to
generate from the levies?
We have not done those calculations that would
have made the process smarter. Government is
also more inclined to providing the service
irrespective of whether people pay for it or not
because it is a public or social service
Participant id = 40
Okay. Now that you have mentioned
funds, what is the budget like? I
know it must cost a lot
I may not be competent to speak on that
Participant id = 56
How many zones do you cover? Just one
For your zone, what are the costs
like?
I am not in a position to disclose that
In terms of access to capital and investment in the MSW management system, it was
unsurprising, albeit not to government officers, to learn that several efforts to attract
investment to the sector and for certain government plans such as waste recycling and
processing plants have not yielded the commensurate results. In the excerpts (Table 6.6)
below, the senior government officer all but confirms the prevalence of corruption
(financial indiscipline) as one of the major problems bedevilling public services in
Nigeria, and a key reason why attracting investment in MSW management which is solely
controlled by government and its agency is very difficult.
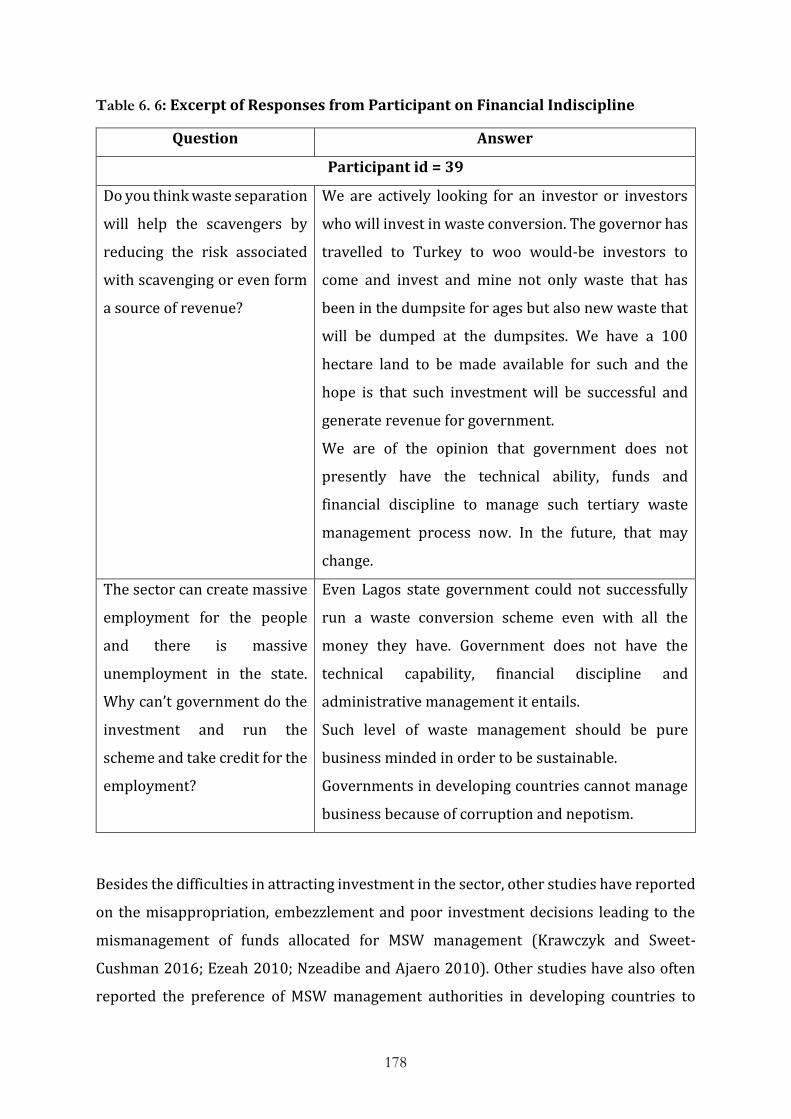
178
Table 6. 6: Excerpt of Responses from Participant on Financial Indiscipline
Question Answer
Participant id = 39
Do you think waste separation
will help the scavengers by
reducing the risk associated
with scavenging or even form
a source of revenue?
We are actively looking for an investor or investors
who will invest in waste conversion. The governor has
travelled to Turkey to woo would-be investors to
come and invest and mine not only waste that has
been in the dumpsite for ages but also new waste that
will be dumped at the dumpsites. We have a 100
hectare land to be made available for such and the
hope is that such investment will be successful and
generate revenue for government.
We are of the opinion that government does not
presently have the technical ability, funds and
financial discipline to manage such tertiary waste
management process now. In the future, that may
change.
The sector can create massive
employment for the people
and there is massive
unemployment in the state.
Why can’t government do the
investment and run the
scheme and take credit for the
employment?
Even Lagos state government could not successfully
run a waste conversion scheme even with all the
money they have. Government does not have the
technical capability, financial discipline and
administrative management it entails.
Such level of waste management should be pure
business minded in order to be sustainable.
Governments in developing countries cannot manage
business because of corruption and nepotism.
Besides the difficulties in attracting investment in the sector, other studies have reported
on the misappropriation, embezzlement and poor investment decisions leading to the
mismanagement of funds allocated for MSW management (Krawczyk and Sweet-
Cushman 2016; Ezeah 2010; Nzeadibe and Ajaero 2010). Other studies have also often
reported the preference of MSW management authorities in developing countries to

179
pursue modernisation programmes involving the spending of significant amounts of
money on imported sophisticated machinery and equipment such as the splashing of
about $5.5million on the importation of refuse collection vehicles by the Abia State
government in 2006 (Ezeah and Roberts 2014; Nzeadibe and Ajaero 2010; Bhuiyan 2010;
Wilson et al 2001).
6.1.3 Proactive Policies and Sound Institutions
Part of what forms good institutional coherence under the ISWM framework is existence
of clear policies and legal frameworks as well as the institutions to effect the
implementation of these policies and legal frameworks (Wilson et al 2015). Transparency
and clarity of management structures, lines of accountability, contracting procedures,
budgets, cost recovery and corruption, as well as labour practices are often examined in
the determination of institutional coherence (Rodic et al 2010). The ISWM framework
also takes into account the differences in policies that may exist at different levels or tiers
of government (Wilson et al 2015; Scheinberg et al 2010). In Nigeria, this is very
important as the National Environmental Sanitation Policy developed at the federal level
is expected to be implemented in the states by the local councils (FME 2005). Accepted
that the national policy is inadequate and needing urgent modernisation if Nigeria is to
achieve ISWM, one may also argue that it (the national policy) forms a good basis to begin
as it contains some strategies to engender improvements in MSW management. This
study notes that interpretation and implementation by states are the keys to achieving
the desired objectives. Consequently, the detachment of the state environment agency
(ASEPA) from the ministry of environment has been identified as a potential major issue.
The reason being that unlike in other states such as Lagos and Cross River states where
the state ministry of environment supervises the activities of the state environmental
protection agency and thus ensures synergy and the streamlining of the management
processes (Nzeadibe and Ajaero 2010), the agency in Aba (ASEPA) is directly under the
supervision of the governor and runs as a parallel entity. This deprives the agency of the
inputs of the ‘professionals’ at the ministry of environment. Actually, the problem is more
severe than that as shown in the excerpt from interviews with the relevant participants
in Table 6.7 below.

180
Table 6. 7: Excerpt of Participants Responses related to institutional coherence
Question Answer
Participant id = 24
In your role as the head of
department, what is the
contribution of your
department to the waste
management policy? What is
your role?
Presently, no meaningful role as policy is made at the
top. FME makes the policy, the states and local
governments are expected to implement the policy but
interpretation differ markedly at both state and local
government levels.
Aba is the way it is because of the use of non-
professional in the management of waste. ASEPA is
responsible for managing waste in Aba but there are no
professionals in that agency so they do it their own way.
That is the greatest challenge.
Another challenge is the duplication of duties. This
creates confusion for even the citizenry as they do not
know whether to follow the EHOs or ASEPA.
Streamlining the activities of both organisations will
help a lot.
Participant id = 25
In your own words, what is
your opinion of waste
management in Aba?
Legally, it is supposed to be a function of the local
government as the third tier but in Abia state, it is given
to ASEPA. ……
Because the job is given to ASEPA, I have a limited role
in waste management. ASEPA simply does crude
dumping which is a lay man approach. There are no
technical inputs at all.
Participant id = 23
In your own words sir, what
is your perception of waste
management in the Aba
The fact is that the town planning authority is not in any
way involved with municipal solid waste management
in Aba.
Participant id = 40
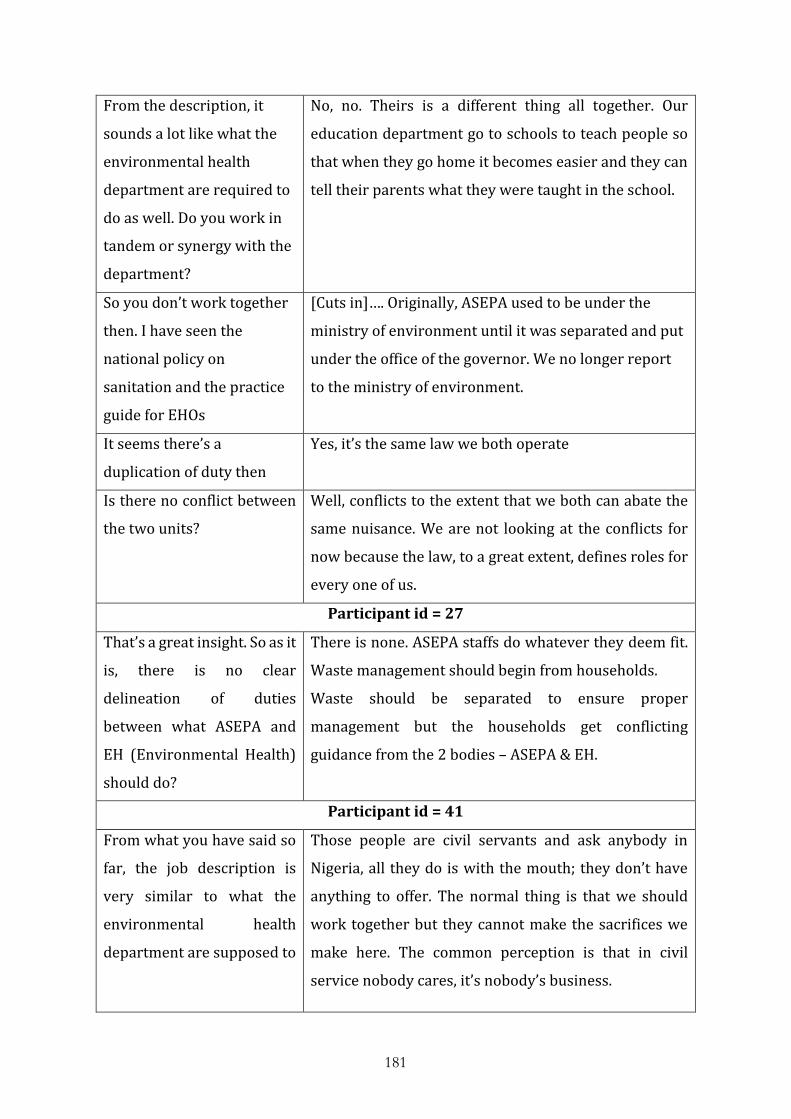
181
From the description, it
sounds a lot like what the
environmental health
department are required to
do as well. Do you work in
tandem or synergy with the
department?
No, no. Theirs is a different thing all together. Our
education department go to schools to teach people so
that when they go home it becomes easier and they can
tell their parents what they were taught in the school.
So you don’t work together
then. I have seen the
national policy on
sanitation and the practice
guide for EHOs
[Cuts in]…. Originally, ASEPA used to be under the
ministry of environment until it was separated and put
under the office of the governor. We no longer report
to the ministry of environment.
It seems there’s a
duplication of duty then
Yes, it’s the same law we both operate
Is there no conflict between
the two units?
Well, conflicts to the extent that we both can abate the
same nuisance. We are not looking at the conflicts for
now because the law, to a great extent, defines roles for
every one of us.
Participant id = 27
That’s a great insight. So as it
is, there is no clear
delineation of duties
between what ASEPA and
EH (Environmental Health)
should do?
There is none. ASEPA staffs do whatever they deem fit.
Waste management should begin from households.
Waste should be separated to ensure proper
management but the households get conflicting
guidance from the 2 bodies – ASEPA & EH.
Participant id = 41
From what you have said so
far, the job description is
very similar to what the
environmental health
department are supposed to
Those people are civil servants and ask anybody in
Nigeria, all they do is with the mouth; they don’t have
anything to offer. The normal thing is that we should
work together but they cannot make the sacrifices we
make here. The common perception is that in civil
service nobody cares, it’s nobody’s business.

182
do. Do you work in tandem
or synergy at all?
Contrary to findings previously reported (UNEP 2015; Wilson 2007), most participants
argued that new laws and policies were needed in the city to tackle the challenges of poor
MSW management. However, participants from the LEPI stakeholder group agreed with
such reports. They opined that there was nothing wrong with current laws and argued
that the institutions are still present but moribund compared to the era when things
worked comparatively better, and the institutions were active and effective. The group
blamed politicians for overlooking professionalism in the appointment and recruitment
of members of staff of sensitive agencies responsible for MSW management. They alleged
that only cronies and thugs/loyalists sympathetic to the political causes of the politicians
get recruited into those agencies. The group suggested that irrespective of the risks to life
involved, what is required is a platform or avenue of a peoples’ action that will seek to
protect peoples’ rights and hold government accountable for the failures. The small town
of Ghorahi in Nepal, with lower GDP is a good demonstration of how committed
leadership with genuine participatory approach can ensure institutional coherence and
help overcome financial constraints (Rodic et al 2010).
6.2 Areas of Conflict between Stakeholders
As highlighted in section 6.1.1, the consultation and involvement of service users in
decision-making on policy, planning and siting of facilities, as well as the existence of
formal procedures for measuring customer satisfaction and effective feedback
mechanisms form core measures or indicators of inclusivity in MSW management
governance (Wilson et al 2012; Rodic et al 2010). In cities in developing countries where
significant progress has been reported in their MSW management development journey,
one common recurrent feature is the existence of active stakeholders’ platforms
established to enhance communication, exchange, and a participatory approach to
planning and operations of solid waste services (Rodic et al 2010). From Moshi (in
Tanzania) to Bamako (in Mali), these stakeholders’ platforms exist. In Ghorahi (in Nepal),
the committee involving all key stakeholders regularly monitors and contributes to
effective management of the local modern landfill, and is headed by a local person (Rodic
et al 2010).

183
Generally speaking, and on a much wider scale, the importance of stakeholder
partnerships in development interventions have been widely advocated for but often
neglected especially in developing countries (Matsaert et al 2005). Though there are
several benefits of citizens’ participation in the local governance of systems such as MSW
management, including improvement in the management of public resources, reduction
in corruption by enhancement of accountability of public office holders and political
leaders, and a positive impact on democracy; such opportunities for participation are
often very minimal in West Africa (Krawczyk and Sweet-Cushman 2016). This is arguably
true for most MSW management systems in Nigerian cities though Muhammad and Salihi
(2018) reported that in Kano, members of the MSW management agency seldom hold
talk shows in public media as an avenue for the general public to lay their complaints and
suggestions. While this study thinks that the arrangement in Kano doesn’t go far enough,
this study finds that nothing like it is even available for service users in Aba, and the
researcher believes the power relationship between ASEPA and other stakeholder
groups is contributory. Responses from an overwhelming majority of participants show
that the power relationship between government (ASEPA – service provider) and other
stakeholders (service users) is greatly distorted as the government wields all the power.
There are no consultations with service users, so people are compelled to do what the
government say or be harassed and intimidated. There is not even a formal avenue for
complaints or suggestions. The situation has degenerated to the level that while most
participants have resorted to self- help by paying informal waste workers, others
divulged plans to beat up agents and staff of ASEPA as reflected in the following
comments – “I don’t think so but people are just powerless to make the place better. It is
the responsibility of government first, and then the people. I know many people do what
they are expected to do which is pay their money but when government does not do what
they are required to do especially after collecting money from people, then people have
every right to be angry” (Participant id = 11) and “Let me tell you, they must die when
next they come here. The level of extortion here is utter ridiculous and we won’t tolerate
it anymore” (Participant id = 37). The tensed relationship between service providers and
users was also observed by the researcher during a routine sensitisation exercise by
members of staff of ASEPA as shown in Table 5.12.

184
While the study believes that the apparent lack of consultations and ineffective exchange
of communications between ASEPA (service provider) and other stakeholders (service
users) is a major contributor, existing tensions may also be caused by inadequate policies
or implementation of policies, perceived neglect of the public by the government and
political leaders, and other operational inefficiencies and shortfalls. Common areas of
conflict identified by the study include:
a. Allocated/Stipulated Disposal Times
ASEPA requires service users in areas where there are designated receptacle points
(skips) to deposit their bagged waste between 5pm to 9/10pm. Even though many
participants stated that the allocated times were announced at the inception of the policy,
most participants maintained that the schedule is not suitable for most service users.
They argued that most professionals and people who worked in offices were
inadvertently excluded from using the service as they will often be held up in the
congested traffic in the city’s roads on their way back from work. They also argued that
the traders and artisans who spent most of their days in the city’s major markets and
business clusters were deprived of the services in their various residential homes unless
they had the services of house-helps or made alternative arrangements. Table 6.8 below
show some of the comments made by participants.
Table 6. 8: Responses from Participants on Stipulated Disposal Times
Participant id Comments
1, 2, 4, 5, 7, 8, 49 Does not work for professionals and people who work in an
office.
3, 6, 9, 11, 12 They should change the time for people to bring their waste as it
makes it difficult for most people.
2, 5, 33, 35 The waste skips are always manned and if you put any litter
there out with the designated times (5pm to 10pm), they will
catch you and extort money from you. The timing doesn’t work
for most people.
The researcher observed that most illegal dumping happened in the dark (at night).
Therefore, if times restrictions for the transport of waste by service users must be

185
implemented, such restrictions should limit the transport of waste at night times.
However, this study did not identify any inherent benefits of such time limitations except
that it creates a possible avenue and opportunity to penalise and fine defaulters, and thus
generate revenue which often times is not accounted for by the collectors.
b. Rejection of the #50 (Fifty Naira) Waste Bag and Dissident Behaviour
As highlighted previously in chapter 5, indiscriminate dumping and littering is prevalent
in the city. Though this study thinks the current system of waste collection implemented
by ASEPA and the general lack of standard temporary storage bins like wheelie bins
makes the use of plastic waste bags redundant, the agency insists the solution to
indiscriminate dumping and the prevention of the stench from rotting refuse rests on the
use of such bags by service users. Consequently, ASEPA enforces the monopoly of the sale
of such bags at #50 each but service users have simply refused to buy or use it. Most
participants cited affordability issues while others see it as another avenue of extortion
as reflected in the comments shown in Table 6.9. The researcher believes that the action
of the service users (in rejecting the purchase and use of the bags), and other evidences
of dissident behaviour and non-compliance to expected behaviour e.g. indiscriminate
dumping, illegal dumping, littering, etc. is not unconnected with the distorted power
relationship between ASEPA as a service provider and service users.
Table 6. 9: Responses from Participants relating to the #50 Bag and Dissident Behaviour
Participant id Comments
3, 5, 7, 9, 11, 12,
40, 41, 44
The bags sell for #50 each and that is one of the major problems
and the people are complaining seriously. It is not affordable and
the people have rejected it.
42 Yes, another challenge is that there is an ongoing education
campaign educating people to use our refuse bags but people do
not want to buy the bags.
24 Actually, the law gives us power to act as some sort of constables
and to enforce the environmental health law but people are very
wild these days and because my staffs are not armed, we rely on
the police and the court for enforcement.

186
2 Market women do not dispose their waste accordingly.
1 I call them recidivists. It’s common when it rains so enough men
should be provided to monitor and enforce at such times.
56 Also, Aba residents are very stubborn. People still dump their
refuse indiscriminately and in such situations, there is very little
anyone can do.
c. Sanitation Levy and Funding Issues
Most participants in the study stated that they did not know the method (if any) used in
deciding the amounts demanded from them by ASEPA as sanitation fees. They also did
not know why the said fees increase year after year without any significant improvement
in level of service. Some other concerns raised by participants include the duplication of
sanitation/environmental levies and intimidation and harassment for non-payment even
after payment has been made; as shown in Table 6.10 below.
Table 6. 10: Responses from Participants relating to Service Fees
Participant id Comments
9, 11, 38 They increase all the time. There’s duplication of environmental
taxes in Abia state.
7 Last year it was #1,200 but now it’s gone up to #2,000 (Two thousand
Naira) for a store like this.
3, 8 Yes, we pay but not directly to government but to revenue collectors.
It's actually a problem because there is no link between what is paid
and disposing of waste as there is no service provided.
30 Most issues relate to either increased sanitation levy or clients who
have paid and are erroneously being chased for non-payment.
I think because people are not properly oriented as to what they
ought to pay and when. The mode of collection is also not perfect and
people will find ways of avoiding to pay.
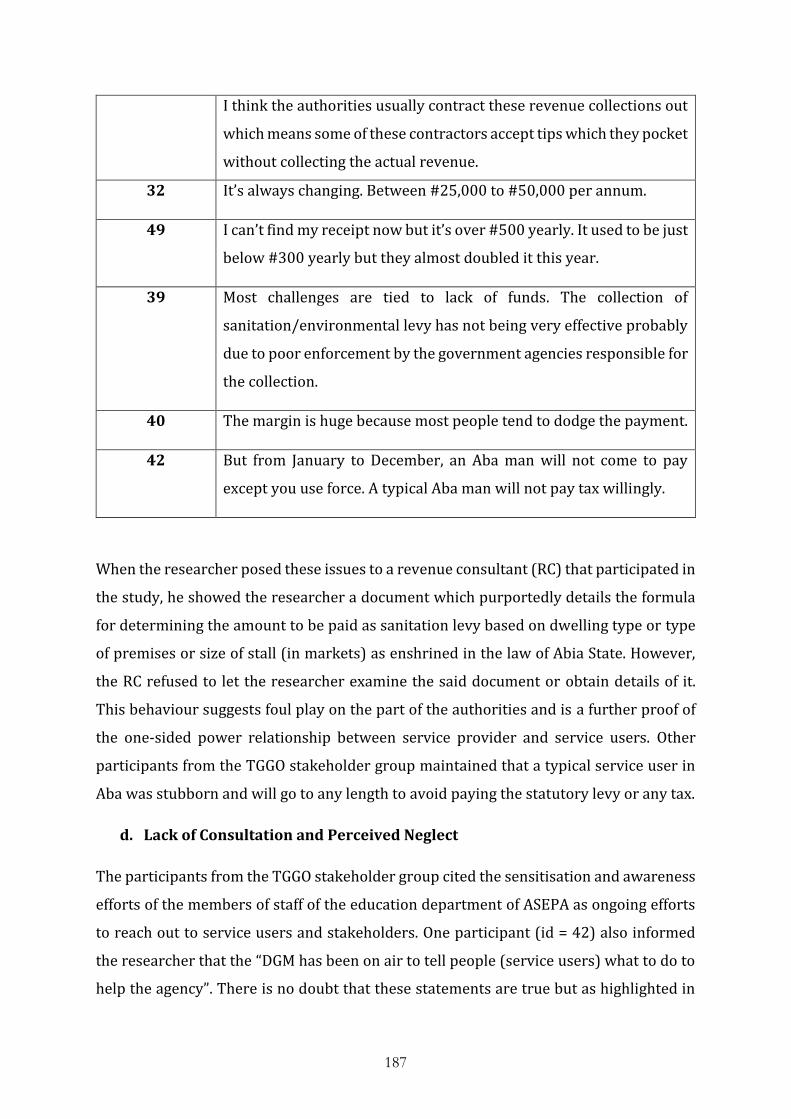
187
I think the authorities usually contract these revenue collections out
which means some of these contractors accept tips which they pocket
without collecting the actual revenue.
32 It’s always changing. Between #25,000 to #50,000 per annum.
49 I can’t find my receipt now but it’s over #500 yearly. It used to be just
below #300 yearly but they almost doubled it this year.
39 Most challenges are tied to lack of funds. The collection of
sanitation/environmental levy has not being very effective probably
due to poor enforcement by the government agencies responsible for
the collection.
40 The margin is huge because most people tend to dodge the payment.
42 But from January to December, an Aba man will not come to pay
except you use force. A typical Aba man will not pay tax willingly.
When the researcher posed these issues to a revenue consultant (RC) that participated in
the study, he showed the researcher a document which purportedly details the formula
for determining the amount to be paid as sanitation levy based on dwelling type or type
of premises or size of stall (in markets) as enshrined in the law of Abia State. However,
the RC refused to let the researcher examine the said document or obtain details of it.
This behaviour suggests foul play on the part of the authorities and is a further proof of
the one-sided power relationship between service provider and service users. Other
participants from the TGGO stakeholder group maintained that a typical service user in
Aba was stubborn and will go to any length to avoid paying the statutory levy or any tax.
d. Lack of Consultation and Perceived Neglect
The participants from the TGGO stakeholder group cited the sensitisation and awareness
efforts of the members of staff of the education department of ASEPA as ongoing efforts
to reach out to service users and stakeholders. One participant (id = 42) also informed
the researcher that the “DGM has been on air to tell people (service users) what to do to
help the agency”. There is no doubt that these statements are true but as highlighted in

188
section 6.1, the researcher’s observations identified several reasons why the public
education and awareness efforts of the members of staff of the education department of
ASEPA are not effective. The DGM being on air to tell people what to do does not also
equate to proper consultations with stakeholders as prescribed for effective governance
in MSW management (Muhammad and Salihi 2018; Wilson et al 2015; UN-HABITAT
2014; Rodic et al 2010); and the position of most participants reflect that reality as shown
below in Table 6.11.
Table 6. 11: Responses from Participants show lack of Consultation and Neglect
Participant
id
Comment
7 In this part of the country nobody cares about the masses. They only care
about filling their pockets. They lack both ethical and moral value here
unlike in the western world. The leaders here are morally bankrupt so
how could they even think of consulting the masses?
8, 20 Never. Actually, this is the first time anyone is asking me anything on
waste management like this.
9 It is like that because this present democracy that is almost 20 years has
no program, no positive and practical program. They may claim to have
ASEPA and what have you, but they are all empty claims that can be
likened to building a house without foundation.
10 You’re talking within yourself not for people in Aba.
……go and research something else. This will not work here in Aba. Aba
is a dump. Go to Obohia road and Port Harcourt road and talk about
sanitation. Here is heaven and you’re talking about sanitation.
12 Who are you going to complain to? Are you new in this country? It’s the
same all over though it’s worse here in Abia state. Nobody cares about
your complain. You can cry from now till thy kingdom come, they will
collect the money if they want to.
13 I don’t know what anyone or government can do. I don’t think the
government is interested in this kind of our business because it is a dirty
business

189
14 The government is aware, but they have chosen not to help us. There was
a time we even protested and patrolled the city with scrap to buttress
our point but still the intimidation and extortion remains.
22 Zero. Let me tell you why I said zero [explains with a scenario]. The usual
modes of campaigning for votes should be used to engage the people. It
all boils down to corruption. Because our government is corrupt and the
people are all thugs, if they do things the way it’s supposed to be done, it
will delay the looting.
24 We are poorly motivated. As a civil servant, you work for your salary but
here we don’t get paid as at when due. We are now in October and we
are still waiting for May salaries. I have up to 200 staff in this department
but less than 100 come to work because they have not been paid and
morale is at an all-time low.
25 Also we do not have any mobility. We sponsor ourselves to deliver our
duties. We print our abatement notices; pay our transportation fares to
sites, everything. There is no provision by the government at all.
27 We hardly get salaries to be honest and the local government council
don’t have any provisions for waste management. They seldom do on
clean up days and they look to recover that money from fines too.
28 We (people working in waste management) are always looked down
upon as the lowest cadre of people in the society. As a result, staff morale
is very low and getting staff is even difficult.
30 To the best of my knowledge, there is nothing like that. Government just
do their thing the way they feel conducive and the masses are expected
to play along. I have never been consulted before.
31 Complain to who (whom)? Leave that matter oo, we are suffering and
smiling here. They can do whatever they like and nobody can do
anything. Everyone likes their life abi you no like your life? (Meaning Or
do I not like my life?)
33 There’s absolutely no communication. Even the inspection teams don’t
give you any information
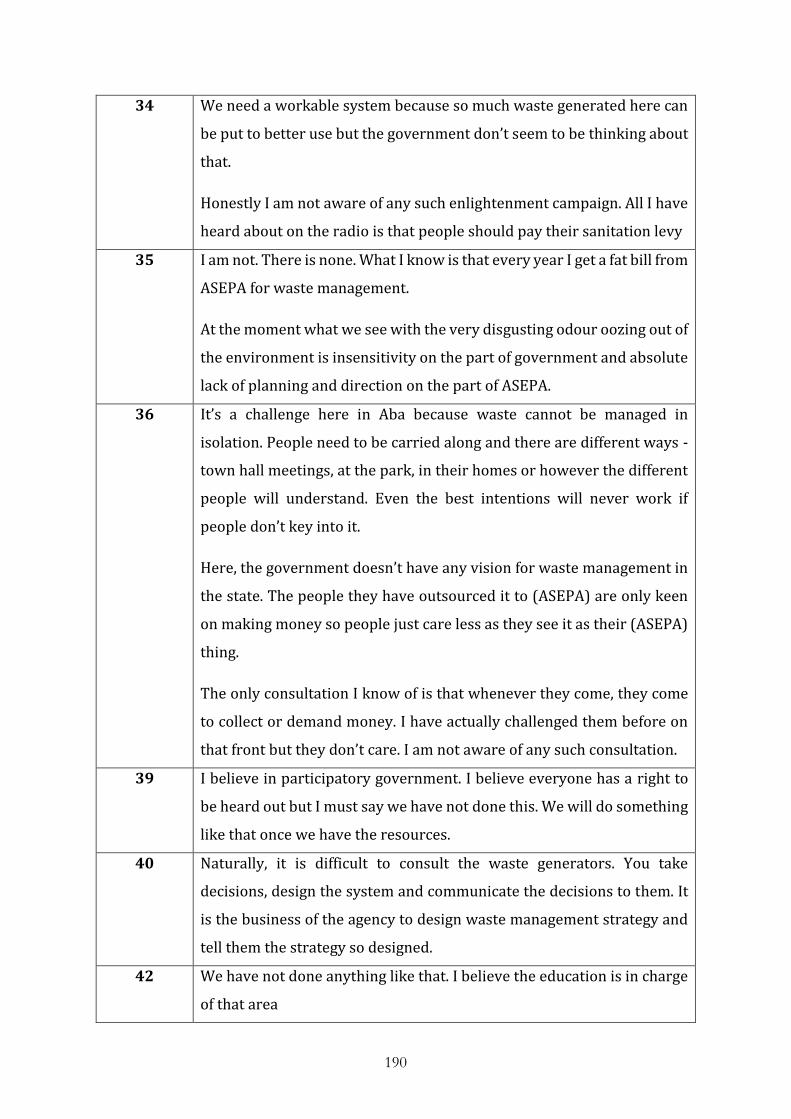
190
34 We need a workable system because so much waste generated here can
be put to better use but the government don’t seem to be thinking about
that.
Honestly I am not aware of any such enlightenment campaign. All I have
heard about on the radio is that people should pay their sanitation levy
35 I am not. There is none. What I know is that every year I get a fat bill from
ASEPA for waste management.
At the moment what we see with the very disgusting odour oozing out of
the environment is insensitivity on the part of government and absolute
lack of planning and direction on the part of ASEPA.
36 It’s a challenge here in Aba because waste cannot be managed in
isolation. People need to be carried along and there are different ways -
town hall meetings, at the park, in their homes or however the different
people will understand. Even the best intentions will never work if
people don’t key into it.
Here, the government doesn’t have any vision for waste management in
the state. The people they have outsourced it to (ASEPA) are only keen
on making money so people just care less as they see it as their (ASEPA)
thing.
The only consultation I know of is that whenever they come, they come
to collect or demand money. I have actually challenged them before on
that front but they don’t care. I am not aware of any such consultation.
39 I believe in participatory government. I believe everyone has a right to
be heard out but I must say we have not done this. We will do something
like that once we have the resources.
40 Naturally, it is difficult to consult the waste generators. You take
decisions, design the system and communicate the decisions to them. It
is the business of the agency to design waste management strategy and
tell them the strategy so designed.
42 We have not done anything like that. I believe the education is in charge
of that area
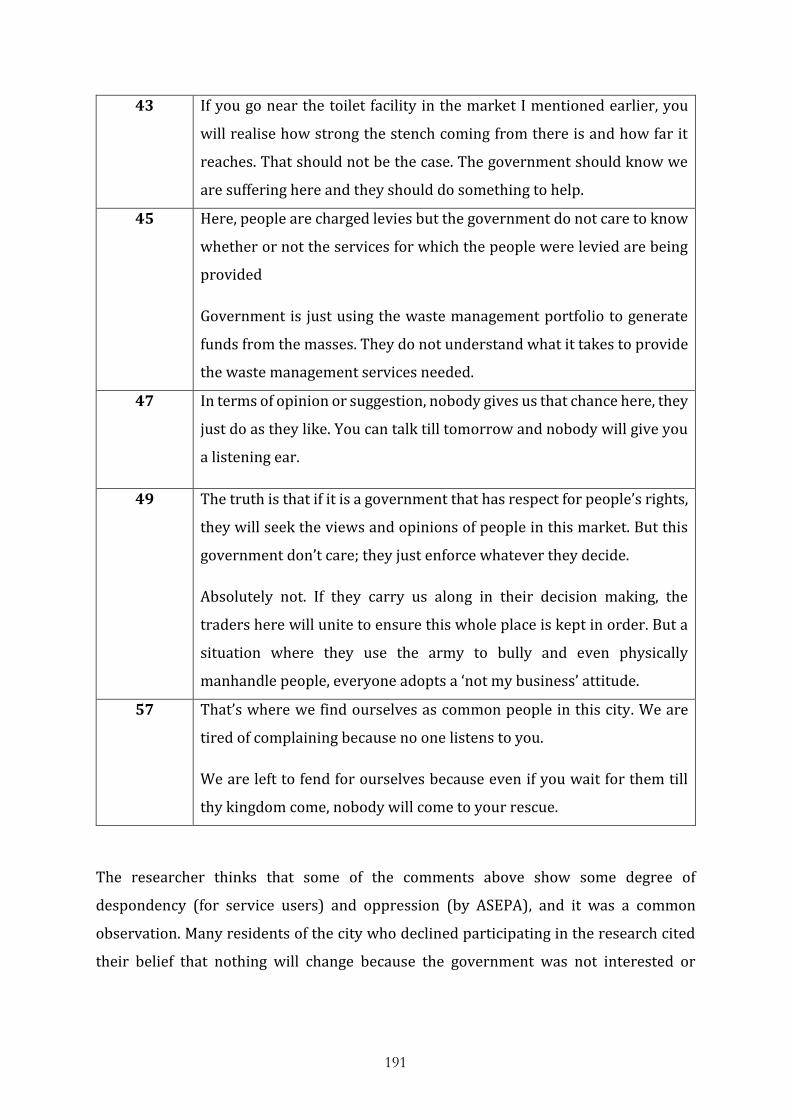
191
43 If you go near the toilet facility in the market I mentioned earlier, you
will realise how strong the stench coming from there is and how far it
reaches. That should not be the case. The government should know we
are suffering here and they should do something to help.
45 Here, people are charged levies but the government do not care to know
whether or not the services for which the people were levied are being
provided
Government is just using the waste management portfolio to generate
funds from the masses. They do not understand what it takes to provide
the waste management services needed.
47 In terms of opinion or suggestion, nobody gives us that chance here, they
just do as they like. You can talk till tomorrow and nobody will give you
a listening ear.
49 The truth is that if it is a government that has respect for people’s rights,
they will seek the views and opinions of people in this market. But this
government don’t care; they just enforce whatever they decide.
Absolutely not. If they carry us along in their decision making, the
traders here will unite to ensure this whole place is kept in order. But a
situation where they use the army to bully and even physically
manhandle people, everyone adopts a ‘not my business’ attitude.
57 That’s where we find ourselves as common people in this city. We are
tired of complaining because no one listens to you.
We are left to fend for ourselves because even if you wait for them till
thy kingdom come, nobody will come to your rescue.
The researcher thinks that some of the comments above show some degree of
despondency (for service users) and oppression (by ASEPA), and it was a common
observation. Many residents of the city who declined participating in the research cited
their belief that nothing will change because the government was not interested or

192
willing to effect the changes needed as their main reason for not taking part. Oppression
and how to overcome oppression are discussed in further details in section 6.3.
While it may be premature to herald the success of the PNS approach adopted by the
researcher in terms of the stimulation of the participants’ concern about the
environment and taking action aimed at protecting the environment (i.e. their
environmentalism), it was very obvious that the approach allowed for quality exchanges
of relevant vital information between researcher and participants as depicted by the
following comments by a participant (id = 27) – “I must say I have learned a lot from you
and I can’t wait to share this information with others. I wish we can get you here to give
us a seminar and talk, we really need this”. A planned follow-up exercise with the
participants, and possible future studies will perhaps contribute more to our
understanding of the effectiveness of PNS as a tool for encouraging environmentalism as
reported by Fetalvero et al (2013).
e. Perceived Lack of Service Provision for Levy Paid
Only one (1) participant (id = 7) in this study from the service user groups gave ASEPA
any sort of credit for service. He said “Sometimes, they (ASEPA/RCs) do go around with
their truck to collect waste but that too is not regular or timely”. Most times, it took the
researcher’s pensive explanation of the extensive planning and resources required for
effective MSW management for most participants to dilute their anger or curb the
expletive hurled toward ASEPA for their perceived lack of service provision. Even after
such explanations, most participants insisted that they do not get value for money for the
levies paid to ASEPA as shown in the comments in Table 6.12.
Table 6. 12: Responses from Participants show a Perceived lack of Service Provision by ASEPA
Participant id Comment
2 Levy payment is by compulsion because government does not
provide any service for which levies are paid for.
11 They will chase you to death rather than deprive you of service if
you don’t pay because there’s no service to deprive you of.
3 It's actually a problem because there is no link between what is paid
and disposing of waste as there is no service provided.

193
6 Absolutely nothing. The nearest designated skip is about 10 minute
drive away. I don’t know the distance in km.
9 There are multiple extortionate levies and there are no services
rendered. Yes, no services rendered. They just use law enforcement
agencies like police, Bakkasi, army, etc to intimidate you.
10 It’s very disappointing though that all they do is come and collect
money. They provide no service at all.
37 All they do here is harass you with police and other law
enforcement agents to extort money. They can promise you heaven
and earth but once they get your money, they are gone. You get no
service or whatever that was promised.
12 Honestly I couldn’t tell you. When you live in a city like Aba, you are
chased for all manner of levy but once you pay, that’s it. You only
see them again when they need another money from you.
29 Well, if I can trek from here to Asa Road (the nearest designated
skip – about 1 – 2 miles away), I can drop my waste in their (ASEPA)
skip but that is more expensive than paying someone (informal
waste collector) to dispose my waste.
31 More money? Yes. More work? Which work? Did anybody tell you
ASEPA does any work?
Absolutely nothing. You just pay to avoid them and their troubles
because they will harass the life out of you until they collect that
money.
32 Absolutely nothing. I still have to pay a private contractor between
#15,000 and #20,000 every month to dispose my waste.
It will help if the government can just deliver the services for which
we pay. It will go a long way to motivating people to keep paying
even more.
33 We don’t get any service. We dispose our garbage twice a week –
Tuesdays and Fridays and when our driver takes the waste to the
skip, they (ASEPA) collect a compulsory #100 (One hundred Naira).

194
Failure to pay the #100 will result in the driver coming back with
the waste; they will not allow him to drop it.
34 It has gotten worse because we used to have street collection by
ASEPA once in a while but for over 3 years now, that has ceased.
Now we have to pay local vendors whom we don’t even know
where they dump the waste. Now, we just pay that levy as a
statutory levy because no service is rendered at all
They also charge drainage fee to remove rubbish from the gutters
but they do not cart away the rubbish removed so you have to
contract someone else and pay another fee to have the removed
rubbish carted away.
35 I have to hire trucks to evacuate these from our waste enclosure to
the dumpsite where ASEPA also dump theirs and for each trip, I
have to pay #2,000 after paying my statutory fee.
36 ASEPA have never collected our waste from here before. The
person that disposes the waste for us also pays them at the point of
disposal on top of the annual levy which we normally pay.
43, 44 You get nothing for the #1000 but you have to pay it.
45 Government contracts the revenue collection to individuals but the
worst part is that once they collect the revenue, they disappear. You
are left to pay private people to dispose your waste.
48 They don’t provide any service. They don’t!
See, when I pay for electricity bill, I expect electricity supply every
day. Likewise, when I pay for sanitation, I expect service from them.
That’s all; nobody is asking them for favours.
56 These days, the only times you find heaps of refuse in the streets of
Aba is when we have breakdown of vehicles but still, the refuse
heaps are cleared within 48 hours unlike before when you can have
such heaps occupying the streets for more than 2 weeks. In such
situations, people are not happy to pay for the service.

195
So, paying is not the problem, it is the provision of the service.
Yes, there are money mongers amongst the revenue contractors
who don’t follow the instructions.
When these concerns were posed to some participants from the TGGO stakeholder group,
they insisted that service users in Aba are simply hard to please. But when the researcher
informed these participants that some of the service users that participated in the
research started softening their stance once a proper explanation of how the system work
and what is required to run it, they (participants from the TGGO stakeholder group)
reluctantly accepted that perhaps a more participatory approach and effective
communication could be a panacea for achieving the much desired changes in MSW
management in the city. One RC that participated in the study admitted that some RCs
were just after the money as they did not provide the services paid for by service users.
f. Non-recognition of Informal Waste Workers
Since the nineteenth century, informal waste workers have been on the fringes of the
urban waste landscape, working away as unrecognised stakeholders (Scheinberg 2011).
Previous studies into the activities of informal waste workers in Nigeria often reported
the intimidation, harassment and maltreatment meted out to them by MSW management
authorities (Nzeadibe et al 2012; Nzeadibe and Ajaero 2010; Nzeadibe and Iwuoha 2008).
This study found informal waste workers in Aba to be in identical situations. Collectively,
the informal waste workers account for all the reuse and recycling activities that go on in
the city but their contributions are not recorded as is the case in so many other cities in
other developing countries (Wilson et al 2015; Wilson et al 2009; Wilson et al 2006). The
researcher believes that apart from being regarded as the ‘forgotten of the society’ – a
phrase used by one participant in the study, the distorted power relationship along the
chain is also a major contributory factor. The recycling companies wield all the power as
they decide what they pay for the materials they receive from the middlemen. The
middlemen, in-turn wields their power on the waste pickers and scavengers who are at
the lowest base. For the itinerant waste pickers/buyers, their vulnerability is escalated
by the possibility of buying ‘fake’ metals and incidences of arrest and extortion by the
police as they do not have receipts for their purchases. Corrupt officers often arrest them
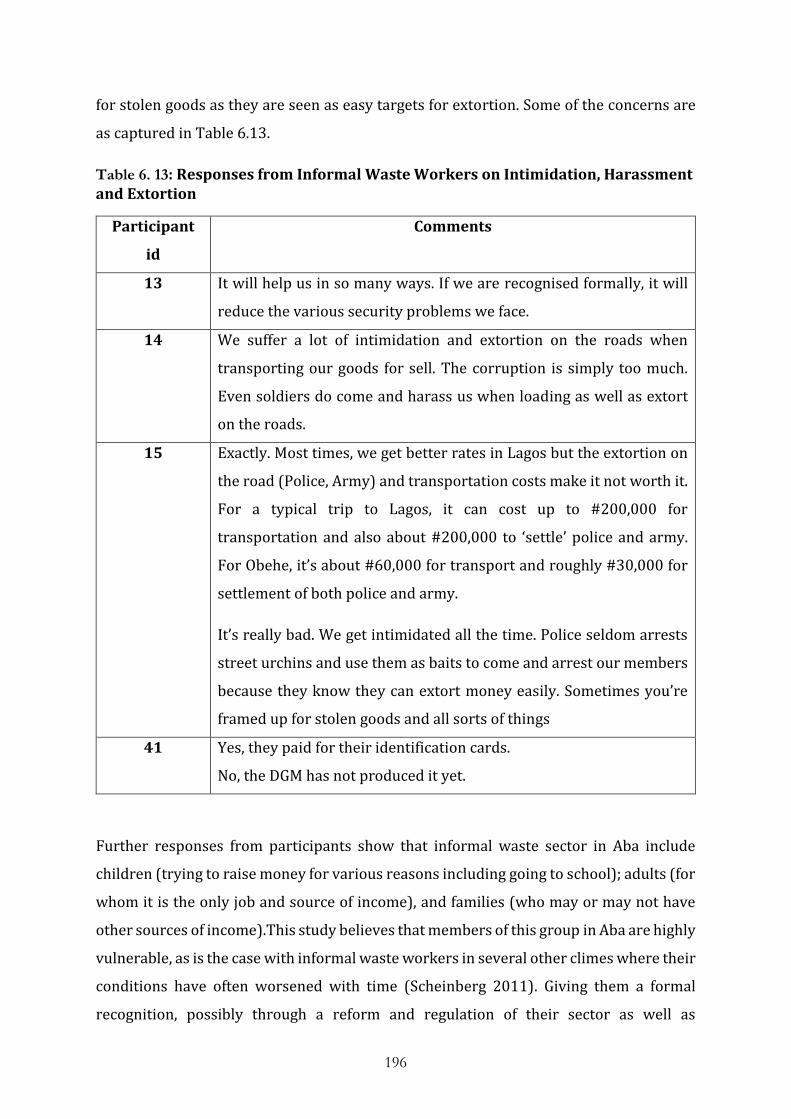
196
for stolen goods as they are seen as easy targets for extortion. Some of the concerns are
as captured in Table 6.13.
Table 6. 13: Responses from Informal Waste Workers on Intimidation, Harassment and Extortion
Participant
id
Comments
13 It will help us in so many ways. If we are recognised formally, it will
reduce the various security problems we face.
14 We suffer a lot of intimidation and extortion on the roads when
transporting our goods for sell. The corruption is simply too much.
Even soldiers do come and harass us when loading as well as extort
on the roads.
15 Exactly. Most times, we get better rates in Lagos but the extortion on
the road (Police, Army) and transportation costs make it not worth it.
For a typical trip to Lagos, it can cost up to #200,000 for
transportation and also about #200,000 to ‘settle’ police and army.
For Obehe, it’s about #60,000 for transport and roughly #30,000 for
settlement of both police and army.
It’s really bad. We get intimidated all the time. Police seldom arrests
street urchins and use them as baits to come and arrest our members
because they know they can extort money easily. Sometimes you’re
framed up for stolen goods and all sorts of things
41 Yes, they paid for their identification cards.
No, the DGM has not produced it yet.
Further responses from participants show that informal waste sector in Aba include
children (trying to raise money for various reasons including going to school); adults (for
whom it is the only job and source of income), and families (who may or may not have
other sources of income).This study believes that members of this group in Aba are highly
vulnerable, as is the case with informal waste workers in several other climes where their
conditions have often worsened with time (Scheinberg 2011). Giving them a formal
recognition, possibly through a reform and regulation of their sector as well as

197
integrating them into the mainstream MSW management services provision may
alleviate their sufferings by providing them with more opportunities (Scheinberg 2011),
and ensuring their contributions to MSW management in the city are recorded. Some
members of the TGGO stakeholder group confirmed to the researcher that ASEPA
embarked on a programme to register all informal waste workers in the city and to issue
them an identity card, for which each informal waste worker paid the total sum of five
hundred Naira (#500 = approximately £1.08) but at the time of this study, no informal
waste worker had received any identity card, and no formal register of registrants was
provided when requested from the authorities. Further enquiries by the researcher
revealed the said registration exercise was not initiated so that the informal waste
workers could be recognised but rather to make them easily reachable for extortion as
the agency accused them of several malpractices at dumpsites and other sundry offences.
g. Lack of Monitoring and Enforcement and Focus on Fines and Penalties
Various participants from the service user side accused the MSW management
authorities of focusing mainly on fines and penalties from defaulters instead of providing
the manpower necessary for effective monitoring and enforcement that could possibly
act as deterrent to would-be defaulters. Most members of staff of the EHDs corroborated
this stance and added that ASEPA employs a ‘fire brigade approach’ (in local parlance, it
means a last minute action on an issue that requires adequate long time planning and
execution). Some of the comments are shown in Table 6.14 below.
Table 6. 14: Responses from Participate suggest MSW Management Authorities focus on Fines and Penalties at the Expense of Behavioural Change
Participant
id
Comments
22 Only the poor and those without connection to people in power get
punished for MSW management offences.
Penalties and fines for MSW management offences are constantly
reviewed upwards without appropriate consultation and
communication.
24 ASEPA also uses ‘fire brigade’ approach. Their emphasis is always on
fines and levies and not really on educating people. This approach does
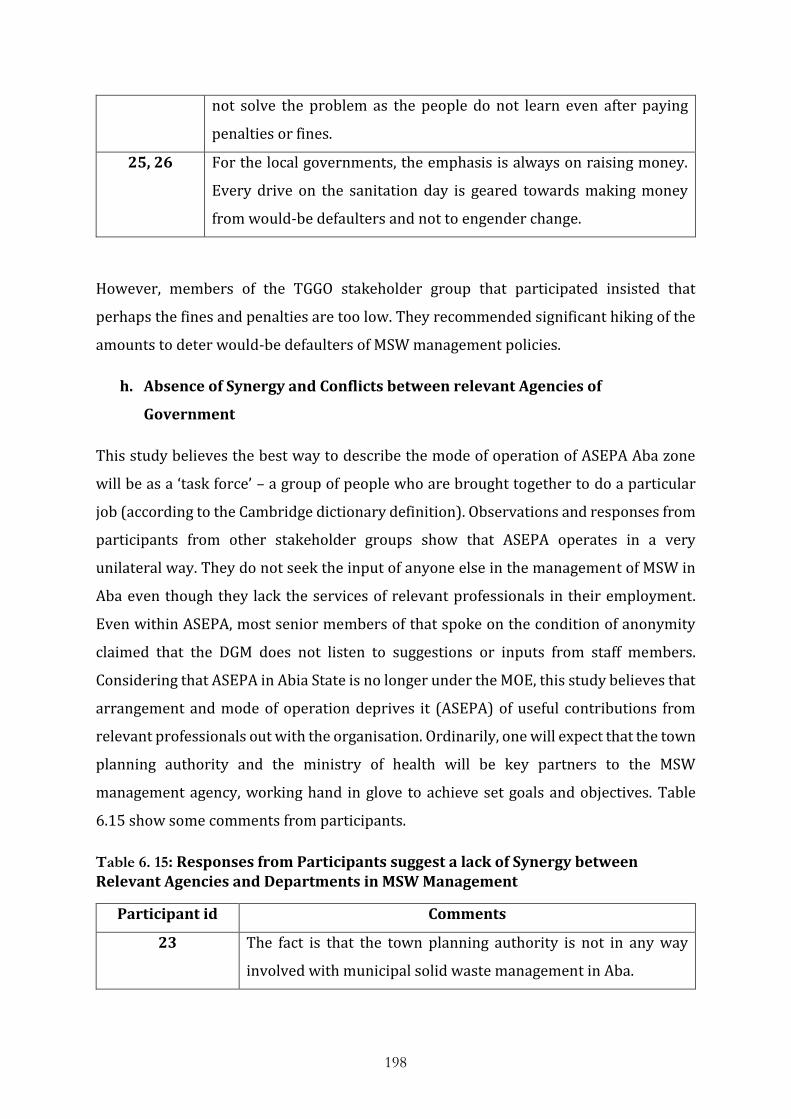
198
not solve the problem as the people do not learn even after paying
penalties or fines.
25, 26 For the local governments, the emphasis is always on raising money.
Every drive on the sanitation day is geared towards making money
from would-be defaulters and not to engender change.
However, members of the TGGO stakeholder group that participated insisted that
perhaps the fines and penalties are too low. They recommended significant hiking of the
amounts to deter would-be defaulters of MSW management policies.
h. Absence of Synergy and Conflicts between relevant Agencies of
Government
This study believes the best way to describe the mode of operation of ASEPA Aba zone
will be as a ‘task force’ – a group of people who are brought together to do a particular
job (according to the Cambridge dictionary definition). Observations and responses from
participants from other stakeholder groups show that ASEPA operates in a very
unilateral way. They do not seek the input of anyone else in the management of MSW in
Aba even though they lack the services of relevant professionals in their employment.
Even within ASEPA, most senior members of that spoke on the condition of anonymity
claimed that the DGM does not listen to suggestions or inputs from staff members.
Considering that ASEPA in Abia State is no longer under the MOE, this study believes that
arrangement and mode of operation deprives it (ASEPA) of useful contributions from
relevant professionals out with the organisation. Ordinarily, one will expect that the town
planning authority and the ministry of health will be key partners to the MSW
management agency, working hand in glove to achieve set goals and objectives. Table
6.15 show some comments from participants.
Table 6. 15: Responses from Participants suggest a lack of Synergy between Relevant Agencies and Departments in MSW Management
Participant id Comments
23 The fact is that the town planning authority is not in any way
involved with municipal solid waste management in Aba.

199
24 Another challenge is duplication of duties. This creates confusion
for even the citizenry as they do not know whether to follow the
EHOs or ASEPA. Streamlining the activities of both organisations
will help a lot.
25 Waste should be separated to ensure proper management but the
households get conflicting guidance from the 2 bodies – ASEPA &
EHD.
26 Because the job is given to ASEPA, I have a limited role in waste
management. ASEPA simply does crude dumping which is a lay
man approach. There are no technical inputs at all.
However, because the responsibility is now with ASEPA, the local
governments are no longer conscious of refuse disposal and
environmental management. And more so because the agency
(ASEPA) is now directly under the Office of The Executive
Governor, the ministry of environment does not have supervisory
function over them.
Absolutely, there are conflicts. The situation ends up confusing
even the people because they seem not to know whose advice to
follow.
27 Waste management used to be the sole responsibility of the local
governments but now it is the sole responsibility of ASEPA.
40 Well, conflicts to the extent that we both can abate the same
nuisance. We are not looking at the conflicts for now because the
law, to a great extent, defines roles for every one of us.
41 Those people are civil servants and ask anybody in Nigeria, all
they do is with the mouth; they don’t have anything to offer.
The normal thing is that we should work together but they cannot
make the sacrifices we make here. The common perception is that
in civil service nobody cares, it’s nobody’s business.
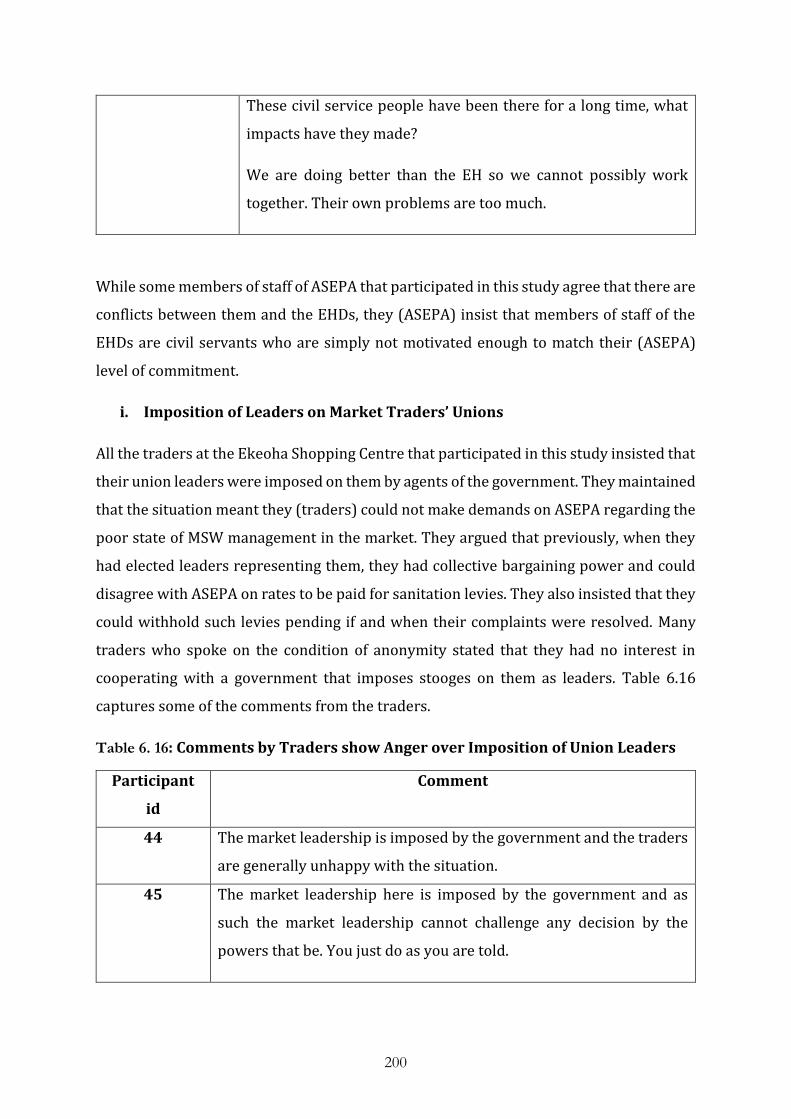
200
These civil service people have been there for a long time, what
impacts have they made?
We are doing better than the EH so we cannot possibly work
together. Their own problems are too much.
While some members of staff of ASEPA that participated in this study agree that there are
conflicts between them and the EHDs, they (ASEPA) insist that members of staff of the
EHDs are civil servants who are simply not motivated enough to match their (ASEPA)
level of commitment.
i. Imposition of Leaders on Market Traders’ Unions
All the traders at the Ekeoha Shopping Centre that participated in this study insisted that
their union leaders were imposed on them by agents of the government. They maintained
that the situation meant they (traders) could not make demands on ASEPA regarding the
poor state of MSW management in the market. They argued that previously, when they
had elected leaders representing them, they had collective bargaining power and could
disagree with ASEPA on rates to be paid for sanitation levies. They also insisted that they
could withhold such levies pending if and when their complaints were resolved. Many
traders who spoke on the condition of anonymity stated that they had no interest in
cooperating with a government that imposes stooges on them as leaders. Table 6.16
captures some of the comments from the traders.
Table 6. 16: Comments by Traders show Anger over Imposition of Union Leaders
Participant
id
Comment
44 The market leadership is imposed by the government and the traders
are generally unhappy with the situation.
45 The market leadership here is imposed by the government and as
such the market leadership cannot challenge any decision by the
powers that be. You just do as you are told.

201
It was different when we were allowed to elect our market
representatives and leaders.
46 But now, government doesn’t allow us to elect our leaders again. They
just appoint their cronies who will dance to their tones. The leaders
now are there to represent government in the market instead of
representing the traders.
Yes, we are helpless. We are forced to accept whatever the
government decides.
48 There will be need but the government imposes the leadership of the
market. So do you expect the leader who is imposed to take a
complaint to the person that imposed him on the market? You will be
implicating yourself and they will just remove you. They will see you
as becoming anti-government.
The researcher believes that the situation with the traders at Ekeoha is further evidence
of the distorted power relationship between government on one hand and the public on
the other. Other responses from participants show that members of traders and market
unions who still elect their union leaders still have collective bargaining power as shown
by these comments in Table 6.17.
Table 6. 17: Members of a Union with Elected Leaders enjoy Collective Bargaining Power
Participant
id
Comments
47 Sometimes we protest when we feel the levy is too high and we will
tell our chairman how much we can pay and he’ll inform ASEPA of our
decision.
33 We have a union (hotel operators association) and the only form of
information or communication with ASEPA is driving a bargain
through our leaders to reduce the amount on the demand notice
(sanitation levy).

202
29 Because I am in a union (Patent Medicine Union), I now pay #1,000
(One Thousand Naira) per annum (shows me receipt). I used to pay
#3,000 (three thousand Naira) per annum before I joined the union.
j. Intimidation and Harassment by Thugs working for ASEPA
As mentioned in section 5.2(d), this study found that intimidation and harassment was a
commonly used driving mechanism by ASEPA. While this tactics was often used in
relation to the collection of revenue, the researcher also witnessed first-hand how thugs
and agents working for ASEPA molest unsuspecting members of the public in a bid to
extort money from them. On the said occasion, the thugs removed the number plates of
the vehicle and made ridiculous bribe demands from the driver as settlement. Table 6.18
below shows some of the comments and views of participants.
Table 6. 18: Comments by Participants Intimidation and Harassment is widely used by Thugs and agents working for ASEPA.
Participant id Comment
49, 50, 51 The government also uses touts and thugs to harass our customers
when they park their cars on the road side to shop in this market.
They remove their registration plates and extort money from such
customers.
20 The personnel are taken as political compensation for political thugs,
just as it is done in every other facet of the Nigerian system.
Everything in Nigeria is based on political consideration, basically
compensation for political thugs. Now these people come in as
politicians, they don’t come in to do anything. They now come in to
also build a political structure for the man that kept them in place
there. The people that are supposed to work in the field will all be
political thugs who will be there for what they call ‘empowerment’,
collecting salaries for nothing.
10 All they do here is harass you with police and other law enforcement
agents to extort money.
11 What I know though is that some of the ASEPA operatives are harsher
than others. Some will come with thugs while others will approach
you calmly.

203
12 You really are new here. They will come with all manner of thugs,
task force and all what have you. They will threaten fire and
brimstone and seize anything of value to you to inconvenience you
and force you to pay.
6.3 Oppression
The Oxford English Dictionary defines oppression as “prolonged cruel or unjust
treatment or exercise of authority”. Cohen (2014) adds that those so subject may be
unaware of their unjust treatment or control. This study believes that for the majority of
participants who recognise that the government, through its relevant agency and
departments have failed by not providing adequate MSW management services and thus
forcing them to live in the current abject environmental conditions, it is forced
oppression. It is not dissimilar to the kind described by Karl Marx and Friedrich Engels in
their very influential book titled The Communist Manifesto (Cohen 2014). The study also
believes that for the few participants whose responses and posturing suggest they may
have accepted the situation as the norm probably because the problem is prevalent in
many Nigerian cities or simply because they do not have an alternative, it can still be
construed as wilful oppression (Cohen 2014).
If the deployment of technologies of mass production can be seen to be a forced
oppression and enslavement of the working class (Cohen 2014), and rightly so then the
MSW management situation in Aba (and most cities in Nigeria) is most certainly a more
severe form of forced oppression when you consider that:
People who desire a better level of services pay a statutory fee as demanded by those in
power; and yet they do not get the desired level of services and benefits for their pay.
The government and its agencies are fully responsible for the current situation as they
make all the decisions without any inputs from the residents and service users.
The residents and service users are regularly harassed and brutalised for non-
compliance by those in power. This is often extended to informal waste pickers and
recyclers who should be viewed as partners in the service provision.
Even the employees of government blame those in the higher echelons of government for
the current situation. Many of these workers are often owed several months of salaries.

204
As highlighted in section 6.2, the relationship between the public (service users) and the
government (service provider) is strictly one-sided with the government wielding all the
power. This study thus proposes the classification of poor MSW management services in
Aba, and similar urban centres as a form of oppression of the residents. Furthermore,
there should be available legal grounds upon which citizens who feel oppressed by the
highhandedness or inactions of municipalities and government agencies in MSW
management could seek legal redress. In India, the Public Interest Litigation (PIL) is one
such policy which has given rise to the closure of industries deemed to be polluting and
the ban of plastics (UN-HABITAT 2010a). The case of B. L. Wadhera versus the Union of
India and Others (1996) further illustrates this position. Dr Wadhera contended that the
Municipal Corporation of Delhi (MCD) and New Delhi Municipal Council (NDMC) had
been negligent in fulfilling their statutory functions of keeping the city clean and as such
had violated the citizens’ right to a clean environment. The outcome was a new approach
after top municipal functionaries were publicly humiliated as they were summoned to
explain their non-performance (UN-HABITAT 2010a).
6.3.1 Overcoming Oppression
Recognising the current MSW regime in Aba as oppressive is not an end. Therefore it is
even more important to identify ways by which the oppressed can overcome or mitigate
the effects of the oppression. In his autobiography – The Long Walk to Freedom, Nelson
Mandela provided several illustrations of how he overcame oppression even as a prisoner
of the very repressive apartheid South African government (Mandela 1994).
Clearly, as highlighted in section 6.2, there is an imbalance in power relations between
the residents (service users) on one hand and the government (agency and service
provider) on the other. Going by the responses from participants from both sides, the
dominant power group appears unwilling to negotiate the status quo. Thus, one real
option for the oppressed to close the power gap is to increase its relative power in order
to force a negotiation. The two possible ways of achieving that goal are (a) enhance the
power of the oppressed OR (b) decrease the power of the oppressor (Deutsch 2005). The
focus of this section will be on enhancing the power of the oppressed through
empowerment.
In chapter 7, the data analysis showed that public education, awareness and sensitisation
ranked highest in the list of solutions suggested by participants from the different
205
stakeholder groups. Fulfilling this need will increase the amount of requisite knowledge
and information in the possession of the oppressed, and thus enhance their power
(Fetalvero et al 2013; Deutsch 2005). But this is only one of two ways of enhancing the
power of the oppressed; the other being through increased efficiency in their use of the
power they possess (Deutsch 2005). The latter is accomplishable through organised
advocacy and environmentalism (Fetalvero et al 2013).
6.3.1.1 Public Education, Awareness and Sensitisation
All the participants interviewed for this research believe that a sustained effective public
education, awareness and sensitisation programme will help in improving the current
MSW management situation in Aba. Twenty seven (27) participants (47% of
interviewees) explicitly or indirectly suggested it as part of their recommended solution.
Even the agency (ASEPA), acknowledges that it is a priority for them towards solving the
observed problems of MSW in Aba. The staff of the educational department of ASEPA
informed the researcher of school campaigns that were carried out in 2015 to educate
primary school pupils about MSW management. While that is a step in the right direction,
the programme was not sustained and far too few schools were involved. The content
and quality of information given to the school pupils was also found to conflict with
current MSW management policies and practices. For example, pupils were taught to
separate their waste into different classes of waste such as glasses, organic, fabrics, etc.
but the agency runs a ‘pack and dump’ service without any provisions for materials
recovery or recycling. This study also found huge gaps in the knowledge of the agency
staff responsible for educating the public. None of the staff was aware of the waste
hierarchy and most could not enumerate the benefits of proper MSW management and
the implications of poor MSW practices on public health. During an observation of one
the agency’s public education, awareness and sensitisation exercise, the lack of
knowledge and poor attitude of the staff was brazenly displayed, as highlighted in section
5.14 and 5.2.1(b).
Therefore, for the right levels of public education, awareness and sensitisation to be
achieved, this study believes there is need for the right numbers and quality of staffs that
are well trained and are committed to providing the service to the public. The researcher
also thinks it is important to develop a standard template of educational materials
enriched with all the necessary information required to achieve set MSW management
206
goals in the city. This will perhaps ensure that the public, irrespective of where they live
in the city receive the same quality of education and thus improve public compliance
(Wilson 2007).
The study also observed a surprisingly high level of awareness amongst the market
traders. Most of them showed very good understanding of current MSW management
issues in the city and also made sound practicable recommendations towards finding
solutions. Their knowledge however was drawn from their experience in places like
China, Taiwan and Hong Kong where the traders travelled regularly to purchase their
wares.
6.3.1.2 Advocacy and Environmentalism
It is natural to expect that service users may occasionally be dissatisfied with certain
aspect or aspects of the service provided to them (Wilson et al 2012; Rodic et al 2010).
That is one of the reason why organisations make provisions for customer service or
customer care so dissatisfied customers have a contact point where they can raise any
service related issues. There is no such provision for MSW management service users in
Aba. All the participants interviewed stated that even though they were dissatisfied with
the level of service, they had nowhere to lay their complaints. ASEPA as an agency do not
have a customer service or care department either which corroborates the participants’
stance. The researcher thinks that consequently, even those that have relatively high level
of knowledge and information (power) cannot effectively use it in the absence of
advocacy.
The role of advocacy thus includes finding allies with a common focus and establishing a
common forum so that efforts of the oppressed can be concerted (Fetalvero et al 2013;
Deutsch 2005). In this situation, this study identifies possible allies to include
environmental interest groups, legal practitioners with knowledge of environmental
rights, environmental activists, waste workers, general public, etc. This is an effective way
of using the power of the oppressed (Adebola 2006a). A readily available example is the
case of the African National Congress (ANC) in fighting apartheid in South Africa. Deutsch
(2005) narrates the important roles played by the allies that were formed by the ANC
with organisations with sufficient economic, political and moral influence over the then
apartheid government. Environmentalism compliments advocacy by injecting the much
needed passion in defending a particular cause which in this case will be the right to a

207
clean environment. PNS has been shown to be a very effective method of fostering
environmentalism (Fetalvero et al 2013).
This study believes that while there may be some of the requisite knowledge, needed to
overcome the current oppression, the structures and institutions are absent (or
moribund) in the city. However, such provisions for overcoming this oppression are
inbuilt in the vision and action plan detailed in Annex 1. Further research activities have
also been planned as a follow up to this, to help achieve the desired changes.
6.4 Summary
Effective governance of MSW management is key to the running of an efficient MSW
management system. The key indicators of MSW governance include inclusivity for
service users and service providers, financial sustainability and policy and institutional
coherence. In cities where remarkable progress have been recorded in MSW
management, the existence of stakeholder platforms that encourage genuine
participation of the different relevant stakeholder groups in policy decisions, design,
implementation and evaluation is common. In Aba, ASEPA maintains the monopoly of
service provision and even though findings show the agency do not possess in their
employment, the requisite professionals to deliver efficient MSW management services
the service users, they (ASEPA) do not engage or work in synergy with other relevant
government bodies such as the planning authority, EHDS, etc.
Besides the acute shortcomings highlighted in all 3 key indicators of MSW management
governance (section 6.1), this study finds there are several broad areas of conflict
between ASEPA and other relevant stakeholder groups. These include intimidation and
harassment by thugs and agents working for ASEPA, imposition of leaders on members
of market unions, lack of synergy and engagement of other relevant agencies, focus on
fines and penalties, exclusion and non-recognition of informal waste workers, etc. These
conflicts have escalated to a point that some service users are threatening violence while
most others feel despondent and oppressed.
This study does not think violence will solve any of the observed problems in MSW
management in the city. But while the government (through the agency) refuses to
engage and discuss with the service users, this study believes that increasing the amount
of requisite information available to the service users and encouraging the service users
208
to form advocacy groups will enhance the effectiveness of their environmentalism – their
concerns and actions at protecting the environment. PNS is one approach that has been
cited as an effective way of improving environmentalism of participants. While it is
premature to declare the success of PNS as used in this study in Aba, further planned
studies will add to our understanding of the benefits, or otherwise, of the approach.

209
CHAPTER SEVEN
Suggested Solutions by Participants toward an ISWM System in Aba
7.0 Introduction
In chapters 4, 5 and 6, the researcher presented the analyses of the responses by
participants in the study and the researcher observations. The findings provide answers
to the first research question – what are the current realities and challenges of waste
management in Aba? This chapter, together with Annex 1, addresses the second research
question – what approaches can be used to remedy the situation and to what extent?
In the original design of this study, there was supposed to be FGDs where the
representatives of participants from the different stakeholder groups would have met to
negotiate policies and agree trade-offs. Their resolutions would then be used to create a
vision and action plan for MSW management in the city. However, due to constraints
(discussed in chapter 9), the FGDs did not hold. Consequently, the researcher have used
the analyses of the responses from participants and researcher observations to create a
vision and action plan (Annex 1) while this chapter presents the various solutions
suggested by participants. The issues have been discussed in further details throughout
chapters 4, 5 and 6.
Table 7. 1: Possible Solutions Suggested by Participants
Participant Count Suggested solutions
1 1, 2, 3, 5, 6, 7, 8, 9, 20, 22,
24, 25, 26, 27, 31, 32, 33,
34, 35, 36, 39, 40, 41, 42,
45, 46, 47
27 Public education, awareness and sustained
sensitisation to encourage good behaviour
2 2, 4, 5, 9, 22, 24, 25, 26,
30, 31, 33, 34, 39, 42, 47,
49, 50, 51, 57
19 Establish an effective monitoring and
enforcement. Task force.
3 2, 3, 6, 8, 22, 24, 26, 27,
29, 30, 31, 33, 34, 39, 42,
44, 47
17 Street to street or House to house collection.

210
4 2, 3, 10, 20, 24, 29, 30,31,
32, 33, 34, 38, 43, 47, 48,
49
16 Service must be provided for fees collected.
5 3, 9, 11, 29, 31, 32, 33, 34,
35, 38, 41, 43, 44, 46, 49,
55
16 Provide waste bins and relevant sanitary
facilities in public places including in public
vehicles
6 9, 12, 22, 24, 26, 27, 28,
32, 35, 36, 39, 45, 47, 48,
55
15 Staff training, manpower development and
the use of professionals
7 1, 5, 6, 8, 12, 19, 22, 24,
26, 27, 31, 32, 33, 35, 39
15 Waste separation
8 1, 2, 7, 10, 22, 24, 28, 29,
30, 34, 36, 37, 38, 44
14 Eradicate corruption from the system
9 4, 8, 20, 32, 37, 41, 42, 47,
48, 50, 51
11 Learn from what others have done. New and
clear policies to make waste management a
focus
10 1, 20, 22, 24, 26, 28, 34,
41, 49, 55
10 End political interference and nepotism
11 22, 24, 26, 27, 28, 36, 37,
52, 54
9 Prompt payment of staff salaries
12 24, 25, 26, 35, 36, 39, 40,
41, 45
9 Provide adequate funding
13 7, 24, 27, 29, 30, 31, 33,
51
8 Prompt evacuation of the waste to avoid
accumulation. Use of timetable.
14 3, 20, 24, 32, 33, 35, 39,
45
8 Incentivise waste management so people can
see it as a resource
15 3, 6, 11, 27, 42, 44, 46 7 Increase service fee for better services
16 8, 24, 25, 26, 31, 35, 37 7 Infrastructural development e.g. power will
be needed to recycle materials; good roads to

211
enable efficient collection of waste; hi-tech
vehicles for waste collection and
transportation
17 13, 15, 38, 41, 42, 43, 44 7 Stop the intimidation, harassment and
extortion from waste workers and other
stakeholders
18 4, 13, 32, 35, 40, 45, 51 7 Establish waste recycling and processing
companies in Aba. Waste is a source of
electricity and raw materials
19 11, 27, 32, 29, 33, 43, 48 7 Provide more waste skips
20 6, 12, 28, 30, 33, 34, 44 7 Constitute a stakeholders’ forum where all
concerned will discuss how best to manage
our waste
21 1, 2, 12, 20, 38, 40, 45 7 Vote out this crop of politicians as they have
failed.
22 7, 9, 48, 49, 51, 55 6 Sincerity of purpose and a clear committed
focused leadership
23 2, 14, 20, 22, 35, 42 6 Establish advocacy groups for waste workers
and recyclers
24 1, 11, 27, 33, 44, 49 6 Remove time restrictions on when users can
drop off their waste
25 4, 8, 13, 14, 24, 45 6 Create, develop and regulate the recycling
market
26 6, 26, 28, 52, 58 5 Change the perception that waste workers are
the downtrodden and forsaken of the society.
27 2, 31, 32, 34, 38 5 ASEPA have failed and should be scrapped or
they should go back to the drawing board

212
28 4, 36, 37, 41, 45 5 Start waste education from family level to
create the culture and awareness
29 2, 32, 35, 45 4 If government does not have the capacity, they
should syndicate it to private investors and
they (private investors) should be protected
by legislation
30 44, 45, 46, 48 4 Traders should be allowed to choose and elect
their leaders
31 24, 25, 26, 36 4 Clear delineation of duties between ASEPA
and EHD. Avoid current duplication of duties
and possibly create synergy
32 24, 25, 30 3 A collaborative approach involving other
sectors so information can be shared
33 13, 14, 24 3 Formal recognition of the waste recyclers
34 13, 14 2 Training of waste recyclers
35 2, 8 2 Non-governmental support/sponsorship as
we have in football.
36 2, 8 2 Establish waste management cooperatives.
37 25, 45 2 ASEPA should be supervised by the MOE
38 34, 40 2 Service users should bag their waste, dispose
it at the stipulated times and pay their levies
39 6 1 Provide private waste bins for each category
of waste for collection by the agency
40 41 1 A proper deep clean of our environment first
before any discussions on improvements
41 22 1 Eliminate open burning of waste

213
42 22 1 Introduce polluter pays policy and let those
who generate more waste pay more
43 24 1 Return responsibility of MSW management to
municipal councils
43 40 1 Establish a separate ministry for waste
management as it is too important
44 28 1 Perfect the mode of revenue collection and
communicate same to all.
45 32 1 Carry out a full waste audit to determine the
quantity and types of waste we generate
46 30 1 Mandate traders in busy locations to
undertake regular clean-up of their
environment
47 25 1 Clean portable water needs to be provided by
government as it is a basis for hygiene
48 2 1 International aid and supervision by an
international agency
49 56 1 The executive governor is currently distracted
by legal battles. Political opponents should
allow him to perform his duties.
Table 7.1 above clearly shows that public education, awareness and sensitisation ranked
highest in the list of solutions suggested by stakeholders. The table provides an indication
of the kinds of changes that participants want to see in MSW management in the city.
7.1 Summary
The richness and range of solutions proffered by the participants reemphasises the
importance of involving all stakeholders in solving environmental problems, and the
need to have a functioning stakeholders’ platform that will be involved in policy
decisions, design, implementation and evaluation of the MSW management systems as is

214
the case in Moshi, Bamako and Ghorahi (Wilson et al 2015; Rodic et al 2010). That is also
a key recommendation of the ISWM framework and principle 10 of the Rio Convention of
1992.

215
CHAPTER EIGHT
Discussion
8.0 Introduction
In chapters 4, 5, 6 and 7, the analysis of the data collected during the research was
presented. As well as providing answers to the research questions, the chapters
contribute to reaching the aims and objectives of the study. In this chapter, the key results
are further discussed and aggregated. The conclusion and recommendations of the study
are hence drawn from this aggregate and presented in chapter 9.
8.1 Review of the Problem
As highlighted in chapter 1, MSW management has become topical. It is an issue of great
concern in most urban centres and municipalities, especially for those cities and
municipalities in middle and low income (developing) countries, where the impacts of
poor MSW management practices are still devastating (Abdulredha et al 2018; Chalhoub
2018; WHO 2015; UN-HABITAT 2014). Common challenges militating against efficient
MSW management in developing countries as detailed in chapter 2 include lack of reliable
city specific data, poverty, poor planning and organisational capabilities, lack of
adequately trained personnel, lack of commitment and negligence, poor infrastructure,
poor funding, etc. (UNEP 2015; Ezeah 2010; UN-HABITAT 2010a; Hazra and Goel 2009;
Moghadam et al 2009; Abdullahi et al 2008). Further literature review (2.9.3.1) revealed
that even though there is a specific agency responsible for MSW management in Aba, like
in many other Nigerian cities, the MSW management situation had become critical
(Ajaero and Chigbo 2012; Izugbara and Umoh 2004). While Nzeadibe et al (2012) reckons
that MSW management is very low in the governance agenda of the city, others
(Odoemena and Ofodu 2016; Eneh 2011) adds that the outcome is the weak
implementation of the national sanitation policy. Consequently, besides social, economic
and environmental protection concerns, there are severe implications on the public
health of the city’s residents (Odoemena and Ofodu 2016; Izugbara and Okon 2000).
8.2 Overview of Key Results
The key findings of this study have been aggregated into six (6) main themes (or key
results). These are History of MSW management in Aba; The notoriety of Aba as a dirty
place (Aba Syndrome); Realities and challenges of MSW collection, treatment and
disposal; Realities and challenges of MSW management governance; Investment and

216
funding in MSW management; and Operation and integration of informal waste workers.
Each of these key results will be discussed in separate sections and reference will be made
to relevant sections in chapters 4, 5, 6 and 7 where the data analysis was presented.
8.2.1 History of MSW Management in Aba
The detailed analysis and data used in reaching this result has been presented in chapter
4. By analysing the oral testimonies of participants, this study identified 4 distinct periods
or eras that it believes are important in the history of MSW management in the city. Most
of the stakeholders that provided these testimonies had lived in Aba for over 20 years.
This historic review is particularly important to any future improvements in MSW
management in the city because any significant improvements, as reported in previous
studies, are often dependent on identifying and solving historical problems in the system
(Ezeah 2010; Wilson 2007; Brown 2006; Wilson 1999). There is a common belief in
Nigeria that most of the problems in Nigeria exist because Nigerians do not attach value
to history and therefore useful lessons are not learnt from mistakes. The findings from
this study and reports from other studies suggest this is particularly true for MSW
management in Nigeria (Abila and Kantola 2013; Nzeadibe and Ajaero 2010; Imam et al
2008).
Lessons from the first era - of stability, and the third era – of adhoc remediation, show
that intention and commitment matter (Wilson and Scheinberg 2010). In both eras,
participants paid tribute to the commitment of the ‘leaders’ and how it enhanced
discipline in not only their staffs but also the wider public. Perhaps, one can also argue
that findings from the third era support the view from previous studies which reported
that with strong commitment from political leaders and stakeholders, financial
challenges in MSW management can be overcome as is the case in Moshi, Bamako and
Ghorahi (Wilson et al 2012; Wilson and Scheinberg 2010; Rodic et al 2010).
On the other hand, the second and fourth eras show how lack of commitment from the
leadership, unclear, unsuitable or weak implementation of MSW management policy can
have devastating and far reaching implications, not only on public health but also the
social, environmental and economic wellbeing of the populace (WHO 2015; Marchand et
al 2012; Nzeadibe et al 2012; Contreras et al 2010). Table 4.9 (pg. 96) shows a summary
of the different eras.

217
The lessons from these eras show that while the systems of MSW management have
remained rudimentary, often involving the evacuation of refuse from one point to the
other without treatment (Odoemena and Ofodu 2016; Nzeadibe et al 2010; Ezeah et al
2010; Ogbonna et al 2007) there are perhaps no justifications for the significant
investments in sophisticated machinery and equipment often imported from developed
countries in the hope of modernising the MSW management system and processes
(Nzeadibe and Ajaero 2010; Imam et al 2008; Wilson et al 2001).
8.2.2 Aba Syndrome
Previous studies have reported the alarming and critical state of MSW management in
Nigerian cities (Ezeah and Roberts 2014; Batagarawa 2011; Ezeah 2010; Imam et al 2008,
etc.). Historically, the city of Aba has developed the notoriety of a dirty place (Odoemena
and Ofodu 2016) with many expressing the opinion that the residents of Aba prefer a
dirty place to a clean one. The researcher coined the term ‘Aba Syndrome’ to represent
the notion that residents of Aba prefer a dirty environment to a clean one. Several
participants in this study also expressed similar views as shown in Table 5.4. A few of the
reasons advanced by the proponents of Aba Syndrome include (but may not necessarily
be limited to): the prevalence of indiscriminate dumping of refuse in the city; the
discharge of sewage and refuse into water ways; the generation of increasing amounts of
refuse; non-payment of sanitation fees; and most residents of the city are traders and
they know nothing about waste management.
However, findings from this study do not support the viewpoint. As highlighted in the
previous section, MSW management in Aba has remained rudimentary, and like in many
other cities in Nigeria, the level of MSW management service provision have been
described as insufficient, inefficient and improper (Muhammad and Salihi 2018;
Ogwueleka 2009; Whiteman et al 2006). Despite significant investments in the
importation of refuse disposal vehicles by the state government in 2006 (as highlighted
in chapter 6), this study finds that inefficient collection system and a weak
implementation of an unsuitable MSW management system means littering and
indiscriminate dumping of refuse have remained a common feature in the city.
Observations by the researcher also show that the immediate vicinity of most private
premises and surroundings were often significantly cleaner than supposed public spaces.
This means that the residents of the city made necessary efforts to keep their

218
surroundings neat, and suggests a disconnection in public governance between the
government and the governed (Krawczy and Sweet-Cushman 2016; Abila and Kantola
2013; Adewuyi et al 2009). Responses from participants (as detailed in chapters 5 and 6)
also show that while the service users often adhered to stipulated guidelines relating to
MSW management including paying their statutory sanitation levies, unsatisfactory
service provision and inefficient communication exchanges on the part of the service
provider were often culpable for the observed failures in MSW management in the city.
And that is even without mentioning the admittance by participants from the TGGO
stakeholder group that service users are always willing to pay if services are provided. It
is therefore surprising that the same service provider will turn around and accuse the
service users of preferring a dirty place to a cleaner one.
This study also found that most of the traders that participated in this study showed a
high level of knowledge of MSW management issues contrary to commonly held opinion.
This is strongly linked to gained experience from their travelling (Singh and Livina 2015).
Others, including members of staff of ASEPA who accused the residents of preferring to
live in a dirty environment, expressed the view that residents of Aba also comply with
MSW management regulations in other places they visit. They highlighted cities like
Enugu and Calabar where waste management facilities such as bins are available for
public use. This suggests that the currently observed dissident behaviour of
indiscriminate dumping and littering can be overcome in Aba by the provision of the
much needed waste bins in public places and an effective regime of monitoring
enforcement, as is obtainable the other cities mentioned.
Admittedly, city authorities in developing countries face huge challenges in the delivery
of effective and efficient MSW management services for several reasons including rising
waste generation rates, lack of commitment, poor funding, poor organisational
capabilities, etc. (Ezeah and Roberts 2012; Wilson et al 2012, UN-HABITAT 2010b; Olley
et al 2010). However, that does not exonerate governments and their institutions from
the responsibility of proving adequate MSW services to the populace. Instead of playing
the blame game, MSW management authorities in Aba should learn from what has been
achieved in places like Moshi and Ghorahi – 2 cities with even lower income levels; where
a genuine participation approach involving all stakeholders have been used to overcome
limitations in funding (Nabegu and Mustapha 2014; Wilson et al 2012; Rodic et al 2010).

219
8.2.3 Realities and Challenges of MSW Collection, Treatment and Disposal
This study found that the national policy on sanitation, developed at the federal level
(FME 2005), upon which the MSW management policy implemented by ASEPA Aba zone
(section 5.1) is premised, does not mention waste minimisation. The analysis of the
responses from participants in this study (chapter 5) also show that there appears to be
an unwillingness or unpreparedness to take measures that will prevent the generation of
the most common types of waste seen in the city. For instance, countries such as Kenya
banned plastic bags in 2017 (BBC 2017) by outlawing the manufacturing, selling and
usage of all such products. The researcher observed that in Aba; empty ‘pure water
sachets’ and empty plastic bottles of soft drinks and similar products constitute the
majority of waste. However, most participants frowned at the idea of banning pure water
in sachets citing affordability of alternative products as there is no public portable pipe
borne water available. The point made by these participants regarding availability of
portable water to the public perhaps emphasises the importance of an integrated
approach to MSW management (WHO 2015; Wilson et al 2015; WHO 2014; Abdullahi et
al 2008; IJgosse et al 2004b). If the MSW management authorities needed a reminder to
re-emphasise the need for a MSW management approach aimed at waste minimisation
or reduction, the following comments from participants perhaps will suffix - “It is costing
us a lot to dispose our waste after paying ASEPA so any information that will help people
reduce the waste and spend less on waste disposal will be very useful” (Participant id =
47); “We generalise these issues but I know that I suffer malaria and the root cause is that
our gutters are blocked and we have stagnant water everywhere. Waterproofs have taken
over our farmlands as well as other contaminants from waste. We are easily reaching an
epidemic stage and it should be taken seriously” (Participant id = 35).
In the absence of a suitable MSW management policy aimed at minimising waste
generation and increasing urbanisation, MSW generation rates in cities in developing
countries have continued to grow at a faster rate than MSW management agencies can
cope (Kaza et al 2018; Muhammad and Salihi 2018; Ogwueleka 2009). Besides
government policies, other major factors that reportedly affect waste generation include
population and socio-economic factors such as poverty, income levels, education, attitude
to waste, etc. (Senzige et al 2014; Diaz and Otoma 2013; Afroz et al 2011; Cox et al 2010).
In Aba, this study found ASEPA does not keep records of the quantity of waste evacuated
and their method of estimation was very unreliable. There were also no records of the

220
number of households paying for and receiving MSW management services. The
irregularities and inefficiencies in their system make these calculations almost
impossible. There is no doubt though, that efficient collection of waste is capital intensive
and costs significant amounts of money to implement (Kaza et al 2018; Wilson et al
2013b; Scheinberg et al 2010).
Source separation of waste is perhaps the most important and most effective step
towards disposal efficiency and minimisation of waste (Kuusiola et al 2012; Zhang et al
2012; Chung and Poon 1999). The most basic separation of waste involves separation
into two classes – organic and inorganic (Agarwal et al 2015). The household is the first
place that children should learn and understand issues of consumption and waste
recycling (Singh and Livina 2015). This study found that in Aba, there is no government
policy on waste separation. The basic facilities necessary for effective source separation
of waste are also not available. However, as reported in section 5.13, some households
(especially those who live in their own homes (not rented) with access to back gardens
and informal waste workers already practice some form of waste separation. Informal
waste workers operate in several modes in Aba (2.9.2.5). By observation, this study finds
that they (informal waste workers) account for almost all materials recovery and reuse
activities in the city. However, like in other cities around the world, their livelihoods have
continued to worsen as approaches adopted to tackle their challenges have reportedly
failed (Nzeadibe et al 2012; Scheinberg 2011; Wilson et al 2009, Nzeadibe and Iwuoha
2008; Wilson et al 2006). Public perception, personal environmental habits and beliefs
inform individual attitudes towards source separation of waste (Barr et al 2003). To
encourage source separation of waste, previous studies have shown that effective
communication of government policies that emphasise source separation and the
provision of the necessary facilities are needed (Zhang et al 2012; Tai et al 2011; Jiang et
al 2009; Li et al 2009).
In ISWM (chapter 2), the collection of waste was directly linked to public health in that
the higher the percentage of the waste effectively collected by the MSW management
authorities in a city, the safer the public health and the cleaner the city’s appearance
(Wilson et al 2015; Wilson et al 2013b; UN-HABITAT 2011; Rodic et al 2010). As shown
in section 5.1, indiscriminate dumping and littering is rife in Aba. There are no waste bins
available in public places and standard facilities for temporary storage of waste are often

221
unavailable as shown in Table 5.8. As shown in Figure 5.2, the agency runs a system
where residents are required to bring their waste to a designated receptacle point (skip).
However, the numbers of designated points are insufficient. Many participants reported
that it was not practicable for them to carry their waste to the skips as the nearest skips
was too far from them. In the areas without accessible roads, the RCs do not provide
regular waste collection services as required (see section 5.1.4). The study also found that
the designated points were situated mostly along busy roads. With the poor quality of the
skips which are at best described as improvised, the waste often spilled onto the busy
roads thus posing attendant public health risks, environmental blight and a danger to
road users (Kaza et al 2018; Marchand et al 2012; Ezeah 2010; Giusti 2009) as shown in
Picture 17 and Picture 18 below.
Picture 17: Refuse collection along a busy Road in Aba [Credit: Researcher]

222
Picture 18: Environmental Blight caused by refuse in Aba [Credit: Researcher]
As with all other aspects of MSW management in the city, waste collection is not spared
from the palpable lack of planning, commitment and know-how by the management
agency. An observation exercise by the researcher at one of the receptacle points (Table
5.8) and another accompanying the agency staff on a waste evacuation exercise (Table
5.12 and Video 1) revealed the situation was worse than imagined. There was gross
shortage of manpower, equipment, machinery and vehicles, and no formal planning of
any sort involved. There were no schedules of receptacle points to be evacuated on given
dates or times; no staff rota or allocation and therefore no operational cohesion.
Everything was simply ad-hoc, grossly ineffective and thus posed great levels of risk to
even the waste workers who are predominantly untrained (see Table 5.11) and
vulnerable considering that most of them had no job security, were poorly remunerated
and often owed for some months going by the researcher’s observations and these
comments by relevant participants – “Honestly it is very confusing. They pay us around
20th of the month and they have owed us for some months now. They just paid us
yesterday (20/10/2017), for me I take it that it was for July, others may take it as for
August. Because we are not paid regularly, it is so confusing. No body to ask and no
receipt. We are paid cash by hand. They normally pay us Ten thousand Naira” (Participant
223
id = 52); “I will say 1:10 even. We have only 1 driver who is a civil servant (permanent
staff) but over 10 adhoc drivers. All the mechanics are adhoc staff. Even myself, I am an
adhoc worker. Like I said before, it’s a political appointment and I can be fired anytime”
(Participant id = 42). These findings support the reports from previous studies that MSW
management in developing countries are often characterised by lack of or poor
organisational capabilities, incompetence and negligence, lack of trained personnel, etc.
(Abdulredha et al 2018; Guerrero et al 2013; Nzeadibe et al 2012; Sarkhel and Banerjee
2010; Ezeah 2010).
In terms of vehicles for transporting waste, this study found that most vehicles in the fleet
of ASEPA Aba zone were dilapidated and no longer fit for purpose. The operations HQ of
the agency along Ikot Ekpene Road were littered with broken vehicles and sophisticated
machinery as shown in Pictures 11 and 12 while the few ones still in use are very
polluting as can be seen in Video 1. While most of the staff of the agency that participated
in this research decried the untold levels of corruption, nepotism and impunity at the
higher echelons of the organisation, the researcher observed obvious display of laxity,
lack of commitment and ‘I don’t care’ attitude amongst the field staff. For e.g. during the
observation exercise accompanying the evacuators on their daily activities (Table 5.12),
the researcher observed some of the evacuators littering and when they were asked why
they were littering, they responded that the city was already dirty.
Going by reports from previous publications (Kaza et al 2018; UNEP 2015; The World
Bank 2012), waste collection rates correlate positively with income levels as well as vary
in regions, with sub-Saharan Africa and South Asia posting the lowest rates (as shown in
Figures 8.1 and 8.2 respectively). However, the generous estimate of current collection
rates in Aba of 20 – 25 % (see section 5.5) still fall far short of the expected 44 – 51% for
a city in a sub-Saharan country with lower-middle income level (Kaza et al 2018).

224
Figure 8. 1: Waste Collection Rates Correlate Positively with Income Levels [Credit: Kaza et al 2018]
Figure 8. 2: Waste Collection Rates vary with Regions [Credit: Kaza et al 2018]
The analysis of responses and suggestions by participants (see Table 7.1) show that
practicable solutions to improve waste collection rates in Aba will include the
development of a detailed route plan and schedule for evacuating refuse in the city, staff
recruitment and training, provision of waste bins and management facilities in public
places, a locally adapted house-to-house collection system and effective communication
of policy changes and public education that will effect public compliance through

225
attitudinal change. The approach and investment options to reach these goals are
discussed further in section 8.2.5.
Usually, along with volume reduction and energy recovery, the aims of waste treatment
include ensuring a reduced environmental impact compared to the untreated waste
(Golomeova et al 2013). In order to adopt the most suitable treatment option, it is
important to know the composition of the waste generated in a city (Golomeova et al
2013; Ezeah and Roberts 2012). This study found that a waste audit to determine the
waste composition of the waste generated in Aba has never been carried out as shown by
the following excerpt from conversations with a senior officer at ASEPA, Aba zone (see
Table 8.1 below).
Table 8. 1: Responses from a key Participant on Waste Audit Information
Question Response
Participant id = 42
How long have you been in the job and
how long in the current position?
I have held several positions in the agency
– altogether over 6 years, and over 2 years
in my current position.
Has your agency carried out any form of
waste audit? By that I mean a detailed
study to find out the composition of the
waste generated or evacuated.
No, we have not done anything like that.
Do you think that will help? Yes. The governor is talking about recycling
so may be along the line it will happen.
Does the agency have trained manpower
to carry out such task? Do you have any
waste professionals within the agency?
We don’t. As far as Aba is concerned, we
don’t have anyone who can do it. Most of
our workers here are adhoc workers.
Currently, there is no provision for waste treatment in the MSW management system
implemented by ASEPA Aba zone (see Figure 5.2). The researcher did however observe
that open burning of waste was prevalent in the city as shown in Table 5.10 and Pictures
8 and 9. As can be inferred from Table 8.1 above (and also section 5.1.5), the waste
treatment option preferred by the state government and its agency is waste recycling.

226
Though opinions vary on the economics of recycling mainly due to local factors (Erikson
and Baky 2010; Bartelings et al 2005; Leach et al 1997), the key advantages of waste
recycling include reduction in the quantity of waste disposed, a reduction in the demand
and mining of new materials through the return of materials to the economy, job creation
and the attraction of investments (Van Beukering et al 2014; Golomeova et al 2013;
Wilson et al 2006; Velis 2004). Further discussions with participants from the TGGO
stakeholder group reveal an apparent misconception in their understanding of how
recycling works. The agency and state government believe a single recycling company
can be set-up in the city to recycle all the waste generated in the city and thus make huge
sums of money for the state. Meanwhile, as highlighted previously, informal waste
workers operate in Aba in different modes and are responsible for almost all current
recycling activities in the city. As discussed further in section 8.2.6, this study believes
that organising and integrating their activities into the mainstream MSW management
service provision in the city will be beneficial to all parties.
As described in section 5.1.6, all the waste evacuated by ASEPA Aba zone is dumped at an
open dumpsite. Picture 14 and Video 2 are images captured on a visit to the open
dumpsite at Emelogu Street, Aba. Like most dumpsites in Nigeria it is unplanned (Ukpong
et al 2015; Ezeah 2010; Imam et al 2008) as it is a converted burrow pit that arose from
the excavation of sand for construction works. This researcher thinks that the location of
the dumpsite is arguably the centre of a relatively highly populated community. On the
visit to the site, the researcher could perceive the stench from the dumpsite from at least
a mile away. Birds of prey such as Vultures, and pests and vermin, previously reported as
vectors of diseases (WHO 2014; Lino and Ismail 2012; Giusti 2009) were also observed
in multiple quantities. Considering that there is virtually no control on the movement of
waste in the city and realising the ease with which hazardous waste such as contaminated
hospital and industrial waste could be mixed with MSW, the researcher thinks that the
dumpsite poses a heightened public health risks to the scavengers observed on the site,
the local community, ecosystem and environment. As a measure to curb such risks, the
study believes that the establishment of an engineered landfill that is properly sited and
managed will be a suitable and appropriate step toward a sustainable MSW management
considering prevailing local conditions, land availability and costs. The success of the

227
small town of Ghorahi in Nepal (Wilson et al 2015; Wilson et al 2013b; Rogic et al 2010)
is a reference worthy of emulation.
8.2.4 Realities and Challenges of MSW Management Governance
Governance issues in ISWM have been reviewed in section 2.5 while the researcher
presented the data analysis related to governance issues in MSW management in Aba in
chapter 6. The indicators for governance in ISMW include inclusivity, financial
sustainability and policy and institutional coherence (Abdulredha et al 2018; Muhammad
and Salihi 2018; Wilson et al 2015; Scheinberg at al 2010). Stakeholders in MSW
management often includes governments, municipal councils, planning departments,
engineering firms, community groups, investors, churches, schools, healthcare facilities,
households, consultancies, markets, traders, professional associations, labour unions,
NGOs, hotels, restaurants, informal waste workers, etc. (Tai et al 2011; Geng et al 2009;
Shekdar 2009; Sujauddin et al 2008). All of these stakeholders will either be service users
or providers (UN-HABITAT 2010a). The participants in this research were grouped into
7 different stakeholders groups (section 3.3.4).
Inclusivity in ISWM simply means engaging all stakeholders in the decision making
process, design, implementation and evaluation of the MSW management process
(Wilson et al 2015; Rodic et al 2010). While the MSW management systems of Moshi,
Bamako and Ghorahi provide good examples of what could be achieved through an
inclusive approach (Wilson et al 2012; Rodic et al 2010), the case of MSW management
in Naples, Italy in 2008 is an example of how bad things could easily go if an inclusive
approach is not adopted. It was reported that in early 2008, the MSW management in
Naples completely broke down. Waste piled up on the streets and the waste collectors
had nowhere to take them to as all the region’s landfills were full. There were allegations
of corruption, mismanagement, mafia involvement in garbage collection and the refusal
of residents of the city to sort their waste. The authorities were arguing with each other
and did not involve the citizens and other stakeholders in decision making. Trust between
authorities and citizens was so eroded that it became impossible to site new disposal
facilities (Veltri 2014; UN-HABITAT 2010a; Pasotti 2010). The researcher thinks that the
current situation in Aba as described in chapters 5 and 6 is similar to that of Naples in
2008 as described above; just that it appears to have become a norm in Aba, so much so
that many use the situation to justify their notion of Aba Syndrome (section 8.2.2). As

228
detailed in section 6.3, service users do not get service worth the value of their money;
they are not engaged in the decision making, design, implementation and evaluation of
the MSW management processes; and to cap it all, many especially the traders at Ekeoha
Shopping Plaza, feel they are oppressed and intimidated by government and thugs
working for them.
To borrow the popular phrase of Lord Acton, the current position of ASEPA as the service
provider of MSW management in Aba can be likened to “power tends to corrupt, and
absolute power corrupts absolutely”. From the responses by participants as detailed in
chapters 5 and 6, the researcher believes that ASEPA sees itself as the supreme
adjudicator in MSW management in Abia State mainly because it is under the direct
control of the state governor and receives regular funding unlike other public service
agencies and departments that are largely comatose and neglected. Whereas ASEPA is
mainly comprised of political appointees with little or no background in environmental
issues, the EHDs are headed by people who have had varying amounts of professional
environmental training. Before the establishment of ASEPA, they (EHDs) were
responsible for MSW management in Abia State and as detailed in chapter 4, the state of
MSW management in Aba was reportedly better than it is currently. As described in
section 6.3, rather than forge harmonious working relationships with other relevant
departments in order to create synergies (Ezeah and Roberts 2012; Ezeah 2010), the
study observed obvious signs of conflicts between the relevant bodies mainly because of
ASEPA’s crude ways of operation and disregard of other stakeholders.
The indicators of financial sustainability in ISWM are described in section 6.1.2. The
provision of efficient MSW management services in a tropical city could take up as much
as 20% of a municipality’s budget (Wilson et al 2001). Usually, by law, the service should
be provided for all regardless of the interest of the market to supply the service or users’
ability or willingness to pay for the services supplied (Wilson et al 2013b; Rodic et al
2010). In order to meet set goals, MSW management authorities adopt locally adapted
strategies that are suitable to them for example, in Kano (Nigeria), Muhammad and Salihi
(2018) reported that the state government provides all the funds needed to operate and
maintain the MSW management system while the small fraction of service users that
engage informal operators pay directly to the informal operators. Rodic et al (2010) also
reported of different arrangements in Kunming (China), Managua (Nicaragua) and Belo-

229
Horizonte (Brazil). In Aba, residents are charged usage fees which they are compelled to
pay irrespective of whether they use the service or not. This study found that even though
good practice requires that the accounting records are made available to the public for
scrutiny (Whiteman et al 2006; Wilson and Scheinberg 2010), relevant officers of ASEPA
were very unwilling and resistant to all requests relating to finances. Similar experiences
were also reported in previous studies of MSW management in Nigeria (Batagarawa
2011; Ezeah 2010). Though the public officials were quick to highlight lack of funds as
the main constraint and reason for their inefficiencies, they would not provide any
information on budgets, costs or what fraction of the costs are recovered through the
statutory levy paid by service users. This study believes that their attitudes to questions
relating to finances lend credit to the prevalence of corruption as alleged by various
participants with insider knowledge and information (chapter 6).
In terms of policy and institutional coherence, the one-dimensional approach of ASEPA
as a supreme adjudicator in MSW management in Aba, thus creating a lack of synergy has
already been highlighted above. The inadequacy of the national sanitation policy for not
considering waste minimisation was also highlighted in section 8.2.3. However, while
most participants in this study believe that new laws and policies are required to enable
the desired changes in MSW management in the city (chapter 6), most participants from
the LEPI stakeholder group agree with reports from previous publications that the
necessary laws and policies are often available even areas with remarkably poor
performances in MSW management (UNEP 2015; Ezeah 2010; Wilson 2007). The
researcher joins participants from this stakeholder group in arguing for a stronger
implementation of the national sanitation policy and the introduction of a better
monitoring and enforcement regime that will be geared towards behavioural and
attitudinal changes as against the current focus on fines and penalties (section 6.3). In
addition, the researcher also thinks that the MSW management sector should be
liberalised to make it competitive and service driven so as to encourage the participation
of a wider variety of service providers. ASEPA should also be under the supervision of the
MOE, supposing the later has in its employment, adequately trained and qualified
personnel.

230
8.2.5 Investment and Funding in MSW Management
As previously mentioned (in chapters 2, 5 and 6), governments and MSW management
authorities in developing countries have often pursued a modernisation agenda, often
involving the spending of significant amounts of money on the importation of
sophisticated equipment and machinery when it comes to the development of their MSW
management systems (Booth et al 2016; Ezeah and Roberts 2014; Bhuiyan 2010; Imam
et al 2008; Wilson 2007). However, several studies have also reported that this approach,
though often taken with good intentions – to replicate the results seen in those developed
countries in their home country; has often failed, and in many cases saddling the
developing country with foreign debts which they continue to repay long after the
imported equipment and machinery have broken down and become non-functional
(Njoroge et al 2014; Marshall and Farahbakhsh 2013; Scheinberg et al 2010; Wilson
2007; Imam et al 2008; Rushbrook and Pugh 1999). This view is also supported by other
authors who have argued for a political economy analysis approach to MSW management
development (Booth et al 2016; Long 2004), that is locally sensitive, creative and a critical
approach owned by the community of stakeholders (Booth et al 2016; Coffey and Coad
2010; UN-HABITAT 2010a; Konteh 2009; Henry et al 2006; Schubeler 1996). All through
this study the most common reason advanced by members of the TGGO stakeholder
group for the observed failures in MSW management was lack of funding as captured in
excerpt below (Table 8.2).
Table 8. 2: Participants from TGGO cite Lack of Funds as Key Challenge in MSW management
Question Answer
Participant id = 40
You mentioned that so many things
are in the pipeline. What will you
say is the biggest challenge for the
agency?
The biggest challenge is that of funding. We
hardly have enough equipment to carry out
the job effectively.
What do you mean by equipment?
Is it manpower or buckets or
trucks?
All of that and compactors, bulldozers, pay
loaders. We make use of all these.
Participant id = 42
231
I understand the job you do is
capital intensive. Outside that, what
will you say is the biggest
challenge?
The biggest challenge is equipment
If you are given all the equipment
required, do you have the requisite
manpower to run them?
There are people everywhere looking for
jobs so if we have equipment, we’ll employ
more people. For instance, if we had several
compactors, you will see them going street by
street.
As can be seen from the exchanges, lack of funds is also blamed for lack of manpower. As
explained by the participant, the staffs are often attached to operational vehicles for
refuse evacuation. Therefore it makes sense that in the absence of vehicles, more staff
cannot be employed. But, Nzeadibe and Ajaero (2010) reported the spending of five and
a half million US dollars (US$5.5m) on refuse collection vehicles in 2006. This study found
that, true to form, most of those vehicles are broken down and non-functional as shown
in pictures 11 and 12. The main reasons often reported for why these imported vehicles
do not stand the test of time include their unsuitability for local roads, differences in
waste composition, lack of a culture of maintenance on the part of MSW management
authorities in developing countries, poor planning, inappropriate use of the vehicles
owing to poorly trained or skilled operators, and negligence (Ezechi et al 2017; UNEP
2015, Ezeah and Roberts 2012; Ezeah 2010; Nzeadibe and Ajaero 2010; Imam et al 2008;
Wilson 2007; Wilson et al 2001).
Despite previous experiences of the failure of these imported vehicles to deliver the
expected results, and the numerous reasons advanced for their failure (as highlighted
above), this study found that (as reported in chapters 5, 6 and 7) ASEPA is still desirous
of these machineries and equipment. Many participants believe such preference is not
because there are no local alternatives available as they are quick to reference the
operations of informal waste pickers who do not have access to the advanced equipment.
They reckon the main reason is corruption. The following excerpt from a conversation
with a participant echoes the thoughts of many others who expressed similar opinion on
the prevalence of corruption – “So you find out that when you budget money for

232
equipment, the money is being siphoned to pay political cronies and the environment
remains the way it is and nothing is being done. From your governor to the president and
down to the chairman of your local government Obingwa, that is the problem with
Nigeria. So when you’re talking about anything, the manpower is not there, but money is
voted for it” (Participant id = 22). Most participants opined that embarking on the
importation of these refuse collection vehicles provides an easy avenue for politicians to
inflate the sum total of the contracts, syphon public money and enrich their cronies who
are often the contractors, all in preparation for the next election circle where the
accumulated monies will be used to perpetuate electoral crimes including vote buying,
thuggery and rigging. There are grounds to believe these allegations. As highlighted in
section 5.4, some success can be achieved by engaging local educational institutions such
as polytechnics and small and medium enterprises (SMEs) as reported by Channels TV in
2016. This study believes that a local approach to developing and manufacturing adapted
waste skips, carts and bins though public-private partnerships will be a better step to
take and offer better value for money. Figures 5.6 and 5.7 prove that such technologies
and know-how already exist locally.
On the choice of recycling as the ultimate goal of MSW management in the state (Table
5.2) and current efforts of the executive governor to attract investments into the sector,
Nzeadibe and Ajaero (2010) reported similar drives where state governments had signed
memorandums of understand (MOUs) with interested investor. Their report however
noted that often the investors showed little zeal in following up such partnerships beyond
putting pen to paper. They argued that even though on the surface of it, there appears to
be a reasonable chance for such projects e.g. WtE, recycling, etc. to be successful, the
apparent cold feet of investors appear to emanate from the seeming unwillingness of
government to guarantee the security of investments and personnel of these firms
(Nzeadibe and Ajaero 201). This reaffirms the position of this study that any expected
positive changes and viability of investments in MSW management in the city are
predicated upon holistic reforms of the sector to ensure transparency and public
accountability (section 5.4). Such reforms must also consider the integration of informal
waste workers and encourage the participation of community-based groups in service
provision (UNEP 2015; Ezeah and Roberts 2012; Sceinberg et al 2011; Ezeah et al 2009).
Nearer home, a practicable example of this approach is the establishment, by the Ondo
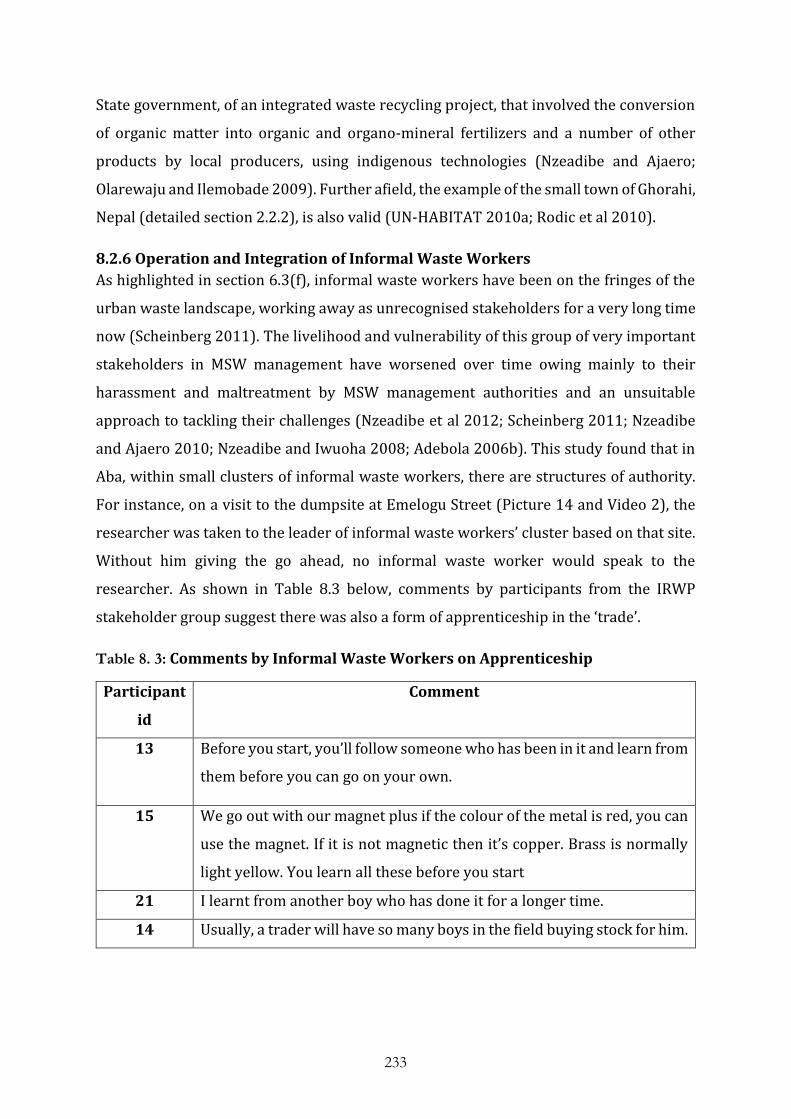
233
State government, of an integrated waste recycling project, that involved the conversion
of organic matter into organic and organo-mineral fertilizers and a number of other
products by local producers, using indigenous technologies (Nzeadibe and Ajaero;
Olarewaju and Ilemobade 2009). Further afield, the example of the small town of Ghorahi,
Nepal (detailed section 2.2.2), is also valid (UN-HABITAT 2010a; Rodic et al 2010).
8.2.6 Operation and Integration of Informal Waste Workers
As highlighted in section 6.3(f), informal waste workers have been on the fringes of the
urban waste landscape, working away as unrecognised stakeholders for a very long time
now (Scheinberg 2011). The livelihood and vulnerability of this group of very important
stakeholders in MSW management have worsened over time owing mainly to their
harassment and maltreatment by MSW management authorities and an unsuitable
approach to tackling their challenges (Nzeadibe et al 2012; Scheinberg 2011; Nzeadibe
and Ajaero 2010; Nzeadibe and Iwuoha 2008; Adebola 2006b). This study found that in
Aba, within small clusters of informal waste workers, there are structures of authority.
For instance, on a visit to the dumpsite at Emelogu Street (Picture 14 and Video 2), the
researcher was taken to the leader of informal waste workers’ cluster based on that site.
Without him giving the go ahead, no informal waste worker would speak to the
researcher. As shown in Table 8.3 below, comments by participants from the IRWP
stakeholder group suggest there was also a form of apprenticeship in the ‘trade’.
Table 8. 3: Comments by Informal Waste Workers on Apprenticeship
Participant
id
Comment
13 Before you start, you’ll follow someone who has been in it and learn from
them before you can go on your own.
15 We go out with our magnet plus if the colour of the metal is red, you can
use the magnet. If it is not magnetic then it’s copper. Brass is normally
light yellow. You learn all these before you start
21 I learnt from another boy who has done it for a longer time.
14 Usually, a trader will have so many boys in the field buying stock for him.

234
While Table 8.4 provides further insights on informal recycling, this study also found that
quantity was a major driver of the activities of informal waste workers in Aba. As
highlighted in section 2.9.2.5 and Table 5.16, informal waste workers operate in different
modes. Often times they concentrated on areas where they can amass sufficient
quantities of the materials that were of interest to them. This is so because their income
depended on it (section 5.2(b)). These findings suggest that integrating the informal
waste workers into the mainstream MSW management services provision in Aba, will
contribute to their specialisation as well as help them scale up their operations, with
attendant benefits that will include higher income and better livelihoods (Scheinberg
2011; Olanrewaju and Ilemobade 2009).
Table 8. 4: Insights on Informal Recycling and Informal Recycling Systems
Insights First wave – 1990s Second wave – 2000s
Informal
Recyclers and
their activities
Informal recyclers choose activity
owing to lack of formal education
or paperwork
Eliminating children’s
participation requires parental
and community involvement in
decision making
They are often more interested in
improving their business model
than in ‘better work’
Either waste pickers do the
activity for less than 6 months or
a lifetime, involving multiple
generations
Informal Recyclers make up as
much as 1% of the world
population – large numbers
are in Asian, Latin American,
and North American cities
Formalisation trends favour
men
Informal recyclers perform
environmental services for
their cities, some of which can
be quantified and generate
value that cities do not pay for
or support
Informal
Recycling
Systems
Earnings often surpass minimum
wage
Privatised landfills and waste
collection disrupt informal
livelihoods
In most developing country
cities the majority of recycling
happens informally
More people work in the
informal waste sector than the
formal

235
International and charity efforts
to move waste pickers out of the
system fall short because the
income they offer is not
comparable
European cities have active
informal systems
Pro-forma costs of informal
recycling and waste collection
are lower than formal service
costs.
Formalising and legalising
informal recycling depends on
social and governance factors,
including the establishment of
identity of internal or cross-
border migrants
(Credit: Scheinberg et al 2016)
For MSW management authorities considering how to integrate informal waste workers
into formal MSW service provision, Table 8.5 below provide a guideline on how informal
waste workers have been integrated in different cities and countries, often to great effects
as high recycling rates have been reported (Scheinberg et al 2016; UN-HABITAT 2010a;
Scheinberg et al 2010; Wilson 2007).
Table 8. 5: Examples of Inclusive Recycling
City / Country Project or intervention in line with the ideas of inclusive
recycling
Brazil
Philippines
Municipalities give informal recyclers /junk shops concessions to
collect or receive materials /to operate recycling centres.
Mali (W. Africa) Communities give local platforms concessions to operate recycling
transfer and community disposal and sell the decomposed soil to
farmers.
Egypt
Columbia
Informal recyclers use city land for post-collection sorting, tip areas
(Colombia, Cairo). Mostly they don’t pay but they have no rights to
stay there if the city changes its mind.
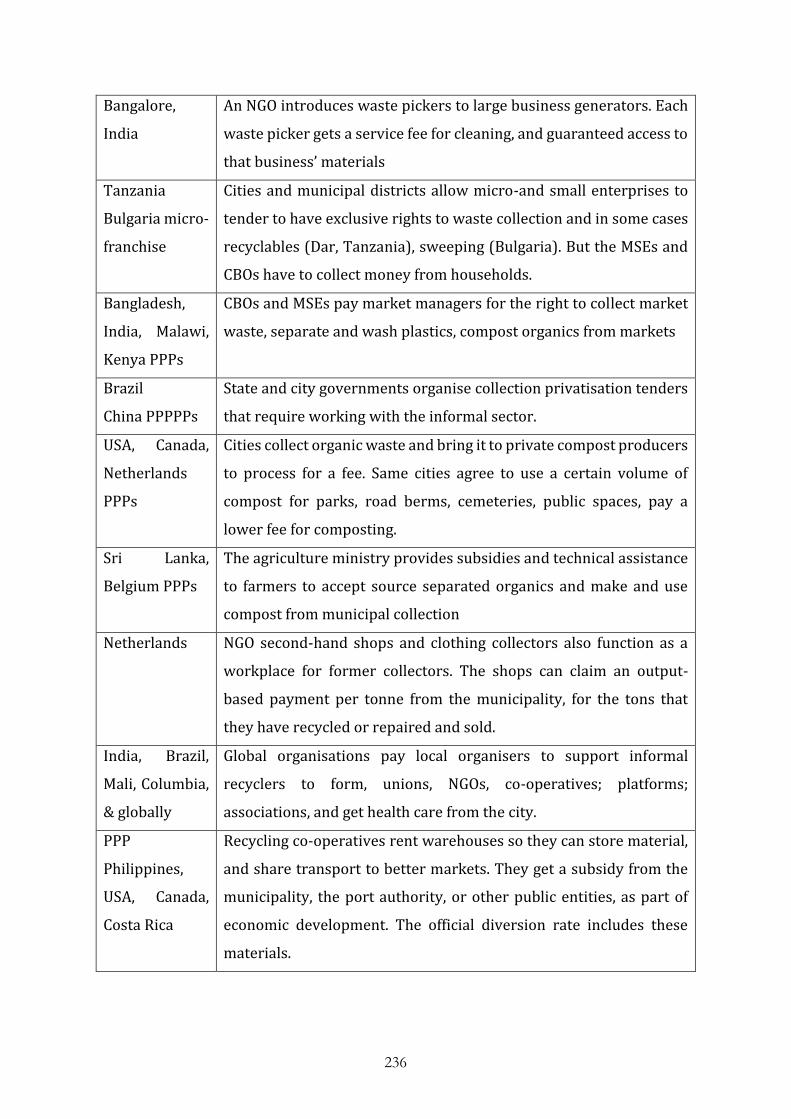
236
Bangalore,
India
An NGO introduces waste pickers to large business generators. Each
waste picker gets a service fee for cleaning, and guaranteed access to
that business’ materials
Tanzania
Bulgaria micro-
franchise
Cities and municipal districts allow micro-and small enterprises to
tender to have exclusive rights to waste collection and in some cases
recyclables (Dar, Tanzania), sweeping (Bulgaria). But the MSEs and
CBOs have to collect money from households.
Bangladesh,
India, Malawi,
Kenya PPPs
CBOs and MSEs pay market managers for the right to collect market
waste, separate and wash plastics, compost organics from markets
Brazil
China PPPPPs
State and city governments organise collection privatisation tenders
that require working with the informal sector.
USA, Canada,
Netherlands
PPPs
Cities collect organic waste and bring it to private compost producers
to process for a fee. Same cities agree to use a certain volume of
compost for parks, road berms, cemeteries, public spaces, pay a
lower fee for composting.
Sri Lanka,
Belgium PPPs
The agriculture ministry provides subsidies and technical assistance
to farmers to accept source separated organics and make and use
compost from municipal collection
Netherlands
NGO second-hand shops and clothing collectors also function as a
workplace for former collectors. The shops can claim an output-
based payment per tonne from the municipality, for the tons that
they have recycled or repaired and sold.
India, Brazil,
Mali, Columbia,
& globally
Global organisations pay local organisers to support informal
recyclers to form, unions, NGOs, co-operatives; platforms;
associations, and get health care from the city.
PPP
Philippines,
USA, Canada,
Costa Rica
Recycling co-operatives rent warehouses so they can store material,
and share transport to better markets. They get a subsidy from the
municipality, the port authority, or other public entities, as part of
economic development. The official diversion rate includes these
materials.

237
Indonesia,
Canada &
California USA,
Bangladesh
Community development officials support and pre-finance recyclers
to develop hybrid or new businesses combining services with
valorising the materials e.g. composting, deposit return, carbon
financing.
Costa Rica,
Netherlands,
Canada
National governments make laws requiring producers to take their
products back and recycle them (EPR). In Costa Rica, the producers
hire informal recyclers to dismantle the computers in a workshop
with good working conditions.
Costa Rica,
Brazil, Cairo,
India
NGOs get funds from the municipality to train waste pickers and
value chain actors; give them income support; keep children in
school; teach parents to read; pay health insurance
New York (NY
Times); Brazil,
Peru, Manila
Informal recyclers organise themselves to manage waste at sporting
events, outdoor concerts, fairs, and markets. They get a fee from the
organisers but get to keep the recyclables.
Peru, India,
Brazil,
Philippines
The city authorities provide waste pickers and value chain actors
with uniforms, shoes, gloves, eye protection, and ergonomically
correct carts. They provide insurance and give them ID cards which
allow them to enter residential areas and collect recyclables without
being harassed. Or to manage municipal depots to which the private
informal recyclers have a key. The collectors keep the recyclables and
sell them; do not receive any salary. The City claims the diversion as
part of their reporting to the environmental authorities.
While some forms of these arrangements may be practiced amongst informal waste
workers in Aba, the quantity of materials they recover or recycle, and hence their
contribution to MSW management, are not being recorded. This study believes that
getting the benefits associated with the integration of informal waste workers in Aba will
also hinge on a genuine engagement of the different stakeholders and the transparency
of the reforms as previously suggested.

238
CHAPTER NINE
Conclusion and Recommendations
9.0 Summary
In an attempt to understand the real issues, challenges and contexts of MSW management
in developing countries, this study adopted a PNS and case study approach to peruse
MSW management in the city of Aba, Abia State, Nigeria. The main methods of data
collection involved unstructured guided interviews, field notes and researcher
observations. These data collection methods reflect the importance accorded by the
study to the participation of the different stakeholders and their different perspectives
on MSW management in the city. Details of the statement of the problem, the literature
review and research methodology are presented in chapters 1, 2 and 3 respectively. The
analysis of the data are presented in chapters 4, 5, 6 and 7, with each chapter addressing
a research aim and objective as set out on page 7. In chapter 8, the discussion of the key
results from the data analysis was presented. The conclusions presented in the next
section are drawn from the key results while the recommendations for future studies are
informed by the experience gained through this research and the challenges encountered.
9.1 Conclusion
The major conclusions from this investigation include:
This study was the first systematic attempt to evaluate the history of MSW
management in Aba. As detailed in chapter 4, the analysis of the data show that
while the processes of MSW management in the city remained rudimentary over
the period evaluated, often involving the evacuation of refuse from one point to
another, analysis of the different eras reveal a clear policy and committed
leadership had positive impact on MSW management while perceived population
growth and rising waste generation rates had a negative effect.
ASEPA (Aba zone) has the overall mandate of managing MSW in Aba. The MSW
management system implemented by ASEPA is informed by the national
sanitation policy designed at the federal level. The policy did not consider
measures targeted at waste minimisation. The data analysis as detailed in chapter
5 show that the system implemented by ASEPA is unsuitable and inefficient.
Consequently, indiscriminate dumping and littering, illegal dumping and open
burning of waste are prevalent in the city. Waste bins are not provided for public

239
use in public places and standard storage facilities for waste such as wheelie bins
are not used in the city.
Contrary to the commonly held popular notion that residents of the city prefer a
dirty environment to a clean one (termed Aba Syndrome), this study found that
most participants, as well as having an understanding of the need for a cleaner
environment mainly for public health benefits, also expressed willingness to pay
higher sanitation fees if it will guarantee a cleaner environment (see chapters 5
and section 8.2.2). The data analysis also showed that traders in Aba showed a
very high level of understanding of MSW management challenges and processes,
mainly gained from travelling.
ASEPA operates like a task force – running unilaterally without engaging other
relevant departments such as planning, environmental health, etc. As shown in
chapter 6, their relationship with other relevant stakeholder groups is one
dimensional, with ASEPA seemingly wielding all the power. They do not consult
with or seek the input of anyone else. Within ASEPA, there were also allegations
of the marginalisation of other key members of staff by the DGM. Consequently,
MSW management scores very poorly on all indicators of governance – inclusivity,
financial sustainability and policy and institutional coherence (section 6.1).
ASEPA’s alleged highhandedness and inefficiencies means there are several areas
of conflicts with other stakeholder groups. As highlighted in section 6.2, they
include: the allocated times for waste disposal; non-recognition, intimidation and
harassment of informal waste workers; perceived lack of service provision; Focus
on penalties and fines at the expense of behavioural and attitudinal change; and
lack of synergy with other relevant departments.
While all current efforts by the executive governor have not yielded any
meaningful results, this study believes that it may not be unconnected with
current structure of the MSW management service and alleged high levels of
corruption prevalent in the system (as well as other realities and challenges
highlighted in chapters 5 and 6). With scarce resources and competition from
other needs ensuring public finances are increasingly stretched, an integrated
approach is needed to move the city’s MSW management situation towards a
sustainable system. In line with the recommendations of the ISWM framework
and the Rio Convention, this study proposes an all-inclusive transparent approach

240
that will involve the participation of all the stakeholders. Feedback and
suggestions from participants (chapters 4, 5, and 6) have shown that by involving
the citizens at all stages of the decision making process, a better understanding of
the issues and challenges are gained as well as a wider range of practicable
solutions (chapter 7).
Finally, this study believes that the direction of travel for MSW management in
Aba must change, focusing instead on harnessing local competencies that already
exist such as the production of suitable locally adapted waste management
facilities like skips, sanitary bins, push carts, etc. instead of pursuing
modernisation programmes that end up being white elephant projects. The
recognition and integration of the informal waste workers in Aba (as discussed in
8.2.6), into the mainstream MSW management service provision will benefit all
parties, improve the livelihood of this much maligned group and count toward
meeting goals for both sustainable and millennium development.
9.2 Challenges Encountered during the Study
This study commenced in September 2014 and the initial plan was to conduct an
extensive field work and data collection between July 2015 and September 2016, a period
of about 14 months. However, the political destabilisation that ensured from the general
elections held in Nigeria in early 2015 meant it was unsafe to travel to the area as
scheduled. Between January to February 2016, for a period of 3 weeks, the researcher
embarked on a preliminary field study to assess the MSW management situation first
hand and to build upon the contacts with would-be stakeholders that had been
established through telephone calls, emails and social media. However, it was still
impossible to establish firm contacts with the new government and officers with
responsibilities in MSW management. The researcher was intimated on ongoing legal
challenges involving the election of the state governor which meant that the government
was not settled and could not commit to the research as a stakeholder.
In October 2017, for a period of 7 weeks, the researcher undertook the data collection
exercise during which a total of 58 interviews were completed with participants from 7
stakeholder groups as detailed in section 3.3.4. Figure 3.3 (pp.64) is a flow chart that
details the research design. However, this research did not receive any funding or
financial support of any kind from any private individual or organisation. The shortfall in

241
resources meant it was not possible to undertake a focus group discussion that was
planned at the end of the data collection and initial data analysis where stakeholders
would have had the opportunity to deliberate on the issues that were raised.
During the data collection exercise, while members of all the other stakeholder groups
were steadfast in participating and providing useful information to the research, most
staff of ASEPA were demanding money to take part and once their request was turned
down on ethical basis, they declined participation. The senior members of staff of ASEPA
also declined answering any questions or providing any information related to finances.
In most cases, a long conversation ensued between the researcher and senior members
of staff of ASEPA on the choice of methodology. They insisted that the researcher should
follow common practice, which they said involved giving them a questionnaire to
complete and a return on a later date to collect the completed questionnaire.
Many stakeholders accepted the invitation to participate on strict conditions of
anonymity. Most expressed genuine fears of victimisation by the government while
others simply declined to speak on tape. The researcher’s local knowledge of the culture
of the inhabitants of the city, contacts and connections proved most useful in getting
stakeholders to participate.
9.3 Recommendations for Future Studies
This research recorded the first evaluation of the history and contexts of MSW
management in the city of Aba using oral responses of lived experiences of participants.
The findings will improve the understanding of the issues, challenges and contexts of
MSW management in the city. However, there are a few limitations which future
researches can overcome by following the recommendations below.
As a result of time and resource constraints, the entire duration spent in the field was 10
weeks. Much more time was spent liaising with would-be participants as some
constraints (highlighted in section 9.2) made it impossible for the researcher to spend
more time in the case study area. Further studies should be longer to allow for the
participation of more citizens and to cover more areas of the city.
There is still a huge gap in the availability of reliable quantitative data on MSW
management in the city. Though it is expected that the implementation of the vision and

242
action plan of this study (Annex 1) will address that issue, future studies will also
contribute immensely in bridging the existing gap.
The influence and contribution of informal recyclers in MSW management have
continued to grow over the years as reported in previous studies. This study found that
many informal recyclers operate in Aba but their contributions are not recorded or
accounted for by the MSW management authorities. The findings from this study also
indicate that this group of stakeholders are very vulnerable. Future studies should seek
ways of positively influencing the livelihoods of this important stakeholders and making
their contributions count.
Effective public education, awareness and sensitisation were identified by most
participants as one of the solutions to current MSW management challenges. ASEPA, have
reportedly been carrying out exercises aimed at achieving effective public education,
awareness and sensitisation but without noticeable success. Future studies could
investigate effective steps and measures that will ensure success.
This study identified several investment opportunities that could arise if the necessary
policy changes and the opening up of the sector were effected. They include waste
treatment, provision of transfer and transport vehicles, sanitary facilities, technology, etc.
Future studies could investigate specific potentials and challenges associated with each
of the opportunities and the wider implication to the local economy.
This study found spirituality to be a motive or driver for MSW management on the part
of many service users in Aba. It will be interesting to find out if this was the case in other
cities in Nigeria and other developing countries.

243
REFERENCES
Abdullahi, Y. A. A., Ahmad, A.S., Sirajo, M.Z., Bala, I.A., 2008. Developing an integrated
sustainable municipal solid waste management for a rapidly growing urban city: A
case study of Abuja, Nigeria. Paper presented at the POSTCON: 1st Post graduate
researchers' conference on 'Meeting the environmental challenges in coastal
regions of Nigeria'. Dundee, Scotland.
Abdulredha, M.A.A., Al Khaddar, R.M., Kot, P., Jordan, D., Abdulridha, A.,
2018. Benchmarking of the Current Solid Waste Management System in Karbala,
Iraq, Using Wasteaware Benchmark Indicators. In: World Environmental and Water
Resources Congress . pp. 40-48. (World Environmental and Water Resources
Congress 2018, 03 June 2018 - 07 June 2018, Minneapolis, Minesota, USA).
Abia State Government, 2014. Ministry of Environment and its Statutory function.
[online] Available at: http://www.abiastate.gov.ng/ministries/ministry-of-
environment-and-its-statutory-function/. Accessed [20/09/2014].
Abila, B., Kantola, J., 2013. Municipal Solid Waste Management Problems in Nigeria:
Evolving Knowledge Management Solution. World Academy of Science, Engineering
and Technology, 78, 292-297.
Acquah, I., 1958. Accra Survey: A Social Survey of the Capital of Ghana, formerly called
the Gold Coast, undertaken for the West African Institute of Social and Economic
Research, 1953-1956, Warwick Square, London: University of London Press.
Adama, O., 2007. Governing from above: Solid waste management in Nigeria's new capital
city of Abuja. Ph.D. Thesis ed. Stockholm University, Sweden.
Adebola, O.O., 2006a. New approaches of solid waste management in Lagos. In: Solid
waste, health and the Millennium Development Goals, CWG-WASH workshop, 1–5
February, 2006, Kolkata, India.
Adebola, O.O., 2006b. The roles of informal private sector in integrated solid waste
management in the achievement of the millennium development goals (MDGs) in
Lagos, Nigeria. A paper presented at the Solid Waste, Health & Millennium
Development Goals, CWG- WASH Workshop 2006. in Kolkata, India.

244
Adedibu, A.A., 1986. Solid Waste Management and a New Environmental Edict: A Case of
Study from Ilorin, Kwara State, Nigeria. The Environmentalist 18, pp.67–75.
Adejuwon, J. O., 2006. Food crop production in Nigeria. II. Potential effects of climate
change. Climate Research Vol. 32, pp.229 – 245.
Adelagan, J. A., 2004. The history of environmental policy and pollution of water sources
in Nigeria (1960-2004). Department of Civil Engineering University of Ibadan,
Nigeria [online] Available at: http://userpage.fu-
berlin.de/ffu/akumwelt/bc2004/download/adelegan_f.pdf. Accessed
[07/01/2015].
Aderibigbe, Y., 2008. Cart pushers get Dec 31 deadline to quit Lagos. The Nation, Friday 5
September, 2 (0777), 10.
Adewole, A., 2009. Waste management towards sustainable development in Nigeria: A
case study of Lagos state. International NGO, 4, 4, pp.173-179.
Adewuyi, R., Komine, H., Yasuhara, K., Murakami, S., 2009. Municicipal solid waste
management in developed and developing countries – Japan and Nigeria as case
studies.
Adeyemi, A.S., Olorunfemi, J.F., Adewoye, T.O., 2001. Waste scavenging in Third World
cities: A case study in Ilorin, Nigeria.The Environmentalist , 21 (2), 93-96.
AfDB (African Development Bank), 2002. Study on solid waste management options for
Africa. AfDB Sustainable Development and Poverty Reduction Unit, Abidjan, Cote
d'Ivoire.
Afon, A., 2007. Informal sector initiative in the primary sub-system of urban solid waste
management in Lagos, Nigeria. Habitat International, 31, 2, pp.193-204.
Afon, A., Okewole, A., 2007. Estimating the quantity of solid waste generation in Oyo,
Nigeria. Waste Management & Research, 25, 4, pp.371 – 379.
Afroz, R., Hanaki, K., Tuddin, R., Ayup, K., 2010. A survey of recycling behaviour in
households in Dhaka, Bangladesh. Waste Management & Research, 28(6), 552 - 560.
Afroz, R., Hanaki, K., Tudin, R., 2011. Factors affecting waste generation: a study in a waste
management program in Dhaka City, Bangladesh. Environ Monit Assess 179, pp.509
– 519.

245
Agamuthu, P., Khidzir, K. M., Hamid, F.S., 2009. Drivers of sustainable waste management
in Asia. Waste Management & Research 27, pp.625–633.
Agarwal, R., Chaudhary, M., Singh, J., 2015. Waste Management Initiatives in India for
Human Wellbeing. European Scientific Journal Special edition ISSN: 1857 – 7881
(Print) e - ISSN 1857- 7431.
Agunwamba, J. C., 1998. Solid waste management in Nigeria: Problems and issues.
Environmental Management, 22, 6, pp.849-856.
Agunwamba, J. C., 2003. Analysis of scavengers' activities and recycling in some cities of
Nigeria. Environmental Management, 32, 1, pp.116-127.
Agwu, M.O., 2012. Issues and challenges of solid waste management practices in Port-
Harcourt City, Nigeria – A behavioural perspective. Am. J. Soc. Manage. Sci. 3, pp.83-
92.
Ajero, C., Chigbo, U., 2012. A study on the evaluation of industrial solid waste management
approaches in some industries in Aba, South Eastern Nigeria. W. Afr. J. Ind. Acad.
Res. 4, pp.103-112.
Akoni, J., 2007. Municipal solid waste management in Abuja. Internal Departmental
Evaluation Paper. Waste Management Department, Abuja Environmental
Protection Board, Ministry of the Federal Capital, Abuja, Nigeria.
Al Sabbagh, M.K., Velis, C.A., Wilson, D.C., Cheeseman, C.R., 2012. Resource management
performance in Bahrain: a systematic analysis of municipal waste management,
secondary material flows and organizational aspects. Waste Management &
Research 30(8) 813 –824.
Ali, A., 2010. Wasting time on solid waste in developing countries. Waste Management,
30, pp.1437-1438.
Allinson, K., 2003. London's contemporary architecture. (3rd Ed.) Architectural press,
Elsevier, Oxford.
Al-Momani, A. H., 1994. Solid waste management: Sampling, analysis and assessment of
household waste in the city of Amman. International Journal of Environmental
Health Research, 4, pp.208–222.
Amadi, A.N., Nwankwoala, H.O., 2013. Evaluation of Heavy Metal in Soils from Enyimba
Dumpsite in Aba, Southeastern Nigeria Using Contamination Factor and Geo-
Accumulation Index. Energy and Environment Research Vol. 3, No. 1.

246
Amasuomo, E., Baird, J., 2016. Solid Waste Management Trends in Nigeria. Journal of
Management and Sustainability Vol. 6, No. 4.
Anake, W., Adie, G. and Osibanjo, O., 2009. Heavy metals pollution at municipal solid
waste dumpsites in Kano and Kaduna states in Nigeria. Bulletin of the Chemical
Society of Ethiopia, 23(2).
Andrady, A.L., 2011. Microplastics in the marine environment. Mar. Pollut. Bull. 62, 1596–
1605.
Anschütz, J., IJgosse, J., Scheinberg, A., 2004. Putting ISWM to Practice, WASTE, Gouda,
The Netherlands
Armijo, C., Puma, A., Ojeda, S., 2011. A set of indicators for waste management programs.
Second International Conference on Environmental Engineering and Applications.
IPCBEE, vol. 17. IACSIT Press, Singapore.
Avritzer, L., 2002. Democracy and the Public Space in Latin America. Princeton, NJ:
Princeton University Press.
Aye, L., Widjaya, E. R., 2006. Environmental and economic analyses of waste disposal
options for traditional markets in Indonesia. Waste Management, 26, 1180–1191.
Ayomoh, M.K.O., Oke, S.A., Adedeji, W.O. and Charles-Owaba, O.E., 2007. An approach to
tackling the environmental and health impacts of municipal solid waste disposal in
developing countries. Environmental Management. 88, pp.108-114.
Babayemi, J. and Dauda, K., 2009. Evaluation of solid waste generation, categories and
disposal options in developing countries: a case study of Nigeria. Journal of Applied
Sciences and Environmental Management 13, 3, pp.83-88.
Bai, R., Sutanto, M., 2002. The practice and challenges of solid waste management in
Singapore. Waste Management, 22(5), pg.557-567.
Ball, M., Sunderland, D., 2001. An Economic History of London, 1800-1914. Routledge,
London.
Barr, S., Ford, N.J., Gilg, A.W., 2003. Attitudes towards recycling household waste in
Exeter, Devon: quantitative and qualitative approaches. Local Environment 8,
pp.407–421.
247
Bartelings, H., van Beukering, P.J.H., Kuik, O., Linderhof, V., Oosterhuis, F., 2005. Waste
recycling and “design for environment”: roles for markets and policy instruments.
Resource and Energy Economics 27 (4), pp.287 – 305
Bartram, J., Cairncross, S., 2010. Hygiene, Sanitation, and Water: Forgotten Foundations
of Health. PLoS Medicine, 7 (11). e1000367. ISSN 1549-1277. [online] Available at:
http://researchonline.lshtm.ac.uk/2112/1/Hygiene-sanitation-and-water.PDF.
Accessed [29/11/2018].
Batagarawa, R.L., 2011. Sustainability appraisal of waste management in Nigeria:
Development and evaluation of an index based tool. PhD Thesis ed. University of
Portsmouth, UK.
BBC (British Broadcasting Corporation), 2017. Kenya plastic bag ban comes into force
after years of delays. [online]. Available at: https://www.bbc.co.uk/news/world-
africa-41069853. Accessed [25/04/2019].
Beccali, G., Federico, G., Iadicola, G., Rizzo, G., Traverso, M., 2007. Integrated approach to
the assessment of waste management systems within the SEA framework. Int. J.
Environ. Technol. Manage. 7 (1 – 2), pp.68 – 84.
Benson, C. H., Barlaz, M. A., Lane, D. T., Rawe, J. M., 2007. Practice review of five
bioreactors/recirculation landfills. Waste Management, 27(1), 13–29.
Berg, A.B., Radziemska, M., Adamcova, D., Zloch, J., Vaverkova, M.D., 2018. Assessment
Strategies for Municipal Selective Waste Collection – Regional Waste Management.
Journal of Ecological Engineering, 19(1), pg. 33–41.
Bhuiyan, S.H., 2010. A crisis in governance: urban solid waste management in
Bangladesh. Habitat International 34(1), 125 – 133.
Bongarts, J., 2009. Human population growth and the demographic transition. Philos
Trans R Soc Lond B Biol Sci, pp.2985 - 2990.
Booth, D., Harris, D., Wild, L., 2016. From political economy analysis to doing development
differently. A learning experience. Overseas Development Institute. ISSN: 2052-
7209.
Braun, V., Clarke, V., 2006. Using thematic analysis in psychology. Qualitative Research in
Psychology 3, pp.77-101
248
Brawley, M.R., 2006. Agricultural interests, trade adjustment and repeal of the Corn Laws.
British Journal of Politics and International Relations 8, pp.467-488.
Brennan, R.B., Healy, M.G., Morrison, L., Hynes, S., Norton, D., Clifford, E., 2016.
Management of landfill leachate: The legacy of European Union Directives. Waste
Manage. 55, 355–363.
Breza-Boruta, B., 2016. The assessment of airborne bacterial and fungal contamination
emitted by a municipal landfill site in Northern Poland. Atmo Poll Res. 7, 1043–
1052.
Bringhentia, J.R., Zandonadeb, E., Gunther, W.M.R., 2011. Selection and validation of
indicators for programs selective collection evaluation with social inclusion.
Resour. Conserv. Recycl. 55, pp.876 – 884.
Brown, L. R., 2006. Throwaway Economy in Trouble. Transcultural Futuristic Magazine,
pp.1-3.
Brunner, P.H., Fellner, J., 2007. Setting priorities for waste in developing countries. Waste
Management & Research 25 (3), pp.234 - 240.
Burntley, S.J., 2007. A review of municipal solid waste composition in the United
Kingdom. Waste Management 27, 10, pp.1274 – 1285.
Caicedo-Concha, D.M., Sandoval-Cobo, J.J., Whiting, K. 2016. An experimental study on the
impact of two dimensional materials in waste disposal sites: What are the
implications for engineered landfills? Sus Environ Res. 26, 255–261.
Carpenter, E. J., Smith, K.,1972. Plastics on the Sargasso Sea surface. Science 175, 1240–
1241.
CEC. 1977. Second EC Environment Action Programme (1977–81). Commission of the
European Communities, Brussels.
Chalhoub, M.S., 2018. Public policy and technology choices for municipal solid waste
management: a recent case in Lebanon. Cogent Environmental Science, 4:1529853.
Chambers, R., 1983. Rural Development: Putting the Last First. London, Lagos and New
York: Longman.

249
Chandak, S. P. (2010). Trends in solid waste management: issues, challenges and
opportunities. International consultative meeting on expanding waste management
services in developing countries UNEP, pp.1-22.
Chang, N.B., Pires, A., Martinho, G. 2011. Empowering systems analysis for solid waste
management: challenges, trends and perspectives. Critical Reviews in
Environmental Science and Technology 41 (16), pp.1449 – 1530.
Channels Television, 2016. Abia Polytechnic Makes Waste Management Bins For State
Govt. [online]. Available at: https://www.channelstv.com/2016/12/04/abia-
polytechnic-makes-waste-management-bins-for-state-govt/ [Accessed
18/06/2018]
Charmaz, K., 2003. 'Grounded Theory', in J.A. Smith (ed.), Qualitative Psychology: A
Practical Guide to Research Methods . London: Sage.
Cheng, S., Chan, C. W., Huang, G. H., 2002. Using multiple criteria decision analysis for
supporting decisions of solid waste management. Journal of Environmental Science
& Health Part A: Toxic/ Hazardous Substances and Environmental Engineering, 37,
975–990.
Chukwuemeka, E., Ugwuanyi, B.J., Ewuim, N. 2012. Curbing Corruption in Nigeria: The
Imperatives of Good Leadership. African Research Review Vol. 6 (3), Serial No. 26
Chung, S. S., Poon, C.S., 1999. The attitudes of Guangzhou citizens on waste reduction and
environmental issues. Resources, Conservation and Recycling 25, pp.35–59
Cifrian, E., Coz, A., Viguri, J., Andres, A., 2010. Indicators for valorisation of municipal solid
waste and special waste. Waste Biomass Valorization 1 (4), pp.479 – 486.
Clarkson, P. A., Adams, J. C., Phillips, P. S., 2002. Third generation waste minimisation
clubs: a case study of low cost clubs from Northamptonshire, UK. Resources,
Conservation and Recycling, 36(2), pp.107-134.
Coad, A., (ed.) .2006. Solid Waste, Health and the Millennium Development Goals, Report
of the CWG International Workshop Kolkata, India, 1–5 February 2006,
Collaborative Working Group on Solid Waste Management in Low- and Middle-
Income Countries
Coad, A., 2005. Private Sector Involvement in Solid Waste Management – Avoiding
Problems and Building on Successes. Collaborative Working Group on Solid Waste

250
Management in Low- and Middle-Income Countries (CWG), St Gallen, Switzerland,
CWG Publication Series No. 2.
Coffey, M., Coad, A., 2010. Collection of Municipal Solid Waste in Developing Countries.
2nd edn. UN-HABITAT, Nairobi, Kenya.
Cohen, E.D., 2014. What Would Aristotle Do? Two Concepts of Oppression. Psychology
Today. [online]. Available at: https://www.psychologytoday.com/us/blog/what-
would-aristotle-do/201411/two-concepts-oppression. [Accessed 25/03/2018].
Cointreau, S., 1982. Environmental management of urban solid wastes in developing
countries: a project guide. Urban Development Technical Paper Number 5, World
Bank, Washington DC.
Cointreau, S., Coad, A., 2000. Guidance Pack: Private Sector Participation in Municipal
Solid Waste Management, Vol 1 - 5. Skat, St Gallen, Switzerland.
Cointreau-Levine, S., Program, U. M., 1994. Private sector participation in municipal solid
waste services in developing countries: Published for the Urban Management
Programme by the World Bank.
Cole, M., Lindeque, P., Halsband, C., Galloway, T. S., 2011. Microplastics as contaminants
in the marine environment: a review. Mar. Pollut. Bull. 62, 2588–2597.
Contreras, F., Ishii, S., Hanaki, T.A.K., Connors, S., 2010. Drivers in current and future
municipal solid waste management systems: cases in Yokohama and Boston. Waste
Management & Research 28, pp.76–93
Cooper, T., 2006. Rags, bones and recycling bins. History today February 2006, pp.17-18.
Cox, J., Giorgi, S., Sharp, V., Strange, K., Wilson, D.C., Blakey, N., 2010. Household waste
prevention – a review of evidence. Waste Management & Research 28, pp.193 - 219.
Creswell, J.W., 2007. Qualitative inquiry and research design: choosing among five
approaches. Thousand Oaks, London: Sage.
Daskalopolous, E., 1998a. An integrated approach to municipal solid waste management.
Resources Conservation and Recycling, 24, 1, pp.33-50.
Daskalopoulos, E.I., 1998b. Developing an integrated approach to municipal solid waste
management. PhD Thesis ed. University of Cranfield, UK.
Dauda, M., Osita, O., 2003. Solid waste management and re-use in Maiduguri, Nigeria.
Paper presented at the 29th WEDC International Conference: Towards the
millennium goals, Abuja, Nigeria.

251
De Feo, G., De Gisi, S., 2010. Using an innovative criteria weighing tool for stakeholders
involvement to rank MSW facility sites with the AHP. Waste Management, 30, 958
–976.
De Marchi, B., Ravetz, J.R. 1999. Risk management and governance: a post-normal science
approach. Futures 31, pp.743–757.
DEFRA, 2005. A study to estimate the disamenity costs of landfill in Great Britain. Defra,
London.
DEFRA, 2013a. Incineration of Municipal Solid Waste. [online] Available at:
https://www.gov.uk/government/uploads/system/uploads/attachment_data/file
/221036/pb13889-incineration-municipal-waste.pdf. Accessed [02/07/2017].
DEFRA, 2013b. Mechanical Biological Treatment of Municipal Solid Waste. [online]
Available at:
https://www.gov.uk/government/uploads/system/uploads/attachment_data/file
/221039/pb13890-treatment-solid-waste.pdf. Accessed [09/01/2015].
DEFRA, 2014a. Policy. Reducing and Managing Waste. [online] Available at:
https://www.gov.uk/government/policies/reducing-and-managing-
waste/supporting-pages/hazardous-waste. Accessed [18/12/2014].
DEFRA, 2014b. Refuse derived fuel market in England. Call for evidence. [online]
Available at:
https://www.gov.uk/government/uploads/system/uploads/attachment_data/file
/288836/rdf-consult-evidence-201403.pdf. Accessed [02/07/2017].
DEFRA, 2015. 2010 to 2015 government policy: waste and recycling. Policy paper
available online at: https://www.gov.uk/government/publications/2010-to-2015-
government-policy-waste-and-recycling/2010-to-2015-government-policy-
waste-and-recycling. Accessed on [09/05/2018].
DEFRA, 2016. UK Statistics on Waste. [online] Available at:
https://www.gov.uk/government/uploads/system/uploads/attachment_data/file
/593040/UK_statsonwaste_statsnotice_Dec2016_FINALv2_2.pdf. Accessed
[17/06/2017]
Den Boer, J., Den Boer, E., Jager, J., 2007. LCA-IWM: A decision support tool for
sustainability assessment of waste management systems. Waste Management,
27(8), 1032 - 1045.

252
Dennison, G., Dodd, V. and Whelan, B., 1996. A socio-economic based survey of household
waste characteristics in the city of Dublin, Ireland II. Waste quantities. Resources,
Conservation and Recycling, 17, 3, pp.245-257.
Derraik, J. G. B., 2002. The pollution of the marine environment by plastic debris: a review.
Mar. Pollut. Bull. 44, 842–852.
Desmond, M., 2006. Municipal solid waste management in Ireland: assessing for
sustainability. Irish Geogr. 39 (1), pp.22 – 33.
DETR., 2001. Waste Strategy 2000 for England and Wales Part 1 and 2. Norwich.
Deutsch, M., 2005. "Overcoming Oppression with Power." Beyond Intractability. Eds. Guy
Burgess and Heidi Burgess. Conflict Information Consortium, University of
Colorado, Boulder. [online] Available at:
http://www.beyondintractability.org/essay/oppression-power Accessed
[05/01/2018]
Diaz, R., Otoma, S., 2013. Constrained recycling: a framework to reduce landfilling in
developing countries. Waste Management & Research 31(1) pp.23 –29.
Dolar, D., Košutić, K., Strmecky, T., 2016. Hybrid processes for treatment of landfill
leachate: Coagulation/UF/NF-RO and adsorption/UF/NF-RO. Separation and
Purification Technology 168, 39 – 46.
Duffy, J., 1990. The Sanitarians: A History of American Public Health. University of Illinois
Press, Urbana, IL.
EEA (European Environment Agency), 2007. The road from landfilling to recycling:
common destination, different routes. Copenhagen.
EEA (European Environmental Agency), 2009. ‘Diverting waste from landfill:
effectiveness of waste management policies in the European Union’. EEA Report No
7/2009
EEA (European Environmental Agency), 2013. Managing municipal solid waste – a
review of achievements in 32 European countries. EEA Report No 2/2013. ISSN
1725-9177.
Ekere, W., Mugisha, J. and Drake, L., 2009. Factors influencing waste separation and
utilisation among households in the Lake Victoria crescent, Uganda. Waste
Management. 29, pp.3047-3051.
Ekugo, E.I., 1998. Public Health and Urban Sanitation. Environ. News pp.5–7.

253
Eneh, O.C., 2011. Managing Nigeria's environment: The unresolved issues. J. Environ. Sci.
Technol. 4, pp.250 - 263.
Eriksson, O., Baky, A., 2010. Identification and testing of potential key parameters in
system analysis of municipal solid waste management, resources. Conservation and
Recycling 54 (12), pp.1095 – 1099.
Erren, T. C., Groß, J. V., Steffany, F., Meyer-Rochow, V. B., 2015. “Plastic ocean”: what about
cancer? Environ. Pollut. 207, 436–437.
Esho, L.S., 1997. An Assessment of the Role of the Private Sector in Urban Infrastructure
Service Provision: A case Study of Solid Waste Management in City of Nairobi, MA
Thesis, University of Nairobi, Kenya.
ETC/SCP, 2013. Municipal waste management in Germany. February 2013. ETC/SCP.
EU (European Union), 1999. Council Directive 1999/31/EC of 26 April 1999 on the
landfill of waste. Official Journal of the European Communities L 182, 42, pp.1–19.
EU (European Union), 2008. Directive 2008/98/EC of the European Parliament and of
the Council of 19 November 2008 on waste and repealing certain Directives. Official
Journal of the European Communities L 312, 51, pp.3–30.
Ezeah, C., 2010. Analysis of barriers and success factors affecting the adoption of
sustainable management of municipal solid waste in Abuja, Nigeria. PhD Thesis ed.
University of Wolverhampton, UK.
Ezeah, C., Roberts, C.L., 2012. Analysis of barriers and success factors affecting the
adoption of sustainable management of municipal solid waste in Nigeria. Journal of
Environmental Management 103, 9 – 14.
Ezeah, C., Roberts, C.L., 2014. Waste governance agenda in Nigerian cities: A comparative
analysis. Habitat International 41, 121 – 128.
Ezeah, C., Roberts, C.L., Phillips, P.S., Mbeng. L.O., Nzeadibe, T.C., 2009. Evaluation of
public health impacts of waste scavenging in Abuja Nigeria, using Q-methodology.
In proceedings of International Solid Waste Association ISWA world congress.
Ezechi, E.H., Nwabuko, C.G., Enyinnaya, O.C., Babington, C.J. 2017. Municipal solid waste
management in Aba, Nigeria: Challenges and prospects. Environ. Eng. Res. 22(3),
pp.231-236.

254
Federal Republic of Nigeria Official Gazette, 2009. Report on the 2006 Census Final
Results. Abuja. No. 2, Vol. 96
Federal Republic of Nigeria. 1999. The constitution of the Federal Republic of Nigeria.
Abuja: Federal Government printer.
Ferronato, N., Ragazzib, M., Portilloc, M.A.G., Lizarazu, E.G.G., Viotti, P., Torretta, V., 2019.
How to improve recycling rate in developing big cities: An integrated approach for
assessing municipal solid waste collection and treatment scenarios. Environmental
Development 29, 94 – 110.
Fetalvero, E., Fetalvero, S., De Luna, A., 2013. Fostering Environmentalism in a Post-
Normal Science context. Fifth International Conference on Science and Mathematics
Education CoSMEd Penang, Malaysia.
FME (Federal Ministry of Environment), 2005. National Environmental Sanitation Policy.
Abuja, Nigeria.
FME (Federal Ministry of Environment). 2000. Blueprint on municipal solid waste
management in Nigeria. Abuja: FMENV.
Fragkou, M.C., Vicent, T., Gabarrell, 2010. A general methodology for calculating the MSW
management self-sufficiency indicator: application to the wider Barcelona area.
Resour. Conserv. Recycl. 54 (6), pp.390 – 399.
Funtowicz, S. O., Ravetz, J. R., 1993. Science for the post-normal age. Futures. 739–755.
Funtowicz, S.O., Ravetz, J.R., 2003. Post-Normal Science. International Society for
Ecological Economics. Internet Encyclopaedia of Ecological Economics.
Funtowicz, S.O., Ravetz, J.R., 1990. Uncertainty and Quality in Science for Policy, Kluwer,
Dordrecht.
Funtowicz, S.O., Ravetz, J.R., 1991. “A New Scientific Methodology for Global
Environmental Issues”. In The Ecological Economics, R. Costanza (ed.), Columbia
University Press, NY, pp.137-152.
Funtowicz, S.O., Ravetz, J.R., Shepherd, I., Wilkinson, D., 2000. Science and Governance in
the European Union. Science and Public Policy, 27(5) pp.327-336.
Furedy, C., 1993. Recovery of wastes for recycling in Beijing. Environmental
Conservation, 20, pp.79–82.

255
Geng, Y., Zhu, Q., Doberstein, B. and Fujita, T., 2009. Implementing China’s circular
economy concept at the regional level: a review of progress in Dalian, China. Waste
management. 29, pp.996-1002.
Gertsakis, J., Lewis, H., 2003. Sustainability and the waste management hierarchy: A
discussion paper on the waste management hierarchy and its relationship to
sustainability. RMIT University, Melbourne, pp.1 – 15.
Gibbs, G. R., 2007. 4 Thematic coding and categorizing. Analyzing Qualitative Data.
London: SAGE Publications Ltd.
Gicheha, M.J., 1990. Solid Waste Management in Nairobi Metropolis. , M.Sc. Thesis,
University of Nairobi, Kenya
Girling, R., 2005. Rubbish! Dirt on our Hands and the Crisis Ahead. Eden Project Books,
London.
Giusti, L., 2009. A review of waste management practices and their impact on human
health. Waste Management 29, pp.2227–2239.
Golomeova, S., Srebrenkoska, V., Krsteva, S., Spasova, S., 2013. Solid Waste Treatment
Technologies. [online]. Available at:
http://eprints.ugd.edu.mk/7733/1/SOLID%20WASTE%20TREATMENT%20TEC
HNOLOGIES.pdf. Accessed [23/05/2018]
Gordon, W.J., 1890. How London lives. The feeding, cleansing, lighting and police of
London. (New and revised Ed.) The Religious Tract Society, Oxford.
Greene, K.L., Tonjes, D.J., 2014. Qualitative assessments of municipal waste management
systems: using different indicators to compare and rank programs in New York
State. Waste management 34 (4), pp.825 – 836.
Gregory, M. R., 2009. Environmental implications of plastic debris in marine settings—
entanglement, ingestion, smothering, hangers-on, hitchhiking and alien invasions.
Philos. Trans. R. Soc. B. Biol. Sci. 364, 2013–2025.
Grossmann, D., Hudson, J. F., Marks, D. H., 1974. Waste generation models for solid waste
collection. Journal of the Environmental Engineering Division, 100, pp.1219–1230.
Guerrero, L. A., Maas, G., Hogland, W., 2013. Solid waste management challenges for cities
in developing countries. Waste Management, 33(1), 220-232.
256
Guimeraes, B., Simoes, P., Marques, R.C., 2010. Does performance evaluation help public
managers? A balanced scorecard approach in urban waste services. J. Environ.
Manage. 91, pp.2632 – 2638.
Guo, N., Wilson, D.C., Bell, J.N.B., 2005. A tale of two cities – waste management in Beijing
and London. Waste Management World, November – December, pp.73–79.
Gupta, S.K., 2010. Plague-like epidemic in Surat, India. In Solid Waste Management in the
World’s Cities (Scheinberg A, Wilson DC and Rodic L (eds)). Earthscan for UN-
Habitat, London, UK, 21, box 2.2.
Hajbane, S., Pattiaratchi, C.B., 2017. Plastic pollution patterns in offshore, nearshore and
estuarine waters: a case study from Perth, Western Australia. Front. Mar. Sci. 4:63.
doi: 10.3389/fmars.2017.00063.
Haque, M.S., 2003. Citizen participation in governance through representation: Issue of
gender in East Asia. International Journal of Public Administration 26(5), pg. 569–
590.
Hazra, T., Goel, S., 2009. Solid waste management in Kolkata, India: practices and
challenges. Waste Management. 29, pp.470-478.
Henry, R. K., Zhao, Y. S., Dong, J., 2006. Municipal solid waste management challenges in
developing countries - Kenyan case study. Waste Management, 26, 1, 92-100.
Hettiarachchi, H., Meegoda, J.N., Ryu, S., 2018. Organic Waste Buyback as a Viable Method
to Enhance Sustainable Municipal Solid Waste Management in Developing
Countries. Int. J. Environ. Res. Public Health, 15, 2483.
Hotta, Y. (Ed.), 2014. 3R Policy Indicator Factsheets – Discussion Paper. Asia Resource
Circulation Policy Research Group. Institute for Global Environmental Strategies
(IGES), Kanagawa, Japan. [online]. Available at:
https://pub.iges.or.jp/system/files/publication_documents/pub/discussionpaper
/3890/3RIndicator_B5report_web.pdf. Accessed on [18/10/2018].
Huang, Y., Ning, Y., Zhang, T., Fei, Y., 2015. Public acceptance of waste incineration power
plants in China: Comparative case studies. Habitat International, 47, 11 – 19.
Huang, Y.T., Pan, T.C., Kao, J.J., 2011. Performance assessment for municipal solid waste
collection in Taiwan. J. Environ. Manage. 92, pp.1277 – 1283.

257
Hultman, J., Corvellec, H., 2012. The European Waste Hierarchy: From the
Sociomateriality of Waste to a Politics of Consumption. Environment and Planning
A: Economy and Space, 44 (10), pp.2413 - 2427.
Igoni, A. H., Ayotamuno, M. J., Ogaji, S. O. T. and Probert, S. D., 2007. Municipal solid-waste
in Port Harcourt, Nigeria. Applied Energy, 84, 6, pp.664-670.
IJgosse, J., Anschutz, J., Scheinberg, A., 2004a. Putting integrated sustainable waste
management into practice: using the ISWM assessment methodology as applied in
the UWEP Plus programme (2001 – 2003). Gouda, The Netherlands: WASTE.
IJgosse, J., Olley, J., de Vreede, V., Dulac, N., 2004b. Municipal Waste Management Planning
– Waste Keysheets. WASTE, Gouda, the Netherlands.
Imam, A., Mohammed, B., Wilson, D. and Cheeseman, C., 2008. Solid waste management
in Abuja, Nigeria. Waste Management, 28, 2, pp.468-472.
Institute of Developing Economies (IDE), 2005. International Trade of Recyclable
Resources in Asia. Chiba (29).
Issahaku, A., 2000. The political economy of economic reform in Ghana: Implications for
sustainable development. Journal of Sustainable Development in Africa, 2 (1), pp.13
- 27.
ISSER (Institute of Statistical, Social and Economic Research), 2012. Ghana Social
development outlook, 2012, University of Ghana. Accra
ISWA (International Solid Waste Association), 2013. ISWA Guidelines: Waste to Energy
in Low and Middle Income Countries. [online]. Available at:
https://www.iswa.org/index.php?eID=tx_iswaknowledgebase_download&docum
entUid=3252. Accessed [14/04/2019].
Izugbara, C.O., Okon, D.E., 2000. Indigenous Water Harvesting Techniques among the
Ngwa of Southeastern Nigeria: Implications for Environmental Conservation and
Rural Development. Environ. Analar 5, pp.450 - 458.
Izugbara, C.O., Ukwayi, J.K., 2002. Nigeria’s Do-It Yourself Community Development
Strategy: Self-Help as Self Exploitation. Departures 1 (1–2), pp.35 - 47.
Izugbara, C.O., Umoh, J. O., 2004. Indigenous Waste Management Practices among the
Ngwa of Southeastern Nigeria: Some lessons and policy implications. The
Environmentalist. 24, pp.87-92.

258
Jambeck, J.R., Geyer, R., Wilcox, C., Siegler, T.R., Perryman, M., Andrady, A., et al., 2015.
Plastic waste inputs from land into the ocean. Science 347, 768–771.
Jha, A.K., Singh, S.K., Singh, G.P., Gupta, P.K., 2011. Sustainable municipal solid waste
management in low income group of cities: a review. Tropical Ecology 52 (1),
pp.123-131.
Jiang, J.G., Lou, Z.Y., Ng, S., Ciren, L., Ji, D., 2009. The current municipal solid waste
management situation in Tibet. Waste Management 29, pp.1186–1191.
John, N. M., Edem, S. O., Ndaeyo, N. U. and Ndon, B. A., 2006. Physical composition of
municipal solid waste and nutrient contents of its organic component in Uyo
municipality, Nigeria. Journal of Plant Nutrition, 29, 2, pp.189-194.
Kalu, C., Modugu, W. and Ubochi, I., 2009. Evaluation of solid waste management policy
in Benin metropolis, Edo State, Nigeria. African Scientist 10, 1, pp.1-7.
Karagiannidis, A., Xirogiannopoulou, A., Perkoulidis, G., Moussiopoulos, N., 2004.
Assessing the collection of urban solid waste: a step towards municipality
benchmarking. Water Air Soil Pollution Focus 4(4 -5), pp.397 – 409.
Karak, T., Bhagat, R.M., Bhattacharyya, P., 2012. Municipal solid waste generation,
composition, and management: the world scenario. Crit. Rev. Environ. Sci. Technol.
42 (15), 1509-1630.
Karousakis, K., Birol, E., 2008. Investigating household preferences for kerbside recycling
services in London: A choice experiment approach. Journal of Environmental
Management, 88(4), pp.1099 - 1108.
Kay, J.J., Regier, H., Boyle, M. and francis, G., 1999. An ecosystem approach to
sustainability: addressing the challenge of complexity. Futures 31, pp.721-742.
Kay, J.J., Schindler, E., 1994. Embracing complexity, the challenge of ecosystem approach.
Alternatives 20 (3), pp.32-39.
Kielmann, K.; Cataldo, F.; Seeley, J., 2011. Introduction to Qualitative Research
Methodology. [online]. Available at:
https://www.rbfhealth.org/sites/rbf/files/Introduction%20to%20Qualitative%2
0Research%20Methodology%20-%20A%20Training%20Manual.pdf. Accessed
[05/02/2015].
KMA (Kumasi Metropolitan Assembly), 2010. Data for Purposes of Planning Waste
Management Intervention Programmes. Kumasi, Ghana: KMA.

259
Kofoworola, O. F., 2007. Recovery and recycling practices in municipal solid waste
management in Lagos, Nigeria. Waste Management, 27 (9), pp.1139-1143.
Konteh, F.H., 2009. Urban sanitation and health in the developing world: reminiscing the
nineteenth century industrial nations. Health & Place 15 (1), pp.69 – 78.
Krawczyk, K.A., Sweet-Cushman, J., 2016. Understanding political participation in West
Africa: the relationship between good governance and local citizen engagement.
International Review of Administrative Sciences 83(1S) pg. 136–155.
Kuusiola, T., Wierink, M., Heiskanen, K., 2012. Comparison of Collection Schemes of
Municipal Solid Waste Metallic Fraction: The Impacts on Global Warming Potential
for the Case of the Helsinki Metropolitan Area, Finland. Sustainability 4, pp.2586–
2610.
Leach, M.A., Bauen, A., Lucas, D.J., 1997. A system approach to materials flow in
sustainable cities: a case study of paper. Journal of Environmental Planning and
Management 40 (6), pp.705 – 723
Leeds, N., 2010. Moving to a zero waste economy: The role of waste prevention and reuse.
Paper presented at the CIWM Conference - Prevention is better than cure,
Birmingham.
Li, Z.S., Yang, L., Qu, X.Y., Sui, Y.M., 2009. Municipal solid waste management in Beijing
City. Waste Management 29, pp.2596–2599.
Lino, F.A.M., Ismail, K.A.R., 2012. Analysis of the potential of municipal solid waste in
Brazil. Environ. Dev. 4, 105 – 113.
Long, N., 2004. Development Sociology. Actor perspectives. Routledge. London and New
York.
Longe, E., Longe, O. and Ukpebor, E., 2009. People's perception on household solid waste
management in Ojo local government area in Nigeria. Iranian Journal of
Environmental Health Science & Engineering, 6, 3, pp.209-216.
Louis, G.E., 2004. A historical context of municipal solid waste management in the United
States. Waste Management & Research 22, pp.306-322
Mandela, N., 1994. A Long Walk to Freedom: The Autobiography of Nelson Mandela.
London. Little Brown.

260
Maps of World, 2014. Nigeria Map. [online]. Available at:
http://www.mapsofworld.com/nigeria/. Accessed [12/12/2014].
Marchand, G., Lavoie, J., Lazure, L., 2012. Evaluation of bioaerosols in a municipal solid
waste recycling and composting plant. J Air Waste Manage Assoc. 45, 778–781.
Marshall, R.E., Farahbakhsh, K., 2013. System approaches to integrated solid waste
management in developing countries. Waste Management 33, pp.988 – 1003.
Matsaert, H., Ahmed, Z., Islam, N., Hussain, F., 2005. Using actor-oriented tools to analyse
innovation systems in Bangladesh. [online]. Available at:
https://www.researchgate.net/publication/231537273_Using_actor-
oriented_tools_to_analyse_innovation_systems_in_Bangladesh. Accessed
[23/03/2019].
Matsumoto, S., 2011. Waste separation at home: Are Japanese municipal curbside
recycling policies efficient? Resour. Conserv. Recycl. 55, pp.325–334.
Mayhew, H., 1862. London labour and the London poor, vol. 2. Griffin, Bohn, and
Company, London. Initially published as series of columns in Morning Chronicle,
pp.1849-1850
Mazzanti, M. and Zoboli, R., 2008. Waste generation, waste disposal and policy
effectiveness Evidence on decoupling from the European Union. Resources,
Conservation and Recycling 52, pp.1221-1234.
McDougall, F., White, P.R., Franke, M., Hindle, P., 2001. Integrated Solid Waste
Management: A Lifecycle Inventory, second ed. Blackwell Science, Oxford, UK.
Medina, M., 2000. Scavenger cooperatives in Asia and Latin America. Resources,
Conservation and Recycling 31, pp.51-69
Melosi, M.V., 1981. Garbage in the cities. Refuse, reform, and the environment, 1880-
1980. Texas A&M University Press, USA.
Melosi, M.V., 2000. The sanitary city: urban infrastructure in America from colonial times
to the present. The Johns Hopkins University Press, Baltimore, USA.
Memon, M.A., 2010. Integrated solid waste management based on the 3R approach.
Journal of Material Cycles and Waste Management 12 (1), pp.30 - 40.
Mendes, M.R., 2003. A Comparison of the Environmental Impacts of Municipal Solid
Waste Management Options by Life Cycle Assessment. Urban Engineering. Tokyo:
The University of Tokyo.

261
Menikpura, S.N.M., Gheewala, S.H., Bonnet, S., Chiemchaisri, C., 2013. Evaluation of the
effect of recycling on sustainability of municipal solid waste management in
Thailand. Waste Biomass Valorization 4 (2), pp.237 - 257.
Michels, A., De Graaf, L., 2010. Examining citizen participation: Local participatory policy
making and democracy. Local Government Studies 36(4), pg. 477–491.
Miller, B., 2000. Fat of the land. Garbage in New York the last two hundred years. Four
Walls Eight Windows, New York, USA.
Minghua, Z., Xiumin, F., Rovetta, A., Qichang, H., Vicentini, F., Bingkai, L., Giusti, A. and Yi,
L., 2009. Municipal solid waste management in Pudong New Area, China. Waste
Management 29, pp.1227-1233.
Moghadam, M.R.A., Mokhtarani, N. and Mokhtarani, B., 2009. Municipal solid waste
management in Rasht City, Iran. Waste Management. 29, pp.485-489.
Montville, J.B., 2001. Refuse Truck Photo Archive. St Paul, MN: MBJ Publisher
Morrissey, A.J., Browne, J., 2004. Waste management models and their application to
sustainable waste management. Waste Management 24 (3), pp.297 – 308.
Muhammad, H.S., Salihi, I.U., 2018. Application of the UN-Habitat Integrated Sustainable
Waste Management Methodology to Evaluate the Solid Waste Management System
in the City of Kano, Nigeria. International Journal of Engineering Research in Africa,
38, pg. 115 – 123.
Munizaga, J.A., Garcia, A.L., 2013. Garbometer: a methodology for comprehensive
evaluation of municipal solid waste management systems. In: Proceedings of ISWA
World Congress 2013, 7–11 October, International Solid Waste Association (ISWA),
Vienna, Austria.
Murray, R., 1999. Creating wealth from waste. London: Demos and ecologika.
Nabegu, A. B., Mustapha, A., 2014. Enhancing awareness and participation of municipal
solid waste management in Kano Metropolis, Nigeria. World Scientific News, 5, 46-
53.
Nabegu, A.B., Wudil, P., 2008. "An assessment of Refuse Management and Sanitation
Board (REMASAB) Solid waste management in Kano metropolis". Techno–Science
Africana Journal, 1, pp. 101-108.

262
Neira, M., 1997. “Cholera: a challenge for the 21st century”. World Health, 50, January–
February.
Neudoerffer, R. C., Waltner-Toews, D., James, J. K., Joshi, D.D. and Tamang, M.S., 2005. A
diagrammatic approach to understanding complex eco-social interactions in
Kathmandu, Nepal. Ecology and Society. [online]. Available at:
http://www.ecologyandsociety.org/vol10/iss2/art12/. Accessed [02/12/2014].
Nicolli, F., 2012. Convergence of waste-related indicators of environmental quality in
Italy. Environ. Econ. Policy Studies 14 (4), pp.383–401.
Njoroge, B.N.K., Kimani, M., Ndunge, D., 2014. Review of Municipal Solid Waste
Management: A Case Study of Nairobi, Kenya. International Journal Of Engineering
and Science, Vol. 4, Iss 2, pp.16 – 20.
Nwaka, G., 2005. The Urban Informal Sector in Nigeria: Towards Economic Development,
Environmental Health, and Social Harmony. Global Urban Development Magazine,
1(1).
Nwankwo, C.K., 1994. Solid Waste Management, General Reviews and a Glance at the
Nigerian Situation. Journal of Mining Geol. 27, pp.29–25.
Nzeadibe, T. C., 2009. Solid waste reforms and informal recycling in Enugu urban area,
Nigeria. Habitat International, 33 (1), pp.93 - 99.
Nzeadibe, T. C., Ayadiuno, R. U. and Akukwe, T. I., 2010. Solid waste governance in Owerri
urban area, Nigeria: problems and prospects. Waste management 30, 2, pp.355-
357.
Nzeadibe, T. C., Iwuoha, H. C., 2008. Informal waste recycling in Lagos, Nigeria.
Communications in Waste & Resource Management (CWRM), 9 (1), pp.24 - 30.
Nzeadibe, T.C., Ajaero, C.K., 2010. Informal Waste Recycling and Urban Governance in
Nigeria: Some Experiences and Policy Implications. In Handbook of Environmental
Policy (eds) Johannes Meijer and Arjan der Berg, pg. 245-264.
Nzeadibe, T.C., Anyadike, R.N.C., Njoku-Tony, R.F., 2012. A Mixed Methods Approach to
Vulnerability and Quality of Life Assessment of Waste Picking in Urban Nigeria.
Applied Research Quality Life 7, pp.351 – 370.
Nzeadibe, T.C., Iwuoha, H.C., 2008. Informal waste recycling in Lagos, Nigeria.
Communications in Waste & Resource Management (CWRM), 9(1), 24-30.

263
Odoemena, U.D., Ofodu, J.C., 2016. Solid Waste Management in Aba Metropolis.
International Journal of Advanced Academic Research Sciences, Technology &
Engineering ISSN: 2488-9849 Vol. 2, Issue 12
Ogbonna, D., Amangabara, G. and Ekere, T., 2007. Urban solid waste generation in Port
Harcourt metropolis and its implications for waste management. Management of
Environmental Quality, 18, 1, pp.71-88.
Ogbonna, D., Ekwezor, I., Igwe, F., 2002. Waste Management: A Tool for Environmental
Protection in Nigeria. Ambio 31 (1), pp.55 - 57.
Ogwueleka, T.C., 2009. Municipal Solid Waste Characteristics and Management in Nigeria.
Iran J. Environ. Health Sci. Eng. 6, 3, pp.173-180.
Okorodudu-Fubara, M. T., 1998. Law of Environmental Protection: Materials and Text.
Caltop Publications (Nig.) Ltd: Ibadan, Nigeria.
Olaniran, O. J., 1991. Evidence of climatic change in Nigeria based on annual series of
rainfall of different daily amounts, 1919-1985. Climatic Change, 19(3), pp.319-340.
Olarewaju, O.O., Ilemobade, A.A., 2009. Waste to wealth: a case study of Ondo State
integrated waste recycling and treatment project, Nigeria. European Journal of
Social Sciences, 8 (1), 7-16.
Olley, J., IJgosse, J., Rudin, V., 2010. Managua city profile, for the UN Habitat’s Third Global
Report on Water and Sanitation in the World’s Cities “Solid Waste Management in
the World’s Cities”.
Olowomeye, R., 1991. The Management of Solid Waste in Nigerian cities. New York &
London. Garland Publishing, Inc.
Oteng-Ababio, M., 2012. The role of the informal sector in solid waste management in the
GAMA, Ghana: Challenges and opportunities. Journal of Econ Soc Geogr 2012, 103,
pp.412–425
Oteng-Ababio, M., 2013. Unscripted (in) justice: unequal exposure to ecological hazards
in Metropolitan Accra. Journal of Environment and Planning A, 45. doi:
10.1068/a45256.
Owusu-Sekyere, E., Bagah, D.A., Quansah, J.Y.D., 2015. The Urban Solid Waste
Management Conundrum in Ghana: Will It Ever End? World Environment 5 (2),
pp.52 – 62.

264
Pasotti, E., 2010. Sorting through the Trash: The Waste Management Crisis in Southern
Italy. Journal of South European Society and Politics 15(2), 289 – 307.
Pearce, D.W., 2004. Does European Union waste policy pass a cost benefit test? World
Econ, 15, pp.115-137.
Pernick, M.S., 1978. Politics, parties, and pestilence: epidemic yellow fever in Philadelphia
and the rise of the first party system. In: Sickness and Health in America, Leavitt,
J.W. & Numbers, R.L. (eds). Pp. 241–256 University of Wisconsin Press, Madison,
WI.
Pheby, D., Grey, M., Giusti, L., Saffron, L., 2002. Waste management and public health: the
state of the evidence - A review of the epidemiological research on the impact of
waste management activities on health. South West Public Health Observatory.
ISBN - 10: 0954135938
Phillips, P. S., Barnes, R., Bates, M. P., Coskeran, T., 2006. A critical appraisal of an UK
county waste minimisation programme: The requirement for regional facilitated
development of industrial symbiosis/ecology. Resources Conservation and
Recycling, 46(3), pp. 242-264.
Pizzi, R.A., 2002. Apostles of cleanliness. Modern Drug Discovery, 5, pp.51–55.
Pomberger, R., Sarc, R., Lorber, K.E., 2017. Dynamic visualisation of municipal waste
management performance in the EU using Ternary Diagram method. Waste
Manage. 61, 558–571.
Post, J., Broekema, J., Obirih-Opareh, N., 2003. Trial and error in privatisation: experiences
in urban solid waste collection in Accra and Hyderabad. Urban Studies 40, pp.837–
854.
Pratt, R. M., Phillips, P. S., 2000. The role and success of UK waste minimisation clubs in
the correction of market and information failures. Resources, Conservation and
Recycling, 30(3), pp. 201-219.
Price, J.L., Joseph, J.B., 2000. Demand management – a basis for waste policy: a critical
review of the applicability of the waste hierarchy in terms of achieving sustainable
waste management. Sustainable Development 8 (2), pp.96 – 105.
Rasmussen, C., Reimann, P., 2004. Recovery of Combustible Waste. Welfare Economic
Analysis of Co-Combustion at the Cement Production of Aalborg Portland a/S (in
Danish). Copenhagen, Denmark: Institute for Miljøvurdering.
265
Rathi, S., 2006. Alternative approaches for better municipal solid waste management in
Mumbai, India. Waste Management, 26(10), pp.1192-1200.
Read, A. D., 1999. Making waste work: making UK national solid waste strategy work at
the local scale. Resources Conservation and Recycling, 26, 3-4, pp.259-285.
Read, A. D., 2001. Delivering sustainable waste management - a UK perspective.
Resources Conservation and Recycling, 32, 3-4, pp.173-179.
Richards, P., 1985. Indigenous Agricultural Revolution. London: Hutchinson.
Roberts, C. L., Ezeah, C., Watkin, G., Philips, P. S., Odunfa, A., 2009. An investigation of
seasonal variation in municipal solid waste composition in tropical urban
environments: A case study of Abuja, Nigeria (in Press). Journal of Solid Waste
Technology and Management.
Robson, C., 2002. Real World Research. A Resource for Social Scientists and Practitioner-
Researchers (Second Edition). Malden, Mass.: Blackwell, 624 pages, ISBN 0-631-
21305-8.
Rochman, C. M., 2015. “The complex mixture, fate and toxicity of chemicals associated
with plastic debris in the marine environment,” in Marine Anthropogenic Litter, eds
M. Bergmann, L. Gutow, and M. Klages (Cham: Springer International Publishing),
117–140.
Rochman, C.M., Kurobe,T., Flores,I., Teh, S.J., 2014. Early warning signs of endocrine
disruption in adult fish from the ingestion of polyethylene with and without sorbed
chemical pollutants from the marine environment. Sci. Total Environ. 493, 656–
661.
Rodic, L., Scheinberg, A., Wilson, D.C., 2010. Comparing solid waste management in the
world’s cities. Proceedings of ISWA World Congress 2010 – Urban Development
and Sustainability – A Major Challenge for Waste Management in the 21st Century.
International Solid Waste Association (ISWA), Hamburg, Germany. [online].
Available at: https://www.iswa.org/uploads/tx_iswaknowledgebase/Rodic.pdf.
Accessed [18/10/2018].
Rodić, L., Wilson, D.C., 2017. Resolving governance issues to achieve priority sustainable
development goals related to solid waste management in developing countries.
Sustainability 9(3), 404. https://doi.org/10.3390/su9030404.

266
Rushbrook, P. and Pugh, M., 1999. Solid Waste Landfills in Middle- and Lower-income
Countries – A Technical Guide to Planning, Design and Operation. World Bank.
Washington, DC, USA.
Ryan, G. W., Bernard, H. R., 2003. Techniques to Identify Themes. Field Methods, 15(1),
85–109.
Sarkhel, P. and Banerjee, S., 2010. Municipal solid waste management, source-separated
waste and stakeholder’s attitude: a Contingent Valuation Study. Environ Dev
Sustain 12, pp.611-630.
Scheinberg, A., 2011. Value added: modes of sustainable recycling in the modernisation
of waste management systems. PhD Dissertation, Wageningen University, the
Netherlands. WASTE, Gouda, the Netherlands.
Scheinberg, A., Nesić, J., Savain, R., Luppi, P., Sinnott, P., Petean, F., Pop, F., 2016. From
collision to collaboration – Integrating informal recyclers and re-use operators in
Europe: A review. Waste Management & Research, 34(9), 820 – 839.
Scheinberg, A., Wilson, D.C., Rodic, L., (eds.). 2010. Solid Waste Management in the
World’s Cities: in UN-Habitat’s State of Water and Sanitation in the World’s Cities
Series. Earthscan for UN-Habitat, London, UK.
Schubeler, P., 1996. Conceptual framework for municipal solid waste management in
low-income countries. In: Wehrle, K., Christen, J., (Eds.), St. Gallen Switzerland:
UNDP/UNCHS/WORLD Bank/SDC Collaborative Programme on Municipal Solid
Waste Management in Low-Income Countries.
Seadon, J. K., 2006. Integrated waste management - Looking beyond the solid waste
horizon. Waste Management, 26(12), pg. 1327-1336.
Seadon, J.K. 2010. Sustainable waste management systems. Journal of cleaner production
18 (16 – 17), pp.1327 – 1336.
Seltenrich, N., 2015. New link in the food chain? Marine plastic pollution and seafood
safety. Environm. Health Perspect. 123:A34.
Senzige, J.P, Makinde, D.O, Njau, K.N., Nkansah-Gyeke, Y., 2014. Factors influencing solid
waste generation and composition in urban areas of Tanzania: The case of Dar-es –
Salaam. American Journal of Environmental Protection 3(4): pp.172-178.

267
SEPA (Scottish Environmental Protection Agency), 2014. Biodegradable Municipal
Waste. [online]. Available at:
http://www.sepa.org.uk/waste/waste_data/municipal_waste/biodegradable_mu
nicipal_waste.aspx. Accessed on: [30/12/2014].
SEPA (Scottish Environmental Protection Agency), 2017. Landfill. [online]. Available at:
https://www.sepa.org.uk/regulations/waste/landfill/. Accessed [04/07/2017].
Sharholy, M., Ahmad, K., Mahmood, G. and Trivedi, R.C., 2008. Municipal solid waste
management in Indian cities. A review. Waste Management. 28, pp.459-467.
Sharp, V., 2006. Emerging evidence from waste prevention and behaviour change
research. In Changing the Face of Waste Management, Proceedings of the CIWM
Conference, Paignton, UK, June 12–16 2006, Session BSA, paper 2.
Shekdar, A., 2009. Sustainable solid waste management: an integrated approach for Asian
countries. Waste Management. 29, pp.1438-1448.
Silpa, K., Yao, L., Bhada-Tata, P., Van Woerden, F., 2018. What a Waste 2.0: A Global
Snapshot of Solid Waste Management to 2050. Urban Development Series.
Washington, DC: World Bank. doi:10.1596/978-1-4648 -1329-0. License: Creative
Commons Attribution CC BY 3.0 IGO.
Singh, N., Livina, A., 2015. Waste Separation at Household Level: Comparison and
Contrast among 40 Countries. Social Science, Vol 5, Issue 1. ISSN - 2249-555X.
Solomon, U. U., 2009. The state of solid waste management in Nigeria. Waste
management, 29, 10, 2787-2788.
Souza, S.N.M., Horttanainen, M., Antonelli, J., et al., 2014. Technical potential of electricity
production from municipal solid waste disposed in the biggest cities in Brazil:
Landfill gas, biogas and thermal treatment. Waste Management & Research 32:
1015–1023.
Strasser, S., 2000. Waste and want: a social history of trash. Owl Books, New York.
Stuart, T., 2009. Waste: Uncovering the Global Food Scandal. Penguin, London, UK.
Sujauddin, M., Huda, M.S. and Rafiqul Hoque, A.T.M., 2008. Household solid waste
characteristics and management in Chittagong, Bangladesh. Waste Management 28,
pp.1688-1695.
Sule, R.A., 1982. Environmental Pollution in an Urban Centre; Waste Disposal in Calabar.
Third World Plan. Rev. 3, pp.4 - 7.

268
Suttibak, S., Nitivattananon, V., 2008. Assessment of factors influencing the performance
of solid waste recycling programs. Resour. Conserv. Recycl. 53 (1 - 2), pp.45 - 56.
Tai, J., Zhang, W/, Che, Y. and Feng, D., 2011. Municipal solid waste source-separated
collection in China: a comparative analysis. Waste Management. 31, pp.1673-1682.
Talalaj, I.A, Biedka, P., 2015. Impact of concentrated leachate recirculation on
effectiveness of leachate treatment by reverse osmosis. Ecological Engineering 85,
185 – 192.
Tarr, J.A., 1984. The evolution of the urban infrastructure in the nineteenth and twentieth
centuries. In Perspectives on Urban Infrastructure (Hanson R (ed.)). National
Academy Press, Washington, DC, USA, pp.4 – 21.
Tarr, J.A., 1996. The search for the ultimate sink: urban pollution in historical perspective
The University of Akron Press, Akron, Ohio, USA.
Tchobanoglous, G., Thiesen H., Eliassen, R., 1978. Solid Wastes: Engineering Principles
and Management Issues. McGraw-Hill, New York, NY.
Terazono, A., Yoshida, A., Yang, J., Moriguchi, Y., Sakai, S., 2004. Material cycles in Asia:
especially the recycling loop between Japan and China. Journal of Material Cycles
and Waste Management, 6, pp.82– 96.
The World Bank, 1999. International Bank for Reconstruction and Development, What a
Waste, Solid: Waste Management in Asia.
The World Bank, 2012. What a Waste. A Global Review of Solid Waste Management.
Urban Development Series. Knowledge Papers
The World Bank, 2014. Nigeria. World Development Indicators. [online]. Available at:
http://data.worldbank.org/country/nigeria. Accessed [12/12/2014].
The World Bank, 2017. GNI per capita, PPP (current international $). Available online at:
https://data.worldbank.org/indicator/NY.GNP.PCAP.PP.CD. Accessed on
[23/07/2018].
The World Bank, 2018. Population Growth (annual %). [online]. Available at:
https://data.worldbank.org/indicator/SP.POP.GROW?locations=NG. Accessed on
[04/05/2018]
Thomas, D. R., 2003. A general inductive approach for qualitative data analysis. School of
Population Health University of Auckland, New Zealand.
269
Tonglet, M., Phillips, P. S., Bates, M. P., 2004. Determining the drivers for householder
proenvironmental behaviour: waste minimisation compared to recycling.
Resources, Conservation and Recycling, 42 (1), pp. 27 - 48.
Turner, A., 2009. Population ageing: what should we worry about? Philos Trans R Soc
Lond B Biol Sci., pp.3009 - 3021.
Tvedten, I., Candiracci, S., 2018. “Flooding our eyes with rubbish”: urban waste
management in Maputo, Mozambique. Environment & Urbanisation 30 (2), pg. 631
– 646.
Ukpong, E.C.U., Udo, E.A., Umoh, I.C., 2015. Characterization of materials from Aba waste
dumpsites. Int. J. Eng. Appl. Sci. 6, pp.1- 10.
Umunnakwe, J.E., Akagha, C.I., Aharanwa, B.C., 2013. Influence of Industrial and Abattoir
Wastes on Some Physicochemical and Bacteriological Variables of Aba River
Nigeria. Civil and Environmental Research, Vol. 3 No 11.
UNCED,1992. Report of United Nations Conference on Environment and Development
(Rio de Janeiro, Brazil, A/CONF.151/26 (Vol. I). [online]. Available at:
www.un.org/documents/ga/conf151/aconf15126-1annex1.htm/ Accessed on:
[03/01/2018]
UNEP (United Nations Environment Programme), 2007. Nigeria's Institutional Response
to the CCD, manual on compliance with enforcement of multilateral environmental
agreements. United Nations Environment Programme, Division of Environmental
Laws and Conventions, Nairobi, Kenya.
UNEP (United Nations Environmental Programme), 2015. Global Waste Management
Outlook. ISBN: 978-92-807-3479-9.
UNEP (United Nations Environmental Programme), 2010. Integrated Solid Waste
Management Plan For the City of Nairobi, Kenya. 1st Draft. [online]. Available at:
http://www.unep.or.jp/ietc/GPWM/data/T3/IS_6_4_Nairobi_ISWMplan_draft1_1
9Feb.pdf. Accessed on [22/10/2018].
UNEP (United Nations Environmental Programme), 2015. Global Waste Management
Outlook. [online]. Available at:
http://eprints.whiterose.ac.uk/99773/1/GWMO_report.pdf. Accessed on
[20/03/2019].

270
UN-HABITAT, 2011. Collection of Municipal Solid Waste: Key issues for Decision-makers
in Developing Countries. ISBN: 978-92-1-132385-6
UN-HABITAT, 2009. State of the World’s Cities 2008/2009. Harmonious Cities. Earthscan
for UN-Habitat, London, UK.
UN-HABITAT, 2010a. Solid Waste Management in the World’s Cities. Water and
Sanitation in the World’s Cities. Earthscan, London, UK.
UN-HABITAT, 2010b. Collection of Municipal Solid Waste in Developing Countries. ISBN:
978-92-1-132254-5.
UN-HABITAT, 2014. The State of African Cities. Re-imagining sustainable urban
transitions. ISBN: 978-92-1-133397-8.
United Nations, 2018. Sustainable Development Goals. 17 Goals to Transform Our World.
[online]. Available at: https://www.un.org/sustainabledevelopment/. Accessed on
[18/03/2018].
US EPA, 2012. Code of Federal Regulations Title 40 – Protection of Environment. [online]
Available at: http://www.gpo.gov/fdsys/pkg/CFR-2012-title40-vol27/xml/CFR-
2012-title40-vol27-sec261-2.xml. Accessed [16/12/2014].
Vamplew, W., 1980. The protection of English cereal producers: the Corn Laws
reassessed. Economic History Review 33, pp.382-395.
Van Allen, J., 1975. Aba Riots or the Igbo Women's War? - Ideology, Stratification and the
Invisibility of Women. Ufahamu: A Journal of African Studies, 6(1). [online].
Available at:
https://cloudfront.escholarship.org/dist/prd/content/qt1700p1w0/qt1700p1w0
.pdf. Accessed on [18/10/2015].
Van Beukering, P., Kuik, O., Oosterhuis, F., 2014. ‘The Economics of Recycling’ in Worrell,
E., and Reuter, M.A., Handbook of Recycling. State-of-the-art for Practitioners,
Analysts, and Scientists. Elsevier. ISBN 978-0-12-396459-5. pp.479 – 489
van de Klundert, A. and Anschutz, J., 1999. Integrated Sustainable Waste Management:
the selection of appropriate technologies and the design of sustainable systems is
not (only) a technical issue. CEDARE/IETC Inter-Regional Workshop on Technology
for Sustainable Waste Management. Alexandria, Egypt.
van de Klundert, A., Anschutz, J., 2001. Integrated sustainable waste management – the
concept: tools for decision makers. Experiences from the Urban Waste Expertise

271
Programme (1995 – 2001). In: Scheinberg, A. (Ed.), Gouda. Urban Waste Expertise
Programme, Netherlands.
Vegter, A. C., Barletta, M., Beck, C., Borrero, J., Burton, H., Campbell, M., et al., 2014. Global
research priorities to mitigate plastic pollution impacts on marine wildlife.
Endanger. Species Res. 25, 225–247.
Velis, C., 2004. Building on Existing Informal Recycling Systems in Developing Countries.
MSc. Thesis, Department of Civil and Environmental Engineering, Imperial College,
London.
Velis, C., Wilson, D., Cheeseman, C., 2009. 19th century London dust-yards: A case study
in closed-loop resource efficiency. Waste Management Vol. 29 Iss. 4, pp.1282 – 1290
Veltri, G.A., 2014. The Myth of ‘Three Italies’: Differences and Similarities in
Environmental Values Between Macro-Regions. European Societies 16(5), 763 -
793.
Visvanathan, C., Trankler, J., 2004. Municipal Solid Waste Management in Asia: A
Comparative Analysis. Klong Luang, Thailand: Environmental Engineering and
Management, School of Environment, Resources and Development, Asian Institute
of Technology.
Walling, E., Walston, A., Warren, E., Warshay, B. and Wilhelm, E., 2004. Municipal solid
waste management in developing countries: Nigeria case study. Department of
Natural Resources, Connell University, USA.
Waltner-Toews, D. 2004. Ecosystem Sustainability and Health. A Practical Approach.
Cambridge University Press. United Kingdom.
Waltner-Toews, D., Kay, J., Lister, N, -M.E., 2008. The Ecosystem Approach: Complexity,
Uncertainty, and Managing for Sustainability. Columbia University Press, New York.
Waltner-Toews, D., Kay, J.J., Murray, T. and Neudoergger, R.C., 2004. Adaptive
Methodology for Ecosystem Sustainability and Health (AMESH): an Introduction. In
G. Midgley and A.E. Ochoa-Arias, eds. Community operational research: systems
thinking for community development. New York, USA: Plenum/Kluwer, pp.317-
349.
WCED, S.W.S., 1987. World Commission on Environment and Development. Our common
future.

272
Webb, S., Webb, B., 1922. English local government: statutory authorities for special
purposes. Longmans, Green and Co., London.
Wen, L., Lin, C.H., Lee, S.C., 2009. Review of recycling performance indicators: a study on
collection rate in Taiwan. Waste Manage. 29 (8), pp.2248–2256.
Whiteman, A., Barratt, L., Westlake, K., 2006. Solid waste management as a catalyst for
governance reforms: micro-licensing for private sector participation in Nigeria. In:
Solid waste, health and the Millennium Development Goals, CWG-WASH workshop
2006, 1 –5 February, Kolkata, India.
Whiteman, A., Smith, P. and Wilson, D.C., 2001. Waste management: an indicator of urban
governance. [online]. Available at:
http://www.davidcwilson.com/Waste_Management_An_Indicator_of_Urban_Gove
rnance.pdf. Accessed on: [24/12/2014].
WHO (World Health Organisation), 2012. WHO African Region: Nigeria [online].
Available at: http://www.who.int/countries/nga/en/. Accessed [12/12/2014].
WHO. (n.d.). [online]. Available at: https://www.who.int/topics/sanitation/en/
WHO. 2014. Preventing Diarrhoea Through Better Water, Sanitation and Hygiene:
Exposures and impacts in low- and middle-income countries. ISBN 978 92 4 156482
3.
WHO. 2015. Waste and human health: Evidence and needs. WHO Meeting Report, 5–6
November, 2015 Bonn, Germany.
Wilson, D., Araba, A., Chinwah, K. and Cheeseman, C., 2009. Building recycling rates
through the informal sector. Waste Management, 29, 2, pp.629-635.
Wilson, D., Whiteman, A., Tormin, A., 2001. Strategic Planning Guide for Municipal Solid
Waste Management. For the Collaborative Working Group on Solid Waste
Management in Low and Middle Income Countries (CWG). World Bank, Washington
D.C.
Wilson, D.C., 1999. Directions in waste management – past, present and future. In: Proc.
‘International Directory of Solid Waste Management 1999/2000 – The ISWA
Yearbook’, pp. 31–36. James & James, London
Wilson, D.C., 2007. Development drivers for waste management. Waste Management &
Research 25 (3), pp.198 – 207.

273
Wilson, D.C., Rodic, L., Cowing, M.J., Velis, C.A., Whiteman, A.D., Scheinberg, A., Vilches, R.,
Masterson, D., Stretz, J., Oelz, B., 2015. ‘Wasteaware’ benchmark indicators for
integrated sustainable waste management in cities. Waste Management 35, pp.329
– 342
Wilson, D.C., Rodic, L., Cowing, M.J., Whiteman, A, Stretz, J. and Scheinberg, A., 2013a.
Benchmark Indicators for Integrated & Sustainable Waste management (ISWM).
ISWA World Congress. Vienna, Austria.
Wilson, D.C., Rodic, L., Scheinberg, A.,Velis, C., Alabaster, G., 2012. Comparative analysis
of solid waste management in 20 cities. Waste Management & Research 30 (3),
pp.237–254.
Wilson, D.C., Scheinberg, A. 2010. What is good practice in solid waste management?
Waste Manage. Res. 28 (12), 1055-1056.
Wilson, D.C., Velis, C., Cheeseman, C., 2006. Role of informal sector recycling in waste
management in developing countries. Habitat International 30, pp.797- 808.
Wilson, D.C., Velis, C.A. and Rodic, L., 2013b. Integrated sustainable waste management
in developing countries. Waste and Resource Management. 166, WR2.
Wilts, H., 2012. National waste prevention programs: indicators on progress and barriers.
Waste Manage. Res. 30 (9 Supplement), pp.29–35.
Wisker, G. 2008. The Postgraduate Research Handbook. 2nd Edition Palgrave Macmillan,
UK
Wolsink, M., 2010. Contested environmental policy infrastructure: socio-political
acceptance of renewable energy, water and waste facilities. Environmental Impact
Assessment Review 30 (5), pp.302 – 311.
Woodward, D., 1985. "Swords into Ploughshares": Recycling in pre-industrial England.
Economic History Review 2nd series 38, pp.175-191.
World Population Review. 2018. Nigeria Population 2018. Available online at:
http://worldpopulationreview.com/countries/nigeria-population/. Accessed on
04/05/2018
Zaman, A.U., Lehmann, S., 2013. The zero waste index: a performance measurement tool
for waste management systems in a ‘zero waste city’. J. Cleaner Prod. 50, pp.123–
132.

274
Zarate, M.A, Slotnick, J. and Ramos, M., 2008. Capacity building in rural Guatemala by
implementing a solid waste management program. Waste Management 28, 12,
pp.2542-2551.
Zhang, H., Wen, Z., 2014. Residents’ Household Solid Waste (HSW) Source Separation
Activity: A Case Study of Suzhou, China. Sustainability 6, pp.6446-6466.
Zhang, W.Q., Che, Y., Yang, K., Ren, X.Y., Tai, J., 2012. Public opinion about the source
separation of municipal solid waste in Shanghai, China. Waste Manag. Res. 30,
pp.1261–1271.
Zhao, X., Jiang, G., Li, A., 2016. Technology, cost, a performance of waste-to-energy
incineration industry in China. Renewable Sustainable Energy Review, 55, 115 –
130.
Zhao, Y., Wang, H.T., Lu, W.J., 2009. Life-cycle assessment of the municipal solid waste
management system in Hangzhou, China. Waste Management Research 27, pp.399–
406
Zhao, Y., Xing, W., Lu W., Zhang, X., Christensen, T.H., 2012. Environmental impact
assessment of the incineration of municipal solid waste with auxiliary coal in China.
Waste management, 32, pp.1989–1998.
Zhu, M.H., Fan, X.M., Rovetta, A., He, Q., Vicentini, F., Liu, B.K.., 2009. Municipal solid waste
management in Pudong New Area, China. Waste Management 29, pp.1227–1233.
Zhuang, Y., Wu, S.W., Wang, Y.L., Wu, W.Z. and Chen, Y.X., 2008. Source separation of
household waste: a case study of China. Waste Management. 28, pp.2022-2030.
ANNEX ONE - Vision and Action Plan for Sustainable MSW Management in Aba
Introduction
MSW management is one of the most intractable problems for urban administrations. The
efficient management of MSW require considerable “political commitment, sufficient
budgetary allocations and a dedicated workforce” (UN-HABITAT 2010b), all of which can
be argued to be conspicuously absent in Aba. Having done a detailed expository of the
275
current realities and challenges of MSW in Aba in the previous chapter, this chapter
presents the vision and action plan – a series of prescribed changes or a solution set,
based on the principles of ISWM aimed at achieving sustainable MSW management in the
city of Aba. While this vision and action plan is not designed to be a one size fits all
solution for all MSW management problems, it is reasonable to expect the solution to be
effective in cities with similar realities and challenges as Aba. The idea is that the system
will be continuously reviewed and set goals and objectives will reflect current realities
and challenges.
It is also very important to mention that adequate levels of consultations with all
stakeholders will be needed to agree on these proposals before proceeding with
implementation. This chapter addresses the second research question – what approaches
can be used to remedy the situation and to what extent?
For consistency and to ensure all aspects of MSW management are covered, the vision
and action plan will also mimic the 2-overlapping-triangle format used in Chapter 2,
proffering solution for both physical and governance issues in MSW management
identified in Aba.
Physical
The physical comprises of all elements of MSW management activities from waste
generation to disposal.
Waste Generation
For effective planning and implementation of adequately improved levels of MSW
management services in the city, it is important to know the quantity of waste generated
by the service users. In chapter 5, population was shown to be the most influential factor
affecting waste arising in the city. Therefore it is very important to ascertain the
population of the city and the number of units of household using the service. That way,
it will be possible to deduce the waste generation rate. It will also make it possible to
prepare an appropriate budget that effectively costs the service.
To achieve these, the government (or the agency) will need to divide the entire areas for
which the services will be provided into small zones that are manageable for easy
enumeration. These boundaries must be well noted and maintained as it will also be used

276
to schedule the MSW collection services. Table 1 below is a summary of the proposal and
the expected result.
Table 1 Vision and Action Plan for Waste Generation
Action Plan Vision
Divide city into zones. Each zone having clear
boundaries and of easy to manage size
Acquire and maintain
adequate records of income
levels, population, and all
necessary data for easy
comparison between zones in
the city and with cities around
the world.
Enumerate each zone to ascertain the number of units
paying for MSW management services e.g. households,
stalls, businesses, etc. Also collate socio-economic
parameters such as income levels, age, education,
population, etc.
Waste Separation
Getting the service users to separate their waste into organic and inorganic could possibly
be one of the most important steps to quelling the current spate of unwanted smell and
pest infestation in the city. Once waste is separated into organic and inorganic at source
and collected efficiently, it is much easier to process. While organic waste can easily be
biologically treated through composting and anaerobic digestion, inorganic waste that
cannot be reused or recycled can be incinerated and energy recovered, or landfilled
without detriment to the groundwater table. To a very large extent, it also takes away a
lot of the disgust associated with waste management as decaying organic matter which
produces the foul smell is kept apart from the inorganic waste. Suffice to say that a lot of
public education and sanitary waste equipment will be required to effect this change.
Table 2 below is a summary of the proposal and the expected result.
Table 2 Vision and Action Plan for Waste Separation
Action Plan Vision
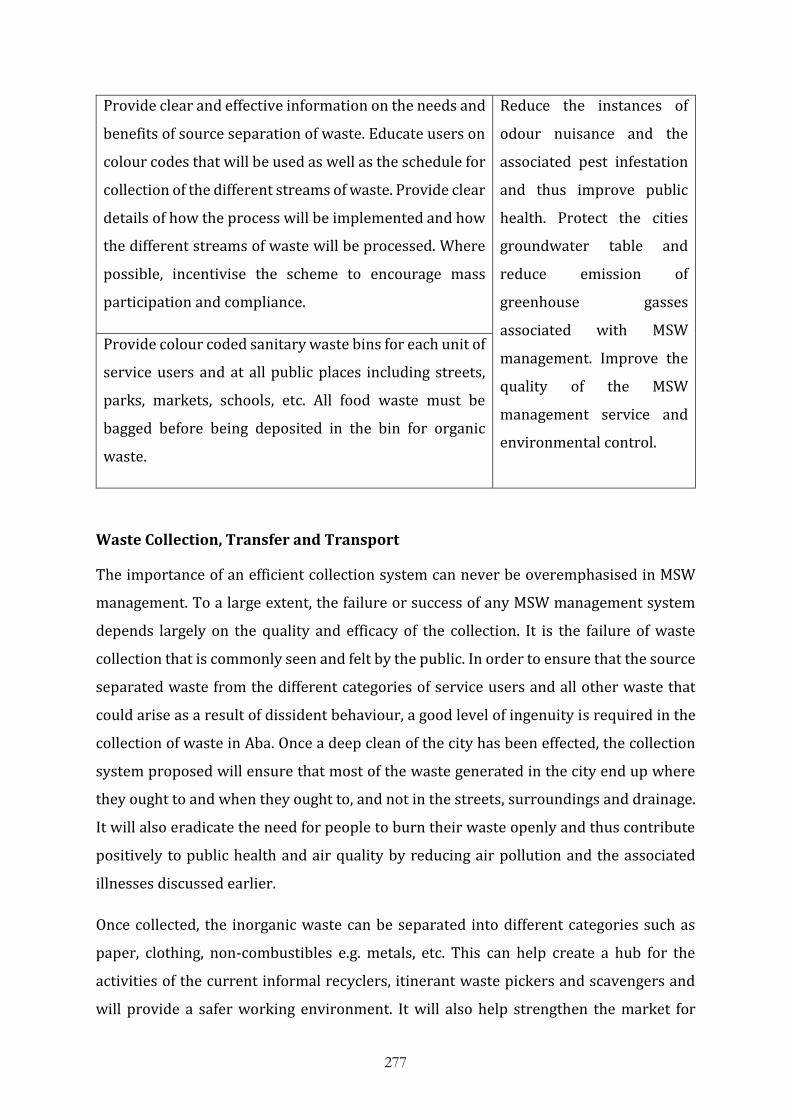
277
Provide clear and effective information on the needs and
benefits of source separation of waste. Educate users on
colour codes that will be used as well as the schedule for
collection of the different streams of waste. Provide clear
details of how the process will be implemented and how
the different streams of waste will be processed. Where
possible, incentivise the scheme to encourage mass
participation and compliance.
Reduce the instances of
odour nuisance and the
associated pest infestation
and thus improve public
health. Protect the cities
groundwater table and
reduce emission of
greenhouse gasses
associated with MSW
management. Improve the
quality of the MSW
management service and
environmental control.
Provide colour coded sanitary waste bins for each unit of
service users and at all public places including streets,
parks, markets, schools, etc. All food waste must be
bagged before being deposited in the bin for organic
waste.
Waste Collection, Transfer and Transport
The importance of an efficient collection system can never be overemphasised in MSW
management. To a large extent, the failure or success of any MSW management system
depends largely on the quality and efficacy of the collection. It is the failure of waste
collection that is commonly seen and felt by the public. In order to ensure that the source
separated waste from the different categories of service users and all other waste that
could arise as a result of dissident behaviour, a good level of ingenuity is required in the
collection of waste in Aba. Once a deep clean of the city has been effected, the collection
system proposed will ensure that most of the waste generated in the city end up where
they ought to and when they ought to, and not in the streets, surroundings and drainage.
It will also eradicate the need for people to burn their waste openly and thus contribute
positively to public health and air quality by reducing air pollution and the associated
illnesses discussed earlier.
Once collected, the inorganic waste can be separated into different categories such as
paper, clothing, non-combustibles e.g. metals, etc. This can help create a hub for the
activities of the current informal recyclers, itinerant waste pickers and scavengers and
will provide a safer working environment. It will also help strengthen the market for

278
reusable materials as well as make it easy for the relevant data to be appropriately
captured and recorded. Table 3 summarises the vision and action plan for waste
collection, transfer and transport.
Table 3 Vision and Action Plan for Waste Collection
Action Plan Vision
Prepare efficient schedule and agree same with stakeholders for
waste collection from all service user groups, zones and public
bins as well as for the cleaning of the drainage and public areas in
each zone. Where there are franchisees or contractors involved,
they must provide and adhere to similar schedules as part of the
agreement.
Collect and keep
adequate records
of quantity and
rates of waste
generation; costs
per user, types of
waste, etc.
Avoid huge and
misplaced
investments in
high-tech vehicles
that are mostly not
suitable and
ineffective
Ensure waste is collected using appropriate vehicles suitable for
local conditions that protect not just the health and safety of
waste workers but also the environment. This should also be
regulated for each franchisee or contractor. The use of locally
fabricated modified skips that can be attached to and driven by
motorised carts, tri-cycles, etc. is particularly recommended.
Once waste is collected from each zone and weighed, calculate
waste generation rates; average costs for the service to ascertain
how much it costs to provide the service per user and what
resources are required to provide services to each zone
Establish a team for monitoring and enforcement as well as a
helpline that anyone can contact for help and information.
Waste Treatment
Waste separation can be regarded as the first step of waste treatment as it helps achieve
environmental protection which is one of the important aims of waste treatment. Once

279
the separated waste has been collected, it is important to treat each stream of waste
accordingly to ensure the least environmental impact. For the organic stream, this study
proposes composting as this can readily be achieved without huge investments.
Composts or compost-like outputs (CLO) can be applied to farmlands as a soil
conditioner, used in landscaping, incinerated for energy recovery or sent to landfill.
Anaerobic digestion is also an option but requires huge investments though energy
production is also an added benefit. For the inorganic stream, once the reusable and
materials to be recycled has been removed, waste to energy (WtE) appears to be the most
suitable and beneficial treatment option as electricity supply is epileptic and unreliable
in the city. Where the funds are not available for a WtE plant, the residual inorganic waste
can be baled and landfilled. Table 4 below is a summary table for the vision and action
plan.
Table 4 Vision and Action Plan for Waste Treatment
Action Plan Vision
Establish properly planned and sited
treatment centres for organic and inorganic
waste collected. A compost farm for organic
waste and a WTE plant and or baling unit for
inorganic waste.
Drastically reduce the harmful
environmental impact of waste, open
up new economies and create job
opportunities
Waste Disposal
No matter the treatment method employed, waste management will always produce
residue that has to be disposed. For this reason, a properly planned, sited and engineered
sanitary landfill is an essential and desirable component of any ISWM system.
Consequently, the construction of a sanitary landfill or landfills to serve the MSW
management needs of the city of Aba is essential to achieve the visions proposed herein.
Figure 1 below is the influence diagram of the vision and action plan in Aba. It shows the
expected flow of MSW following the implementation of the proposal.
Figure 1 Material Flow Diagram of the Vision and Action Plan

280
[Credit: Researcher]
Governance
The proposals for the governance aspects of MSW management are arranged under the
broad headings of Inclusivity, Financial sustainability and Proactive policies and
institutions. It is noteworthy to mention that these governance changes are paramount
to achieving the desired vision and thus it is recommendable to effect the desired
governance changes before or simultaneously with the physical changes proposed above.
Inclusivity
For any meaningful progress to be made in the city in terms of MSW management, the
issue of service user and provider inclusivity must be attended to. Currently, the
government and its agency, ASEPA, do not have the required capacity to effectively

281
deliver the desired level of MSW management in the city. It is therefore necessary to
involve or partner other providers such as private professionals or waste management
cooperatives that can be formed through a union of existing informal waste workers. The
right policy frameworks and suitable methods of monitoring and evaluation must also be
established. The current secrecy that shrouds most management and financial activities
of the agency must be discarded for an open transparent system that not only encourages
private participation and public-private partnerships but also enhances accountability
and public trust.
The current status quo does not identify the stakeholders and the agency (government)
as members or parts of a system that should be working together to achieve a common
goal. The agency sees the stakeholders (service users) as waste generators and very
difficult people whose only desire is to make their (agency’s) work more difficult while
the service users see the agency as an oppressive force that collects money and does
nothing. In the midst of these views, the real issues of MSW management are lost.
Therefore, one of the key steps is to get both parties on the same side and for both to be
co-partners in designing, implementing, monitoring and evaluating the process.
To achieve this, the agency needs to have the right leadership and the requisite
knowledge to pass to key staff members. Once the message and culture flows through the
agency, then they need to communicate the new essence to other would-be service
providers and users. A massive, continuous and effective public awareness, sensitisation
and education drive will be just as important as a markedly improved level of service that
appeals to all users. Table 5 below summarises the vision and action plan for service
provider and user inclusivity.
Table 5 Vision and Action Plan for Service Provider and User Inclusivity
Action Plan Vision
Reposition the agency to understand its significant role
in the MSW management. Appoint a new strong, focused
and committed leadership based on knowledge and
understanding of the demands and challenges. Employ
professionals into key positions in the agency and

282
ensure all staff are adequately trained and
remunerated. An efficient Ministry of Environment
must assume oversight functions over the activities of
the repositioned agency.
Achieve high levels of public
awareness and desired
behavioural changes.
Get all stakeholders
involved and ensure they all
understand their roles as
interdependent partners.
An open tendering or
bidding policy will drive
competition and ensure
service users get optimum
value for money.
A monitoring and evaluation
team drawn from different
stakeholder groups will
ensure contracts are
adequately executed and
service is delivered.
Encourage and support the establishment of a cohort of
private-led, community-based, cooperatives or public-
private partnerships to partner with the agency as
waste management service providers
Establish an open transparent tendering process for
waste management services contracts where service
providers will bid to manage the different zones and or
different aspects of the service
Embark on effective mass education, sensitisation and
awareness campaign combining several methods such
as mass media, local systems e.g. town crier; and all
other systems available especially those used by
politicians during electioneering campaigns.
Involve all stakeholders in the design, implementation,
monitoring and evaluation of the MSW management
system through consultations, townhall meetings, focus
groups, interviews, surveys, etc.
Provide an equitable level of service that is satisfactory
and affordable to service users
Establish effective and responsible monitoring and
evaluation teams drawn from the different stakeholder
groups to ensure equity and contract fulfilments
Establish a well-trained enforcement team with clear
mandates and priorities of encouraging and driving

283
behavioural change with punishment of offenders and
penalties as last resort.
Financial Sustainability
MSW management costs money. The authorities in Aba are very quick to point out this
well-known fact. But just how much it really costs is shrouded in top secrecy partly
because they do not actually know. The combination of the prevalence of corruption and
the absence of key accounting practices, such as cost accounting and budgeting, which
could serve as checks and balances leaves more to be desired from a MSW management
system. For the system to be sustainable a long term approach to the budgeting is
necessary and the full costs of the services as well as the relative costs of the different
activities within the MSW management services ought to be ascertained and budgeted.
This requirement becomes even more important when other service providers are
involved as partners. Without the cost accounting practices, it will be impossible to
effectively cost the services and thus determine the true value of the contracts to be
awarded to partner service providers.
It is expected that the implementation of the proposals in this action and vision plan will
result in increases in the costs of service. Undoubtedly too, there is clear evidence of the
willingness of the service users to pay higher fees to ensure a better level of service. It is
thus very important to have in place, the necessary cost accounting practices and systems
to determine the levels of fees that users will have to pay if all costs are to be recovered
or the level of government subsidy to cover any shortfalls. Though not expected, the
accounting processes will also show if there were excesses generated and how they will
be invested. All of these must be available for public scrutiny. Table 6 below is a summary
of the vision and action plan for financial sustainability.
Table 6 Vision and Action Plan for Financial Sustainability

284
Action Plan Vision
Implement cost accounting techniques and processes
to ensure every aspect of the MSW management
activity is properly captured and costed. This may
include elucidating costs for separation, collection,
transfer and transport, treatment, disposal, etc. for the
different zones
Have adequate information
on the costs involved in
providing the services and
how and where the funds
come from.
Make it possible to forecast
and have a long term budget
and plan for the MSW
management system and
thus ensure sustainability of
the system.
Achieve and maintain an
equitable level of service that
is satisfactory to the majority
or all stakeholders.
Develop a streamlined cost-effective method of
collecting service charges from users. With current
technologies and evolving payment systems in mind, it
is important to minimise the costs of collecting these
charges and also avoid unnecessary leakages and
loopholes that might be exploited by service users.
Agree and effect the collection of acceptable levels of
service charges that are affordable to the majority of
service users. This must be backed up by the provision
of the agreed levels of services.
Over time, use the data to prepare forecasts and
budgets for the MSW management system. This will
provide a clear focus and plan and ensure the system
runs smoothly and sustainably. It will also make it easy
to attract investment in the sector as the figures which
will be available in the public domain will answer any
questions an intending investor may have.
Continue to monitor and evaluate the systems and
adjust and adapt accordingly to reflect emerging
scenarios and conditions.
Proactive Policies and sound institutions

285
The national environmental sanitation policy contains a few strategies to drive
improvements in MSW management but it is open to interpretation and the onus of
implementation is left to states and local government councils. Thus, to achieve any
desired objectives of the policy document, there is need to have trained professionals
who understand the provisions of the document and committed to its implementation at
the state and local government levels. A survey of the different cities in Nigeria will
suggest that there is either a dearth of these trained professionals at the required levels
or they are simply not effective. As stated earlier, public services in Nigeria is in shambles
and MSW management is not spared. This study found that a combination of poor
policies, lack of adequately trained manpower, neglect, lack of sound institutions and
heightened levels of corruption and nepotism are a few factors militating against
improvements in MSW management in Nigeria.
Consequently, to reverse this trend, this study recommends the development of a clear
and concise MSW management policy that focuses on the local issues and the
revitalisation of the institutions that historically played important roles in maintaining
good levels of MSW management and environmental protection in the past such as the
EHD, Local Government Authorities, Law Enforcements, schools, etc. Others include
traditional institutions such as the families, communities and churches. Table 7 below
shows details of the vision and action plan for proactive policies and sound institutions.
Table 7 Vision and Action Plan for Proactive Policies and Sound Institutions
Action Plan Vision
The policy or policies must be clear on waste generation
including strategies to minimise it; waste collection
including frequency and mode of collection; waste
treatment including separation and conversion; as well
as acceptable methods of disposal e.g. sanitary landfilling
of inert residues. Local policies must outlaw
indiscriminate dumping and littering of public and
private places. Penalties for dissident behaviour and
Have a clear system where
everyone understands their
roles and responsibilities
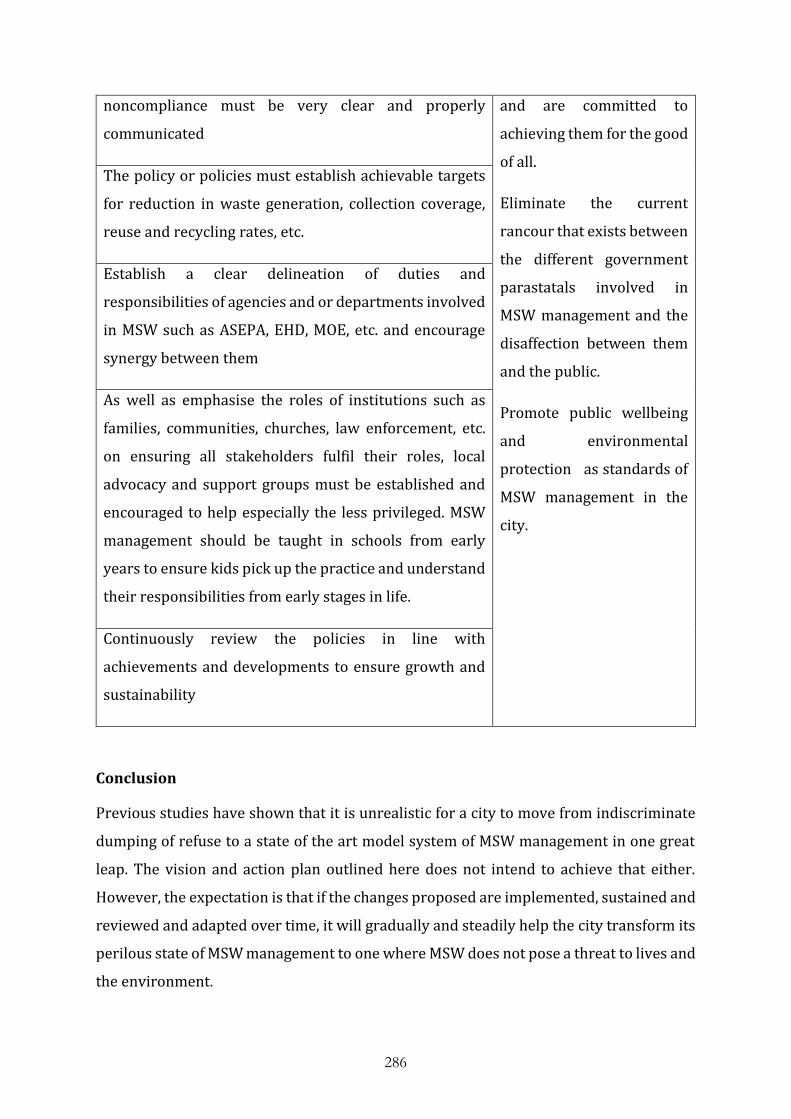
286
noncompliance must be very clear and properly
communicated
and are committed to
achieving them for the good
of all.
Eliminate the current
rancour that exists between
the different government
parastatals involved in
MSW management and the
disaffection between them
and the public.
Promote public wellbeing
and environmental
protection as standards of
MSW management in the
city.
The policy or policies must establish achievable targets
for reduction in waste generation, collection coverage,
reuse and recycling rates, etc.
Establish a clear delineation of duties and
responsibilities of agencies and or departments involved
in MSW such as ASEPA, EHD, MOE, etc. and encourage
synergy between them
As well as emphasise the roles of institutions such as
families, communities, churches, law enforcement, etc.
on ensuring all stakeholders fulfil their roles, local
advocacy and support groups must be established and
encouraged to help especially the less privileged. MSW
management should be taught in schools from early
years to ensure kids pick up the practice and understand
their responsibilities from early stages in life.
Continuously review the policies in line with
achievements and developments to ensure growth and
sustainability
Conclusion
Previous studies have shown that it is unrealistic for a city to move from indiscriminate
dumping of refuse to a state of the art model system of MSW management in one great
leap. The vision and action plan outlined here does not intend to achieve that either.
However, the expectation is that if the changes proposed are implemented, sustained and
reviewed and adapted over time, it will gradually and steadily help the city transform its
perilous state of MSW management to one where MSW does not pose a threat to lives and
the environment.

287
In practice, this can be implemented by developing a measurable and achievable short (1
to 5 years) and long (10 to 20 years) term goals and objectives. In the short term, the
goals and objectives could include staff recruitment and training, human resource
development, partitioning of city into waste zones, waste generation and collection rates,
collection of relevant social data and development of a management system of such data,
development of cooperatives and waste advocacies, public education and enlightenment,
policy developments, development of service standards, institutional developments, etc.
while in the long term, the goals and objectives could include rate of materials recovery
rates, compliance, climate change impacts and carbon footprint of MSW management
processes, economic contribution etc.
Clearly, the vision and action plan cannot guarantee the elimination of corruption from
the MSW management system or indeed the society. However, in section 4.1, the study
reported the importance and usefulness of a strong committed leadership. Consequently,
it is important to reemphasise the need for strong and committed leadership of the MSW
management agency; employment and use of adequately trained and well remunerated
workforce; policy and institutional structural changes e.g. reinstating the oversight
functions of a well-staffed MOE; and a clear delineation of duties between parastatals and
departments involved in MSW management; so as to reduce the negative impacts of
corruption.
The approach of the vision and action plan is the ISWM model. The proposal takes a
holistic view of MSW, recognising it as a system of interconnected parts. From waste
generation to final disposal, the entire system is influenced by factors such as human,
social, economic, technological, environmental, etc. collectively considered as
governance issues. Local approaches are an important feature and recommendation of
the ISWM framework and success stories such as those from Ghorahi, Nepal (Chapter 2)
have proven that local approaches do work. Thus the proposal is not an attempt to
mitigate a particular factor but rather a generic plan drawn mainly from stakeholder
suggestions, researcher observations and knowledge of the local systems. Table 5.8
below show the different possible solutions suggested by stakeholders.

288
APPENDICES
Appendix 1 - Four Quantitative Indicators for the Physical Components of a MSW
management system
Physical Componen
t
Indicator name and definition
Low Low/
Medium Medium
Medium
/High High
Public Health – Waste
Collection
Waste Collection Coverage:
% households who have access to a reliable waste
collection service
0-
49% 50-69% 70-89% 90-98%
99-
100%
Waste captured by the solid waste
management and recycling system: %
of waste generated that is collected and
delivered to an official facility
0-
49% 50-69% 70-89% 90-98%
99-
100%
Environmental control – disposal
Controlled treatment or
disposal: % of the total MSW destined
for treatment or disposal which goes to either a state-of-
the-art, engineered or ‘controlled’
treatment/disposal site
0-
49% 50-74% 75-84% 85-94%
95-
100%
Resource value – ‘3Rs’ –
Reduce, reuse,
recycle
Recycling rate: % of total MSW generated
that is recycled. Includes materials
recycling and organics valorisation
(composting, animal feed, anaerobic
digestion).
0-9% 10-24% 25-44% 45-64%
65%
and
over

289
Appendix 2 - Criteria for assessing the quality of waste collection and street
cleaning services
Criterion Description
Appearance of waste collection
points
Presence of accumulated waste around
collection points/containers
Effectiveness of street cleaning Presence of litter and of overflowing litter
bins
Effectiveness of collection in low
income districts
Presence of accumulated waste/illegal
dumps/open burning
Efficiency and effectiveness of
transport
Appropriate public health and environmental
controls of waste transport
Appropriateness of service planning
and monitoring
Appropriate service implementation,
management and supervision in place
Health and safety of collection
workers
Use of appropriate personal protection
equipment and supporting procedures
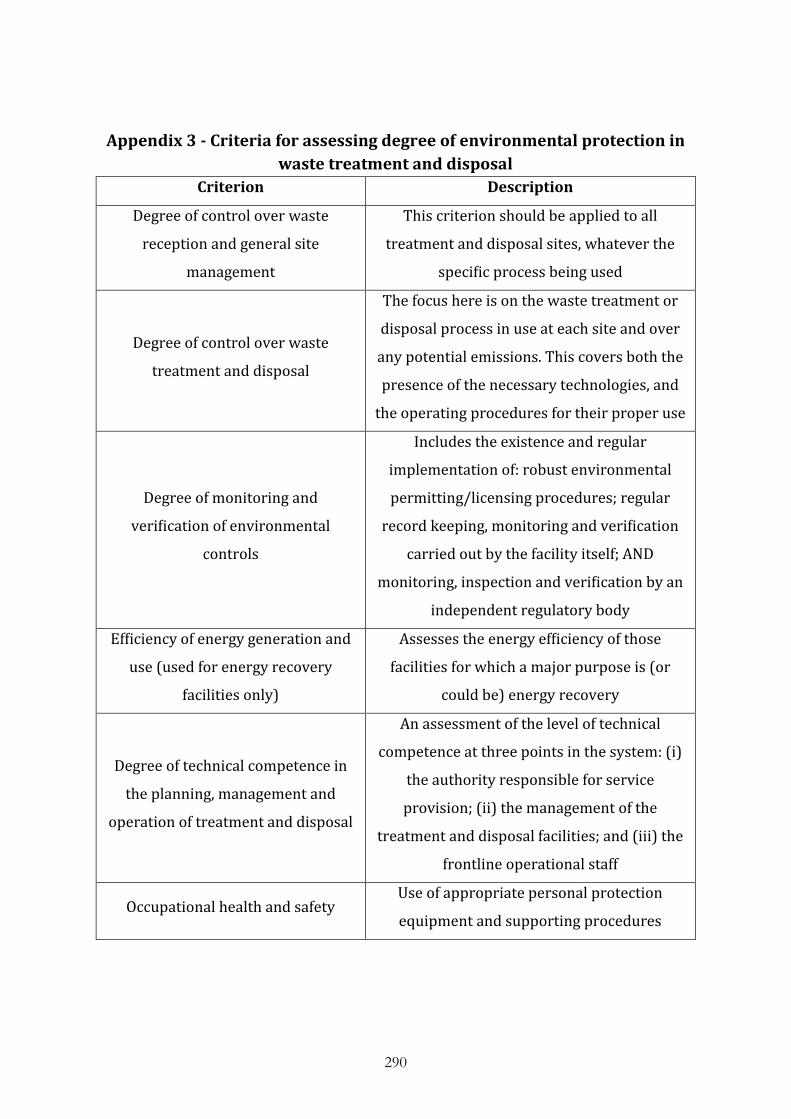
290
Appendix 3 - Criteria for assessing degree of environmental protection in
waste treatment and disposal
Criterion Description
Degree of control over waste
reception and general site
management
This criterion should be applied to all
treatment and disposal sites, whatever the
specific process being used
Degree of control over waste
treatment and disposal
The focus here is on the waste treatment or
disposal process in use at each site and over
any potential emissions. This covers both the
presence of the necessary technologies, and
the operating procedures for their proper use
Degree of monitoring and
verification of environmental
controls
Includes the existence and regular
implementation of: robust environmental
permitting/licensing procedures; regular
record keeping, monitoring and verification
carried out by the facility itself; AND
monitoring, inspection and verification by an
independent regulatory body
Efficiency of energy generation and
use (used for energy recovery
facilities only)
Assesses the energy efficiency of those
facilities for which a major purpose is (or
could be) energy recovery
Degree of technical competence in
the planning, management and
operation of treatment and disposal
An assessment of the level of technical
competence at three points in the system: (i)
the authority responsible for service
provision; (ii) the management of the
treatment and disposal facilities; and (iii) the
frontline operational staff
Occupational health and safety Use of appropriate personal protection
equipment and supporting procedures

291
Appendix 4 - Criteria for assessing the quality of provision of the 3Rs –
reduce, reuse and recycle
Criterion Description
Source separation of ‘dry
recyclables’
Assessed on the basis of the proportion of the total
quantity of materials collected for recycling that are
collected as clean, source separated materials The
focus here is on the relative % of clean, source-
separated materials that are recycled, as opposed to
materials that are sorted out from ‘mixed’ wastes –
where there will inevitably be much higher levels of
contamination.
Quality of recycled organic
materials
A qualitative assessment of the likely quality of the
recycled product (i.e. animal feed, compost, and the
organic product (digestate) from anaerobic
digestion) – assessment guidance based on both
separation at source and quality control
Focus on the top levels of the
waste hierarchy
An assessment of the degree of both policy and
practical focus on promoting reduction and reuse in
‘higher waste generating cities’; and on the ‘3Rs’ –
reduction, reuse, recycling – in ‘lower waste
generating cities’
Integration of community
and/or informal recycling
sector with the formal SWM
system
An assessment of how far and how successfully
efforts have been made to include the informal
recycling sector (in low and middle-income
countries) and the community reuse and recycling
sector (in higher income countries) into the formal
solid waste management system
Environmental protection in
recycling
Environmental impacts of the recycling chain, from
collection through to the separation and processing
of the separated materials.

292
Occupational health and safety Use of appropriate personal protection equipment
and supporting procedures
Appendix 5 - Criteria used to assess the degree of user inclusivity
Criterion Description
Equity of service provision
Extent to which all citizens (users and potential
users) irrespective of income level, receive a good
solid waste management (SWM) service- i.e. a service
which they can afford, which meets their expressed
needs, and which protects public health and
environmental quality
The right to be heard
Do authorities have a legal obligation to consult with
and involve citizens in decisions that directly affect
them?
Level of public involvement
Evidence of public involvement at appropriate stages
of the solid waste management decision-making,
planning and implementation process
Public feedback mechanisms Existence and use of public feedback mechanisms on
solid waste management services
Public education and
awareness
Implementation of comprehensive, culturally
appropriate public education, and/or awareness
raising programmes – focus here on the level of
activity
Effectiveness in achieving
behaviour change
Change in habits and behaviours of both the public
and businesses regarding their waste
management/handling practices – focus here on the
effectiveness of education and awareness
programmes

293
Appendix 6 - Criteria for assessing the degree of provider inclusivity
Criterion Description
Legal framework
Degree to which laws and/or other legal instruments are
in place and implemented at national or local level, which
enables both the public and private sectors to deliver solid
waste management services on a stable basis
Representation of the
private sector
Organisations or structures in place which represent the
private waste sector and actively participate within solid
waste management planning forums, task forces,
committees and/or steering-groups
Role of the ‘informal’
and community sector
Evidence of acknowledgement and recognition of the role
of the organised ‘informal’ and community sectors within
the formal solid waste management system
The balance of public vs.
private sector interests
in delivering services
Degree to which appropriate checks and balances are in
place locally, so that waste services are being delivered by
either the public or private sector, in a manner that is
mutually beneficial and does not substantially
disadvantage either party
Bid processes Degree of openness, transparency and accountability of
bid processes

294
Appendix 7 - Criteria used to assess the degree of financial sustainability
Criterion Description
Cost accounting
Extent to which the solid waste management accounts
reflect accurately the full costs of providing the service
and the relative costs of the different activities within
solid waste management; and whether the accounts
are open to public scrutiny
Coverage of the available
budget
Is the annual budget adequate to cover the full costs of
providing the service?
Local cost recovery – from
households
Percentage of the total number of households both
using and paying for primary waste collection services
The focus here is on the number of households, NOT
on the percentage of the total costs which they pay
Affordability of user charges Are practices or procedures in place to support
charges for those who can least afford to pay?
Pricing of disposal
Degree to which all the wastes coming to the final
(treatment or) disposal site(s) are charged at a rate
that covers (at least) the operating costs of (treatment
or) disposal
Access to capital for
investment
Has adequate provision been made for necessary
capital investments, both to extend collection
coverage to any un-served areas; to upgrade
standards of waste disposal; and to replace existing
vehicles, equipment and sites at the end of their life?
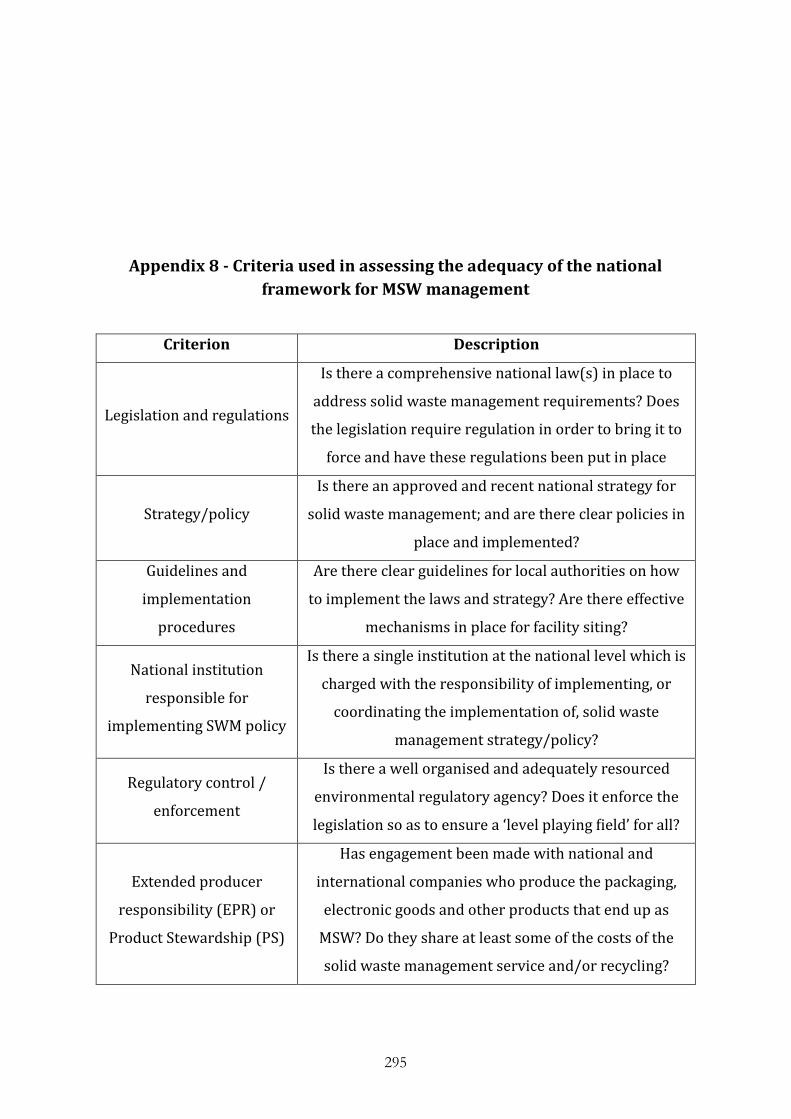
295
Appendix 8 - Criteria used in assessing the adequacy of the national
framework for MSW management
Criterion Description
Legislation and regulations
Is there a comprehensive national law(s) in place to
address solid waste management requirements? Does
the legislation require regulation in order to bring it to
force and have these regulations been put in place
Strategy/policy
Is there an approved and recent national strategy for
solid waste management; and are there clear policies in
place and implemented?
Guidelines and
implementation
procedures
Are there clear guidelines for local authorities on how
to implement the laws and strategy? Are there effective
mechanisms in place for facility siting?
National institution
responsible for
implementing SWM policy
Is there a single institution at the national level which is
charged with the responsibility of implementing, or
coordinating the implementation of, solid waste
management strategy/policy?
Regulatory control /
enforcement
Is there a well organised and adequately resourced
environmental regulatory agency? Does it enforce the
legislation so as to ensure a ‘level playing field’ for all?
Extended producer
responsibility (EPR) or
Product Stewardship (PS)
Has engagement been made with national and
international companies who produce the packaging,
electronic goods and other products that end up as
MSW? Do they share at least some of the costs of the
solid waste management service and/or recycling?

296
Appendix 9 - Criteria for assessing the degree of local institutional
coherence
Criterion Description
Organisational structure/
coherence
The degree to which all MSW management
responsibilities are concentrated into a single
organisation or department, that can be held
accountable for performance, or if multiple
organisations, the presence of a significant
concentration of responsibilities in one named
agency
Institutional capacity
An assessment of the organisational strength and
capacity of the department(s) responsible for solid
waste management
City-wide SWM strategy and
plan
Is there a recent strategy or plan in place and being
implemented at the city (or regional) level for solid
waste management?
Availability and quality of SWM
data
Is there a management information system (MIS)
in place? Are data regularly measured, collected
and monitored?
Management, control and
supervision of service delivery
A measure of the strength of control by the city, as
‘client’ for solid waste management, over the on-
the-ground delivery of solid waste management
services. The services may actually be delivered by
the private or public sector, or a combination of
the two.

297
Inter-municipal (or regional)
cooperation
Waste collection is often delivered at a local level,
while treatment and disposal may require
cooperation city-wide or at a regional level.
Regulatory control may be organised at regional or
national level. How well does such co-operation
work?
Appendix 10 – Pilot Questionnaire
Survey questionnaire for residents of Aba, Abia State, Nigeria.
Section A – Demographic Information
1. Name (Optional)…………………………………………………………………………………………….
2. Address………………………………………………………………………………………………………
3. Ward ……………
4. Telephone (optional) …………………………..
5. Email (optional) ……………………………..
6. Sex ☐Male ☐Female
7. Age ☐18-24 ☐25-45 ☐>45
8. Level of education ☐None ☐Primary ☐Secondary ☐Vocational/Trade ☐Tertiary
9. Occupation ☐Farming ☐Artisans ☐Trading ☐Civil Service ☐Other Professional ☐
Unemployed/student
10. Monthly Income ☐<N18,000 ☐N18000-N100,000 ☐>N100,000
11. Accommodation type ☐Native ☐Tenement(face-me-I-face-you) ☐Private compound ☐Flat
☐Shared compound
12. Household size ☐Single occupant ☐2-5 occupants ☐6-8 occupants ☐more than 8
occupants
13. Number of bedrooms ☐1 ☐2-4 ☐more than 4
14. Source of drinking water ☐private bore hole ☐Public bore hole ☐Sachet water ☐Bottled
water ☐Other (specify)………….
15. How do you pay for sanitation? ☐Do not pay ☐Per Compound ☐Per Household ☐Per
bedroom ☐Per person
Comments:
Section B – Drivers of MSW Management
1. Do you separate your waste? ☐Never heard of it ☐No ☐Sometimes ☐Always
2. Is there a standard waste collection service in your area? ☐No ☐Yes

298
3. How do you dispose your waste? ☐Indiscriminate dumping ☐Taken to dumpsite ☐Open
burning ☐Private contractor ☐Government collection ☐Private dumpsite
4. How would you prefer your waste to be collected? ☐Door-to-door ☐Community bring bank
☐Designated dumpsite ☐It doesn’t matter
5. How satisfied are you with your waste management service? ☐Very Unsatisfied ☐
Unsatisfied ☐Don’t know ☐Satisfied ☐Very satisfied
6. What type of container do you use to store your waste before disposing? ☐No bin ☐Open
container ☐Closed container ☐Standard bin
7. I will get a standard bin if: ☐It is free ☐ I see it to buy ☐Mandated to
8. What is the size of your waste container? ☐None ☐1-50Litre ☐>50Litre
9. How often do you empty the container ☐Daily ☐Twice a week ☐Weekly ☐Depends
(specify)………………..
10. How much do you know about the following waste management terms
Reduction ☐Never heard of it ☐Do not know what it means ☐Basic ☐Advanced
Re-use ☐Never heard of it ☐No idea ☐Basic knowledge ☐Advanced knowledge
Recycle ☐Never heard of it ☐No idea ☐Basic knowledge ☐Advanced knowledge
Composting ☐Never heard of it ☐No idea ☐Basic knowledge ☐Advanced knowledge
Anaerobic Digestion ☐Never heard of it ☐No idea ☐Basic knowledge ☐Advanced
knowledge
Mechanical Biological Treatment (MBT) ☐Never heard of it ☐No idea ☐Basic knowledge
☐Advanced knowledge
11. Which of the following do you currently practice? ☐Separation ☐Reduction ☐Recycling ☐
Composting
12. Which of the following will you like to practice? ☐Separation ☐Reduction ☐Recycling ☐
Composting
13. Is there a designated (waste) dumpsite near you ☐Yes ☐No ☐I don’t know
14. How is the dumpsite managed? ☐Unmanaged ☐I don’t know ☐Evacuated ☐Burned ☐
Other (specify)………
Comments:
Section C – MSW management Governance
1. Who makes waste management laws in your area? ☐I don’t know ☐No law ☐Government
☐Other (specify)……
2. Do you get asked for your opinion ☐Yes ☐No ☐I don’t care
3. Will you like to be consulted for your opinion on issues regarding waste management in
your area? ☐Yes ☐No ☐May be
4. If you have problems/concerns regarding waste, where do you report it? ☐I don’t know ☐I
just deal with it ☐Government dedicated officer ☐Other (specify)……………….
5. When was the last time you received any information regarding waste management ☐
Never ☐Can’t remember ☐Recently ☐Always

299
6. How did you receive the information ☐Leaflet ☐Town crier ☐Radio Television ☐Other
(specify)…………
7. How much do you pay for waste management? ☐Do not pay ☐Covered by sanitation fee ☐
<N100 Monthly ☐>N100 monthly
8. Will you pay more for an improved waste management service? ☐Yes ☐No ☐Depends
(specify)………………
Comments:
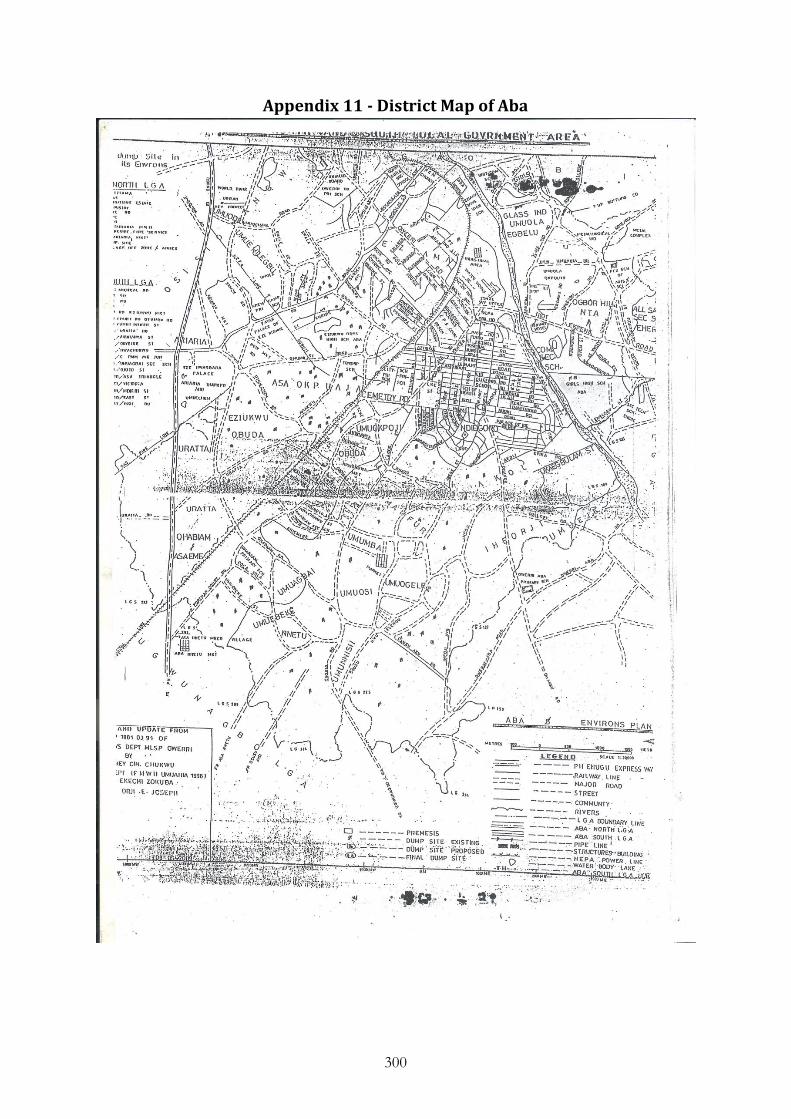
300
Appendix 11 - District Map of Aba

301
Appendix 12 - Information Sheet for Potential Participants My name is Stanley Nwankpa and I am a Postgraduate student from the School of Arts, Social Sciences and Management at Queen Margaret University in Edinburgh. As part of my PhD course, I am undertaking a research project for my Doctor of Philosophy thesis. The title of my project is: A post-normal science approach to understanding the real issues, challenges and contexts of municipal solid waste (MSW) management in developing countries – A case study of Aba-urban in Abia State, Nigeria.
This study will investigate the realities and challenges of waste management in Aba and articulate a vision and action plan towards an integrated sustainable waste management system in the city.
This research is self-funded.
I am looking for volunteers to participate in the project. There are no criteria (e.g. gender, age, or health) for being included or excluded – everyone is welcome to take part.
The researcher is not aware of any risks associated with this project. You will be free to withdraw from the study at any stage and you would not have to give a reason.
If you are interested in participating in the focus group discussions, details of the venue and time will be made available to you. Light refreshments will be provided and you will have the opportunity of exchanging ideas with other participants from various stakeholder groups.
All data will be anonymised as much as possible, but you may be identifiable from audio recordings of your voice or photos taken with your permission. Your name will be replaced with a participant number, and it will not be possible for you to be identified in any reporting of the data gathered.
The results may be published in a journal or presented at a conference. It may also be used by government in decision making regarding future waste management policies.
If you would like to contact an independent person, who knows about this project but is not involved in it, you are welcome to contact Prof Emeka Oguzie. His contact details are given below.
If you have read and understood this information sheet, any questions you had have been answered, and you would like to be a participant in the study, please now see the consent form.
Contact details of the researcher:
Name of researcher: Stanley Nwankpa
Address: PhD Research Student, Sociology
School of Arts, Social Sciences and Management
Queen Margaret University, Edinburgh
Queen Margaret University Drive
Musselburgh, East Lothian
EH21 6UU
Email / Telephone: [email protected] / 0131 474 0000
Contact details of the independent adviser
Name of adviser: Prof Emeka Oguzie
Address: Dean, School of Environmental Sciences
Federal University of Technology, Owerri
P.M.B 1526
Owerri, Imo State
Email / Telephone: [email protected] / 08037026581
302
Appendix 13 - Consent form for Participants
Consent Form
“A post-normal science approach to understanding the real issues, challenges and contexts of municipal solid waste (MSW) management in developing countries – A case study of Aba-urban in Abia State, Nigeria” I have read and understood the information sheet and this consent form. I have had an opportunity to ask questions about my participation. I understand that I am under no obligation to take part in this study. I understand that I have the right to withdraw from this study at any stage without giving any reason. I agree to participate in this study. Name of participant: _____________________________________ Signature of participant: _____________________________________ Signature of researcher: _____________________________________ Date: _________________ Contact details of the researcher Name of researcher: Stanley Nwankpa Address: PhD Research Student, Sociology School of Arts, Social Sciences and Management Queen Margaret University, Edinburgh Queen Margaret University Drive Musselburgh East Lothian EH21 6UU Email / Telephone: [email protected] / 0131 474 0000

303
Appendix 14 - An example Transcription of a Short Interview
(Pseudonymised)
(LEPI 2)
FORMAL DISCLOSURE
Researcher: In your own words sir, what is your perception of waste management in Aba?
Interviewee: The fact is that the town planning authority is not in any way involved with
municipal solid waste management in Aba.
All information should be gotten from ASEPA.
(The interviewee declined speaking on the matter and asked the researcher to leave)
CLOSING REMARKS

304
Appendix 15 - An example Transcription of Average Length Interview
(Pseudonymised)
(GePH 9)
FORMAL DISCLOSURE
Interviewee: In the western world, experts are appointed irrespective of political opinion.
That’s the first step to succeeding.
Researcher: How long have you lived in Milverton, Aba?
Interviewee: More than 20 years
Researcher: In that time how has waste management changed? Has it gotten better or
gotten worse?
Interviewee: It has gotten much worse. There was a time Milverton was being swept by
road cleaners. Now from year to year, nothing. 5 years, nothing.
Researcher: Are there any obvious reasons why it is like that?
Interviewee: It is like that because this present democracy that is almost 20 years has no
program, no positive and practical program. They may claim to have ASEPA and what
have you, but they are all empty claims that can be likened to building a house without
foundation.
Researcher: As residents here, do you pay sanitation fee?
Interviewee: We pay many things, many fees including sanitation
Researcher: How much do you pay?
Interviewee: there was a time it was about #120 every month but now we are not even
sure because even after paying it they will still come again. There is multiple extortionate
levies and there are no services rendered.
Researcher: You just went ahead of me there – you said no services rendered
Interviewee: Yes, no services rendered. They just use law enforcement agencies like
police, bakkasi, army, etc to intimidate you.

305
Researcher: In terms of waste management, what do you understand as a person as your
responsibility? What do you think you should be doing to manage your waste?
Interviewee: We should be hygiene conscious. We should not be littering waste here and
there. The truth though is that the government has no program. For instance, during
Mbakwe (governor between 79/83?), there was a program called “Keep Imo beautiful a
beautiful society” which was positively pursued. This road and other roads alike were
been swept regularly. (Explains with a scenario how the poor leadership of government
ensures the people care less too). The government is only after money, they don’t care.
Other states are doing much better in terms of waste management.
Researcher: Do you think that with some evidence of service from the agency and with
some manpower to enforce cleanliness and adequate sanitation, the situation will
change?
Interviewee: Yes, it will change. If there is sincerity of purpose but the government has
not started. They are only claiming. In reality, there is no program on ground.
Government intentions must be genuine. For e.g. during the Buhari/Idiagbon regime,
they had the WAIC (War Against Indiscipline & Corruption) program which they pursued
religiously. People were even scared of throwing rubbish anyhow because they knew
they’ll be brought to book.
Researcher: You mentioned hygiene. I take it that you have knowledge about the
implications of indiscriminate dumping of refuse. Obviously, we can perceive the odour
nuisance. Are you aware of other related health hazards?
Interviewee: I’m not a medical doctor but I know that the susceptibility to sickness we
have now is not the same as before when we were children, when everywhere was very
clean. I know when EHOs (Environmental Health Officers) were going around fumigating
our surroundings. People were rarely sick then. Now sickness and death are so common.
These are related to the air we breathe and the environment we live in.
(Researcher provides information about the different drivers of waste management,
health implications of poor waste management).
Researcher: In this area, do people burn their waste openly?

306
Interviewee: Yes, they burn it every day. People burn toilet wastes, waterproofs, etc and
for me it causes me instant catarrh which will linger for a very long time.
(Researcher provides further information on health implications of open waste burning)
Interviewee: I believe what you’re saying because the rate at which people get sick, even
the rate of cancer as if it is rainfall. Our dirty environment is causing a lot more than we
realise.
Researcher: I believe that you’ve shown a good level of understanding and thus will
benefit from having the necessary facilities for a better waste management. Do you think
others or majority of the people here have the same information or will benefit from
having such?
Interviewee: They don’t. People are ignorant of the health implications and hazards. We
need some enlightenment by the experts, but nothing is being done. It will help greatly.
Researcher: So going forward, what would you like to see?
Interviewee: We need the facilities as we had during Mbakwe’s time. Dust bins placed at
strategic locations so people can use instead of throwing things indiscriminately.
Enforcement is important too. People don’t care these days because no one is there to
enforce anything
Like the bible says, we need the renewal of our minds. Everybody should repent. Starting
from the government, they should have some real programs that should be pursued
vigorously. Desist from appointing political cronies and use experts to do the job.
CLOSING REMARKS
Appendix 16 - An example Transcription of a Long Interview
(Pseudonymised)
(TGGO 2)
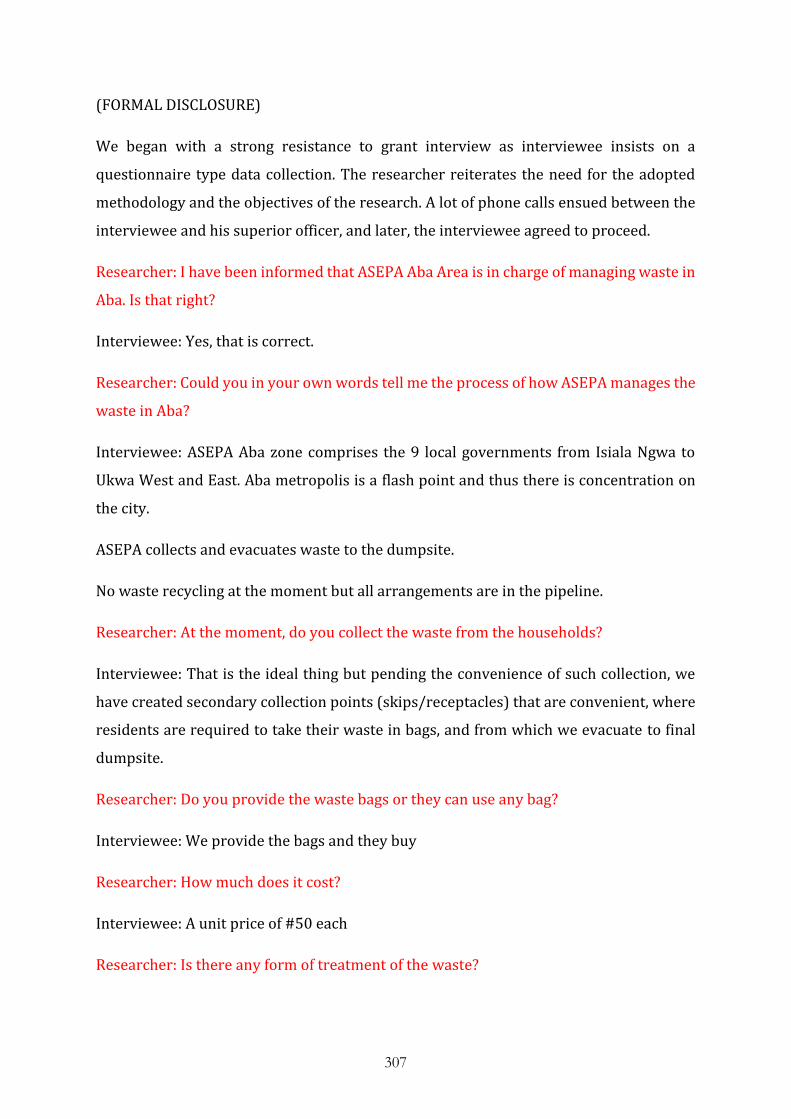
307
(FORMAL DISCLOSURE)
We began with a strong resistance to grant interview as interviewee insists on a
questionnaire type data collection. The researcher reiterates the need for the adopted
methodology and the objectives of the research. A lot of phone calls ensued between the
interviewee and his superior officer, and later, the interviewee agreed to proceed.
Researcher: I have been informed that ASEPA Aba Area is in charge of managing waste in
Aba. Is that right?
Interviewee: Yes, that is correct.
Researcher: Could you in your own words tell me the process of how ASEPA manages the
waste in Aba?
Interviewee: ASEPA Aba zone comprises the 9 local governments from Isiala Ngwa to
Ukwa West and East. Aba metropolis is a flash point and thus there is concentration on
the city.
ASEPA collects and evacuates waste to the dumpsite.
No waste recycling at the moment but all arrangements are in the pipeline.
Researcher: At the moment, do you collect the waste from the households?
Interviewee: That is the ideal thing but pending the convenience of such collection, we
have created secondary collection points (skips/receptacles) that are convenient, where
residents are required to take their waste in bags, and from which we evacuate to final
dumpsite.
Researcher: Do you provide the waste bags or they can use any bag?
Interviewee: We provide the bags and they buy
Researcher: How much does it cost?
Interviewee: A unit price of #50 each
Researcher: Is there any form of treatment of the waste?

308
Interviewee: We seldom fumigate the secondary and final dumpsites. No other form of
treatment.
(Researcher provides information on methods of waste preparation such as sorting,
compaction and baling and treatment such as incineration, composting, digestion, etc.
etc.)
Researcher: Do you do any of that?
Interviewee: No but all arrangements have been concluded to have waste sorted at the
point of generation.
Researcher: When is that to start sir?
Interviewee: Well, any moment government is ready.
Researcher: So there will be facilities provided to support that because the current
system cannot support that?
Interviewee: Yes, we’ll provide different colours of bags - for degradable, non-degradable,
metals, etc. etc.
Researcher: I suppose there will be an educational campaign to enlighten the people and
highlight the benefits of such practice?
Interviewee: As I speak, the sensitisation and education is ongoing via our education
department.
Researcher: Okay. In terms of the waste itself, how much waste is generated in Aba say
daily, monthly or annually?
Interviewee: I am very sure Aba generates well over a thousand metric tonnes of waste
daily.
Researcher: 1000 metric tonnes (1 million kg) a day? Is there a method used to reach this
data?
Interviewee: Each of our buckets (the secondary collection point) is 30 tonnes and we
evacuate 30 to 35 buckets daily

309
(Researcher expresses reluctance to accept this method of averaging as a reliable form of
data as papers and polythene bags will not weigh the same as organic materials)
Researcher: Out of this, what quantity will you say is the percentage composition of the
biodegradable by weight?
Interviewee: 60 – 70%
Researcher: That is within the widely reported composition of organic matter in MSW in
developing countries. As an agency, have you undertaken any waste audit, study or report
to find out the variations with season or population? It is important to keep track
Interviewee: We have not carried out any such study. There is no official data for daily
collection either, at the moment.
Researcher: I understand there are 3 ASEPA zones – Aba & environs, Umuahia & environs,
and Abia North. Is that right?
Interviewee: No. There are only 2 zones – Aba & environs and Umuahia & environs.
[A few days after this interview, the state government created a new zone out of the Aba
& environs called Osisioma & environs with a new director in-charge].
Researcher: Who do the 2 zones report to?
Interviewee: Directly to the governor by law.
Researcher: In essence, the office of the governor is responsible for managing waste in
the state
Interviewee: That is what it means
Researcher: In ASEPA Aba zone. The DGM is in charge. Who are the other key officers that
help him run the agency? What is the structure like?
Interviewee: We have the chief of staff, the HOD Admin and the Director of Finance (3 key
officers directly under the DGM). Then we have other unit heads such as the Director of
Operations and HOD Education.

310
Researcher: When it comes to designing the system, who does what? Does the DGN decide
how he wants the system to run or is it all of these heads coming together?
Interviewee: There should be a management meeting that comprises the DGM and all
these heads I already mentioned.
Researcher: Do you need clarification from the governor before proceeding?
Interviewee: No, there is a board between the agency and the governor.
Researcher: Ok, the ASEP (Abia State Environmental Protection) Board? Do ASEPA need
clarification from that board?
Interviewee: Ones the programs are sorted out with the board, the board reports back to
the governor. The board meets periodically. It is when we need funds that the DGM
reports straight to the governor for approval.
Researcher: Okay. Now that you have mentioned funds, what is the budget like? I know it
must cost a lot of money
Interviewee: I may not be competent to speak on that
Researcher: Ok. When these decisions are taken, are the other stakeholders consulted for
inputs towards may be developing the process or the running of it?
Interviewee: Naturally, it is difficult to consult the waste generators. You take decisions,
design the system and communicate the decisions to them. It is the business of the agency
to design waste management strategy and tell them the strategy so designed.
If any of them has anything to add, they can come forward with such.
Researcher: A little question before we talk more on that. Do you sometimes get dissident
behaviours or people resisting the process?
Interviewee: It is frequent particularly in our society here. A typical Aba man is dissident
in nature.
(Researcher reiterates the reasons for adopting the chosen approach which includes
sharing relevant information and results from various other previous researches)

311
(The interviewee found it laughable when it was explained to him that all stakeholders
should be consulted in designing and running a waste management system)
Researcher: Does your field staff receive some training?
Interviewee: Yes. We have different cadre and categories of training and they all receive
proper trainings.
Researcher: What kinds of training? Internal or external?
Interviewee: They only receive on-the-job- training. The agency has not engaged any
professional trainers.
Researcher: I think I missed one little thing. In terms of the buckets, how many receptacle
points are there in the city and how are they worked out as per where they should be?
Interviewee: We drop the buckets at ‘vulnerable’ places i.e. where experience has shown
that waste generation is high. I am not competent to say how many points there are in
total. The director of operations can provide that information.
Researcher: You mentioned the education department. In a nutshell what are their roles?
Interviewee: They educate and sensitise the public on the need to manage their waste
properly, on the need to have a clean environment and the ways of doing so.
Last year, they embarked on school programs to educate school kids and to catch them
young. They also did the same in markets, to reach the traders and to teach them also.
Researcher: The entire system is all about bringing your waste and we will take it away
to the dump. What does the education programs teach?
Interviewee: They tell people how to use their bags and to take their rubbish bags to the
designated points during the approved times.
Researcher: Okay. So it’s not about the waste hierarchy, the need to minimise, reuse,
recycle, energy recovery and those kinds of stuff?
Interviewee: No. we have not gotten to that but we are aware that such things are in
existence
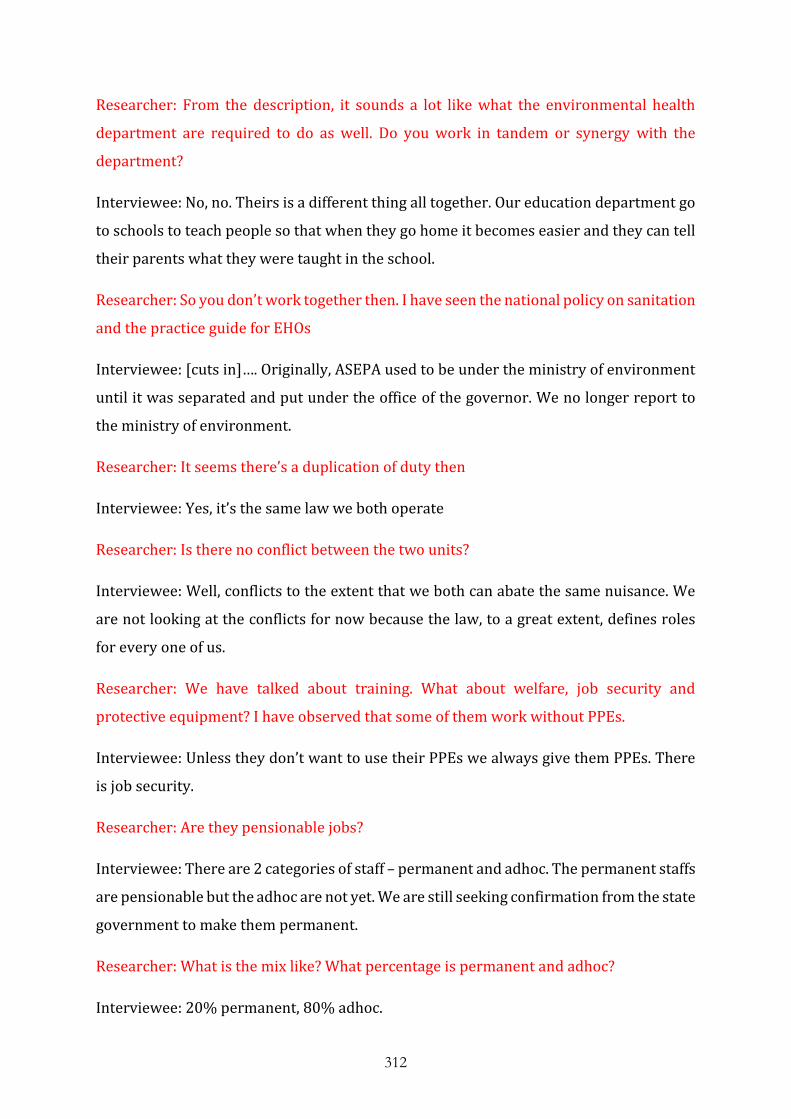
312
Researcher: From the description, it sounds a lot like what the environmental health
department are required to do as well. Do you work in tandem or synergy with the
department?
Interviewee: No, no. Theirs is a different thing all together. Our education department go
to schools to teach people so that when they go home it becomes easier and they can tell
their parents what they were taught in the school.
Researcher: So you don’t work together then. I have seen the national policy on sanitation
and the practice guide for EHOs
Interviewee: [cuts in]…. Originally, ASEPA used to be under the ministry of environment
until it was separated and put under the office of the governor. We no longer report to
the ministry of environment.
Researcher: It seems there’s a duplication of duty then
Interviewee: Yes, it’s the same law we both operate
Researcher: Is there no conflict between the two units?
Interviewee: Well, conflicts to the extent that we both can abate the same nuisance. We
are not looking at the conflicts for now because the law, to a great extent, defines roles
for every one of us.
Researcher: We have talked about training. What about welfare, job security and
protective equipment? I have observed that some of them work without PPEs.
Interviewee: Unless they don’t want to use their PPEs we always give them PPEs. There
is job security.
Researcher: Are they pensionable jobs?
Interviewee: There are 2 categories of staff – permanent and adhoc. The permanent staffs
are pensionable but the adhoc are not yet. We are still seeking confirmation from the state
government to make them permanent.
Researcher: What is the mix like? What percentage is permanent and adhoc?
Interviewee: 20% permanent, 80% adhoc.
313
Researcher: Do you get the same mix of staff categories across board or are adhoc staff
mainly junior cadre staffs?
Interviewee: No, all levels.
Researcher: I guess they don’t earn the same
Interviewee: They may not earn the same, they may earn the same.
Researcher: Does the adhoc staff you mentioned include the road sweepers?
Interviewee: Yes.
Researcher: Is there a contract stipulating the length of employment the adhoc staff?
Interviewee: They have appointment letters that details that.
Researcher: You mentioned so many things are in the pipeline. What will you say is the
biggest challenge for the agency?
Interviewee: The biggest challenge is that of funding. We hardly have enough equipment
to carry out the job effectively.
Researcher: What do mean by equipment? Is it manpower or buckets, trucks?
Interviewee: All of that and compactors, bulldozers, pay loaders. We make use of all these.
Researcher: If residents bring their waste to the designated points (buckets), what do you
need bulldozers and compactors for?
Interviewee: You may not appreciate all that is involved. If the waste is bagged, it is easier
to throw it straight into the compactor for compaction and onward disposal at the
dumpsite. Also, you will notice that people dump refuse indiscriminately in the city, the
compactor will go round and mop it up.
Researcher: Is it because the skip is far from the people or they don’t have the right
orientation?
Interviewee: They may have the right orientation but the indiscipline in them or laziness
will make them not appreciate the short trek to the skip.

314
Researcher: I appreciate what you are saying and I agree there are dissident behaviours
everywhere. But let me give you an instance, there is only one bucket at Union Bank
junction serving the whole of that area up to Umuchichi and Okpu Umuobo. Is that not
too large an area for one bucket to serve?
Interviewee: I appreciate it is. There are plans to roll out more buckets
Researcher: Okay. Has the agency considered running a street collection service? There
is positive feedback that when that was in operation, it worked better.
Interviewee: It is also in the pipeline. Arrangements have been concluded; we will soon
remove the buckets and run a street service.
*** [This response is not in agreement with the earlier statement about rolling out more
buckets] ***
Researcher: Moving forward, what is the goal of the agency? What does the agency hope
to achieve in the next 12 – 18 months?
Interviewee: What else except to give the city a good waste management service. Until
we can recycle waste, we have not arrived yet.
Researcher: So the ultimate goal is to start recycling waste?
Interviewee: Yes, granted that waste collection and evacuation processes have been
perfected. We are looking at the proposals for recycling.
(Researcher provides information on the waste hierarchy. Recycling is down there in the
middle on the waste hierarchy. There is waste minimisation and reuse above it and with
less perceived environmental impact. I’d love to see more emphasis on waste
avoidance/minimisation and reuse)
Researcher: How do you think the recycling will work?
Interviewee: The recycling plant will be established very close to the dumpsite, it is
simple. There will be workers there who will sort and the items for recycling will be taken
to the factory for recycling and the perishable materials used for organic fertilizer
manufacturing.
315
Researcher: I think there is a misconception. I do not know of any recycling plant that
recycles everything, you can either recycle plastics, glass, metals, etc.
Interviewee: That is the essence of the sorting.
Researcher: That sorting cannot happen from the dump because comingled waste will be
contaminated. You cannot recycle paper that has been contaminated with grease for
instance. The sorting has to happen at the point of generation
Interviewee: Yes but where it cannot be sorted there, the plan is to sort it at the dump
(We have a lengthy discussion over this issue and I explained that a recycling company
cannot mine waste from the dumpsite. I also explained that recycling is always subsidised
but for obvious reasons. I highlighted the benefits – divert waste from landfill, job
creation, resource management, etc. etc.)
Researcher: Does the agency use contractors for some of their jobs?
Interviewee: Yes, why not
Researcher: Any chance I could reach some of these contactors?
Interviewee: depending on the categories of contractors
Researcher: What categories of contractors are there?
Interviewee: We have house to house contractors who collect revenue and supervise
house to house collection of waste
Researcher: But you said there are plans to begin street services and the like
Interviewee It is, but the use of contractors to use the street service will soon take off.
Researcher: So how does this house to house collection work?
Interviewee: They use tippers and the residents throw their waste in as the tipper goes
through the streets.
Researcher: So they are private contractors?

316
Interviewee: No, government does not want us to call them contractors so we call them
adhoc staff.
Researcher: So In essence there are no contractors?
Interviewee Well, yes. There are 27 zones with each person manning a zone. We have
contractors as dump managers for our 2 functional dumpsites. There are others we hire
equipment from.
Researcher: Do you hire only equipment or equipment and staff that operate it?
Interviewee: Their staffs operate the equipment.
Researcher: Are the revenue collections outsourced or they collect it in-house for the
agency?
Interviewee: It’s either way. We can agree a lump sum for the revenue collectors and they
go to the field to recoup or we can agree for the revenue collector to go to the field and
collect levies and remit to the agency.
Researcher: So who monitors the process?
Interviewee The agency does that.
Researcher: How does the agency know or is assured that all monies collected have been
remitted?
Interviewee: It’s difficult but we check the teller they use for payment
Researcher: What is the shortfall like when you compare what is collected by the various
revenue collectors and remitted to the agency and what it costs the agency to carry out
their duties?
Interviewee: It is very huge. The margin is huge because most people tend to dodge the
payment.
Researcher: So many people I have interviewed have this mentality that they pay ASEPA
but no service is provided. How do you convince these people that the agency is actually
working?
317
Interviewee: That is their mentality. They take the waste to the secondary points and they
don’t see it anymore. It should be common sense to know that the agency is servicing
those secondary points.
Researcher: But when you walk round the city, so many streets and gutters are filled with
refuse and there is unbearable odour nuisance in some of these places. For people living
in these places, nothing is being done and they don’t see why they should pay. How do
you convince such people that the agency is working?
Interviewee: Nothing really except by sensitising them. Let me tell you, even if you go
house to house and evacuate waste from residents, the typical Aba man will refuse to pay
except quite a few that will volunteer to pay.
Researcher: One last question sir. From the feedback received, over 90% of those
interviewed say they are willing to pay a higher fee for a better service.
Interviewee: I agree with that
Researcher: Is that a challenge to the agency to provide a better service?
Interviewee: I won’t call it a challenge because the agency is well position to provide
efficient services to these people.
Researcher: But that has not happened yet
Interviewee: How else? We are doing a great job. We are providing the services; only that
you might say we do not cover all the nooks and crannies of the city
Researcher: So that’s a problem
Interviewee: It is but not a major problem
Researcher: It is
Interviewee: How is it?
Researcher: I’ve been to several other cities around here – PH, Uyo, Owerri, Calabar and
IK. And if you compare Aba to these places, the difference is clear in terms of cleanliness.
Interviewee: If you know what Aba used to be, you will not be saying that.

318
Researcher: Actually, most people I have spoken to say it was better when the present
governor was the DGM of ASEPA
Interviewee: I don’t believe that. I served in this same position under then DGM who is
now the governor, we have improved on his achievements.
Researcher: One last word from you sir? What is the message to the service users?
Interviewee: They should corporate with us – bag their wastes properly, dispose their
waste within the stipulated times (5pm to 9pm) and pay their statutory sanitation fees
and by so doing, the agency will be encouraged to continue to provide service to them.
CLOSING REMARKS
Appendix 17 - Observation Note
Location – ASEPA Operations (From Ministry of Works through Eziukwu Rd to Asa Rd by
Jubilee)
Date: 6th November, 2017
Time: 10:05am; finished 1:15pm

319
On this occasion, the researcher went out with the ASEPA operations staff to observe
their day-to-day operations.
The following was observed:
Staff loitering and awaiting their allocation to teams/trucks to proceed to
secondary receptacles for carting away of the skips (this went on from about 10:05
am to around 11am)
The entire vicinity of the Ministry of Works complex was dirty and unkempt. There
was clear evidence of environmental damage, stagnant discoloured waters and
general neglect
The trucks looked dirty, worn out and the odour emanating from them was
unbearable
None of the staff wore full range of basic PPE (safety boots, overall, hand gloves
and nose masks). Just 2 had rain boots (as safety boots), only one staff member
had hand gloves, 4 others had no PPE at all.
During carting away of refuse at Asa by Jubilee:
There was no signage to warn motorists and passers-by that work was going on
The refuse truck, skips and ASEPA staff were effectively blocking one lane each
side of the road thus causing huge traffic jam and nuisance
Clear evidence of noise, odour and particulate matter nuisance
All 3 skips at the receptacle point was overflowing with huge heap of refuse dump
along the road demarcation
Staff were using (previously used and unwashed or disinfected) baskets and
shovels to scoop and empty refuse into the standby truck
As the truck was on standby, thick black smoke covered the area, further
contributing to poor visibility and air pollution
On interacting with a supervisor, he informed that PPEs were provided once in a
while but some of the staff countered that they have never been given any since
they joined
Once the truck was full, the driver departed with one other worker while the
remaining group of staff and the supervisor sat beside the road waiting for their
return from the waste dumpsite

320
Some of the waiting staff were seen throwing empty water sachets they had just
finished drinking from indiscriminately on to the street
When the researcher approached them and reminded them on the need to lead by
showing good example, they countered that the area and city was already dirty
Once the truck returned, the process of scooping into the basket and emptying into
the truck was repeated until the evacuation was complete
The researcher suggested to the officer in-charge (who had now arrived at the
location to check on the progress of work and the researcher’s observations) that
the team could be better off doing the job of carting refuse at night as it will cause
less traffic hazard and less general disturbance to the people. He informed the
researcher that they were doing that before and that it worked better but because
they do not have sufficient trucks, it was more difficult to accomplish tasks
It was now 1:15pm and the researcher retired from the location
Appendix 18 - Observation Note
Location – Secondary Receptacle at Union Bank Junction (Aba Owerri Road, Aba)
Date: 7th November, 2017
Time: 5:45pm; finished 9:05pm
The following was observed:

321
At all times of the observation, a man (I had been informed during interviews that
there was always a bucket minder at the receptacle during the designated times
for waste disposal) was standing beside the waste skip
15 adults (ages ranging from 18 to 50, 12 female and 3 male) came with their
waste in a bucket and emptied it into the ASEPA skip, and left with the buckets
A lady came with her waste in a bag and emptied the bag into the skip and left with
the bag
Someone came with a bag full of waste and threw the bag into the skip and left
Some children (numbering about 7) came with their waste in buckets and made
their way onto the waste skip to empty their buckets. They left with the buckets
Another group of kids (numbering about 8 – 10), they climbed onto the skip to
empty their waste and were ordered by the bucket minder to jump and mash on
the waste, presumably to compress it.
A man carrying a wheelbarrow full of waste bags came and gradually emptied his
bags into the waste skip. Afterwards, he went over the bucket minder and gave
him some money and left.
Someone drove by and flung his waste bag in the direction of the waste skip and
sped off
A man came with his bag full of waste and flung it on the ground. The bucket
minder went over and cautioned him and then swept the waste that had fallen on
the ground around the skip together and packed same onto the skip
A man came with a wheelbarrow full of waste bags. After emptying same into the
skip, he brought out his broom and swept around the skip and packed the dirt onto
the skip. He then went over to the bucket minder, paid him some money and left.
A lady drove to the skip with her waste bags in the car boot. She emptied them
onto the skip and left
The waste skip was now full and the refuse was falling on the ground
uncontrollably
Suddenly the entire place was deserted
The time now was 9:05 pm and the researcher retired
Appendix 19 - Observation Note
Location – Near Umungasi Market
Date: 2nd November, 2017
Time: 9am; finished 10.25pm
The following was observed: The focus was on the activities of a vegetable street vendor

322
Trader had her stock in a basket on a bicycle
Buyers separated the leaves from the vegetable stem and dropped the stems on
the street
There were several openings on the drains that posed great risk as people could
easily fall inside the gutter through them
Suddenly a task force appears to confiscate the trader’s goods. The trader and the
buyers ran away
A member of the task force was heard yelling instructions at the trader to stay
inside the market and not on the street
The trader soon returned to gather the refuse from her earlier activities together
but she did not pack the refuse away. The refuse remained on the street
The trader finished selling her vegetables and left without evacuating the refuse
she had earlier gathered together
Across the street:
A road sweeper was causing so much discomfort to passers-by as her sweeping
was generating plenty of dust
There were potholes on the side of the road she was sweeping
The sweeper was sweeping the sand into the potholes together with the debris
Some passers-by could be heard shouting abuses on the sweeper and almost
everyone had their hand across their nostrils.
Appendix 20 - Ethical Approval form
For Office Use Only Ref. Number Assigned Reviewers
Recommendation Outcome

323
APPLICATION FOR ETHICAL APPROVAL FOR A RESEARCH PROJECT 2011/12
This is an application form for ethical approval to undertake a piece of research. Ethical approval must be gained for any piece of research to be undertaken by any student or member of staff of QMU. Approval must also be gained by any external researcher who wishes to use Queen Margaret students or staff as participants in their research. Please note, before any requests for volunteers can be distributed, through the moderator service, or externally, this form MUST be submitted (completed, with signatures) to the Secretary to the Research Ethics Panel. You should read QMU’s chapter on “Research Ethics: Regulations, Procedures, and Guidelines” before completing the form. This is available at:
http://www.qmu.ac.uk/quality/rs/default.htm Hard copies are available from the Secretary to the Research Ethics Panel. The person who completes this form (the applicant) will normally be the Principal Investigator (in the case of staff research) or the student (in the case of student research). In other cases of collaborative research, e.g. an undergraduate group project, one member should be given responsibility for applying for ethical approval. For class exercises involving research, the module coordinator should complete the application and secure approval. The completed form should be typed rather than handwritten. Electronic signatures should be used and the form should be submitted electronically wherever possible.
Applicant details 1. Researcher’s name: Stanley Nwankpa 2. Researcher’s contact email address: [email protected] 3. Category of researcher (please tick and enter title of programme of study as
appropriate):
QMU undergraduate student Title of programme: QMU postgraduate student – taught degree Title of programme: QMU postgraduate student – research degree

324
4. School: Arts, Social Science and Management 5. Subject Area: Sociology (Sustainability – Waste Management) 6. Name of Supervisor or Director of Studies (if applicable): Dr Eurig Scandrett 7. Names and affiliations of all other researcher who will be working on the project: Dr
Claire Seaman, Dr Karina Kielmann Research details 8. Title of study: A complex adaptive system approach in search of a local integrated
sustainable system that works – A case study of municipal solid waste (MSW) management in Aba, Nigeria.
9. Expected start date: July 2015 10. Expected end date: June 2016 11. Details of any financial support for the project from outside QMU: Self-funded 12. Please detail the aims and objectives of this study (max. 400 words)
Methodology 13. Research procedures to be used: please tick all that apply.
Tick if applicable
Questionnaires (please attach copies of all questionnaires to be used)
Interviews (please attach summary of topics to be explored)
x
QMU staff member – research degree x QMU staff member – other research Other (please specify)
The main aim of this research is to articulate a vision and action plan towards integrated sustainable waste
management in the city of Aba, Abia State, Nigeria. To achieve this, the study will adopt a complex adaptive
system approach (AMESH methodology) and will focus on 3 key objectives: To analyse the current realities and
challenges of waste collection, disposal and treatment in Aba; To evaluate the history and contexts of waste
management from the perspectives of the different stakeholders in the city; and To identify potential areas of
conflict between stakeholders’.

325
Focus groups (please attach summary of topics to be explored / copies of materials to be used)
x
Experimental / Laboratory techniques (please include full details under question 14)
Use of email / internet as a means of data collection (please include full details under question 14)
Use of questionnaires / other materials that are subject to copyright (please include full details under question 14 and confirm that the materials have been / will be purchased for your use)
Use of biomedical procedures to obtain blood or tissue samples (please include full details under question 14 and include subject area risk assessment forms, where appropriate)
Other technique / procedure (please include full details under question 14)
14. Briefly outline the nature of the research and the methods and procedures to be
used (max. 400 words).
15. Does your research include the use of people as participants? Please delete as
appropriate. Yes 16. Does your research include the experimental use of live animals? Please delete as
appropriate. No 17. Does your research involve experimenting on plant or animal matter, or inorganic
matter? Please delete as appropriate. No
This research is post-normal science in nature i.e. involves the inclusion of a wide range of stakeholders in the research process and
recognises the value of history. Therefore, a wholly qualitative approach has been adopted to ensure the perspectives of these stakeholders
are adequately captured and represented in the research process. Though the qualitative methodologies are more time consuming and
expensive, the use of unstructured interviews, informal chats and researcher observations ensures that participants are at liberty to
express their views and tell their stories which in turn enhances the quality and variety of the data collected. These data will be collated
and analysed to create qualitative narratives of the current situations and how the current situation came to be. Issues and influences
analyses of the needs, activities and concerns of the stakeholders will be used to identify possible conflict areas between stakeholders.
Trade-offs will be debated in focus groups with representatives from the different stakeholder groups.
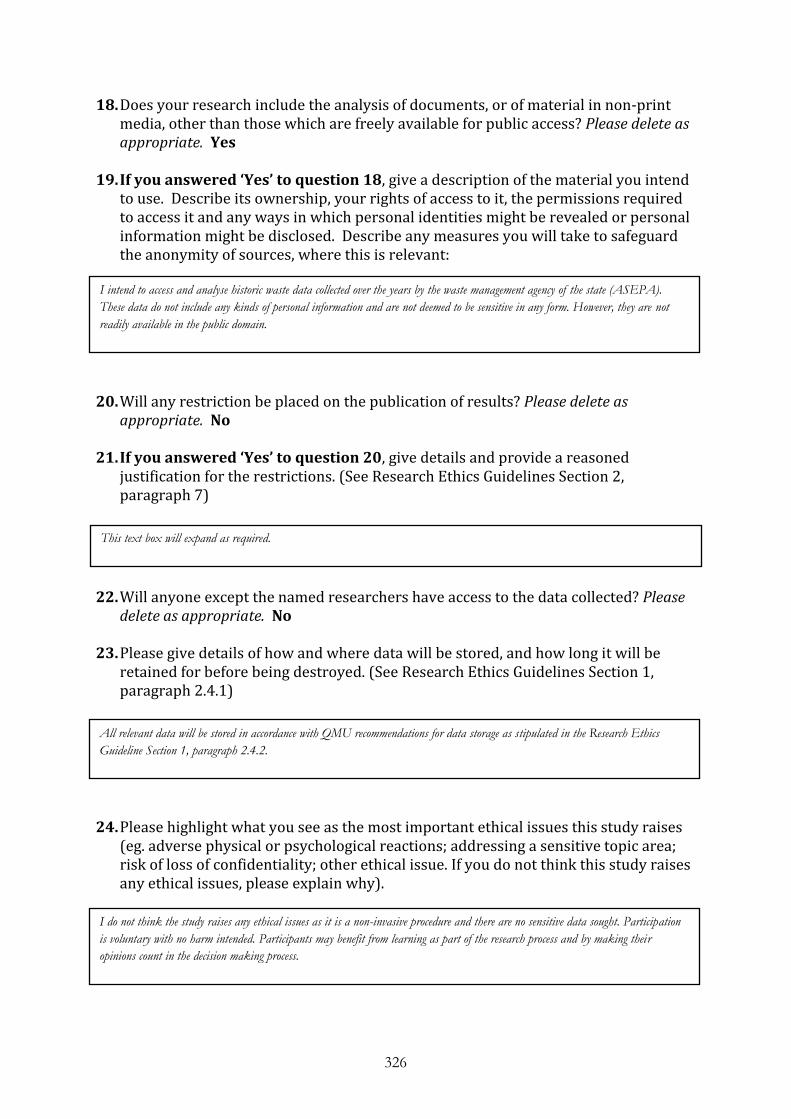
326
18. Does your research include the analysis of documents, or of material in non-print media, other than those which are freely available for public access? Please delete as appropriate. Yes
19. If you answered ‘Yes’ to question 18, give a description of the material you intend
to use. Describe its ownership, your rights of access to it, the permissions required to access it and any ways in which personal identities might be revealed or personal information might be disclosed. Describe any measures you will take to safeguard the anonymity of sources, where this is relevant:
20. Will any restriction be placed on the publication of results? Please delete as
appropriate. No 21. If you answered ‘Yes’ to question 20, give details and provide a reasoned
justification for the restrictions. (See Research Ethics Guidelines Section 2, paragraph 7)
22. Will anyone except the named researchers have access to the data collected? Please
delete as appropriate. No 23. Please give details of how and where data will be stored, and how long it will be
retained for before being destroyed. (See Research Ethics Guidelines Section 1, paragraph 2.4.1)
24. Please highlight what you see as the most important ethical issues this study raises
(eg. adverse physical or psychological reactions; addressing a sensitive topic area; risk of loss of confidentiality; other ethical issue. If you do not think this study raises any ethical issues, please explain why).
I do not think the study raises any ethical issues as it is a non-invasive procedure and there are no sensitive data sought. Participation
is voluntary with no harm intended. Participants may benefit from learning as part of the research process and by making their
opinions count in the decision making process.
I intend to access and analyse historic waste data collected over the years by the waste management agency of the state (ASEPA).
These data do not include any kinds of personal information and are not deemed to be sensitive in any form. However, they are not
readily available in the public domain.
This text box will expand as required.
All relevant data will be stored in accordance with QMU recommendations for data storage as stipulated in the Research Ethics
Guideline Section 1, paragraph 2.4.2.

327
25. If you have identified any ethical issues associated with this study, please explain
how the potential benefits of the research outweigh any potential harms (eg. by benefiting participants; by improving research skills; other potential benefit).
Protection for the Researcher 26. Will the researcher be at risk of sustaining either physical or psychological harm as a
result of the research? Please delete as appropriate. No 27. If you answered ‘Yes’ to question 26, please give details of potential risks and the
precautions which will be taken to protect the researcher.
Research Involving Human Participants You should only complete this section if you have indicated above that your research will involve human participants. 28. Please indicate the total number of participants you intend to recruit for this study
from each participant group:
Participant Group Please state total number
QMU students QMU staff Members of the public from outside QMU NHS patients NHS employees Children (under 18 years of age) People in custody People with communication or learning difficulties People with mental health issues People engaged in illegal activities (eg. illegal drug use) Other (please specify):
All participants in this study will be residents of the city of Aba, Abia State, Nigeria, and or government
This text box will expand as required.
This text box will expand as required.
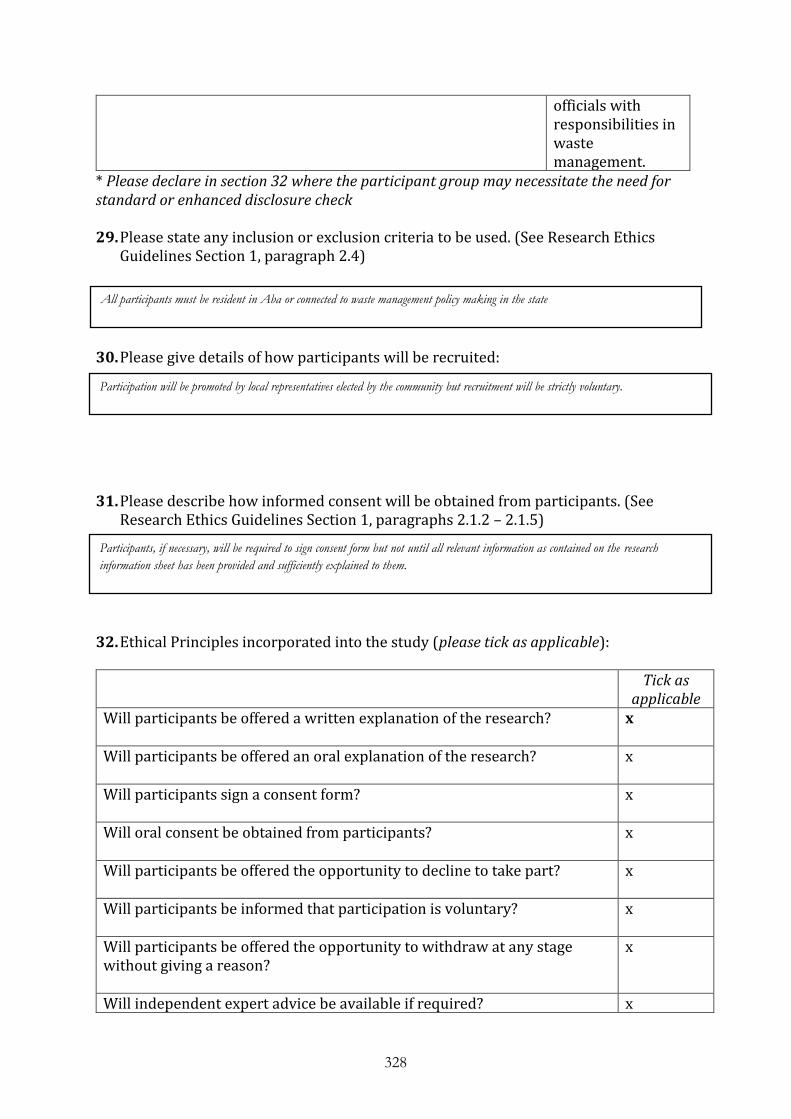
328
officials with responsibilities in waste management.
* Please declare in section 32 where the participant group may necessitate the need for standard or enhanced disclosure check 29. Please state any inclusion or exclusion criteria to be used. (See Research Ethics
Guidelines Section 1, paragraph 2.4)
30. Please give details of how participants will be recruited:
31. Please describe how informed consent will be obtained from participants. (See
Research Ethics Guidelines Section 1, paragraphs 2.1.2 – 2.1.5)
32. Ethical Principles incorporated into the study (please tick as applicable):
Tick as applicable
Will participants be offered a written explanation of the research?
x
Will participants be offered an oral explanation of the research?
x
Will participants sign a consent form?
x
Will oral consent be obtained from participants?
x
Will participants be offered the opportunity to decline to take part?
x
Will participants be informed that participation is voluntary?
x
Will participants be offered the opportunity to withdraw at any stage without giving a reason?
x
Will independent expert advice be available if required? x
All participants must be resident in Aba or connected to waste management policy making in the state
Participation will be promoted by local representatives elected by the community but recruitment will be strictly voluntary.
Participants, if necessary, will be required to sign consent form but not until all relevant information as contained on the research
information sheet has been provided and sufficiently explained to them.
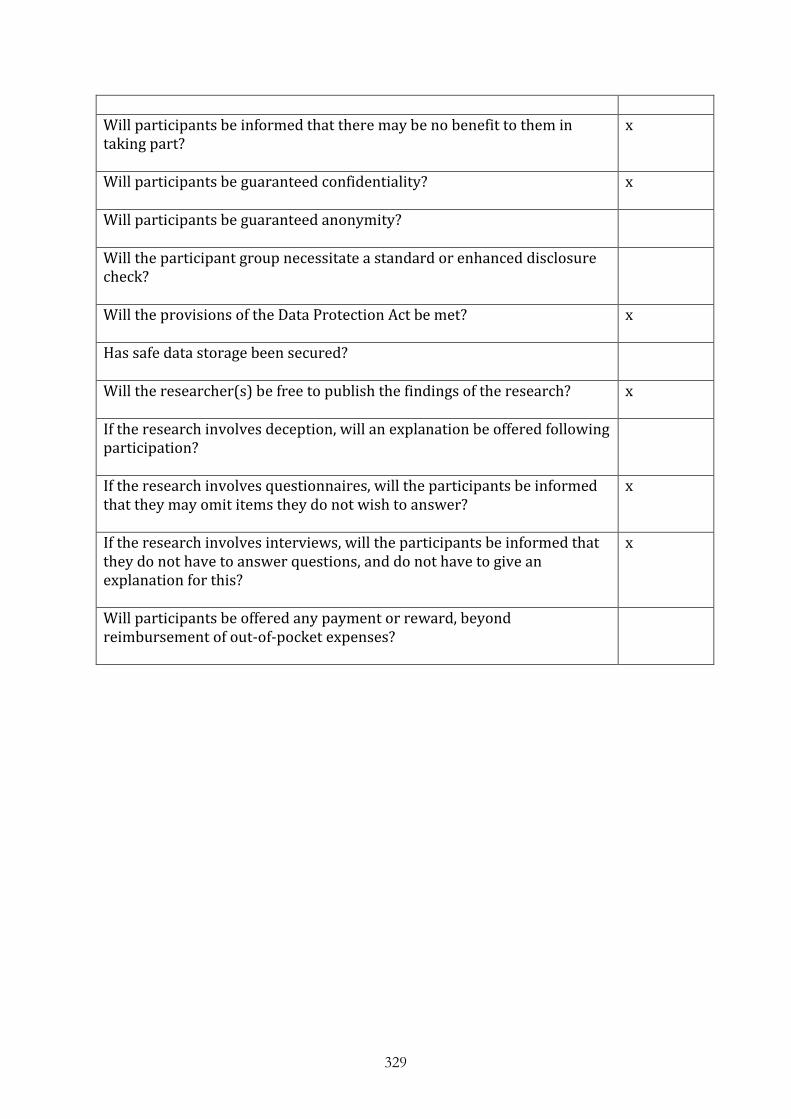
329
Will participants be informed that there may be no benefit to them in taking part?
x
Will participants be guaranteed confidentiality?
x
Will participants be guaranteed anonymity?
Will the participant group necessitate a standard or enhanced disclosure check?
Will the provisions of the Data Protection Act be met?
x
Has safe data storage been secured?
Will the researcher(s) be free to publish the findings of the research?
x
If the research involves deception, will an explanation be offered following participation?
If the research involves questionnaires, will the participants be informed that they may omit items they do not wish to answer?
x
If the research involves interviews, will the participants be informed that they do not have to answer questions, and do not have to give an explanation for this?
x
Will participants be offered any payment or reward, beyond reimbursement of out-of-pocket expenses?

330
33. Risk Assessment
School / Dept:
Arts, Social Sciences and Management
Location: Aba, Nigeria Date 16/02/2015
Assessed by:
Stanley Nwankpa Job Title: Researcher Signature
Activity / Task:
Interviews, Chats, Observations
Total Number exposed to risk 200 Review Date
Ref no. Hazards
People at risk Likelihood Severity
Em
plo
ye
es
an
d
stu
de
nts
M
em
be
rs o
f p
ub
lic/
vis
ito
rs
Co
ntr
act
ors
Yo
un
g
pe
op
le
Mo
the
rs:
ne
w o
r e
xp
ect
an
t Im
pro
ba
ble
Re
mo
te
Po
ssib
le
Pro
ba
ble
No
in
jury
Min
or
Ma
jor
Fa
tal
Total risk
Existing control measures A
de
qu
ate
co
ntr
ols
?
1. Trips and Falls x x x x x 2 PPE Yes
2. Fire x x x x 1 Fire extinguishers Yes
3.
4.
5.
Risk value (RV) 1 2 3 4 1 2 3 4 3
Total risk = Likelihood (RV) x Severity (RV) Total risk of 1 – 4 = ‘L’, low risk Total risk of 6 – 9 = ‘M’, medium risk Total risk of 12 – 16 = ‘H’, high risk
Reference: 1
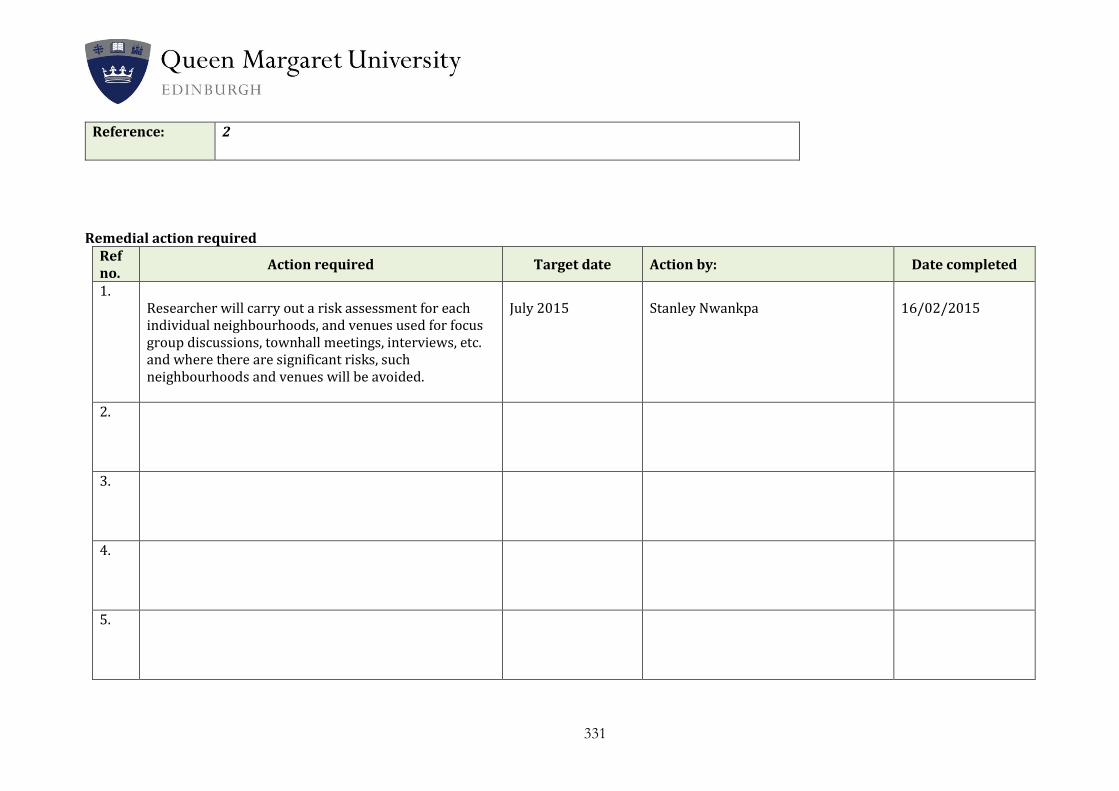
331
Reference: 2
Remedial action required
Ref no.
Action required Target date Action by: Date completed
1. Researcher will carry out a risk assessment for each individual neighbourhoods, and venues used for focus group discussions, townhall meetings, interviews, etc. and where there are significant risks, such neighbourhoods and venues will be avoided.
July 2015
Stanley Nwankpa
16/02/2015
2.
3.
4.
5.

332
Declarations 34. Having completed all the relevant items of this form and, if appropriate, having attached the Information Sheet and Consent Form plus any other relevant documentation as indicated below, complete the statement below.
I have read Queen Margaret University’s document on “Research Ethics: Regulations, Procedures, and Guidelines”.
In my view this research is:
See Research Ethics Guidelines Section 6 Please
tick Non-invasive x Minor invasive using an established procedure at QMU Minor invasive using a NEW procedure at QMU Major invasive
I request Ethical Approval for the research described in this application.
Name (if you have an electronic signature please include it here)
____ _____________________________ Date _____16/02/2015_______ Documents enclosed with application:
Document Enclosed (please tick)
Not applicable (please tick)
Copy of consent form(s) x Copy of information sheet(s) x Sample questionnaire x Example interview questions x Copy of proposed recruitment advert(s) x Letters of support from any external organisations involved in the research
Evidence of disclosure check x Subject area risk assessment documentation Any other documentation (please detail below) Risk Assessment x


