
Dave CollyerPresident, Canadian Association of Petroleum Producers
A Perspective on Canada’s Upstream Oil & Gas Sector
2010 Edmonton Real Estate Forum – May 4, 2010

Presentation Outline
• Current business environment
• Industry activity overview
• Natural gas business outlook
• Crude oil business outlook
• CAPP Priorities
• Summary

Business Environment

Global Energy Outlook
• Significant energy demand growth:
Population, standards of living
• Need all forms of energy:Increasing role for renewablesContinuing reliance on hydrocarbons (predominant energy supply source)Increasing role for non-conventional crude oil & natural gas
• Environmental challenges• Technology is a key lever
for sustainable growth
World Energy Demand 1990 - 2030EIA – International Energy Outlook 2009
0
100
200
300
400
500
600
700
800
1990 2005 2006 2010 2015 2020 2025 2030
Other Nuclear Coal Natural Gas Liquids
Quadrillion BTU

Crude Oil and Natural Gas Prices
0.00
20.00
40.00
60.00
80.00
100.00
120.00
140.00
'99
'00
'01
'02
'03
'04
'05
'06
'07
'08
'09
'10
0.00
2.00
4.00
6.00
8.00
10.00
12.00
14.00
'99
'00
'01
'02
'03
'04
'05
'06
'07
'08
'09
'10
Crude Oil Prices (WTI NYMEX)$US per barrel
Natural Gas Prices (AECO Daily Spot Price)
$Cdn/mcf

Payments to Governments by Upstream Oil and Gas Sector
0
5
10
15
20
25
30
35
2005 2006 2007 2008 2009E
Billi
on d
olla
rs
Municipal TaxesBonus & RentalsProvincial Income TaxesFederal Income TaxesCrown Royalties

Industry Activity Overview

Western Canadian Land Sales: Year-to-Date Bonus Bids
0.0
0.1
0.2
0.3
0.4
0.5
0.6
0.7
Alberta British Columbia Saskatchewan
$ bi
llion
s
2007 2008 2009 2010
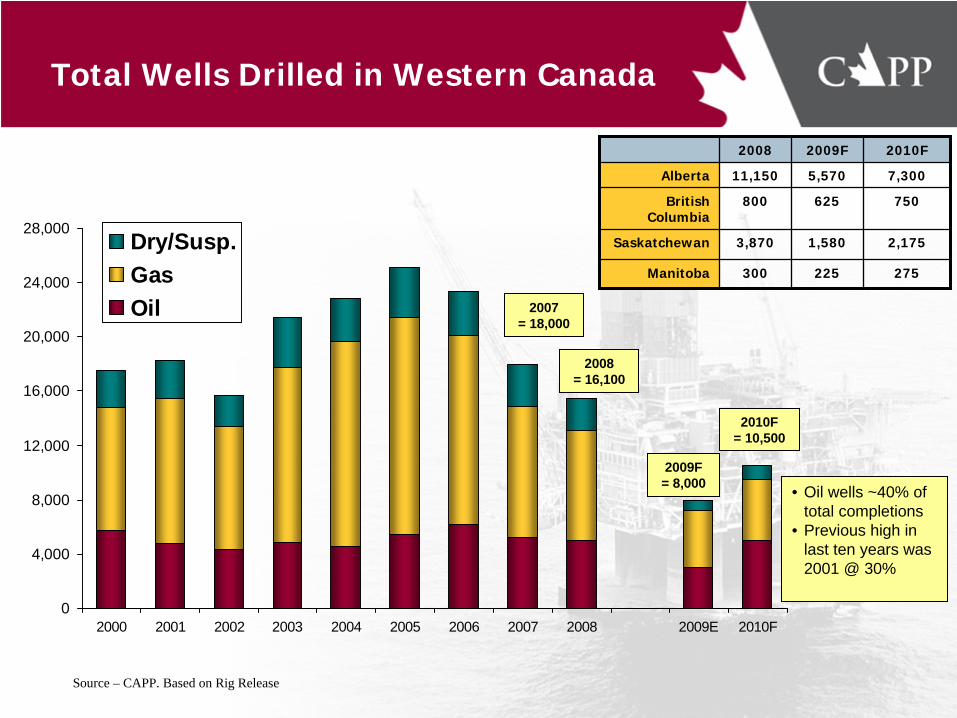
Total Wells Drilled in Western Canada
0
4,000
8,000
12,000
16,000
20,000
24,000
28,000
2000 2001 2002 2003 2004 2005 2006 2007 2008 2009E 2010F
Dry/Susp.GasOil
Source – CAPP. Based on Rig Release
2007 = 18,000
2008 = 16,100
2009F = 8,000
2010F= 10,500
2008 2009F 2010F
Alberta 11,150 5,570 7,300
British Columbia
800 625 750
Saskatchewan 3,870 1,580 2,175
Manitoba 300 225 275
• Oil wells ~40% of total completions
• Previous high in last ten years was 2001 @ 30%

Industry Capital Spending Cdn $billions
Northern Canada
‘08 `09E ‘10F
$0.4 $0.5 $0.5
Oil Sands
‘08 `09E ‘10F
$18 $11 $13
WCSB
‘08 `09E ‘10F $34 $22 $26
East Coast Offshore
`08 `09E ‘10F
$1.3 $1.5 $2.5
Note: Spending in Canada excludes spending associated with mergers & acquisitions
Oil & Gas Investment Spending:2008: $54 billion2009: $35 billion (estimate)2010: $42 billion (forecast)
AB $21 $13 $15 BC $7.9 $6 $7SK $4.8 $3 $4
`08 `09E ‘10F

Capital Investment in Alberta
0
10
20
30
40
50
1997 1998 1999 2000 2001 2002 2003 2004 2005 2006 2007 2008 2009est.
2010frcst.
Oil SandsConventional
$ bi
llion
s

Opportunities in Alberta
• Crude Oil“Unconventional” oil - tight oil resourcesEnhanced oil recovery in mature fields - CO2, polymer
• Oil SandsGlobal scale and global focusMining and drillable
• Natural GasConventional natural gas remains important“Unconventional” natural gas - shale gas, coal bed methane

Why is it Important?
• Benefits to Albertans of investment by the oil and gas industry:
……..$1 in investment generates $3 in value creation for Albertans
AttractCapital
Jobs
InvestmentNew Businesses
Taxes andRoyalties
IncreasesStandardof Living

Natural Gas

Alberta Natural Gas Production
10.0
10.5
11.0
11.5
12.0
12.5
13.0
13.5
14.0
14.5
Jan Feb Mar Apr May Jun Jul Aug Sep Oct Nov Dec
billi
on c
ubic
fee
t pe
r da
y
Source: FirstEnergy Capital
2008
2007
20092010
WCSB Field Receipts: 2007 – 16.4 bcf/d2008 – 15.7 bcf/d2009 – 14.7 bcf/d
Sept. 2009 was lowest gas production since mid-1995.

N.A. Natural Gas Supply Outlook
• Shale gas supply a game- changer
• Technology breakthroughs
• New producing regions
• Emerging stakeholder environmental concerns (footprint, water)
• Shifting S/D dynamic

Western Canada – Resource Plays
Source: TransCanada

Unconventional Natural Gas Technology - Horizontal Wells, Multi-Stage Fractures
Source: Alberta Venture

Canadian Natural Gas Production Forecast
0
5
10
15
20
2005 2006 2007 2008 2009 2010 2011 2012 2013 2014 2015 2016 2017 2018 2019 2020
Bill
ion
cubi
c fe
et/d
ay
Mackenzie Valley*
Nova Scotia Offshore
BC Horn River
BC Montney
Coalbed Methane
Conventional Gas
Assumes a price that renders production economic* Subject to commercial and regulatory approvalSource: CAPP
Previous Forecast

Implications & CAPP Response
• ImplicationsEmerging supply and demand imbalance in North AmericaPressure on competitiveness and basin economics in Western CanadaPipeline utilization issues: lower volume = higher tollAvailability of new infrastructure: right place, right timeIncreasing focus on offshore exports
• CAPP ResponseA key driver in the Alberta Competitiveness ReviewProactive efforts on pipeline settlements and ratesOngoing focus on alignment of supply and pipeline capacity….increasing focus on offshore markets Canadian Natural Gas Initiative

Crude Oil

Global Crude Oil Reserves by Country
Source: Oil & Gas Journal Dec. 2008
21303644
60
9299102
115
136
175
264
0
50
100
150
200
250
300
Saudi Arabia Canada Iran Iraq Kuwait VenezuelaAbu Dhabi Russia Libya Nigeria Kazhakhstan UnitedStates
billi
on b
arre
ls
Includes 170 billi
on barrels
of oil s
ands reserves
OtherAccessibleReserves
State ownedor controlled
Accessible
Canada’sOil Sands
World OilReserves
OtherAccessibleReserves
53%
47%
AccessibleOil Reserves

Canadian Crude Oil Production Outlook
Total Canadian Oil Production

Western Canadian Oil Production

Oil Sands GHG Emissions In Context

Oil Sands Communications
• Information/EducationEnglish, French, Norwegian, and GermanInformation on environment, economics and energyReal examples of technology
• Websiteswww.capp.cawww.canadasoilsands.ca
• Social MediaFacebook, Twitter
• Come See For Yourself videosWebsiteYoutube

Short Term Outlook for Crude Oil
• The Opportunity:Improving economy reviving projects - stronger oil prices and lower costsProjects under construction:
• Imperial Kearl Lake• Shell Jackpine and Shell Upgrader (including Quest CCS project)
Projects re-activated:• Suncor Firebag Phases 3 and 4• Devon Jackfish Phase 3 application in 2010• Cenovus Christina Lake – application for phases E, F, G• ConocoPhillips/Total – Surmount phase 2• Husky/BP – Sunrise phase 1
Oil sands attracting foreign investmentEnhanced Oil/Tight Oil opportunities:
• Technology-enabled plays such as the Bakken, Cardium and Viking attracting increasing interest (multi-frac horizontal wells)
• The Challenges:Potential for return of upward cost pressuresEnvironmental performanceOpposition to oil sands development…..the “off hydrocarbons” agendaDeveloping offshore markets

CAPP Priorities

2010 CAPP PRIORITIES – “THE BIG 4”
• Alberta Competitiveness ReviewFiscalRegulatory
• Industry Reputation: (Performance + Communications) x Time
“Alberta is Energy” (also B.C. & Saskatchewan)Canadian Natural GasOil Sands Performance and CommunicationsResponsible Canadian Energy
• Environment Policy & Regulation
• Pipeline Tolls

Summary

Summary – Oil & Gas Sector Outlook
• Near term remains challenging:Emerging from economic downturn….but not out of the woods yetCrude oil outlook more encouraging; natural gas less certain Public expectations of industry/gov’t continue to increaseOngoing opposition from ENGOs, other stakeholders
• Fundamentals sound for medium to longer term:Very large resource base (oil and gas)Canadian industry track record and capabilityReliable supplier with good market access
• Industry leadership:Investing to create jobs & economic growth across Canada Environmental performance supported by strict regulationsDeveloping / deploying technology as a key lever (environment & supply)Addressing public perception of industryConstructive engagement in public policy & regulation
• Require a balanced “3E” approach to public policy


