
A
GLOBAL COUNTRY REPORT
ON
BELGIUM
Submitted to
Gujarat Technological University
IN PARTIAL FULFILLMENT OF THE
REQUIREMENT OF THE AWARD FOR THE DEGREE OF
MASTER OF BUSINESS ADMINISTRATION
In
Parul Institute of Engineering & Technology MBA
Compiled By:-
Ms. Iram Ada Khan
Assistant Professor
Ms. Vidita Sinha
Assistant Professor
Submitted by
Parul Institute of Engineering & Technology MBA Students
Batch: 2011-13
MBA SEMESTER III & IV
PARUL INSTITUTE OF ENGINEERING & TECHNOLOGY MBA
MBA PROGRAMME
Affiliated to Gujarat Technological University
Ahmedabad
2013

NAME AND ENROLLMENT NO. OF GROUPS
GROUP NO 1
PART I: CHAPTER 1 DEMOGRAPHIC PROFILE OF BELGIUM
PART II: SECTOR ANALYSIS OF MACHINERY TOOLS INDUSTRY
ENROLMENT NO. NAME OF STUDENT
117420592001 BHATT NAIMISHKUMAR PRAFULKUMAR
117420592002 KALELE KAUSHIK MADHAV
117420592004 SRIVASTAVA NITESH UMESH
117420592005 SHERASIYA HITESHKUMAR GANESHBHAI
117420592006 BASER SURYA KAILASH
117420592007 GULABANI VINITA RAJMOHAN
GROUP NO 2
PART I: CHAPTER 2 ECONOMIC OVERVIEW OF BELGIUM
PART II: SECTOR ANALYSIS OF GLASS INDUSTRY
ENROLMENT NO. NAME OF STUDENT
117420592008 MAHADIK JANHAVI SHARAD
117420592009 SABNIS SHRUTI UDAY
117420592010 MEHTA MAITREE LAHERCHAND
117420592011 BHATT NIDHI PRAMODKUMAR
117420592012 GOLANI BHAVITA SUNIL
117420592013 PARIKH SAMKIT DEVESH

GROUP NO 3
PART I: CHAPTER 3 OVERVIEW OF INDUSTRIES TRADE AND COMMERCE
PART II: SECTOR ANALYSIS OF PAPER & PACKAGING INDUSTRY
ENROLMENT NO. NAME OF STUDENT
117420592015 THOBHANI NEEL MAHENDRABHAI
117420592016 BHOITE SWAPNILA RAJIVAN
117420592017 NANWANI VIKAS DAYANAND
117420592018 GAYATHRI SHANKAR
117420592019 DIVIYESH GOHEL
117420592020 PALAK JAISWAL
GROUP NO 4
PART I: CHAPTER 4 OVERVIEW OF DIFFERENT ECONOMIC SECTORS OF BELGIUM
PART II: SECTOR ANALYSIS OF TRAVELS & TOURISM INDUSTRY
ENROLMENT NO. NAME OF STUDENT
117420592021 AHUJA PAYAL NARENDRAKUMAR
117420592022 JADEJA DUSHYANT NARPATSINH
117420592023 GAJJAR MANISHKUMAR ARVINDBHAI
117420592024 PUROHIT SAMPADA MILIND
117420592026 GALAGALI AAKASH ANIL
117420592027 GOSAI NIKITA SATISHGIR

GROUP NO 5
PART I: CHAPTER 5 OVERVIEW OF BUSINESS & TRADE AT INTERNATIONAL LEVEL
PART II: SECTOR ANALYSIS OF METAL INDUSTRY
ENROLMENT NO. NAME OF STUDENT
117420592028 PRAJAPATI VANDITKUMAR RAMESHBHAI
117420592029 SHEKH IRSADBHAI ARAHIMBHAI
117420592030 VADHER TEJALBEN ABHUBHAI
117420592031 RATHOD SANDIPKUMAR DHIRUBHAI
117420592032 PARMAR BHAVINI GANPATBHAI
117420592033 KATHIRIYA AJAYKUMAR PRAGJIBHAI
GROUP NO 6
PART I: CHAPTER 6 PRESENT TRADE RELATIONS AND BUSINESS VOLUME OF DIFFERENT PRODUCTS WITH
INDIA/GUJARAT
PART II: SECTOR ANALYSIS OF GEMS & JEWELLERY INDUSTRY
ENROLMENT NO. NAME OF STUDENT
117420592034 PARMAR MANHAR NARSHIBHAI
117420592035 PRAJAPATI HARESHKUMAR VINODBHAI
117420592036 SHAIKH SUMAIYA MOHMMEDHANIF
117420592037 PATEL VIREN BABUBHAI
117420592038 MAKWANA JITENDRAKUMAR MOTIBHAI
117420592039 KATHIRIYA PRATIKKUMAR ANUBHAI

GROUP NO 7
PART I: CHAPTER 7 POLITICAL ANALYSIS
PART II: SECTOR ANALYSIS OF PHARMACEUTICAL INDUSTRY
ENROLMENT NO. NAME OF STUDENT
117420592040 MISTRY CHANDNI RAMESHBHAI
117420592041 SUDAN ROBINA RAJESHBHAI
117420592042 PATEL JUGALKUMAR RAMANBHAI
117420592043 SHEKH SOEB NOORMOHMED
117420592044 CHAUDHARY AKASHKUMAR RAMESHBHAI
117420592045 DHAVAL RAJESHBHAI GANDHI
GROUP NO 8
PART I: CHAPTER 8 ECONOMIC ANALYSIS
PART II: SECTOR ANALYSIS OF AUTOMOBILE INDUSTRY
ENROLMENT NO. NAME OF STUDENT
117420592046 RAULJI SHELU RAJENDRASINGH
117420592047 VIKRAM AWASTHI
117420592048 POOJA SANATKUMAR MEHTA
117420592049 PATEL NISHANTKUMAR RAJENDRAKUMAR
117420592050 SHAH VAIBHAV KAMLESHBHAI

GROUP NO 9
PART I: CHAPTER 9 SOCIAL & TECHNOLOGICAL ANALYSIS
PART II: SECTOR ANALYSIS OF FOOD & BEVERAGES INDUSTRY
ENROLMENT NO. NAME OF STUDENT
117420592051 CHUDASAMA RAJDEEPSINH KISHORSINH
117420592052 CHARVI MANISH PATHAK
117420592053 PATEL GAURAV NATVARBHAI
117420592054 THAKOR DIPYANTIBEN MAHENDRASINH
117420592055 GANDHI SHREENATH RAJESHKUMAR
117420592056 PATEL VARUNKUMAR JASHUBHAI
GROUP NO 10
PART I: CHAPTER 10 ENVIRONMENTAL & LEGAL ANALYSIS
PART II: SECTOR ANALYSIS OF CHEMICAL INDUSTRY
ENROLMENT NO. NAME OF STUDENT
117420592057 MEHTA HETA BIPINBHAI
117420592058 PATEL SHIVALI GIRISHBHAI
117420592059 PATEL CHIRAGKUMAR ARVINDBHAI
117420592060 PARMAR BINAL NAKUSHKUMAR
117420592061 KHER PRAVEEN SHIV NANDAN

DECLARATION We, students of Parul Institute of Engineering & Technology MBA, hereby
declare that the report for Global Country Report on Belgium is a result of
our own work and our indebtedness to other work publication, references, if
any have been duly acknowledged.
Place: Vadodara
Date: _________
Names of the Group Leaders Signature
Group 1: Kaushik Kalele
Group 2: Samkit Parikh
Group 3: Gayathri Shankar
Group 4: Dushyant Jadeja
Group 5: Kathiriya Ajay
Group 6: Prajapati Haresh
Group 7: Robina Sudan
Group 8: Mehta Pooja
Group 9: Gandhi Shreenath
Group 10: Kher Praveen

INSTITUTE’S CERTIFICATE
It is certified that this Global Country Report on Belgium is the bonafide work
of students of Parul Institute of Engineering & Technology MBA who carried
out the research under our supervision. We also certify further, that to the
best of our knowledge the work reported herein does not form part of any
other project report or dissertation on the basis of which a degree or award
was conferred on an earlier occasion on this or any other candidate.
Name of the Faculty Guide Signature
Ms Vidhita Sinha
Ms Iram Khan

PREFACE
The Practical training at MBA level is to develop the students’ experience
about industrial environment of business practice at domestic as well as
international level in order to develop a practical base in them as
supplement to the theoretical studies of the management in general. The
theoretical knowledge and concept ideas are the enough background for
career development but the practical training is also having equal
contribution for the purpose.
It is very true saying that “Without practical exploration no one becomes
expert”. Global Country Report, an opportunity provided by the university
intends to increase the knowledge, attitude and ability of a student to
observe and perceive the business system of another country. As a result of
MBA, it is a part of education that we may be allowed to know about how a
particular industry / sector perform in another country.
Through Global Country Report, we come across some great knowledge of
how a particular industry / sector perform in a country.

ACKNOWLEDGEMENT
This acknowledgement is not only the means of formality, but to us, it is a
way by which we are getting the opportunity to show the deep sense of
gratitude and obligation to all the people who have provided us with
inspiration, guidance and help during the preparation of the project.
At the very outset, we would like to express our gratitude from the bottom of
our hearts to Gujarat Technological University for giving the students the
opportunity to do a Global Country Report so that we can learn about the
business as well as managerial activities regarding another country.
We would also like to express our gratitude to our faculty guide Ms. Aashka Patel- (Asst. Professor), Ms. Iram Khan- (Asst. Professor ), Ms. Vidhita
Sinha–(Asst. Professor ), Parul Institute of Engineering & Technology
MBA, who helped us in carrying our project work, which ultimately resulted
in successful completion of the project. Last but not the least we are thankful
to our parents, friends and all well wishers for blessing us for our success.

EXECUTIVE SUMMARY Gujarat technological university has added Global Country Report in the current syllabus
so that students get practical knowledge of other countries along with India. The objective
of Global Country Report is to enable the students about the socio-economic aspects of a
foreign country, and learn about present and potential area of business with that country.
It also enables the students to learn about how to do business / export / import with /
within that country. Here, we have chosen Belgium for our study. This report includes the
Summary of work done in the Semester III (PART I) and also the summary of work done
in Semester IV (PART II).
Part I focuses on the Demographic profile, General Economic & Industries overview,
General overview of Trade & Commerce, Overview of different economic sectors of
Belgium, Legal aspects of trade in Belgium, Present trade relations of Belgium with India
and specifically Gujarat, the Import Export scenario between the two nations, Business
volume of different products, investments with India and also Gujarat. It also includes the
PESTEL Analysis.
Part II in this report consists of a Specific Study and Analysis of different sectors. It is a
synopsis of Analysis of particular industry/sector/company of Belgium, the present
relationship with Indian trade and commerce, investment, import-export. Further it also
focuses on the identification of possibilities or new opportunities of business which can be
in trade, manufacturing, import, export, investment etc in Belgium. The different sectors
which we have covered under specific study and analysis are Machinery & Tools, Glass,
paper & Packaging, Travels & tourism, Metal, Gems & Jewellery, Pharmaceutical,
Automobile, Food & Beverages and Chemical
This report it identifies achievements, assesses progress and also signals opportunities
for Indian businesses. The report will provide potential investors an overview of the
Belgium economy and society, detailed insight on opportunities and challenges in the
Belgium market and some practical information about working Belgium. The report
contains some basic information on the Belgium manufacturing industry; it also contains
non oil and gas manufacturing contribution to GDP, then some information about legal
framework of trade relations, trade structure and trading partners.
With Belgium’s enormous natural recourses, cheap labor and growing
middle class the potential is exceptional. Despite of the challenges the country is
something every investor should consider. The challenges can be handled and the
opportunities are too big to neglect Belgium is definitely a country we would recommend
for future investments.

Our report has limitations, as we search data on internet. Another limitation with our
research is that we visited a limited number of websites. This may cause the report to be
too one-sided. We have tried to balance our website visits with some Belgium
companies. We have also searched for to local’s point of views on internet through
articles and expatriates in more informal settings and to our best ability tried to
understand the Belgium history, culture and way of thinking.
These limitations can be eliminated by going onto the field of Belgium and by meeting
them personally, taking their feedbacks & suggestions towards overall improvement of
business & trade at international level

TABLE OF CONTENTS SR NO.
TOPIC PAGE NO.
SEM
PART – I ECONOMIC OVERVIEW
OF THE SELECTED COUNTRY
III
1 OVERVIEW OF THE COUNTRY
III
2 DEMOGRAPHIC PROFILE OF THE COUNTRY
III
3 ECONOMIC OVERVIEW OF THE COUNTRY
III
4 OVERVIEW DIFFERENT ECONOMIC SECTORS OF
SELECTED COUNTRY
III
5 OVERVIEWS OF BUSINESS AND TRADE AT
INTERNATIONAL LEVEL
III
6 PRESENT TRADE RELATIONS AND BUSINESS
VOLUME OF DIFFERENT PRODUCTS WITH INDIA /
GUJARAT
III
7 PESTEL ANALYSIS OR SWOT ANALYSIS
III
PART – II INDUSTRY / SECTOR / COMPANY SPECIFIC STUDY
1 ANALYSIS OF MACHINERY & TOOLS INDUSTRY IV
2 ANALYSIS OF GLASS INDUSTRY IV
3 ANALYSIS OF PAPER & PACKAGING INDUSTRY IV
4 ANALYSIS OF TRAVELS & TOURISM IINDUSTRY IV

5 ANALYSIS OF METAL INDUSTRY IV
6 ANALYSIS OF GEMS & JEWELLERY INDUSTRY IV
7 ANALYSIS OF PHARMACEUTICAL INDUSTRY IV
8 ANALYSIS OF AUTOMOBILE INDUSTRY IV
9 ANALYSIS OF FOOD & BEVERAGES INDUSTRY IV
10 ANALYSIS OF CHEMICAL INDUSTRY IV

PART – I ECONOMIC OVERVIEW
OF BELGIUM

CH.1:- HISTORY AND OVERVIEW OF BELGIUM
Belgium derives its name from the Belgae, a Celtic tribe. The Belgae were forced to yield
to Roman legions during the first century B.C. For some 300 years thereafter, what is
now Belgium flourished as a province of Rome. But Rome's power gradually lessened. In
about A.D. 300, Attila the Hun invaded what is now Germany and pushed Germanic
tribes into northern Belgium. About 100 years later, the Germanic tribe of the Franks
invaded and took possession of Belgium. The northern part of present-day Belgium
became an overwhelmingly Germanized and Germanic-Frankish-speaking area, whereas
in the southern part people continued to be Roman and spoke derivatives of Latin. After
coming under the rule of the Dukes of Burgundy and, through marriage, passing into the
possession of the Hapsburgs, Belgium was occupied by the Spanish (1519-1713) and
the Austrians (1713-1794).
Under these various rulers, and especially during the 500 years from the 12th to the 17th
century, the great cities of Ghent, Bruges, Brussels, and Antwerp took turns at being
major European centers for commerce, industry (especially textiles), and art. Flemish
painting--from Van Eyck and Breugel to Rubens and Van Dyck--became the most prized
in Europe. Flemish tapestries hung on castle walls throughout Europe.
Following the French Revolution, Belgium was invaded and annexed by Napoleonic
France in 1795. Following the defeat of Napoleon's army at the Battle of Waterloo, fought
just a few miles south of Brussels, Belgium was separated from France and made part of
the Netherlands by the Congress of Vienna in 1815.
In 1830, Belgium won its independence from the Dutch as a result of an uprising of the
Belgian people. A constitutional monarchy was established in 1831, with a monarch
invited in from the House of Saxe-Coburg Gotha in Germany.
Belgium was invaded by Germany in 1914 and again in 1940. Those invasions, plus
disillusionment over postwar Soviet behavior, made Belgium one of the foremost
advocates of collective security within the framework of European integration and the
Atlantic partnership.
Since 1944, when British, Canadian, and American armies liberated Belgium, the country
has lived in security and at a level of increased well-being.

Language, economic, and political differences between Dutch-speaking Flanders and
Francophone Wallonia have led to increased divisions in Belgian society. The Industrial
Revolution of the late 18th and the 19th century accentuated the linguistic North-South
division. Francophone Wallonia became an early industrial boom area, affluent and
politically dominant. Dutch-speaking Flanders remained agricultural and was
economically and politically outdistanced by Brussels and Wallonia. The last 50 years
have marked the rapid economic development of Flanders, resulting in a corresponding
shift of political and economic power to the Flemish, who now constitute an absolute
majority (58%) of the population.
Demonstrations in the early 1960s led to the establishment of a formal linguistic border in
1962, and elaborate rules made to protect minorities in linguistically mixed border areas.
In 1970, Flemish and Francophone cultural councils were established with authority in
matters of language and culture for the two-language groups. Each of the three economic
regions--Flanders, Wallonia, and Brussels--was granted a significant measure of political
autonomy.
Since 1984, the German language community of Belgium (in the eastern part of Liège
Province) has had its own legislative assembly and executive, which have authority in
cultural, language, and subsequently educational affairs.
In 1988-89, the Constitution was again amended to give additional responsibilities to the
regions and communities. The most sweeping change was the devolution of educational
responsibilities to the community level. As a result, the regions and communities were
provided additional revenue, and Brussels was given its own legislative assembly and
executive.
Another important constitutional reform occurred in the summer of 1993, changing
Belgium from a unitary to a federal state. It also reformed the bicameral parliamentary
system and provided for the direct election of the members of community and regional
legislative councils. The bilingual Brabant province, which contained the Brussels region,
was split into separate Flemish and Walloon Brabant provinces. The revised Constitution
came into force in 1994.

CH.2:-DEMOGRAPHIC PROFILE
GEOGRAPHY AND PEOPLE
Belgium is located in Western Europe, bordered by the Netherlands, Germany,
Luxembourg, France, and the North Sea. Although generally flat, the terrain becomes
increasingly hilly and forested in the southeast (Ardennes) region. Climate is cool,
temperate, and rainy; summer temperatures average 77°F, winters average 45°F. Annual
extremes (rarely attained) are 10°F and 100°F.
Geographically and culturally, Belgium is at a crossroads of Europe, and during the past
2,000 years has witnessed a constant ebb and flow of different races and cultures.
Consequently, Belgium is one of Europe's true melting pots with Celtic, Roman,
Germanic, French, Dutch, Spanish, and Austrian cultures having made an imprint.
Belgium is divided ethnically into the Dutch-speaking Flemings and French-speaking
Walloons, the 70,000 residents of the eastern German cantons, and the bilingual capital
of Brussels. The population density is the second highest in Europe, after the
Netherlands.
Ethnic groups
The country is populated by a Flemish majority of about 6,000,000 people
speaking Dutch, a Walloon minority of 3,400,000 people speaking French, and
about 73,000 German speaking people in Wallonia, near the German border.
However, David Levinson reports that "the Flemish and Walloon groups are
described by experts as "communities" rather than as ethnic groups, and
individuals can move easily from one community to the other by learning to speak
the other language".
The rest consists mostly of French-speaking people from
Brussels, Italians, Dutch, French, Portuguese, Spaniards, Moroccans, Algerians, T
urks, Congolese, Poles, and Indians. (Around 23% of Belgium's population is of
non-Belgian origin.)
The exact number of French-speakers in Brussels is hard to determine, but it is
estimated that 77% of the people living in Brussels use French and 16% use
Dutch in their households, as the sole language or secondary language. See
the Brussels article for more details.

Languages
Belgium's three official languages are Dutch, spoken by 60% of the population,
French, spoken by 39%, and German, spoken by less than 1%. The vast majority
of Belgium's population, 99%, is literate as defined by the Belgian government, i.e.
capable of reading and writing in an official language by the time a citizen has
reached the age of 15.
Religion
Most, 75% of Belgians are nominally Roman Catholic. Protestant, Muslim,
agnostic, atheist and other minority religions comprise 25% of the population.
Age structure (Est. 2009)
Age Male Female Total (%)
0–14 years 857,373 822,303 16.1%
15–64 years 3,480,072 3,419,721 66.3%
65 years and over 760,390 1,047,477 17.6%
Sex ratio (2009 est.)
Age Male(s)/female
At birth 1.04
under 15 years 1.04
15–64 years 1.02
65 years and over 0.71
Total population 0.96
Total fertility rate
The total fertility rate (TFR) gradually increased during the last decade from 1.60
in 1997, 1.65 in 2002 and 1.82 in 2007. The rates in Brussels are higher than the
national average (1.79 in 1997, 1.93 in 2002 and 2.09 in 2007), while they are
below the average in Flanders (1.54 in 1997, 1.56 in 2002 and 1.77 in 2007).

GOVERNMENT AND POLITICAL CONDITIONS
Belgium is a hereditary constitutional monarchy. The current monarch is King Albert II,
who took the oath of office on August 9, 1993.
As titular head of state, the King plays a largely ceremonial and symbolic role in the
nation. His primary political function is to designate a political leader to attempt to form a
new cabinet following either an election, the resignation of a government, or a
parliamentary vote of no confidence. The King is seen as playing a symbolic unifying role,
representing a common national Belgian identity.
The Belgian Parliament consists of a Senate and a House of Representatives. The
House of Representatives has 150 directly elected members. The Senate has 71 elected
members. The executive branch of the government consists of ministers and secretaries
of state (junior ministers) drawn from the political parties that form the government
coalition. The number of ministers is limited to 15, and they have no seat in Parliament.
The Council of Ministers is chaired by the Prime Minister and consists of the ministerial
heads of the executive departments.
The allocation of powers between the Parliament and the Council of Ministers is
somewhat similar to the United States--the Parliament enacts legislation and
appropriates funds--but the Belgian Parliament does not have the same degree of
independent power that the U.S. Congress has. Members of political parties represented
in the government are expected to support all bills presented by the Cabinet. The House
of Representatives is the "political" body that votes on motions of confidence and
budgets. The Senate deals with long-term issues and votes on an equal footing with the
Chamber on a limited range of matters, including constitutional reform bills and
international treaties.
The Prime Minister and his ministers administer the government and the various public
services. Ministers must defend their policies and performance in person before the
House.

THE COUNCIL OF MINISTERS
At the federal level, executive power is wielded by the Council of Ministers. The Prime
Minister chairs the Council. Each minister heads a governmental department. No single
party or party "family" across linguistic lines holds an absolute majority of seats in
Parliament. Consequently, the Council of Ministers reflects the weight of political parties
that constitute the governing coalition for the House, currently the four-party Liberal-
Socialist coalition.
THE ELECTORAL SYSTEM
The number of seats in the House of Representatives is constitutionally set at 150,
elected from 11 electoral districts. Each district is given a number of seats proportional to
its total population (not number of eligible voters) ranging from 4 for the Luxembourg
district to 24 for Antwerp. The districts are divided along linguistic lines: 5 Flemish, 5
Walloon, and the bilingual district of Brussels.
The Senate consists of 71 seats. For electoral purposes, Senators are divided into three
categories: 40 directly elected; 21 elected by the community parliaments; and 10 "co-
opted" Senators. For the election of the 25 Flemish and 15 francophone directly elected
Senators, the country is divided into three electoral districts--Flanders, Wallonia, and the
Brussels Capital Region. Of the 21 Senators representing the communities, 10 are
elected by the Flemish Parliament, 10 by the French Community Parliament, and 1 by the
German-language Parliament.
The remaining category, the 10 "co-opted" senators, are elected by the first two groups of
senators. The princes and princesses of the royal line are also members of the Senate--
currently Prince Phillippe, Prince Laurent, and Princess Astrid.
Belgium has 25 seats in the European Parliament.

CH.3:- ECONOMY OF BELGIUM
Belgium, a highly developed market economy, belongs to the Organization for Economic
Cooperation and Development (OECD), a group of leading industrialized democracies.
With a geographic area about equal to that of Maryland, and a population of 10.4 million,
Belgian per capita GDP ranks among the world’s highest. In 2006, the per capita income
(PPP) was $31,800. The federal government has managed to present balanced budgets
in recent years, but public debt remains high, at 94% at the end of 2005. GDP growth in
2006 was predicted to be 2.5%.
Densely populated Belgium is located at the heart of one of the world's most highly
industrialized regions. The first country to undergo an industrial revolution on the
continent of Europe in the early 1800s, Belgium developed an excellent transportation
infrastructure of ports, canals, railways, and highways to integrate its industry with that of
its neighbors. One of the founding members of the European Community (EC), Belgium
strongly supports deepening the powers of the present-day European Union to integrate
European economies further.
With exports equivalent to over two-thirds of GNP, Belgium depends heavily on world
trade. Belgium's trade advantages are derived from its central geographic location and a
highly skilled, multilingual, and productive work force.
The Belgian industrial sector can be compared to a complex processing machine: It
imports raw materials and semi-finished goods that are further processed and re-
exported. Except for its coal, which is no longer economical to exploit, Belgium has
virtually no natural resources. Nonetheless, most traditional industrial sectors are
represented in the economy, including steel, textiles, refining, chemicals, food
processing, pharmaceuticals, automobiles, electronics, and machinery fabrication.
Despite the heavy industrial component, services account for 74.6% of GDP. Agriculture
accounts for only 1.4% of the GDP.

STATISTICS
GDP (purchasing power parity)
Year Rs.
2011 $412 billion
2010 $403.9 billion
2009 $395.7 billion
GDP (official exchange rate)
- $529 billion (2011 est.)
GDP - real growth rate
Year GDP (%)
2011 (est.) 2%
2010 (est.) 2.1%
2009 (est.) -2.7%
GDP - per capita (PPP)
Year Rs.
2011 (est.) $37,600
2010 (est.) $37,000
2009 (est.) $36,500
GDP - composition by sector (2011 est.)
Sector GDP (%)
Agriculture 0.7%
Industry 21.7%
Services 77.6%

Population below poverty line - 15.2% (2007 est.)
Labor force - 5.177 million (2011 est.)
Labor force - by occupation (2007 est.)
Sector GDP (%)
Agriculture 2%
Industry 25%
Services 73%
Unemployment rate
Year GDP (%)
2011 (est.) 7.7%
2010 (est.) 8.3%
Unemployment, youth ages 15-24
Gender GDP (%)
Male 21.5%
Female 22.5% (2009)
Total 21.9%
FOREIGN INVESTMENT
Foreign investment contributed significantly to Belgian economic growth in the 1960s. In
particular, U.S. firms played a leading role in the expansion of light industrial and
petrochemical industries in the 1960s and 1970s. The Belgian Government encourages
new foreign investment as a means to promote employment. With regional devolution,
Flanders, Brussels, and Wallonia now have substantial autonomy in courting potential
foreign investors, as each deems appropriate.
Foreign direct investment totaled more than $36.7 billion in 2005. U.S. and other foreign
companies in Belgium account for approximately 11% of the total work force, with the
U.S. share at about 6%. U.S. companies are heavily represented in the chemical sector,
automotive assembly, and petroleum refining. A number of U.S. service industries

followed in the wake of these investments--banks, law firms, public relations, accounting,
and executive search firms.
Belgium is among the top 10 destinations for foreign direct investments (FDI) worldwide
Country $ bn
1. U.S. 95.9
2. U.K. 78.4
3. China 60.6
4. Luxemburg 57.0
5. Australia 42.6
6. Belgium 34.4
7. Hong Kong 34
8. France 24.3
9. Spain 18.4
10. Brazil 18.2
TRADE
About 75% of Belgium's trade is with fellow EU member states. Given this high
percentage, Belgium seeks to diversify and expand trade opportunities with non-EC
countries. Belgium ranks as the 11th-largest market for the export of U.S. goods and
services. If goods in transit to other European countries are excluded, Belgium ranks as
the 12th-largest market for U.S. goods.
EMPLOYMENT
The social security system, which expanded rapidly during the prosperous 1950s and
1960s, includes a medical system, unemployment insurance coverage, child allowances,
invalid benefits, and other benefits and pensions. With the onset of a recession in the
1970s, this system became an increasing burden on the economy and accounted for
much of the government budget deficits. The national unemployment figures mask
considerable differences between Flanders and Wallonia. Unemployment in Wallonia is
mainly structural, while in Flanders it is cyclical. Flanders' unemployment level equals
only half that of Wallonia. The southern region continues a difficult transition out of sunset
industries (mainly coal and steel), while sunrise industries (chemicals, high-tech, and
services) dominate in Flanders.

CH.4:- OVERVIEW OF DIFFERENT ECONOMIC SECTORS OF THE
ECONOMY
Value added Logistics
The Logistics Industry consists of European Distribution Centres, port operators,
stevedoring companies, major shippers and other logistics players.
For the sixth consecutive year, Belgium has been considered as the most suitable place
for investments in logistics and distribution (Cushman & Wakefield, European Distribution
Report 2009). The country’s infrastructure and skill-level as well as the IT opportunities it
affords make it the ideal location for a logistics base, headquarters or a distribution centre
from which to conquer the European market.
Reasonable costs (hire of storage spaces, purchase of land, labour costs), transport
systems (efficiency of the different resources), reachability of markets (including Central
Europe), well qualified workforce, and know-how (logistics, language knowledge, etc.) are
taken as the starting point for the ranking.
Chemicals
In addition to basic chemistry, the sector also includes plastics and rubber processing,
pharmaceuticals and biotechnology, cosmetics, soaps and detergents as well as paints
and varnishes.
Together all of these sub-sectors in Belgium represented a turnover of 45 billion euros in
2009 and added value of more than 10 billion euros. This represents one quarter of
industrial activity in Belgium. The sector employs 91,500 people. Employment in the
chemicals industry has stayed stable during the past twenty years. The number of jobs in
industry overall fell in the same period, with the logical consequence that the chemicals
industry’s share rose: from 13.6% in 1990 to 17.4% in 2009. Furthermore, 1 direct job in
chemicals generates 1.6 indirect jobs in other sectors. The chemicals industry is
therefore one of the most important sectors in Belgium.
Agrofood
The food industry is the second most important sector in the Belgian processing industry
after chemicals. Food companies are distributed throughout the country with
concentrations in Northern Kempen, South-West Flanders, the Ghent region, the region

south of Antwerp, the Verviers region and to the west of the Hainaut region. The sector
has 90,000 employees.
The 5,223 companies in the food industry together realise an annual rising turnover that
amounted to EUR 40 billion in 2009, with an added value of EUR 6 billion. These figures
represent more than 13% of the turnover of all industrial sectors together and around 2%
of the gross domestic product.
ICT – Software development
Driven by innovation, creativity, technological expertise and entrepreneurship, ICT firms
in Belgium have acquired European as well as global leadership positions.
In Belgium’s open business culture ICT companies can rely on a high-tech environment
well suited to the development of tomorrow’s technologies. This high density of ICT
businesses, research centres and knowledge clusters provides them with a stimulating
environment. This helps them greatly in taking the lead in their specific niche, for example
in innovative banking products.
Aeronautics
This industry groups activities like the development of technologies and new composite
materials for use in aircraft construction and propulsion, the development of a software
platform for virtual prototyping and optimisation, engine monitoring, terrestrial satellite
applications, etc.
Nuclear equipment and services
There are seven nuclear reactors in Belgium for commercial electricity production, four at
the Doel site and three at the Tihange site. The electricity production generated by these
nuclear reactors represents 55 % of the total electricity production on Belgian territory.
Renewable energies
Belgium has the goal of obtaining 13 %of its energy supplies from renewable energy by
2020
.As a result there is a strong impetus to invest in green or renewable energy from the
government but also from the business world. Companies and consumers can count on
different support measures from the government, both at federal and regional level.

The green technology sector grew by 25 %each year in recent years and despite a slight
slowdown due to the crisis, the sector is expected to have 40,000 employees by 2020,
ten times more than now. The jobs of installers and the operation of energy generation
itself are not included in this figure. Belgian technology companies are among the world
leaders in this sector and can benefit from these objectives.
Textile, woodworking and furniture industry
In 2009 the Belgian textile, wood and furniture industry realised a turnover of 10.5
billion euros, of which 71% was realised abroad.
The 2,430 companies of this industry employ more than 49,000 people and invested over
300 million euros in 2009. With an added value worth 2.6 billion euros and a positive
trade balance of 1.8 billion euros, the sector offers a major contribution to Belgium’s
prosperity.
Diamonds
In the diamond business, the city of Antwerp plays a role similar to that of New York in
international banking and finance. What New York is to the financial markets, Antwerp is
to the global diamond trade. Antwerp is the diamond industry’s primary business centre,
serving as headquarter for about 1800 diamond firms, which is the largest concentration
of companies anywhere in the industry.
The importance of Antwerp as a world diamond centre is partly due to the presence of
the biggest mining companies in Antwerp. De Beers Consolidated Mines Ltd brings
approximately forty % of global production.
The second biggest producer of rough diamonds, the Russian company Alrosa, has long
had a sales office in Antwerp. The Antwerp office of Rio Tinto Diamonds is the sales and
marketing office for Rio Tinto diamond production. BHP Billiton also sells rough diamonds
via its sales and marketing office in Antwerp.
As the diamond industry’s business centre, Antwerp also is its major service provider.
The world’s two largest diamond banks are headquartered in the city. Some transport
and insurance companies have specialised offices for diamond related activities in
Antwerp.

Nowadays, 80% of all rough diamonds in the world as well as 50% of all cut diamonds
pass through Antwerp. It is no surprise that the highest international mark of approval for
polished diamonds is the ‘Cut in Antwerp’ label.
Industrial Automation
Industrial Automation is an industrial sector with a horizontal nature because the industry
supplies products and solutions for the total value chain of diverse production companies,
ranging from “Factory Automation” (machinery construction, cars, assembly, etc) up to
“Process Automation” (chemicals, pharmaceuticals, foodstuffs, oil, etc.).
Industrial automation is crucial for the development of our companies in all segments of
the production and value chain. It ensures more efficiency, inexpensive production and
high-quality products in a strongly changing environment with an ever increasing number
of products adapted to the customer’s wishes.
The sector is strongly characterised by globally organised foreign manufacturers of
hardware and software products for industrial automation. This sector continues to
develop extremely quickly through the very widespread presence of these manufacturers
in our country, the relatively numerous engineering and integrator companies, rapidly
rising demand for newer and more highly performing solutions from our local production
companies and ever shorter PLCs (Product Life Cycles) in this type of high-tech product
for outsourcing this usually non-core activity in production companies.
CH.5:- OVERVIEW OF BUSINESS AND TRADE AT INTERNATIONAL
LEVEL
Belgium's economy depends on international trade. From year-to-year, foreign trade
accounts for approximately 70 % of the nation's economy. This makes Belgium
particularly sensitive to disruptions in global trade; economic problems like recession in
other countries often cause reciprocal problems in Belgium's economy. Fortunately, the
kingdom has a variety of trade partners so that problems in one export market are
mitigated by export diversity. For instance, since companies were able to shift exports to
other markets, Asia's economic problems in the late 1990s had little significant impact on
Belgium.
The nation's main trade partners are in the EU. In fact, in 1998 some 76 % of Belgium's
exports went to nations in the EU. In that year, the main export market for Belgian goods

was Germany (19 %), followed closely by France (18 %), the Netherlands (12 %), and
the United Kingdom (10 %). Most of Belgium's imports also came from the EU that
provided 71 % of the kingdom's imported products. Germany was the main exporter to
Belgium and provided 18 % of goods, while the Netherlands provided 17 %, France 14
%, and the United Kingdom 9 %. Total foreign investment in Belgium is $68.1 billion. The
Netherlands is the principal source of foreign investment (21.9 %), followed by Germany
(17.1 %), France (16 %), and the United States (11 %).
Exports constituted 81% of GDP in 2000. Belgium's chief exports are iron and steel
(semi-finished and manufactured), chemicals, textiles, machinery, road vehicles and
parts, nonferrous metals, diamonds, and foodstuffs. Its imports are general
manufactures, foodstuffs, diamonds, metals and metal ores, petroleum and petroleum
products,
chemicals, clothing, machinery, electrical equipment, and motor vehicles. Belgium is
partnered with Luxembourg in the BLEU. According to the Belgian government,
Belgium's imports in 2000 (as a percentage of overall imports) were as follows:
Principal exports of Belgium in 2000 (as a percentage of overall exports) were as follows:
Machinery and transport equipment: 29.0
Mineral fuels: 4.4
Food and live animals: 7.8
Food and live animals: 6.8
Mineral fuels: 8.8
Beverages and tobacco: 1.1
Raw materials, other than mineral fuels: 4.0
Belgium Trade, Exports and Imports
As raw materials and natural resources are not sufficient, the balance of trade is usually
towards imports and thus there is always some trade deficit in Belgium. According to the
2009 estimates, Belgium had an export volume of $296.1 billion and ranked 13th in the
world. This, however, showed a tremendous drop from the 2008 figures, which shone
bright at $371.5 billion.

COMPOSITION OF EXPORTS
COMPOSITION OF IMPORTS

CH.6:- PRESENT TRADE RELATIONS AND BUSINESS VOLUME OF
DIFFERENT PRODUCTS WITH INDIA / GUJARAT
Bilateral Treaties and Agreements: The agreements signed and in force between India
and Belgium are as under: Social Security Agreement in November 2006 (came into
force in September 2009); Agreement on cooperation in the field of Science &
Technology, November 2006; Agreement on Avoidance of Double Taxation (DTAA) –
August 1997; Bilateral Investment Protection Agreement (BIPA) signed between India
and BLEU in November 1997; Cultural Agreement- September, 1973; and Air Services
Agreement- April, 1967.
Economic and Trade Relations- Belgium has emerged as one of India’s important
trading partners in the EU. Trade in gems and jewelry constitutes over 75% of the
bilateral trade. India’s IT sector is well represented in Belgium, with all the big IT
companies having their establishments. Several Indian companies in the chemicals
sector have also established offices/warehousing facilities in Belgium, particularly near
the port city of Antwerp. Belgian business interests in India cover energy, ports, dredging,
construction, banking and finance, electronics and software, chemicals and fertilizers,
solar energy and biotechnology.
Bilateral Trade - Belgium is the second largest trading partner of India in the European
Union with annual bilateral trade turnover amounting Euro 10.4 billion in 2010. India is the
5th largest exporter to Belgium (after USA, China, Japan and Russia) and 2nd largest
importer of Belgian products in 2010 (after USA). The major items of Indian exports to
Belgium are - Precious stones; Textiles and garments; Iron and steel; Chemical products;
Mineral products; Organic chemicals; Machinery and Electrical Equipments etc. The
major items of Indian imports from Belgium are- Precious stones; Iron and steel;
Machinery and mechanical appliances; Chemical products; boilers, machinery and
mechanical appliances & parts thereof: Organic chemicals; Plastic and rubber; Plastics
and articles thereof; Pharmaceutical products etc. A MoU on cooperation in railway
sector has been agreed upon and is ready for signature. From €7.1 billion during 2009, it
has increased to €10.4 billion in 2010 marking a percentage increase of 46.5%. Indian
exports to Belgium increased from €2.6 during 2009 to €3.6 billion – an increase of
38.5%. The increase in Belgian exports to India has always been robust.


CH.7:-PESTEL ANANLYSIS
Political
Politics of Belgium takes place in a framework of a federal, parliamentary,
representative democratic, constitutional monarchy, whereby the King of the Belgians is
the Head of State and the Prime Minister of Belgium is the head of government in a multi-
party system. Executive power is exercised by the government. Federal legislative power
is vested in both the government and the two chambers of parliament, the Senate and
the Chamber of Representatives.
Constitution
The Constitution of Belgium, the primary source of law and the basis of the political
system of the Country, was established on February 7, 1831. It has been changed
several times, but the most relevant reforms were performed in 1970 and in 1993. In
1970, in response to a growing civil conflict between the Dutch-speaking and French-
speaking communities in Brussels, the Government declared that "the unitary state, its
structure and functioning as laid down by law, had become obsolete". The new
constitution recognised the existence of strong communitarian and regional differences
within Belgium, but sought to reconcile these differences through a diffusion of power to
the communities and the regions.
Head of state
The King of the Belgians is the constitutional head of the Belgian state and holds office
for life. The duties of the king are laid out by the Belgian Constitution and other laws
enforced under it.
As titular head of state, the King plays a ceremonial and symbolic role in the nation. His
main political function is to designate a political leader to form a new cabinet after an
election or the resignation of a cabinet. In conditions where there is a "constructive vote
of no-confidence," the government has to resign and the lower house of Parliament
proposes a new Prime Minister to the King.[1] The King is also seen as playing a
symbolic unifying role, representing a common national Belgian identity.
Economic
Belgium, a highly developed market economy, belongs to the Organization for Economic
Cooperation and Development (OECD), a group of leading industrialized democracies.

With a geographic area about equal to that of Maryland, and a population of 10.4 million,
Belgian per capita GDP ranks among the world’s highest. In 2006, the per capita income
(PPP) was $31,800. The federal government has managed to present balanced budgets
in recent years, but public debt remains high, at 94% at the end of 2005. GDP growth in
2006 was predicted to be 2.5%.
With exports equivalent to over two-thirds of GNP, Belgium depends heavily on world
trade. Belgium's trade advantages are derived from its central geographic location and a
highly skilled, multilingual, and productive work force.
The Belgian industrial sector can be compared to a complex processing machine: It
imports raw materials and semi-finished goods that are further processed and re-
exported. Except for its coal, which is no longer economical to exploit, Belgium has
virtually no natural resources. Nonetheless, most traditional industrial sectors are
represented in the economy, including steel, textiles, refining, chemicals, food
processing, pharmaceuticals, automobiles, electronics, and machinery fabrication.
Despite the heavy industrial component, services account for 74.6% of GDP. Agriculture
accounts for only 1.4% of the GDP.
Social
A discussion of Belgian culture requires discussing both those aspects of shared by the
regardless of what language they speak, and the differences between the main cultural
communities: the Flemish people from Flanders and the French-speakers from and —
although the grouping of Brussels and Wallonia as one cultural community is sometimes
rejected. Most Belgians view their culture as an integral part of European culture.
However, members of each of the two main linguistic groups generally make their cultural
choices from within their own community, and then, when going beyond, the Flemish
draw intensively from both the English-speaking culture (which dominates sciences,
professional life and most news media) and the Netherlands, whereas French-speakers
focus on cultural life in France and elsewhere in the French-speaking world, and less
outside.
Technological
The technological development of a country can be assessed by looking at the number of
universities & institutes in it the names of such institutes is given below in the form of a
list.

The Technology in Brussels, Flanders & Wallonia the central region of Belgium (Europe),
can be considered developed due to the presence of several universities and research
institutes in it.
Environmental
Belgium consists of three regions with policies adapted to each region.
Flanders
Flanders is a densely populated, dynamic region with a very fragmented landscape. For
this reason, wildlife is under a lot of pressure. Approximately half of its plants and animals
are on the 'Red List' an inventory of endangered species. The website of the Institute for
Nature and Woodland Research has more information about animals in Flanders with a
Red List for each species of animal.
The Brussels Capital Region
In spite of increasing urbanization, traffic and intensive economic activity, the Brussels
Capital Region has a number of rare species of animal. This rich fauna is, of course, very
vulnerable. A detailed information about animals and endangered species in the Brussels
Capital Region can be found on the website of the Brussels Institute for Environment
Management
Wallonia
The populations of numerous species of plant and animal continue to decrease in
Wallonia. Not only rare, but also common species are struggling to survive.
The serious decline of certain species is primarily the result of loss of natural habitat,
essential to their chances of survival. The Wallonia region’s environment portal offers
more information about the protection of endangered species and habitats

PART – II
INDUSTRY / SECTOR /COMPANY
SPECIFIC STUDY

ANALYSIS
OF
MACHINERY & TOOLS INDUSTRY

CH.1:- INTRODUCTION OF THE SELECTED COMPANY /INDUSTRY /
SECTOR AND ITS ROLE IN THE ECONOMY OF SPECIFIED COUNTRY
The MACHINERY & TOOLS SECTOR OF BELGIUM is further sub categorized in to two
divisions Viz.
1. Industrial Automation
2. Mechatronics
Industrial automation
Industrial Automation is an industrial sector with a horizontal nature because the industry
supplies products & solutions for the total value chain of diverse production companies,
ranging from “Factory Automation” (machinery construction, cars, assembly, etc.) up to
“Process Automation” (chemicals, pharmaceuticals, foodstuffs, oil, etc.).
Industrial automation is crucial for the development of our companies in all segments of
the production & value chain. It ensures more efficiency, inexpensive production & high-
quality products in a strongly changing environment with an ever increasing number of
products adapted to the customer’s wishes.
The sector is strongly characterised by globally organised foreign manufacturers of
hardware & software products for industrial automation.
Mechatronics
This sector, which combines & integrates tools engineering, electronics & information
technology, includes companies that offer products such as textile machinery,
gearwheels, agricultural & market gardening machinery, lifts, air conditioning systems &
fire extinguishers as well as services such as mechanical processing, conformity
inspections, ship maintenance & environmental engineering.
The continuous pursuit of high-tech R&D is the characteristic & future of this sector.This
is why mechatronics companies cooperate with other knowledge & research centres such
as FMTC (Flanders Mechatronics Technology Centre), which is developing as a
knowledge centre at European level, but also the Marshall (economic stimulus) plan
MecaTech centre in Wallonia.

FMTC was founded by Agoria, the Belgian technology industry federation, & the most
important Belgian mechatronics companies. The member companies & the Flemish
government are investing together in this unique project (EUR 16.5 million in the next 4
years). Mechatronics companies exchange knowledge & expertise in this research centre
& also pool their innovative forces so that the individual investment cost for R&D per
company is reduced & more innovative results are achieved simultaneously.
The sector’s strengths
1. Speed
As a result of global competition companies in the sector are obliged to
respond quickly at the level of product development, production & the supply of
new products.
Creativity & a strong organisational capacity mean that Belgian companies play
an important role at the global level.
2. Proximity
The sector exports 75% of its production. 70% is destined for the surrounding
European market, which means that our companies are ideally located as a
result.
3. Complexity
Belgian machinery builders belong to the world leaders as regards production
& development of complex products & services.
4. Knowledge
The concentration of technological knowledge in internationally valued
research centres & companies together with multi-technological training of our
engineers make Belgium an attractive investment region.
The sector can pride itself on a strong federation Agoria Mechatronica & SIRRIS, which
was founded by Agoria & which is the collective knowledge center for the Belgian
technological industry. Agoria Mechatronica plays an important role in asserting the
interests of the sector in general & specially in the area of R&D at a European level

Some important companies:
LVD Company NV
Case New Holland (CNH) Belgium SA
Caterpillar inc.
Picanol NV
Atlas Copco Belgium
Hansen Transmissions International NV
Vande Wiele Group NV
Ensival-Moret Belgium
Punch International NV
N.V. Bekaert S.A. is an industrial company, which is one of the BEL20 (benchmark 20)
companies in the index for the Euronext Brussels stock exchange. The company
specializes in advanced metal transformation & advanced materials & coatings. In 2004,
it generated sales of over 2.7 billion € in 120 countries.
The company has three divisions:
advanced wire products
advanced materials
advanced coatings
Saluc S.A. is a Belgian speciality manufacturing company. Founded in 1923, they
are best known for their Aramith brand billiard, pool & snooker balls, & are the
manufacturer under license of the Brunswick Centennial pool ball line. The
company also manufactures other sorts of balls & bearings with high tolerances for
a wide variety of industrial & consumer-product applications, such as Logitech
trackballs.

MACHINERY AND TOOLS SECTOR IN BELGIUM
The machine tool industry is an important one in maintaining the manufacturing
activities in Belgium. Due to its R&D generated solutions, industrial sectors like
automotive, aerospace,
power generation, medical products and general engineering can produce more
efficiently, faster, cheaper and more environment friendly. Figures supplied by the
European Committee for the Co-operation of the Machine Tool Industries
(CECIMO) indicated that Europe was dominating the global machine tools market
with the 15 CECIMO countries contributing around 52% of the worldwide value of
machine tool production in 2003. Hence, this sector has been making an important
contribution to the European economy.
The machine tool sector aims at making the European Union the most competitive
economy in the world. Agoria, the federation of the Belgian technology industry,
also represents the importers and manufacturers of machine tools, robots and
cutting tools. Most of them are independent companies that import and supply
machine tools for sheet metal and metal removal processes, robots, (carbide)
tools, software and equipment for measuring and automation projects. Generally,
they also provide for installation, service and maintenance, which is a significant
advantage.
COMPANIES IN MACHINERY AND TOOLS SECTOR IN BELGIUM
Bekaert
Bekaert is a world market and technology leader in steel wire transformation and
coatings. Bekaert is a global company with headquarters in Belgium, employing 27 000
people worldwide. Serving customers in 120 countries, Bekaert pursues sustainable
profitable growth in all its activities and generated combined sales of € 4.4 billion in 2012.
It is famous as a supplier of steel cord products for tire reinforcement and Dramix steel
fibers, used to reinforce over five million cubic meters of concrete every year.

Martek
Martek has been providing quality tools and service since 1991.
For custom semi or fully automated process solutions, process integration, and other
activities, Martek provides High quality services and equipment and cost effective
solutions to the manufacturing needs.
It has automation experience in the Semi-Conductor, Automotive Electronics and Medical
and Consumer Products Industries
Thermote & Vanhalst
TVH - Thermote & Vanhalst is a Belgian company in the fork lift truck market.
The company is a global player in the distribution of lift trucks and the sales of forklift
spares. It earned a revenue of €475 million in 2007 and employes 2200 people. The
international company has its head office in the West-Flemish city of Waregem in
Belgium. TVH was founded in by Paul Thermote and Paul Vanhalst, both originating from
an agricultural family. It is currently being managed by the second generation.
INDIAN MACHINE TOOLS INDUSTRY
The Machine Tools industry in India commenced since the Second World War. A few
British engineering firms began manufacturing in India. Then began the industrialization
in a series of five-year plans. This resulted in a second phase of machine tools
manufacturing with public sector investment in machine tools (HMT Ltd. 1953). The 1960
ushered the third phase during which the range of products witnessed rapid growth and
various types of machine tools were manufactured. (Gear Cutting Machines, SPMs,
Presses, etc.). The Fourth Phase began in the mid-1980s in which the Japanese
machine tools makers entered the Indian market through licensing arrangements (Mori-
Seiki, Mitsubishi, Hitachi-seiki, etc.).
The fifth and current phase began in the early nineties after the liberalization of the Indian
economy. With market share of the bigger companies increasing and the public sector

giants reducing, the in-house designing, entrepreneurship, better technology, operational
flexibility, resulted in a significant shift in machine tools production to the medium sized
companies. However, these companies produce machines of higher capacity in small
numbers.
In India there are about 450 manufacturers manufacturing complete machines, or their
components. There are 150 units in the organized sector. Almost 73 percent of the total
machine tools production in India is contributed by 10 major companies in this industry.
The industry has an installed capacity of over Rs.10 billion and employs a workforce
directly or indirectly totaling 65,000 skilled and unskilled persons. The hub of
manufacturing activities is concentrated in Mumbai and Pune in Maharashtra, Jalandhar
and Ludhiana in Punjab, Ahmedabad, Baroda, Jamnagar, and Rajkot in Gujarat,
Coimbatore and
Chennai in Tamil
Nadu, Bangalore
and Mysore in
Karnakata, and
some parts of
eastern India.

ROLE OF TECHNOLOGY, R&D AND DESIGN IN INDIAN MACHINERY
SECTOR
Source: CMIE, Industry Market Size and Shares, February 2005
The role of R&D in the sector in India is to solve problems that arise in manufacturing
since they cannot be solved on the shop floor and that requires special skills too.
In India, except for the top players, it is a segmented sector and the marketing and after
sales services are at times outsourced in some companies.
SALES AND EXPORTS OF DOMESTIC COMPANIES

EXPORTS
Source: CMIE, Industry Market Size and Shares, February 2005
There has been a marked change in the image of the “Made in India” brand in overseas
markets particularly for Indian made machine tools.

DATA OF A COMMON EXPORT IN MACHINE TOOLS SECTOR
Commodity: 84589990 ALL OTHER LATHES EXCL CENTRE LATHES Unit:
NOS


COMPANIES IN THE MACHINERY AND TOOLS SECTOR IN INDIA
HMT Limited, formerly Hindustan Machine Tools Limited, is a state-owned manufacturing
company under the Ministry of Heavy Industries and Public Enterprises in India
Hindustan Machine Tools was incorporated in 1953 by the Government of India as a
machine tool manufacturing company. Over the years diversified into watches, tractors,
printing machinery, metal forming presses, die casting & plastic processing machinery,
CNC systems & bearings. HMT is headquartered at Bengaluru ( Bangalore ).
PMT was started in 1961 as Traub India a subsidiary of Traub Germany. The company
later absorbed technologies from various German and Swiss machine tool companies
like Voumard, Fortuna, Mikrosa, Pittler to manufacture world class Turning and Grinding.
The company now is in the business of providing complete solution to its customers
machining problems rather than just stand-alone machine tool. PMT products include
Automats, CNC Turning, CNC Internal Grinding, CNC Cylindrical Grinding and CNC
Surface Grinding Machines and Special purpose machines in Turning and Grinding.
The company also supplies precision components to critical industrial sector which
includes Power, Windmills, Railways, Oil and Gas, Gear boxes, Dies and Moulds etc.

MANUFACTURING AND MACHINE TOOL SECTOR IN GUJARAT
Indian manufacturing sector has engineering segment as the main constituent. It is
divided into heavy and light engineering. Europe, Asia and Middle East are the largest
export destinations of India contributing over 60% of the overall engineering exports.
SIZE OF KEY ENGINEERING SEGMENTS
Source: CMIE, Industry Market Size and Shares,
EXPORTS BY SEGMENT IN 2011

Gujarat – a key engineering manufacturing center in India
The sector contributes around 18% to total industrial production in Gujarat. Gujarat
contributes about 9% to national engineering output. Gujarat houses around 30
engineering clusters and about 5000 engineering factories which are in and around these
clusters, in Gujarat.
ENGINEERING EXPORTS

Key Factors for the engineering and machinery sector in Gujarat
1. Strong Demand
(i) Power
Gujarat is the only power surplus state in the nation. Further the
power generation capacity is to be increased to 30,000 MWatt by
2020.
(ii) Infrastructure
The Blueprint for Infrastructure in Gujarat 2020 includes
development with an investment of Rs 10,29,177 crores across
18 infrastructure sectors in Gujarat.
Gujarat has highest number of ports, 41 minor and 1 major port,
connected to all global ports, 16 domestic airports and 1
international airport, excellent road-rail connectivity, only state
having state-wide integrated gas grid of 2500 km.
(iii) Manufacturing
Textile, cement, oil and gas, mining, and other sectors have lead
to greater local demand for machine tools and machinery.
2. Foreign investments and technology transfer agreement in the sector
Engineering and manufacturing sector attracted investment worth Rs 4481
crore during the period of 1991 to 2011 thereby contributing to 12.66% of
the overall FDI in Gujarat during the same duration of time.

FDI IN GUJARAT DURING 1991 TO 2011
The sector contributes to about 59.31% of total foreign technology transfer
agreements.
FOREIGN TECHNOLOGY AGREEMENTS IN GUJARAT

How to set up a business firm in Belgium?
Forms of business entities which can be started as per the Belgian law
Foreign investors are free to operate through any business entity recognized under
Belgian law. There are numerous types of company forms (including partnerships, co-
operatives & temporary consortia). Foreign companies generally use the subsidiary &
branch form. A foreign subsidiary in Belgium generally takes the form of an SA/NV
(société anonyme/naamloze vennootschap – limited liability company), but some
companies use the SPRL/BVBA (société à responsabilité limitée/besloten vennootschap
met beperkte aansprakelijkheid – private limited liability company). A partnership can be
set up as an SNC/SOF (société en nom collectif/vennootschap onder firma) or as an
SCS/Comm.V. (société en commandite simple/gewone commanditaire vennootschap).
The partners in an SNC/SOF are jointly liable for the activities of the partnership; liability
may be limited to the contribution of each partner in an SCS/Comm.V.
In addition to the difference in share capital (which is higher for an SA/NV), the main
difference between an SA/NV & an SPRL/BVBA is that the latter is essentially based on
“a relationship of trust” among specific associates. For this reason, the shares of a private
limited liability company are registered shares & their transferability is restricted (e.g. the
other shareholders have pre-emptive rights to purchase any shares). Previously, shares
in a limited liability company could be bearer shares, so shareholders could remain
anonymous. However, as from 1 January 2008, SAs/NVs may not issue new bearer
shares. Owners of unlisted bearer shares, which generally are issued by most NV/SA
companies, must convert these into registered shares or dematerialized shares before 31
December 2013, taking into account the tax due upon conversion of the shares. This tax
applies to both listed & unlisted companies & is set at 1% when converting shares in
2012 & 2% when converting shares in 2013.
Customs Duty on Imported Goods.
Introduction
The concept of import duty is very wide & is almost applicable to every product or item
imported to India barring a few goods like food grains, fertilizer, lifesaving drugs &
equipment etc. Import duties form a significant source of revenue for the country & are

levied on the goods & at the rates specified in the Schedules to the Customs Tariff Act,
1975.
Import through water ways
Territorial water extends up to 12 nautical miles into the sea from the coast of India & so
the liability to pay import duty commences as soon as goods enter the territorial waters of
India. No duty is liable on goods which are in transit in the same ship or if goods are in
transit from one ship to another.
Basic duty
Basic Duty is a type of duty or tax imposed under the Customs Act (1962). Basic
Customs Duty varies for different items from 5% to 40%. The duty rates are mentioned in
the First Schedule of the Customs Tariff Act, 1975 & have been amended from time to
time under the Finance Act. The duty may be fixed on ad –valorem basis or specific rate
basis. The Central Government has the power to reduce or exempt any good from these
duties.
Additional customs
Additional duty also known as countervailing duty or C.V.D is equal to excise duty
imposed on a like product manufactured or produced in India. It is implemented under the
Section 3 (1) of the Indian Custom Tariff Act. The Government has exempted all goods,
when imported into India for subsequent sale, from the whole of the additional duty of
customs leviable thereon under Sub-Section (5) of Section 3 of the Customs Tariff Act
vide Customs Tariff Notification No. 102/2007 dated 14th September 2007. However, the
importers will be first required to pay the said duty & thereafter required to claim the
refund.
Recent High lights
India set to ban import of used plant & machinery
The government will soon restrict import of used plant & machinery, a move aimed at
safeguarding the productivity & competitiveness of Indian manufacturers.
A panel headed by cabinet secretary AK Seth has decided to ban import of machinery
more than five years old. "The big worry is that such imports would impact overall
productivity & erode competitiveness of the manufacturing sector," said a government
official privy to the development.

The domestic capital goods industry says imports are partly responsible for the drop in
output; a contention supported by government data that showed production of capital
goods contracted 4.1%
Data on Tuesday showed the sector contracted by as much as 16% in April. The
government is also considering an import duty on 75% of the original value of machinery,
which will drive up costs for importers. At present, the duty is levied on the value of
machinery on the day.
India’s Export Controls: Current Status & Possible Changes
Recent developments in India’s non-proliferation policies could have significant
implications for companies that trade in goods & technologies with potential applications
to weapons of mass destruction (WMD), missiles, & conventional arms (known
collectively as “strategic items”). In an effort to facilitate greater access to advanced
technology products (ATP), India is currently seeking membership in the four main
multilateral export control regimes (MECRs) – the Nuclear Suppliers Group (NSG),
Australia Group (AG), Missile Technology Control Regime (MTCR), & Wassenaar
Arrangement (WA). As part of this effort, the Government of India (GOI) has already
begun to take marked steps to align its trade control system with the guidelines &
practices of the regimes, including amending relevant laws, updating its national control
list, & modifying its licensing procedures. This brief will provide an overview of the Indian
export control system, summarize recent developments, highlight areas where India’s
national control list differs from the MECR lists, & identify potential changes to India’s
strategic trade control system that industry might expect in anticipation of India joining the
MECRs.
Overview of India’s Export Control System
Legal Authorities
The Foreign Trade (Development & Regulation) Act No. 22 of 1992 or FTDR (as
amended by the FTDR Amendment Act 2010)1 is the principal legal basis for India’s
strategic trade control system. It empowers the GOI to “make provisions for prohibiting,
restricting, or otherwise regulating” all or specified classes of exports or imports upon
public notification in the Official Gazette.1 It further authorizes the Indian government to
formulate & amend India’s foreign trade policy, which the GOI issues in five-year

increments & updates annually (Foreign Trade Policy 2010-2011). The FTDR empowers
the Directorate General of Foreign Trade (DGFT), situated within the Department of
Commerce & Industry (DCI), to license the export & import of items on the Indian Tariff
Classification (Harmonized System) or ITC (HS) list.
Recent Developments
Over the past several years, the Indian government has focused on strengthening
bilateral relationships & obtaining greater access to high technology goods & services. It
has signed a variety of nuclear agreements with a range of countries in order to expand
its growing civil nuclear capabilities & facilitate bilateral trade in controlled commodities.
After receiving a waiver from the NSG in 2008, India is now seeking full membership in
the NSG & the other multilateral export control regimes, & there appears to be a
groundswell of international support. Indeed, the United States, Germany, Russia,
France, & the UK are all advocating Indian admission & appear committed to ensuring
increased strategic trade with India into the future. India’s broader policy initiatives &
bilateral arrangements have prompted modifications to parts of its strategic trade control
system.
In recent months, the GOI has amended & updated the statutory basis for India’s
strategic trade controls & released a new version of its national control list & licensing
procedures. In August 2010, the Indian parliament passed the Foreign Trade
(Development & Regulation) Amendment Act of 20 August 2010 (FTDR Amendment Act
2010). The act incorporated the provisions of the WMD Act (2005) into the FTDR (1992),
which expanded the scope of control on strategic trade in India. The FTDR Amendment
Act 2010 extended the definition of exports & imports within the FTDR to include
“services” & “technologies,” which were previously identified only in the WMD Act.
India subsequently issued an updated control list & a streamlined application for the
export of SCOMET items. In March 2011, under the authority of the FTDR Amendment
Act 2010, the DGFT released a new version of the SCOMET list in the annexure to DGFT
Notification No. 38 (RE-2010)/2009-2014. The DGFT also issued a revised & simplified
export license application form (Aayaat Niryaat Form 2E - ANF 2E) with the release of the
“new” control list.
India’s Multilateral Export Control Regime Membership: Potential Implications for
Industry
India’s quest to join the multilateral export control regimes likely will involve further
revisions to its trade controls, & industry should prepare for these possible changes in
upcoming months. If India intends to join the regimes, then it will be necessary for the

GOI to implement all of the regime guidelines into its domestic controls & fully harmonize
its national control list with those of the regimes.
In order to make a more compelling argument to the Wassenaar Arrangement, the Indian
government may expand the scope of its technology transfer & brokering controls to
apply to conventional arms-related as well as dual-use activities.
Import / Export Restrictions / Prohibitions under Customs law
Under sub-section (d) of section 111 & sub-section (d) of Section 113, any goods which
are imported or attempted to be imported & exported or attempted to be exported,
contrary to any prohibition imposed by or under the Customs Act or any other law for the
time being in force shall be liable to confiscation. Section 112 of the Customs Act
provides for penalty for improper importation & Section 114 of the Customs Act provides
for penalty for attempt to export goods improperly. In respect of prohibited goods the
Adjudicating Officer may impose penalty up to five times the value of the goods. It is,
therefore, absolutely necessary for the trade to know what are the prohibitions or
restrictions in force before they contemplate to import or export any goods.
India’s Political, Economic, Social and Environmental Situation
1. The Political Situation
With more than 655 million registered voters out of its one billion population, India is the
world’s largest democracy. For four decades, the Indian political system has been
characterized by the dominance of the Congress Party which led the Independence
movement in the early 20th century. Since the 1990s, Indian democracy has increasingly
developed towards a multiparty competition with the two largest national parties, the
Bharatiya Janata Party (BJP) and the Congress party, heading multiparty coalitions at the
Centre.
India is the warrant of stability in the chronically unstable South Asian region. Its
relationship with Pakistan is evolving positively and the ‘composite dialogue’ launched in
early 2004 has clearly decreased tension; however, it remains a central element of
uncertainty. India’s relationships with Nepal, Bangladesh and Sri Lanka are closely linked
to the domestic situation in these countries as they affect India’s own security. The
process of integration in the South Asian
India has increasingly asserted itself on the international stage, seeking greater
presence in multilateral institutions, for example through its campaign for a permanent

seat in the UN Security Council. The role of the powerful Indian Diaspora (US, UK, Gulf)
weighs heavily on India’s foreign policy.
India shares its commitment to a multi-polar world system with Russia and China, with
whom it shares a common vision on many international issues such as non-interference
in domestic affairs. The traditional close friendship with Russia is maintained, and
relations with China are growing politically and economically. India is implementing a
‘Look East’ policy, underpinned by economic considerations, towards its eastern
neighbours in ASEAN, of which India is a full dialogue partner.
2. The Economic Situation including Trade
The economic reforms undertaken at the beginning of the 1990s have helped India shift
towards an average annual growth rate of 6.5% in the past decade. In moving from its
previous socialist policies to a more open market-oriented model, India has become a
fast growing economy.
The main policy shift was initiated in 1991 and this continues to bear fruit. Still,
weaknesses and contradictions persist, with a large unfinished agenda that needs to be
tackled to maintain India’s success.
Despite the strikingly rapid growth in the services sector over the last decade, India is
still
heavily reliant on agriculture and effects of the monsoon. While the share of agriculture in
GDP has fallen from nearly 40% of GDP in 1980-1 to less than one quarter of GDP, the
sector employs about 65% of the Indian workforce. Therefore, rural reforms are crucial to
eradicating poverty
2. India’s Policy Agenda
1 Political agenda
Externally, two main challenges stand out for the successive coalition governments since
the beginning of the 1990s. The first is the continuation of economic reforms, external
opening and liberalization to accelerate economic growth, while at the same time keeping
promises of social and economic improvement for the majority of the people.
The second is the pursuit of a constructive foreign policy, in particular vis-à-vis the
country’s South Asian neighbours. Regional stability in South Asia is and will probably
remain a priority in India’s foreign policy. India’s role in the region has been internationally

acknowledged. The dialogue with Pakistan and with China and the pursuit of the ‘Look
East’ policy towards its East Asian neighbours will be on the agenda of the next decade.
OPPORTUNITIES FOR TRADE IN GUJARAT
We cannot promise you the moon, but we promise you the platform from where, you can
reach the heights of success – CM Narendra Modi
Gujarat, the Growth Engine with Business Resources, offers tremendous Opportunities
for Investment as it is the most preferred location for Industrial Investment in the Country.
It is the home for Dynamic Industrialists and Business Entrepreneurs.
Several factors influence Investment Opportunities in Gujarat depending on Investment
Environment:
Availability of Natural Resources
Gujarat is rich in its mineral base. It has a sharp growth in Agriculture at 9.6% expansion
in farm production. A ‘petro capital’ State with Industry depending on availability of natural
resources which are in abundance in the state.
Manpower
Gujarat excels in skilled manpower. Gujarat has amongst the least Mondays lost – 0.6
per cent of the country’s total.
Some of the India's premier institutes are located in Gujarat
Indian Institute of Management (IIM) for Management
Indian Institute of Technology (IIT) and DAIICT for Technology
NIFT and NID for Fashion & Design
Nirma and Gujarat Knowledge Society (GKS) for Knowledge
MICA for Communication
CEPT for Architecture
IRMA for Rural Management

NIPER for Pharmaceutical
Pandit Deendayal Petroleum University for Petroleum
Technical and Skilled Workforce
Need based short-term courses in existing institutions
Establishment of extension centers at Industrial Estates/SEZ/Industrial park/Clusters
Anchor institutes in identified areas
54 Engineering and 106 Diploma Engineering colleges offer over 17000 & 25000
respectively
441 vocational training institutes (Industrial Training institutes (ITI's)) offering 87981
seats every year for semi-skilled manpower
Over 7 lakh students graduate every year
Economy Attractions
At a time of the World Economy melt down, Global Investors envisage for safer
Investments and fetch assured returns. Investors look towards India and Gujarat has

been a preferred Investment Destination with Vibrant Gujarat Summit MoUs signed to
overwhelming response with a whopping 12 lakh Crores.
Stable Leadership and Growth Policies
With a Stable Leadership and Business environment, Gujarat is recognized as a front
runner in proactive Governance with its progressive policies and incentives. Being among
the first states to establish reform-oriented policies has been a vital factor for creating a
conducive environment for investors. Gujarat has further launched specific policies that
cater to the development of sectors such as ports, roads, biotechnology, IT, agriculture
and minerals.
Enhancing Investment
There is specific intervention across sectors which would facilitates in fostering significant
growth. The IRs and SIRs are steered for ‘Model for Growth.’ The DMIC (Delhi-Mumbai
Industrial Corridor) is strategically planned Project of the Government covering 1483 kms,
of which, 546 kms long route covers Eighteen (18) Regions of Gujarat. Gujarat
Government has incredible development plans under this Project
Investment Share & Implementation of Projects
Investment in Gujarat counts a major share in India’s Investment ratio. In last five years,
Gujarat’s Development share is 10.30% and as per RBI survey (2008), 22 percent
Investments opportunities are envisaged for 100 projects with over Rs.62.442 Crores
Investment which lead to 15 Billion $US, rating Gujarat as One State in India.

Top Investment in Gujarat – 22%
Maharashtra 12.7%
Orissa 10.9%
Andhra Pradesh 8.5%
Chattisgarh 6.2%
Karnataka 3.7%
Other States 30.5%
Gujarat also projects 50 percent actual implemented Projects, making it the most
industrialized envisaged Investment Opportunity Hub through the Vibrant Gujarat
Summits. In a span of 17 years from 1991-2008, Gujarat gave a share of 12.91 percent
Projects with over 125.03 Billion Dollars as compared to other states
Conducive Business Environment
A long and ancient history of maritime trade across the world
A unique combination of culture and world-class pro-business environment which
rewards risk and breeds entrepreneurship
A multi-lingual workforce
A concentration of corporate and financial resources
A pool of wealth creators and major stakeholders across various industrial sectors
137,617 km of road network
5,188 km of railway network
2,200 km gas grid
1 International Airport, 6 Domestic Airports and 6 Air-strips 23 power plants
Gujarat is well-connected to major cities in the USA, EU, Asia and other Indian
metropolitan cities

MoUs
Gujarat has opened doors far and wide to embrace Multinational Companies and
Foreign Investors with the implementations of various development schemes.
Gujarat’s strong Political will and business expertise of the Leaders of the State
have shaped Investment Friendly policies to unleash the potentialities of Gujarat
Vibrant Gujarat’ theme was conceived and the two Vibrant Gujarat Global
Investors’ Summits in 2003 and 2005 together garnered 302 investment proposals
to the tune of Rs 1,72,000 crores (USD 38 Billion) – the snowball effect of which is
now being witnessed
In 2007, the two-day event which was attended by business tycoons and CEOs of
the Indian and global corporate world resulted in signing of 363 MOUs
(Memorandum of Understanding) and an investment inflow of USD 102 Billion.
These investments are across several sectors and hold a promise of direct
employment generation to over 13 lac people
Vibrant Gujarat Global Investor’s Summit 2009 touched the golden heights with
spectacular success. The Summit inked 8662 MOUs worth Rs. 12,000 Billion($243
Bn) generating 25 Lac employments

Conclusion
Following are the various inferences that we found out while doing this report
Indian machine tools are currently exported to over 50 countries; the major ones
being the United States, Italy, Germany, the SAARC countries and the Middle
East.
There is positive sentiment among the investors while investing in Heavy
Machinery sector in Belgium.
Belgium has one of the most open economies in the world as a result of its
economic integration & interdependence with its three main neighboring countries
– France, Germany & the Netherlands.
The Belgian government welcomes foreign investment (including wholly foreign
ownership of a company), & there are only limited circumstances in which the
government may block an investment. Once established, a foreign-owned
company is treated in the same way as a Belgian-owned company. Belgium’s tax
incentives tend to favor new service industries & high-tech companies.
The EU-India Economic Cross-Cultural Programme (EICCP) has promoted and
supported links and partnerships between EU and Indian civil society
organizations, with the aim of strengthening and enhancing civil society networks.
The EU-India Joint Declaration on Cultural Relations, adopted at the 2004 EU-
India Summit, expresses satisfaction with the EICCP, and states the mutual
objective to continue this collaboration with “new and articulated forms of
cooperation”, believing that it is a significant instrument for reciprocal exchange of
experiences and for deeper understanding. EICCP was resumed and extended
based on the Joint Communiqué of the second EU-India summit in 2001, in New
Delhi.
Gujarat, the Growth Engine with Business Resources, offers tremendous
Opportunities for Investment as it is the most preferred location for Industrial
Investment in the Country. It is the home for Dynamic Industrialists and Business
Entrepreneurs.
Thus we can conclude that there is a tremendous potential for increasing the trade
between Belgium and India in terms of Machine Tools Sector.

ANALYSIS OF
GLASS INDUSTRY

CH.1:-INTRODUCTION/ ROLE OF GLASS COMPANY IN BELGIUM
1. Introduction
Glass is a very significant material in everybody’s life. It is normally used every day in
many different areas. Its most significant uses in terms of quantity are listed below:
packaging (containers for foodstuff and beverages, pharmaceutical glass, etc.); building
(windows, safety glass, safety glass, mirrors, etc.); Automotive (glazing, illumination, etc.);
Glass thread for insulation; strengthening fibres for composite materials; Household glass
(crockery, ovenware, furniture, etc.)
Subsectors of Glass Industry
Flat Glass
Flat glass financial records for roughly a third of total EU glass manufacture and the most
common manufacture process is the float method, which gives a better-quality product.
The order for flat glass is directly inclined by customer demand for vehicles and
commercial construction and lodging (especially glazing).
Domestic Glass
In commonplace with most sectors of the glass industry the domestic glass sector is an
well-known business that experience modest long-term growth in demand. Examples of
domestic glass include foodstuffs such as ovenware (cookware and heat resistant
crockery), drinking glasses and giftware.
Rein forcement fibres (continuos filament glass fibre)
The manufacture of continual filament glass fiber is one of the smallest sectors of the glass
industry in terms of tonnage, but the foodstuffs have a relatively high value to mass ratio.
Special Glass
The special glass are the glass used in manufacturing products like lighting glass,
cathode-ray tubes, and specific scientific and medical items such as optical glass and
pharmaceutical tubing glass.

2. Production
Since 2000 the quantity of total glass production in the EU has been broadly flat, with the
EU15 producing 30-31 million tons (mt) each year between 2000 and 2007. though, there
are variations in the performance of sub-sectors. The level of manufacture increased to
around 35 mt following the attainment of 10 new Member States in 2004, but remained at
around that level in the following years.
Graph 1.1 Total EU Glass Production
Graph 1.2 EU27 Glass Production By Graph 1.3 EU27 Glass Output By
Region (2007) Sub-Sector (2007)
3. Employment
Globalization and the difficulty of staying in the International market with high quality
articles at low prices is forcing the European glass industry to reduce its costs and, at the
same time, increase its productivity. The result is—that in a situation with stagnant
productive growth—the number of employees per tonne of glass produced gets lower and
lower. In 2008, the glass industry employed about 214,179 people, with a decrease of - 6.6
% compared to 2007. However, this reduction was especially prevalent in the UK, which, in
2008, registered a loss of almost 6,000 jobs (- 43 %), whereas the Czech Republic
witnessed a loss of almost 5,500 jobs (- 20 %). Countries such as Germany, Spain and
France were stable, while others countries such as Italy (+ 6 %), the Netherlands (+ 9 %)
and Belgium (+ 2 %) registered a positive trend. In Figure 5, it is possible to see employee
distribution in EU-27.
4. Key Market Segments
The world flat glass market is expected to record 3% annual growth between 2012 and
2015, reports Koncept Analytics. The building construction industry represents the
largest single end user for flat glass, followed by automotive applications. The EU, the US
and China dominate the global flat glass market. The global glass fiber sector has
benefited from economic recovery driving demand since 2010, reports Industry Experts.
By 2020, smart glass for use in transportation and architectural facades, privacy screens
and windows is expected to reach a value of $700 million.
5. Regional Market Share
There are around 2,000 glass companies operating in the US glass and glass product
manufacturing market. These outfits generate combined yearly revenue of $20 billion,
according to research from First Research. Owens-Illinois, Corning, Guardian and PPG
are among the leading companies.
6. Industry Leaders
Leading companies currently operating in the global glass manufacturing industry include
Jiangsu Farun Group in China, French outfit Compagnie de Saint-Gobain, and Japan’s
Asahi Glass.
7. Market Outlook
The world glass manufacturing market will record strong growth in coming years, fuelled by
technological innovation that should lead to a higher number of flat glass applications.
Rising levels of activity in the global automobile industry will also fuel demand for flat glass.

In addition, Koncept Analytics predicts that changing government legislation making flat
glass mandatory in certain situations for energy conservation purposes will also boost
market growth. Developments in the area of PV technology continue to lead to every
widening PV use, also driving use of flat glass.
8. Leading Industry Associations
Glass Association of North America
Glass Manufacturing Industry Council
All India Glass Manufacturers’ Federation
9. Innovation and challenges for the future
For the future, the glass industry will need to be able to provide superior products with
unique properties that are more desirable than the products made from other materials and
developing countries. This will require the development of new process technologies that
reduce production costs and enhance desirable characteristics.

CH.2:-INTRODUCTION OF SELECTED COMPANY /INDUSTRY /SECTOR
ASAHI GLASS CO. LTD.
PROFILE
Asahi Glass Company (AGC) shatters the conventional image of glassmakers. The
world's #1 maker of flat glass also claims the top spot in automotive glass, plasma
display panel substrates, and fluorinated resins. Glass for construction, solar, automotive,
and other applications account for half of AGC's overall sales. The company's Electronics
and Display division makes high-purity silicon carbide, electronic components, and
synthetic quartz glass for semiconductors and glass substrates, and its Chemicals unit
makes soda ash, caustic soda, and other specialty chemicals. Subsidiaries include US-
based AGC America and AGC Glass Europe. It operates mainly in the Asia/Pacific region
as well as the US and Europe
Based in Brussels, AGC Glass Europe produces processes and distributes flat glass for
the construction (external glazing and interior decorative glass), the automotive (original
& replacement glass) and the solar sectors. It is the European branch of AGC Glass, the
world's largest producer of flat glass.
Its baseline “Glass Unlimited" reflects the possibilities offered by:
glass as a material to meet a growing variety of needs (comfort, energy control,
health & safety, aesthetics, sustainability);
innovation in products and processes, derived from continuous research in
advanced glass technology;
over 100 sites throughout Europe, from Spain to Russia;
a worldwide marketing network;
Its 50,000 employees focused on the Customer.
VISION
We will shape the future of glass with innovative & affordable solutions to improve
people’s everyday life.

OUR VALUES
All members of AGC share the same four values in carrying out their mission of “Look
Beyond to make the world a brighter place”:
Innovation & Operational Excellence
Diversity
Environment
Integrity
MAJOR LOCATIONS ARE:-
EUROPE
AMERICA
ASIA
JAPAN
INDUSTRIAL FACILITIES
AGC Glass Europe has industrial facilities throughout Europe, and from Spain to
Russia,
With 37 float glass plants located throughout
Europe (20), North America (4) And Asia (13).
10 automotive glass processing centres
And more than 100 distribution/processing units.
AGC Glass Europe employs some 15,000 people
PRODUCTS
Construction industry (all types of building)
Automotive industry (all car windows)
Other specialised industries (transport, domestic appliances etc.)
Special glasses include antibacterial glass which kills 99.9% of bacteria on its
surface.
he two main activities of AGC Glass Europe are producing flat glass in large
dimensions ("raw glass") on the one hand, and processing it into finished or semi-
finished products (“processed glass”) on the other.

CH.3:- COMPARATIVE POSITION OF COMPANY/INDUSTRY/SECTOR
WITH INDIA & GUJARAT
TOP 10 GLASS COMPANIES IN INDIA 2012
1. Hindustan National Glass And Industries Ltd.
2. Asahi India
3. Piramal Glass
4. Nile Limited
5. Empire Industries
6. Haldyn Glass
7. Binani Industries (Goa Glass Fibre Ltd)
8. Borosil Glass
9. La Opala RG
10. Saint Gobain
A. COMPARATIVE ANALYSIS OF ASAHI INDIA GLASS WITH OTHER INDIAN GLASS COMPANIES :
Competition:
Source: moneycontrol.com
Name Last Price Market Cap.
(Rs. cr.)
Sales
Turnover
Net Profit Total Assets
Hind Nat Glass 193.00 1,685.63 1,888.86 90.86 3,145.60
Asahi India 50.40 806.04 1,655.55 -58.73 1,504.26
Piramal Glass 86.00 695.88 874.67 78.27 1,211.42
Binani Ind 109.40 323.78 139.29 13.68 1,196.43
La Opala RG 256.20 271.51 115.01 12.60 75.87
Sezal Glass 6.25 20.97 100.29 -52.64 277.51

Comparison with competitors with the help of BALANCESHEET :
Balance Sheet ------------------- in Rs. Cr. -------------------
Asahi India
Hind Nat Glass
Piramal Glass
Empire Ind
Binani Ind
Mar '12 Mar '12 Mar '12 Mar '12 Mar '12
Sources Of Funds
Total Share Capital 15.99 17.47 80.92 6.00 29.62
Equity Share Capital 15.99 17.47 80.92 6.00 29.62
Share Application Money 0.00 0.00 0.00 0.00 0.00
Preference Share Capital 0.00 0.00 0.00 0.00 0.00
Reserves 131.84 1,140.25 403.13 75.87 174.33
Revaluation Reserves 0.00 0.00 0.00 0.00 0.00
Networth 147.83 1,157.72 484.05 81.87 203.95
Secured Loans 1,112.18 1,971.82 474.84 1.04 557.38
Unsecured Loans 244.25 16.06 252.53 57.27 435.10
Total Debt 1,356.43 1,987.88 727.37 58.31 992.48
Total Liabilities 1,504.26 3,145.60 1,211.42 140.18 1,196.43
Asahi India
Hind Nat Glass
Piramal Glass
Empire Ind
Binani Ind
Mar '12 Mar '12 Mar '12 Mar '12 Mar '12
Application Of Funds
Gross Block 2,301.25 2,096.82 1,231.49 196.93 11.15
Less: Accum. Depreciation 1,043.52 703.71 575.77 59.88 4.87
Net Block 1,257.73 1,393.11 655.72 137.05 6.28
Capital Work in Progress 21.16 1,156.98 151.36 0.00 0.00
Investments 15.71 180.90 59.26 0.00 1,070.85
Inventories 475.40 301.14 139.32 16.34 0.00
Sundry Debtors 312.26 343.00 304.41 52.75 2.51
Cash and Bank Balance 16.63 10.58 12.75 46.98 126.33
Total Current Assets 804.29 654.72 456.48 116.07 128.84
Loans and Advances 155.99 455.97 139.66 73.98 68.15

Fixed Deposits 0.00 1.28 0.00 0.00 5.02
Total CA, Loans & Advances
960.28 1,111.97 596.14 190.05 202.01
Deffered Credit 0.00 0.00 0.00 0.00 0.00
Current Liabilities 742.70 585.43 167.65 96.51 71.21
Provisions 7.92 111.93 83.41 90.43 11.50
Total CL & Provisions 750.62 697.36 251.06 186.94 82.71
Net Current Assets 209.66 414.61 345.08 3.11 119.30
Miscellaneous Expenses 0.00 0.00 0.00 0.00 0.00
Total Assets 1,504.26 3,145.60 1,211.42 140.16 1,196.43
Contingent Liabilities 112.15 681.85 68.85 2.34 2,482.60
Book Value (Rs) 9.24 132.56 59.82 136.45 68.91
Source : Dion Global Solutions Limited

CH.4:- PRESENT & TREND OF BUSINESS IMPORT – EXPORT WITH
INDIA/ GUJARAT
India’s Glass Industry Contribution To Economy
The types of glass currently manufactured in India are float glass and sheet glass
The Glass Industry in India has the manufacture capacity of around 0.68 million
tons in a year
Manufacture of float glass is about 0.51 million tons, which is nearly 75 % of the
total glass production in India.
Production of sheet glass is about 0.17 million tons, which is almost 25 % of the
total glass production in India.
Float glass can be classified into three types, such as coloured glass, processed
glass, and clear unprocessed glass.
The production sector is the largest consumer of float glass. Around 60 % of the
total production is used by the construction sector.
The other glass customers use 10 % of the total production.
FDI Inflow Yearly To Glass Major Player
The Indian Glass Industry is dominated by the subsidiary of the major foreign glass
manufacturing companies
The overseas players are Saint-Gobain, Asahi Float glass, and Gujarat Guardian
Saint
-Gobain has invested ` 700 corers in establishing a second float glass and automotive
glass-manufacturing unit at Sriperumbudur, in Tamil Nadu.
Asahi Glass is planning to establish a production unit at an estimated cost of ` 50
corers near Chennai.
Belgium Trade Relations with India
Economic And Trade Relations
Belgium has emerged as one of India’s significant trading partners in the EU. Trade in
gems and jewellery constitutes over 75% of the bilateral trade. India’s IT sector is well

representing in Belgium, with all the big IT companies having their establishment.
Several Indian companies in the chemicals sector have also recognized
offices/warehousing facilities in Belgium, particularly close to the port city of Antwerp.
Belgian business interests in India cover energy, ports, dredge, building, banking and
finance, electronics and software, chemicals and fertilizers, astrophysical energy and
biotechnology.
Bilateral Trade
Belgium is the second largest trading partner of India in the European Union with yearly
bilateral trade yield amounting Euro 10.4 billion in 2010. India is the 5th largest exporter
to Belgium (after USA, China, Japan and Russia) and 2nd largest importer of Belgian
merchandise in 2010 (after USA). The major items of Indian exports to Belgium are -
Precious stones; Textiles and clothing; Iron and steel; Chemical products; Mineral
products; Organic chemicals; equipment and Electrical Equipment’s etc. The major items
of Indian imports from Belgium are- Precious gravel; Iron and steel; Machinery and
mechanical appliances; Chemical products; boilers, equipment and mechanical
appliances & parts thereof: untreated chemicals; Plastic and rubber; Plastics and articles
thereof; Pharmaceutical products etc. A MoU on collaboration in railway sector has been
agreed upon and is ready for signature.
Following figures show Trade Relation of Belgium and India:
Table 4.1 Bilateral Trade Of India And Belgium: (Figures in US $ Million)
Year 2009-2010
(1)
2010-2011
(2)
2011-2012
(3)
% variation
(2)/(1)
% variation
(3)/(2)
Export 1981.0 2524.7 3525.2 27.4 39.6
Import 8754.7 11402.4 14219.2 30.2 24.7
Total Trade 10735.7 13927.1 17744.4
Bilateral Investment
Belgium has emerged as the 23rd largest investor in India universal and the 9th largest
within the EU but the total FDI in India from Belgium is still comparatively small. A
cumulative figure of FDI inflows from Belgium into India amount to US $ 327.84 million
from April 2000 to April 2010. In the recent past, Indian outlay in Belgium has exceeded
investment by Belgian firms in India mainly from side to side several takeovers of Belgian
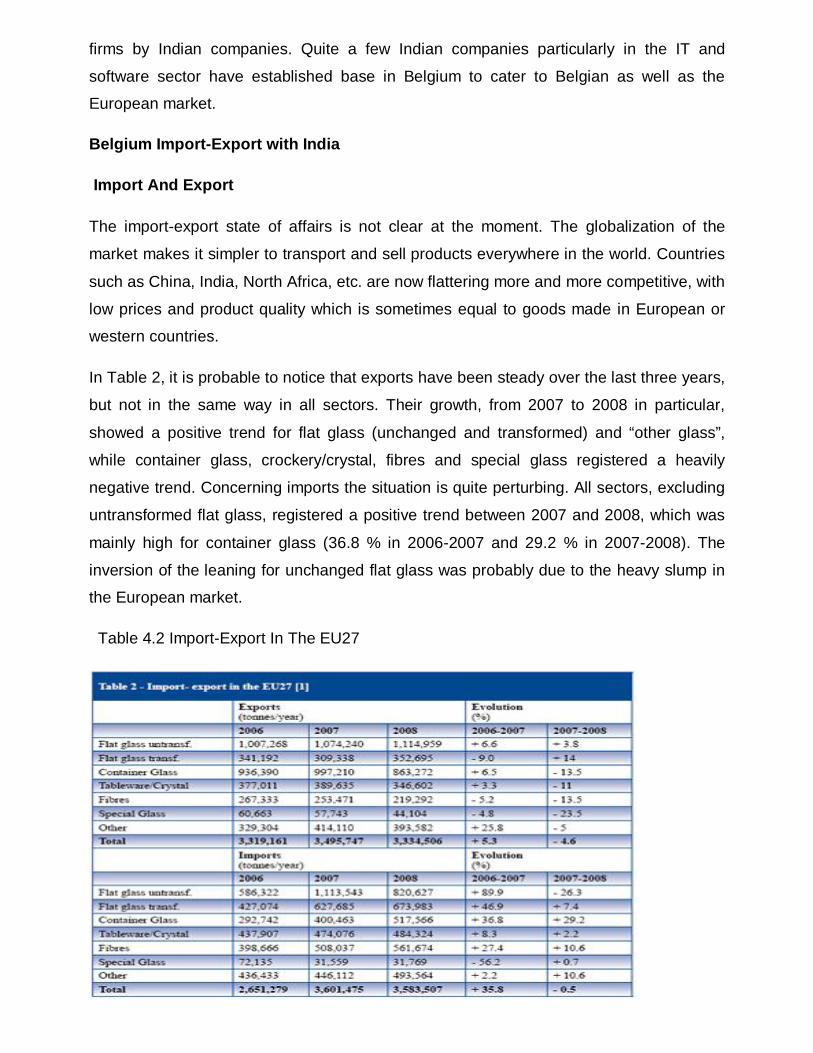
firms by Indian companies. Quite a few Indian companies particularly in the IT and
software sector have established base in Belgium to cater to Belgian as well as the
European market.
Belgium Import-Export with India
Import And Export
The import-export state of affairs is not clear at the moment. The globalization of the
market makes it simpler to transport and sell products everywhere in the world. Countries
such as China, India, North Africa, etc. are now flattering more and more competitive, with
low prices and product quality which is sometimes equal to goods made in European or
western countries.
In Table 2, it is probable to notice that exports have been steady over the last three years,
but not in the same way in all sectors. Their growth, from 2007 to 2008 in particular,
showed a positive trend for flat glass (unchanged and transformed) and “other glass”,
while container glass, crockery/crystal, fibres and special glass registered a heavily
negative trend. Concerning imports the situation is quite perturbing. All sectors, excluding
untransformed flat glass, registered a positive trend between 2007 and 2008, which was
mainly high for container glass (36.8 % in 2006-2007 and 29.2 % in 2007-2008). The
inversion of the leaning for unchanged flat glass was probably due to the heavy slump in
the European market.
Table 4.2 Import-Export In The EU27

Compared to Europe, the Italian state of affairs is rather similar. The performance of the
container glass (bottles & jars) sector was mainly poor. It registered an import increase of
approximately 19 % from 2007 to 2008, compared to an export decrease of about 1 %
during the same period.
Graph 4.1 Destination of EU27 Glass Graph 4.2 Origin of EU27 Glass Imports
Exports (2007) (2007)
Graph 4.3 EU27 Glass Exports By Graph 4.4 Eu27 Glass Imports By
Sub-Sector Sub-Sector

CH.5:- POLICIES & NORMS OF SELECTED COUNTRY FOR INDUSTRY/ COMPANY FOR EXPORT-IMPORT LICENSING PERMISSION TAXATION
BELGIUM- IMPORT/EXPORT REGULATIONS
Belgium is part of the European Union which has developed a common trade policy for all
member countries. The common commercial policy is a pillar for the external relations of the
European Union. It is based on a set of uniform rules under the Customs Union and the
Common Customs Tariff and governs the commercial relations of the Member States with
Non-EU Member Countries. The purpose of the instruments of trade defense and market
access is mainly to protect European businesses from obstacles to trade. The EU has evolved
during the process of globalization by aiming for the harmonious development of world trade
and fostering fairness and sustainability. It actively encourages the opening of the markets
and the development of trade in the multilateral framework of the World Trade Organization
(WTO). At the same time, it supports developing countries and regions through bilateral
relations with a view to involving them in world trade using preferential measures. Many of the
trade issues are standardized across the European Union, and the text below describes briefly
the highlights of the EU trade policy.
Licensing: The EU has a liberal import regime where import licensing is not common. Import
licenses are issued with due consideration for the provisions of relevant European Union trade
agreements and the needs of the specific importing country.
Quality Standards: Under the EU's "New Approach to Technical Harmonization", certain
products are required to meet the specific quality standards including toys, machinery,
telecommunications terminal equipment, medical devices, electrical equipment, appliances,
etc. Qualified products must carry a CE mark to show its compatibility, fixed onto the product
by a manufacturer or importer as self-declaration of compliance.
Import duties: Imports into the EU countries are subject to the respective import tariff
(normally applied on the import c.i.f. value) plus the value-added tax (VAT) varies according to
different importing countries. For Belgium, the most commonly applicable rate is 21% although
the rates of 0%, 6% and 12% also exist.

Packaging: Manufacturers and exporters should minimize the packaging of their products
exporting to the EU.
COMMON RULES FOR IMPORT IN EU
This regulation aims to establish common rules for imports into the European Union (EU)
based on the principle of the freedom of import and to define the procedures enabling the EU
to implement, where necessary, the surveillance and safeguard measures required to protect
its interests.
The regulation lays down the principle of freedom to import products originating in non-
European Union (EU) countries, subject to possible safeguard measures. This regulation
applies to imports into the EU of products originating in non-EU countries except for textile
products covered by special rules for imports and products originating from non-EU countries
which are subject to that country’s own import rules.
Information and consultation procedure
EU countries must inform the Commission if import trends suggest the need for surveillance or
safeguard measures. Consultations may be held either at the request of an EU country or on
the initiative of the Commission. They take place within an advisory committee made up of
representatives of each EU country with a representative of the Commission as chairman.
These consultations primarily examine the conditions of imports, the economic and
commercial situation and the measures, if any, to be taken. Consultations may be conducted
in writing if necessary and the EU countries may express their opinion or request oral
consultations within a period of five to eight working days.
Investigation procedure
Where, after consultations it is apparent that there is sufficient evidence to justify the initiation
of an investigation, the Commission initiates an investigation within one month and publishes
a notice in the Official Journal of the European Union, summarizing the information received.
The investigation seeks to determine whether imports of the product in question are causing
or threatening to cause serious injury to the EU producers concerned. Once the investigation
has been launched, the Commission seeks and verifies all information it considers necessary
for the conduct of the investigation.
Within the framework of the investigation, the Commission examines:

the volume of imports;
the price of imports;
the consequent impact on EU producers;
factors other than trends in imports which are causing or may have caused injury to the
EU producers concerned.
At the end of the investigation, the Commission submits a report to the advisory committee
and, depending on the conclusion of its investigations, either terminates the investigation or
decides to implement surveillance or safeguard measures.
This investigation procedure does not preclude the use, particularly in critical circumstances,
of surveillance or provisional safeguard measures. In this instance, the duration of such
measures must not exceed 200 days.
Surveillance measures
Imports of products may have to undergo EU checks on the basis of a decision by the Council
or the Commission if market trends in this product threaten to cause injury to the EU
producers of like or competing products, and the EU’s interests require such checks.
The decision to introduce surveillance measures is normally taken by the Commission. Such
surveillance may involve retrospective checks of imports (statistical surveillance) or prior
checks. In the latter case, products under prior surveillance may only be put into free
circulation within the EU on production of an import document. This document is issued by the
EU countries, free of charge, for any quantity requested and within a maximum of five days of
receipt of a declaration by the importer, regardless of their place of business in the EU. The
document is valid throughout the EU, regardless of the EU country of issue.
Surveillance measures do not necessarily cover the entire EU. Where imports of a product
have not been made subject to prior EU surveillance within eight working days of the end of
consultations on the possibility of establishing EU surveillance, the Commission may introduce
surveillance confined to imports into one or more regions of the EU.
EU countries must inform the Commission each month of the import documents that were
issued (in cases of prior surveillance) and the imports received (in cases of prior and
retrospective surveillance).
Safeguard measures
Safeguard measures may be applied where products are imported into the EU in such greatly
increased quantities and/or on such terms or conditions as to cause, or threaten to cause,

serious injury to EU producers. As regards members of the World Trade Organization (WTO),
these measures are cumulative.
Where these conditions are fulfilled, the Commission may change the period of validity of the
import documents issued in respect of surveillance or establish an import authorization
procedure and, in particular, a quota system for imports.
When establishing a quota, account is taken of the desirability of maintaining, as far as
possible, traditional trade flows and of the volume of goods exported under contracts
concluded before the entry into force of the measure. In principle, the quota should not be set
lower than the average level of imports over the last three years.
Safeguard measures apply to every product which is put into free circulation after their entry
into force. In exceptional cases, they may be confined to one or more regions of the EU.
However, they do not prevent the release for free circulation of products already on their way
to the EU.
These measures are taken by the Commission or by the Council. Where intervention by the
Commission has been requested by an EU country, the Commission takes a decision within a
maximum of five working days. The Commission’s decision is communicated to the Council
and to the EU countries. Any EU country may, within one month, refer the decision to the
Council. In this case, the Council, acting by a qualified majority, may confirm, amend or
revoke that decision. If, within three months, the Council has not taken a decision, the
decision taken by the Commission is deemed to be revoked.
In any event, where the interests of the EU so require, the Council, acting by qualified majority
and on a proposal from the Commission drawn up in accordance with the conditions set out
above, may adopt safeguard measures.
No safeguard measure may be applied to a product originating in a developing country of the
WTO as long as that country’s share of EU imports of the product concerned does not exceed
3 %, and on the condition that collectively the developing countries of the WTO with less than
a 3 % import share do not account for more than 9 % of total EU imports of the product
concerned.
The duration of safeguard measures may not, in principle, exceed four years, unless they are
extended under the same conditions as the initial measures were adopted. Under no
circumstances may the duration of the measures exceed eight years.

In addition to safeguard measures as such, the regulation stipulates that the Council, on
proposal from the Commission, may adopt appropriate measures to allow the rights and
obligations of the EU or of all its member countries, in particular those relating to trade in
commodities, to be exercised and fulfilled at international level.
This regulation does not preclude the fulfilment of obligations arising from special agreements
concluded between the EU and non-EU countries. Nor does it preclude the adoption or
application by EU countries of measures on grounds of public order, public morality, public
security, the protection of health and life of humans, animals or plants, the protection of
national treasures, the protection of industrial and commercial property, and special formalities
concerning foreign exchange.
COMMON RULES FOR EXPORT IN EU
This regulation establishes common rules for exports from the European Union (EU) based on
the principle of freedom of export and defines the procedures enabling the EU to implement,
where necessary, the surveillance and protective measures required.
This regulation lays down the principle of freedom of export, stating that exports from the
European Union (EU) to non-EU countries are free from quantitative restrictions.
Information and consultation procedures
EU countries may adopt protective measures if they consider it necessary due to unusual
developments on the market. Before implementing these protective measures, the EU country
must inform the Commission accordingly, which will then advise the other EU countries.
Consultations may be held at any time and take place within an advisory committee composed of representatives of each EU country and chaired by a representative
of the Commission. These consultations relate, in particular, to the export conditions and
trends for the product in question as well as the measures, if any, to be adopted.
The Commission may request EU countries to supply statistical data on market trends in a
given product for the purpose of assessing the economic and commercial situation. It may
also ask them to exercise surveillance over given products in accordance with their national
legislation and with the procedure specified by the Commission.

Protective measures
The interests of the EU may require the adoption of appropriate measures to prevent or
remedy a critical situation brought about by a shortage of essential products, or to allow
international commitments entered into by the EU or all the EU countries to be fulfilled, in
particular those relating to trade in primary products. These measures are generally
quantitative restrictions on exports.
The Commission, acting at the request of an EU country or on its own initiative, may make the
export of a product subject to the production of an export authorisation. The granting of an
export authorisation is governed by such provisions and subject to such limits as the
Commission shall lay down pending subsequent action by the Council. The Council and the
EU countries shall be notified of the measures taken which shall take effect immediately.
These protective measures may be limited to exports to certain countries or exports from
certain regions of the EU. They do not affect products already on their way to the EU frontier.
In principle, protective measures are adopted by the Council, acting by a qualified majority on
a proposal from the Commission. The Commission may also implement such measures where
immediate action is required.
During their application, protective measures are the subject of consultation on the advisory
committee with a view to examining their effects and ascertaining whether the conditions for
their application are still satisfied. As a result, they may be amended or revoked if they are no
longer necessary.
This regulation does not prevent EU countries from adopting or applying quantitative
restrictions on exports on grounds of public morality, public policy, public security, the
protection of health and life of humans, animals and plants, the protection of national
treasures possessing artistic, historic or archaeological value, or the protection of industrial
and commercial property.

CORPORATE TAX
Definition
Companies and profit-making organisations with legal personality which have their
registered office, their main business centre or their seat of management in Belgium are
subject to Belgian corporate income tax.
These companies are subject to Belgian corporate income tax on their worldwide profits.
If however the Belgian company derives income from a foreign branch, this income will
be exempt from tax if the branch is located in a country which has a preventive double
taxation treaty with Belgium.
Foreign companies can be subject to corporate income tax if they are carrying out
business activities in Belgium through a branch (permanent establishment).
Rates
The standard Belgian corporate income tax rate is currently 33.99%.
A reduced and progressive rate applies for companies which have a taxable profit not
exceeding 322 500 €. This rate amounts to:
24.98 % in the bracket 0 € to 25 000 €.
31.93 % in the bracket 25 000 € to 90 000 €.
35.54 % in the bracket 90 000 € to 322 500 €.
These reduced rates only apply if the following conditions are met:
The company’s taxable profit does not exceed 322 500 €.
The company is not a “financial institution”.
The shares are not held for 50% or more by one or more other companies.
The company should not distribute dividends for an amount exceeding 13% of the
issued share capital of the income year.
The company pays a salary of at least 36 000 € to at least one manager of its
mangers (income year 2008).
The company is not part of a group which owns a co-ordination centre.

BRUSSELS BUSINESS WELCOME PACKAGE
Contact: Brussels Invest & Export
Fact-finding missions usually take time and money but they are the best way to select a
new location for a company. Brussels Invest & Export allows companies that are
considering Brussels as a possible new location to evaluate all the assets of the Region.
This service is provided free for a three month trial period.
The Welcome Package includes:
Free use of office:
o Fully furnished office space
o 1 to 3 work stations
o Reception services (English, French and Dutch)
o Internet, phone & fax services
o Conference room
Assistance in:
o Legal & tax matters
o Company registration
o Contacts with local authorities
o Searching for a suitable location
o Finding public incentives
o Recruiting staff
o Market information.
And more:
o Preferential rate at a 4-star hotel located five minutes from the office
o Public transport card.

CH.6:- POLICIES AND NORMS OF INDIA FOR IMPORT –EXPORT TO
THE SELECTED COUNTRY & LICENSING, PERMISSION, TAXATION
Import Policy
The economic needs of the country, effective use of foreign exchange and industrial as
well as consumer requirements are the basic factors which influence India's import policy.
On the import side the policy has three objectives: to make necessary imported goods
more easily available, including essential capital goods for modernizing and upgrading
technology; to simplify and streamline procedures for import licensing; to promote
efficient import substitution and self-reliance.
There are only 4 prohibited goods: tallow fat, animal rennet, wild animals and
unprocessed ivory. There is a restricted list, but most of the restrictions are on grounds of
security, health and environmental protection or because the goods are reserved for
production by small and tiny enterprises, which are home-based or village-based and
which require low skills and employ a large number of people. But the policy of restricting
import of consumer goods is changing.
The Indian government's clearly laid down policy is to achieve, through a series of
progressive steps, the average tariff levels prevalent in the ASEAN region. The basic
customs tariff rate now ranges from 0 to 40% plus additional duty of 2%; the average rate
is about 30%.
Imports are allowed free of duty for export production under a duty exemption scheme.
Input-output norms have been specified for more than 4200 items. These norms specify
the amount of duty-free import of inputs allowed for specified products to be exported.
There are no quantitative restrictions on imports of capital goods and intermediates.
Import of second-hand capital goods is permitted provided they have a minimum residual
life of 5 years. There is an Export Promotion Capital Goods (EPCG) Scheme under which
exporters are allowed to import capital goods (including computer systems) at
concessionary customs duty, subject to fulfillment of specified export obligations. Service
industries enjoy the facility of zero import duty under the EPCG Scheme. Likewise,
hospitals, air cargo, hotels and other tourism-related industries. Software units can use
data communication network to export their products.

Export Policy
Exports are the major focus of India's trade policy and a thrust area is exports involving
higher value additions. Most items can be freely exported from India. A few items are
subject to export control in order to avoid shortages in the domestic market, to conserve
national resources and to protect the environment.
Export profits are exempt from income tax. Higher royalty payments of 8% (net of taxes)
are permitted on export sales as compared to 5% on domestic sales. Export
commissions up to 10% are also permissible.
Inputs required to be imported for export production are exempted from the basic
customs duty. Export Oriented Units (EOUs) and Export Processing Zones (EPZs) enjoy
special incentives such as duty free import of capital goods and raw materials for the
purpose of export production.
A Brand Equity Fund has been set up to popularize high quality India brands in the world
market. The corpus of the fund of Rs 5 billion (US $156 million) will receive equal
contributions from the government and industry.
Taxation
An entrepreneur willing to expand his/her business abroad must abide by the tax laws of
the home country as well as of the particular foreign country and accordingly pay the
required taxes. Taxes (or duties) are defined as the financial charges levied by the
Government upon an individual or an organisation or property in return for the
government services received by them. These taxes may be broadly classified into direct
and indirect taxes. Direct taxes are those where the tax payer pays the taxes directly to
the imposing authority like income tax and corporate tax. Whereas, indirect taxes are
those which are not paid directly to the imposing authority but paid to someone else who
acts as an intermediary link between the tax payer and the tax levying authority like
customs duty and service tax. In India, the power to levy taxes and duties is distributed
among the three tiers of Government, in accordance with the provisions of the
Constitution.
The most important tax which an entrepreneur is subjected to is the 'customs duty' which
is a type of indirect tax levied on goods imported into India as well as on goods exported
from India. In India, the basic law for levy and collection of customs duty is Customs Act,
1962.

It provides for levy and collection of duty on imports and exports, import/export
procedures, prohibitions on importation and exportation of goods, penalties, offences,
etc. The Central Board of Excise & Customs (CBEC) is the apex body for customs
matters. It is a part of the Department of Revenue under the Ministry of Finance,
Government of India.
But due to different tax laws and rules prevailing in different countries, a businessmen
faces the problem of 'double taxation'. Double taxation refers to a situation where the
same income becomes taxable in the hands of the same company or individual (tax-
payer) in more than one country. This puts unnecessary and prohibitive burden on the
tax-payer. In India, the liability under the Income tax Act arises on the basis of the
residential status of the assessee during the previous year. Hence, if the assessee is
resident in India, he/she has to pay tax not only on the income which is received in India
but also on that income which accrues, arises outside India or received outside India.
Thus he becomes liable to pay double taxes. The relief against such double taxation in
India has been provided through, bilateral relief and unilateral relief.

CH.7:- PRESENT TRADE BARRIERS FOR IMPORT/ EXPORT
There are three very general barriers to international trade that can take a variety of
forms. Normally, "trade barrier" is equivalent to "tariff," yet, non-tariff barriers can be used
as a way to avoid treaties and agreements that limit or eliminate taxes on imports. Non-
tariff barrier are effective as indirect tariffs.Government usually uses to protect domestic
industries from competition by making foreign goods more expensive.Indian customs
duties are 5-40%, depending on the method of entry (land, air or sea) and product type
.There are 3 main trade barriers are:
Tariffs
Tariffs are the most common trade barrier. A tariff is simply a tax on foreign imports,
making them more expensive. The purpose of the tariff is to assist domestic industry
against foreign competition. If domestic industry is just getting off the ground, it might be
destructive to the economy to permit these infant industries to compete with well-
developed foreign firms. Therefore, a constructive tariff is one that protects a new,
domestic industry, permitting it to develop to the level of their foreign competitors.
Non-Tariff Barriers
Some countries use an array of nontariff barriers to control trade. These three often
comprise standards, technical regulations and conformity procedures. Standards are the
basic rules of a country concerning what quality of products are permitted to be imported.
Technical regulations comprise the basic bureaucratic paperwork necessary to inspect
and pass products, while conformity procedures are the measures taken by the importer
to make sure the products being imported measure up to local standards. All of these
delay imports and make trading less convenient and more expensive.
Natural Barriers
Natural barriers refer to the difficulties of transporting. American trade with Canada is
easier than trade with Japan simply because the distances are much shorter. Language
and culture might also be considered another "natural barrier" of a sort. Mountains,
deserts and marshes have traditionally also been barriers to trade, but modern
technology has largely obviated many of these.

Although India has steadily opened up its economy, its tariffs continue to be high when
compared with other countries, and its investment norms are still restrictive. This leads
some to see India as a ‘rapid globalizer’ while others still see it as a ‘highly protectionist’
economy.
Till the early 1990s, India was a closed economy: average tariffs exceeded 200 per
cent, quantitative restrictions on imports were extensive, and there were stringent
restrictions on foreign investment. The country began to cautiously reform in the 1990s,
liberalizing only under conditions of extreme necessity.
The country is among the few in the world that continue to ban foreign investment in retail
trade. Although this policy has been somewhat relaxed recently, it remains considerably
restrictive.
India is now aggressively pushing for a more liberal global trade regime, especially in
services. It has assumed a leadership role among developing nations in global trade
negotiations.India is actively pursuing bilateral/regional Free Trade Agreements. While
Free Trade Agreements would certainly imply a reduction in tariffs, the gains from such
trade would be limited in the presence of non-tariff barriers.

CH.8:- POTENTIAL FOR IMPORT/ EXPORT IN INDIAN MARKET
Glass is one of the most useful materials in our daily lives.There is a special relationship
between glass and buildings. Glass is a magical material which has so many different
properties and uses, that it has presented many new possibilities and designs. The types
of glass presently manufactured in India are float glass and sheet glass.
The glass industry in India is worth around Rs 5,500 crore, which has which has shown
good growth in the past few quarters driven by an uptick in demand from user-industries
such as infrastructure, construction, automobiles, food processing, beverages,
pharmaceuticals and cosmetics, among others.The glass industry is diversifying into
interior decoration, furniture, murals and other value additions to keep the show going.
The growth of the industry is dependent on construction and architecture activities.
However, the automobile sector is still a big user of flat glass. The construction sector is
the largest consumer of float glass. Around 60 % of the total production is used by the
construction sector. The glass sector has been growing at 10-12 per cent a year over the
past five years. Real estate is the biggest consumer of flat glass for windows, doors,
partitions and a host of other applications.
Global demand for flat glass will rise 5.5 percent annually through 2012, spurred by a
healthy building construction environment and rapid growth in newer flat glass
technologies. India’s Imports at a Glance
The nation of India is the seventh largest in the world in land mass, number ten in the
world for the size of their economy by GDP, and the fourth largest international economy
in purchasing power parity. India has the second largest labour force in the world and
abundant natural resources. India’s economy has grown by about 7.5% yearly since
2000, and that rate is predicted to increase. It is also the fifteenth largest nation in imports
and the eighteenth largest in exports worldwide in 2009. This means that India imports
and exports are a huge potential market.
More than 78% of India imports into other countries are manufactured goods, such as
clothing, textiles and jewellery and have low entry duties into most other countries, such
as the US, due to trade agreements. However, a smaller importer might do better to tap
into the small but vital markets for unique Indian products such as spices, certain textiles,
teas, carpets, and handicrafts. There is even a substantial demand for “Bollywood” films,

Indian music, and food products, as the Indian emigrant populations in other countries
increase.
The glass and glazing industry for architectural application in India for the year 200 was
estimated at a minimum of Rs 100 crores. Of this, the glass component would be about
1.2 million square meters. Indian and imported ACP would come to about 1 million
square meters and another 700,000 square meters would constitute residential windows.
In geographical terms, the South Indian region dominated by Bangalore, Chennai,
Hyderabad and parts of Kerala, contributes to 30 percent of the glass consumption. West
India follows with 29 percent. Here Mumbai, Pune and parts of Gujarat are big
consumers. The North Indian market, comprising mainly of Delhi and the National Capital
Region accounts for 20 percent of the total architectural glass and glazing market. East
India currently contributes only 7 percent of the consumption. However, with a renewed
focus on real estate in West Bengal, this is set to change and this regional market is
growing very fast.
The growth of the Indian glazing market is impressive. While it was a Rs 100 crores
market in the year 2000, it is estimated to touch Rs 1000 crores by 2005. Even so, this is
a very small market size compared to other evolving market for the glass industry.India is
at an early stage in terms of market maturity at present, but glass demand is growing
steadily. Aggressive and organized efforts on the part of manufacturers and processors
are expected to achieve higher levels of awareness among glass specifies and users.
In the next five years, the Indian architectural glass market will move to higher maturity
levels. However, policy and regulations including the lack of standards and glass codes
for India are a source of anxiety for manufacturers and processors alike. The industry
also needs increased exposure. Followed the opening up of FDI for the real estate
sector, here appears to be more chance of foreign investors coming in and a greater
demand for international standards in construction.
This, and the ever-growing popularity of glass as a material, will ensure growth. Further,
constant technical innovations by manufacturers are keeping customers constantly
interested in glass and glass products.With stability on the cost side and good outlook on
the demand side, the glass segment has good prospects. Robust growth in automobiles,
infrastructure, liquor & other beverages, boom in building and construction will see the
glass industry at its best in the coming years.

Export Potential of India
Exports have played an increasingly important role in India’s economic growth in the last
two decades. This paper analyses the performance of India’s exports and the various
economic factors which have contributed to its growth. Since manufactured exports
comprise a significant share of India’s aggregate (merchandise) exports, the paper also
provides an overview of the export performance of three important commodities; namely,
gems and jewellery, cotton and electronic goods and concludes with key policy changes
which could have a bearing on the current trends seen in these sectors.
India’s aversion to international trade and reliance on domestic factors to fuel growth
during the fifties meant that exports played a smaller role and this is evident from the
following table, where India’s exports lost its world market share between 1951-1960 and
1961-70.6
Till the mid-seventies, India’s policy was restrictive and focused on developing the
domestic industry, while tightening control on foreign trade (using quantitative restrictions
as a tool). High levels of protection coupled with an overvalued domestic currency
resulted in a growing demand for imports and discouraged exports. Moreover, India’s
exports also suffered because export incentives were only available to a limited number
of manufacturing industries and selected agricultural exports (which were subjected to
export duties at varying rates). The Indian economy has gained considerable momentum
over the last one decade, by achieving and sustaining an annual GDP growth rate of over
7 percent. This high growth rate can be in part attributed to the growing contribution of
the export sector to the economy.
Graph 8.1: India’s Exports and Import change

In recent years, the Indian government has acknowledged the severity of this issue and
taken an important policy initiative in 2011 by approving the New Manufacturing Policy.
This policy is aimed at building the capacity of the sector, strengthening its contribution to
the GDP (from 16 percent to 25 percent) as well as improving the international
competitiveness of the manufacturing sector. The initial industry reactions to the NMP
has been positive and it is expected that a proper execution of the NMP will be beneficial
for the Indian economy as it can generate large-scale employment for nearly a hundred
million workers in the next ten years. The implementation of the policy will involve the
establishment of a number of National Manufacturing Investment Zones (NMIZ) which will
have features such as a progressive exit policy, strong physical infrastructure, investment
incentives and business-friendly approval mechanisms to support the production in these
units. Though the implementation of the NMP may take time, this policy is expected to
provide a strong impetus to India’s manufactured exports in the near future.

CH.9:- BUSINESS OPPURTUNITIES IN FUTURE
Social security agreement between India and Belgium
Deputy Prime Minister And Finance Minister And Minister Of Overseas Indian Affairs
signed an agreement On 1 September 2009, the long
anticipated Social Security Agreement between the Kingdom of Belgium and the Republic of India (the “SSA”) entered into force. The SSA was signed in New Delhi on
3 November 2006 and is considered as a landmark agreement as it was the first treaty of
its kind to be signed by the Indian authorities.
It goes without saying that this SSA will greatly affect Indian companies who are actively
engaged in business in Belgium or who aspire to do so. Moreover, the SSA will
affect Indian individuals who are working or who envisage working in Belgium
(and Belgian individuals working or planning to work in India), with regard to some of
their social security benefit rights.
The SSA covers the main social security insurance schemes in both countries, which are:
(1) The old-age and widows’ pension for employees and the self-employed;
(2) The Belgian invalidity insurance and the Indian Total Disability benefit; and
(3)The social security regulations for employees
The SSA applies to all individuals who are, or were, subject to
the social security legislation of Belgium or India and hence both the countries are
involved.
This means the SSA’s scope extends to third-country nationals who are, or were, subject
to Indian or Belgian social security legislation, as well as to Indian and Belgian citizens,
all of whom can rely on the rights granted under the SSA.
Due to the SSA, social security benefits will no longer be restricted by the claimant’s
place of residence, i.e. social security benefits will be paid to Indian nationals living
in Belgium and to the Belgian nationals living or residing in India.
For example, Indian nationals who have paid or who will be paying
Belgian social security contributions will receive a Belgian old-age pension upon their
retirement, also even if they have returned back to their home town to India.
An Indian national seconded by his employer to Belgium can live and work
in Belgium without paying Belgian social security contributions (but still
paying Indian social security contributions) for up to five years, or more.

Notwithstanding the provisions on second amendment set out in the SSA an Indian
employer can nevertheless opt to apply the general rule instead, hence subjecting his
employee to the social security scheme of Belgium, and vice versa.
This bilateral SSA led to the Indian government introducing the concept of international
workers into its social security scheme, which in turn led to an increase of contributions
for international workers to approximately 12% of basic pay for both
employees and employers.
DOUBLE TAXATION AVOIDANCE AGREEMENT
Agreement between The Government of the Republic of India And The Government Of
The Kingdom Of Belgium for the avoidance of double taxation and the prevention of fiscal
evasion with respect to taxes on income
Table: 9.1 Import-Export data between India and Belgium
Sr.No. Year 2007-2008 2008-2009 2009-2010 2010-2011 2011-2012
1 Export 1,694,309.84 2,030,939.59 1,775,704.94 2,634,703.81 3,420,614.59
2 %Growth - 28.19 0.57 35.17 28.26
3 %Share 2.58 2.42 2.10 2.31 2.33
4 Import 1,754,571.92 2,605,788.66 2,846,578.31 3,917,866.54 5,000,278.79
5 %Growth - 48.51 9.42 37.63 27.63
6 %Share 1.73 1.90 2.09 2.33 2.13
7 Total
Trade 166,817,522 221,519,061 220,926,919 282,628,887 381,142,264
8 %Growth - 32.79 -0.27 27.93 34.85
9 %Share 2.07 2.09 2.09 2.32 2.21

Source: Export-Import Databank, Ministry of Commerce
From above table, it is evident that India’s exports have multiplied in the past five years,
while the share of imports is equally remarkable.
Clearly, the two nations complement each other in a number of areas. Trade meetings
and delegation level talks could do more to promote better trade, and government to
government contact would reassure the business community of both countries.
For the future, the glass industry will need to be able to provide superior products with
unique properties that are more desirable than the products made from other materials
and developing countries.
This will require the development of new process technologies that reduce production
costs and enhance desirable characteristics. Innovations in glass composition and glass
properties will be necessary to support the expansion of glass into completely new
markets.
The area where the industry has to focus its techno logical efforts are the following:
Production Efficiency: development of melting, refining and forming processes with higher product yield and reduction of energy and other production costs.
Campaigns for
1) increasing the life of a furnace;
2) Energy Efficiency: development of more energy-efficient manufacturing
processes and technologies to achieve significant energy saving;
3) Environmental Performance: reduction of emissions and waste in the glass
industry through more stream-lined, cleaner processing.
4) Increased use of natural resources and solid waste reduction.
5) Increased recycling within the industry;
6) Innovative Uses of Glass: Broadening the use of glass in existing markets and
supporting research to create completely new and innovative uses for glass by
investigating new glass compositions,
7) Developing a better understanding of glass properties and interactions, and
modifying and improving essential glassmaking processes.
The industry has to be able to respond to rapidly changing market needs with sufficient
volumes.

In many markets, customers’ demand for lighter, stronger glass products is increasing
rapidly.

In Europe, there are different public and private research centers specialized in glass
that can support the glass industry as it faces these challenges. The most important
centers are the following: SSV (Stazione Sperimentale del Vetro, Italy), TNO (the
Netherlands), CRITT (France), IKATES (Czech Republic), INSTITUT DU VERRE
(France), GLAFO (Sweden), BRITISH GLASS/GLASS TECHNOLOGY SERVICES (UK),
ISTITUTO DE CERAMICA Y VIDRIO (Spain), HVG (Germany).
For the future, a stronger connection between these main players will be crucial in order
to support the whole European glass industry on a global market and to act for the
common good of the sector.

CH.10:- CONCLUSION AND RECOMMENDATIONS
In the 19th century Belgium was the largest exporter of glass in the world and one of the
main producers of polished glass.
Belgium produces 12.3% of Glass of total production of EU and about 4% of worlds
Glass production.
Also Belgium Produces 84% of World’s Recycled Glass.
The international crisis of the last six to ten months is also affecting the glass industry.
Some sectors are suffering more (tableware, flat glass and fibre glass) than others
(container glass).
As packaging, glass containers assure the preservation, safe delivery and attractive
presentation of a vast array of consumer products, supplied to European and world
markets. Whether used for drinks, food, cosmetics, perfumes or pharmaceuticals, glass
plays a vital role in supporting European trade and commerce. Glass is 100 percent
recyclable, virtually inert and preserves the original taste of the products it contains.
Baby food products– like milk – need the protection of its container to preserve its
purity and its vitamins. Because health is not only in the ingredients but also in the
packaging that preserves these ingredients.
Despite encouraging results, the impact of the long-winded financial crisis on the glass
industry continues to weigh heavily on the competitiveness of the EU industry. Increasing
energy prices, unilateral CO2 costs, fluctuating and unfavorable exchange rates, and
high labour costs hamper the cost competitiveness at global level of the container glass
sector. Combined, these challenges delay long-term investment decisions and rather
become incentives for delocalization of production sites and R&D investments outside
EU to more industry friendly environment with lower costs.
However, considering the trend of the last year, it is possible to identify some general
trends: the growth of the glass industry is slowing down and sometimes, in specific
sectors, there is stagnation or even decline.
This problem is mainly due to international competition, especially from the Far East
(China, India) the increase in production costs within the EU (labour costs, energy, raw

materials, etc.) and the legislative burden, particularly in terms of environmental
protection (IPPC, ETS, REACH, etc.);
Relocation of the industry is becoming more and more evident.
The number of plants in Europe is decreasing and it is very rare to see the construction of
new plants; the import of glass articles is on the rise, especially for flat glass and
container glass.
Countries such as China, India, and North Africa are now more competitive on the
market, with low prices and product quality which sometimes is as good as that of the
European or western countries.
For the future, the glass industry will have to be able to provide superior products with
unique properties that are more desirable than those made with competing materials and
by developing countries.
This will also require the development of new process technologies that reduce
production costs and polluting emissions and enhance the characteristics desired by the
customer. Innovations in glass composition and glass properties will be necessary to
support the expansion of glass into completely new markets.

ANALYSIS
OF
PAPER & PACKAGING INDUSTRY

CH.1:- INTRODUCTION OF PACKAGING INDUSTRY AND ITS ROLE IN
BELGIUM
PACKAGING INDUSTRY GLOBALLY
Packaging is vital for the safeguarding and movement of retail, institutional and
manufacturing goods. With dynamic lifestyles and increased consumerism, packaging
has gained superior importance. It performs 4 basic functions: safety, restraint, spreading
of information and utility of product. Packaging Industry is a important sector, adds value
to the various mechanized sectors including agriculture and FMCG segments Size of
packaging Industry Globally (est.): $ 600Bn. (excluding Machinery). US packaging market
accounts for 24 percent. Western European Packaging industry is influenced by Belgium,
France, Italy & U.K. Paper and Board Leads with 36% of the world market followed by
Polymer.
World packaging industry has been mounting at a rate of 3-5 percent per annum.
The technology and innovation in this sector is humanizing gradually. The global
packaging industry is currently valued at $433 billion and is expected to further go up to
US $820 billion by 2016.
INTRODUCTION
With the exception of radioactive waste, in Belgium waste policies are exclusive
competencies of the three Belgian regions since 1994. It was during this year that country
was constituted as a federal state compiled by communities (The Flemish, French and
German communities) and regions (Flanders, Wallonia and Brussels-Capital).
Before the European Union (EU) Directive 94/62/EC on packaging waste (PPW) the
Belgian government had already put into action of fiscal instruments to encourage to the
eco-design of products. The PPW Directive was transposed into Belgian legislation
through an Agreement established in 30th June 1997 among the 3 regions. It is called the
Interregional Cooperation Agreement. This agreement introduced the “shared
responsibility of Producer” principle in Belgium. Order to comply with the ambitious
targets of recycling and recovery, it imposed “take-back” obligations to all economic
operators who place packaging and packaged products on the national market.

The packaging industry in increasingly becoming technology-oriented with
innovations driving the market; this is expected to lead to packaging that increases shelf
life, reduces cost and is light weight.
Market Overview
The worldwide market for packaging materials is highly competitive, composed of
mostly large and medium-sized companied. Potential industry modernization is likely to
come from overall renovation and consolidation. A growing move away from immensity
formats in the food industry in favor of single-supply products also calls for more
packaging. Packaging for medical and pharmaceutical products will also spur growth in
the packaging industry.
The Current state
The growth is primarily driven by factors like growing urbanization, investment in
housing and construction, a burgeoning healthcare sector and quick development in the
emerging economies like Brazil, Russia, India, China and few other East European
Economies. The consumer market influences the global packaging industry and accounts
for an estimated 65 % of the sales, while trade submission accounting for rest 35 %

CH.2:- FUNCTION/STRUCTURE OF PACKAGING INDUSTRY
FUNCTIONS OF PACKAGING INDUSTRY
Following are the functions:
Protection Convenience
Promotion Unitization
Information Handling
Waste reduction and recycling and reuse of by-products
ROLE OF PACKAGING SECTOR
Packaging is not an end product but a mode of transport and protection for the product.
The aim of the packaging sector is to make the transport cost to minimum to remote their
goods with minimal damage. As per the UK based packaging federation there has been
fall in mass of bottles and steel at 50%.
Packaging is not only confined to protection and transportation of the product it also
plays a role in attracting customers through aesthetic attractive display. Packaging also
fills the function of labeling and branding products.
LIFE CYCLE OF PACKAGING

CH.3:- COMPARATIVE STUDY POSITION OF PACKAGING WITH INDIA
TOP POLYMER PACKAGING COMPANIES IN INDIA
1. Excel Polymers, Mumbai
Annual Turnover: 600 cr INR
Activities:
Excel Polymers is a emerging global supplier of performance elastomer solutions,
offering a wide portfolio of compounded polymer materials, performance additives and
technical know-how, mainly sold to rubber parts manufacturers.
2. Supreme Industries
Annual Turnover: 450 Cr INR
Activities:
Supreme Industries Limited is india's leading plastic processing company with seven
business divisions. The company has forayed into different types of plastic processing in
Injection Moulding, Rotational Moulding (ROTO), Extrusion, Compression Moulding, Blow
Moulding etc.
Supreme Industries limited offers wide range of plastic products with a variety of
applications in Mulded Furniture, Storage & Material Handling Products, XF Films &
Products, Performance Films, Industrial Moulded Products, Protective Packaging
Products, Plastic Piping System & Petrochemicals
3. Polymer Industries India Ltd, Hyderabad
Annual Turnover: 250 Cr INR
Activities
Manufacturer of Wide Range Ultra High Molecular Polyethylene (UHMWPE).Polymer
Industries India Limited Offers a Wide Range of Engineered Polymers and Chemical &
Corrosion Resistant Polymers, Fabricating Items for Paper and Bolting and Conveying
Industries, New Grades of Polyslick Ultra, Polyslick-Seal (Cold-Water), Polymer Liners for

Cement, Steel, Mining's, Power Plants, Dock Fenders for Sea Ports and General
Engineering Items.
HDPE Sheet, Sign Board, Marine Board, Cutting Board, Arena Board, Partition Board,
Pipe Grade, HDPE Rod, Plat Ground Board and HMW Sheet.
4. Krishna Plastics, Delhi
Annual Turnover: 200 cr INR (Trading / Manufacturing)
Activities:
Incorporated in the year 1989, SHEEL PACK (INDIA) manufacturer and supplier of a
broad collection of PP Bags, Bio Degradable Plastic Bags, HM Bags, Polythene Packing
bags, Plastic packaging, Packaging material Printed Polythene Bags, Diaper bags,
Tamper proof bags, Printed Packaging Bags, LDPE bags, Plastic Packaging Bags and
Carry Bags. Our offered assortment comprises Tamper Proof Bags, Self Adhesive Tape
Bags, Plastic Courier Bags, Zip Lock Bags, Plastic Packaging Bags, Polythene Bags,
Security Bags, Vest Type Carrier Bags, Carrier bags, Garment Packaging Bags, Food
Packaging Bags, Retail Bags, Multi utility Bags, Sports Apparel Bags and many more .
5. Lincon Polymers Pvt. Ltd., Ahmadabad
Annual Turnover: 200 Cr INR
Activities:
BOPP Film Lamination on the outer surface of woven bags, gives superfine bright
printing, Enhanced visibility, attractive look to the product, innovative & attractive finishing
that influences buying motivation of the Customer and also repeated use.
Manufactures bags of various specification for the packing of 5kgs, 10kgs, 20kgs, 50kgs
etc with or without Handle, to meet customers specific requirements.
ϒ Multi Color Bag For Packing ϒ Multi Coloured Bag of BOPP
ϒ Multi Coloured Bag ϒ BOPP Woven Bags
ϒ Atta Packing Bags

CH.4:- PRESENT POSITION & TREND OF BUSINESS, i.e. IMPORT & EXPORT WITH INDIA DURING LAST 3-5 YEARS
EU27 trade in goods with India reached a peak in 2010, after the decrease recorded in
2009 which interrupted a period of growth since 2001. EU27 exports to India chop down
from 31.3 billion euro in 2008 to 27.4 bn in 2009, then rise to 34.8 bn in 2010. Imports
decrease from 29.5 bn in 2008 to 25.4 bn in 2009, then improved to 33.2 bn in 2010. As a
result, the EU27 trade excess with India fell from 2.0 bn euro in 2009 to 1.6 bn in 2010.
The first ten months of 2011 show sustained growth in EU27 trade with India. EU27 trade
with India record a small surplus of 0.1 bn in the first ten months of 2011. Over the last
10 years, the share of India in EU27 trade has risen, reaching 2.7% of EU27 exports and
2.4% of EU27 imports in the first ten months of 2011. India is the EU27's 8th most
important trading partner.
million euro 2000
2001 2002 2003 2004 2005 2006 2007 2008 2009 2010
India
Exports 13
678
12
950
14
330
14
572
17
154
21
322
24
392
29
177
31
263
27
427
34
797
Imports 12
846
13
463
13
682
14
064
16
369
19
086
22
614
26
587
29
530
25
443
33
228
Balance 832 -513 648 507 784 2 236 1 778 2 591 1 732 1 984 1 569
Total Extra-EU27
Exports 849
739
884
707
891
899
869
237
952
954
1 052
719
1 160
100
1 240
984
1 309
218
1 097
990
1 349
610
Imports 992
698
979
145
936
972
935
241
1 027
522
1 179
569
1 352
787
1 435
083
1 566
379
1 207
810
1 509
092
Balance -142 -94 -45 -66 -74 -126 -192 -194 -257 -109 -159

EU27 Member States trade in with India
959 438 073 004 567 850 686 099 161 820 481
India / Total
Exports 1.6% 1.5% 1.6% 1.7% 1.8% 2.0% 2.1% 2.4% 2.4% 2.5% 2.6%
Imports 1.3% 1.4% 1.5% 1.5% 1.6% 1.6% 1.7% 1.9% 1.9% 2.1% 2.2%
million euro Exports Imports Balance
Jan-OCT10
Jan-Oct11
Jan-Oct10 Jan-Oct11
Jan-Oct10 Jan-Oct11
EU27 27 958 33 411 27 841 33 318 117 93
Belgium1 5 572 6 593 3 180 4 669 2 393 1 924
Bulgaria 31 59 42 51 -10 8
Czech Republic
488 519 224 256 264 263
Denmark 277 356 451 526 -173 -170
Germany 7 484 8 777 4 497 5 541 2 987 3 236
Estonia 15 29 13 22 2 7
Ireland 136 171 204 264 -69 -93
Greece 46 43 373 461 -327 -418
Spain 957 1 117 1 889 2 114 -932 -997
France 2 462 2 461 3 046 3 362 -585 -901
Italy 2 601 3 074 3 179 4 108 -578 -1 034

Cyprus 11 14 32 46 -21 -32
Latvia 24 66 18 19 5 48
Lithuania 106 100 18 29 88 71
Luxembourg 39 49 7 11 32 38
Hungary 210 307 174 231 35 77
Malta 7 12 50 62 -43 -49
Netherlands1 1 417 1 548 3 114 3 057 -1 697 -1 509
Austria 520 690 264 330 256 360
Poland 213 302 414 548 -201 -246
Portugal 46 77 342 415 -296 -337
Romania 121 133 438 312 -316 -180
Slovenia 68 82 169 188 -102 -106
Slovakia 60 59 54 87 5 -29
Finland 473 494 193 390 280 104
Sweden 1 040 1 276 495 647 545 629
United Kingdom
3 535 5 003 4 960 5 572 -1 425 -570
Total Extra-EU27
1 103 900
1 258 536
1 234 516 1 403 866
-130 617 -145 330
India / Total 2.5% 2.7% 2.3% 2.4%

CH.5:- POLICIES & NORMS OF BELGIUM FOR PACKAGING INDUSTRY
FOR IMPORT/EXPORT INCLUDING LICENCING/PERMISSIONS/TAXATION
Legal obligations – packaging waste
Waste management is the liability of the three Belgian Regions, but they negotiate an
Inter-regional support Agreement to ensure constancy in the transposition of the
Directive’s recovery and recycling necessities. The Agreement requires packer/fillers and
importers insertion more than 300 kg of packaging on the market each year to take back
as much used packaging as is necessary to meet the recovery and recycling target. The
targets applicable to the household packaging recovery organization FOST plus are an
collective of the targets imposed on its members.
Green Dot
Green Dot is a registered trademark of PRO EUROPE and is sheltered in 170 countries.
PRO EUROPE has sublicensed the Green Dot trademark to several European countries
plus Canada and Turkey. It is not a recycling logo but just shows that the manufacturer
has signed an conformity with a packaging recovery organization in that country and the
suitable fees are being paid. By doing so, they are absolve of their liability to recover
their own packaging.
The Green Dot is the most extensively-used trademark in the world, and positively one of
the most familiar in Europe. More than 130 000 companies use the Green Dot trademark
worldwide. Over 200 million people set out of their packaging via a collection system set
up by a Green Dot organization and more than 14.7 million tonnes of used packaging
were recovered and recycled in 2005 by the European organizations
Compliance Options
Manufacturers basically have two options for complying with the Directive. They can link
a pan-European compliance scheme such as Green Dot or choose to come up with their
own packaging recovery programmed that complies with the packaging waste recovery
targets set forth in the national laws.
Participation in the Green Dot recovery scheme - or any scheme - is not compulsory. A
company may select to carry out the responsibility to comply on its own.

Using the Green Dot Logo
Only companies that have signed a licence harmony can use the Green Dot trademark.
The use of the Green Dot trademark and partaking in the Green Dot programme allows
manufacturers who sell their products in the EU to comply with the EU's Packaging
Directive, which requires producers to collect their packaging waste. Companies that are
register in the Green Dot programme are exempted from their entity obligation to take
back and recycle used packaging.
However, they also have a distributor in Belgium that sends products all over Europe.
The manufacturer is obliged to join the Green Dot programme in all countries where their
product is sold and pay the appropriate fees depending on the volume of packaging
entering each country. If they use the Green Dot logo in Germany without permission,
that would be a violation of trademark law.
Payment of Fees
Green Dot fees are paid by the producers of packaging. The fees themselves vary by
country and differ based on the type of material (e.g. paper, plastic or metal). The
structure is based upon the ‘producer pays' principle and takes into account the varying
costs of collection, sorting and recycling of various packaging materials. The system
encourages waste reduction since manufacturers that cut down on packaging waste
ultimately pay less in fees. Fees are more often than based on packaging material type,
‘recyclability' of the material, weight and in some countries, a volume fee per product unit
sold.
Targets
The current Inter-regional Co-operation Agreement, which came into force in 2009, sets
higher recycling target for some materials than those in the Directive.30% of plastics
packaging must be recycled (22.5%in the Directive), and there is a separate
60%recycling target for beverage cartons.
In addition, there are separate overall recovery and recycling targets for household and
for non -household packaging waste: 80% recycling and 90%recovery for household
waste, and 80% recycling and 85% recovery for non-household waste. The Directive’s
targets – 55% recycling and 60%recovery – apply to all packaging waste.
EU Packaging Waste Directive Compliance and Enforcement.

European government authorities and Green Dot organizations are growing
observation and their standard checks of retail locations to make sure that all
products displaying the Green Dot trademark are registered under a real Green
Dot licence. If they are not, the manufacturer is infringing on international
trademark law and will be held accountable.
In the Uk, it is considered a criminal offence not to comply with the Packaging
Waste system and cases may be heard by the High Court. Similar legal action can
be taken in other European countries as well.
Legal compulsion sideways, companies should regard their moral liability to
comply with the regulations. Recovery and recycling is extensively embraced in
Europe and those who choose not to participate may feel strain from retailers or
distributors who refuse to carry their products or end-users who deliberately or
automatically choose another brand based on their insight of the company's
devotion to sustainability.
The smart companies seem beyond the apparently composite web of regulations
and embrace the ultimate ambition of the Directive - to promote sustainability in
Europe through a decline in the amount of packaging generated.

CH.6:- POLICIES AND NORMS OF INDIA IN IMPORT / EXPORT TO THE
BELGIUM
Introduction
Governed by the Foreign Trade Act, 1992
Foreign Trade Regulation Rules,1993, provide for grant of special license,
application for grant of license, fee, conditions for licenses, refusal of
license, amendment of license, suspension of a license, cancellation of
license, declaration as to the value and quality of imported goods,
declaration as to the Importer- Exporter Code number, utilization of
imported goods, provisions regarding making, signing of any
declaration/statement or documents, power to enter the premises and
inspect, search and seizure of goods, documents ,things and conveyance,
settlement, confiscation (Elimination) and redemption and confiscation of
conveyance.
Details of Registration with Regional Licensing Authority
Registration with Regional Licensing Authority is a pre-requisite for
import/export of goods & services.
o IEC (Importer Exporter Code) Number
An application for grant of IEC Code Number duly signed by the applicant should be
supported by the following documents:
Bank Receipt (induplicate) / demand draft for payment of the fee of
Rs.1000/
A photocopy of Permanent Account Number issued by Income Tax
Authorities, if PAN has not been allotted, a copy of the letter of legal
authority may be furnished.
If there is any non-resident interest in the firm and NRI investment is to
be made with repatriation benefits, full particulars thereof along with a
photo copy of RBI's approval.
Import License Issuing Authority : Director General of Foreign Trade.

Validity of Import License : 24 months for capital goods and 18 months
for raw materials components, consumable and spares, with the license
term renewable.
Fees for License Application:
Every request for import license or CCP(Customs Clearance Permit)
should be accompanied by 2 copies of a bank receipt from the Central
Bank of India or a Bank Draft from any Bank indicating the deposit in
accordance with the prescribed scale offers.
Rs.2 per thousand or part thereof subject to a least amount of Rs. 200
and a ceiling of Rs. 1,50,000, where the value of goods exceeds Rs.
50,000.
Rs.200 where Application is filed be SSI units where the CIF (cost
insurance and freight) value of goods specified in the application does
exceed Rs. 2,00,000.
Process of Custom Clearance of Imported
Goods.
Custom Duty on Importing Goods.
Introduction
The concept of import duty is very wide and is almost applicable to every product or item
imported to India excluding a few goods alike food grains, fertilizer, life saving drugs etc.
Import duty form a important source of revenue for the country and are levied on the
goods and at the rates specified in the Schedules to the Customs Tariff Act, 1975.

Import through Sea
Territorial water extends up to 12 nautical miles into the sea from the coast of India and
so the liability to pay import duty commences as soon as goods enter the territorial
waters of India. No duty is livable on goods which are in transit in the same ship or if
goods are in transit from one ship to another.
Basic duty
Basic Duty is a type of duty or tax imposed under the Customs Act (1962). Basic
Customs Duty varies for different items from 5% to 40%. The duty rates are mentioned in
the First Schedule of the Customs Tariff Act, 1975 and have been updated from time to
time under the Finance Act
Additional customs
Additional duty also known as countervailing duty or C.V.D is equal to excise duty
imposed on a like product manufactured or formed in India. It is implemented under the
Section 3 (1) of the Indian Custom Tariff Act.
Special additional duty
Special Additional Duty of Customs is imposed at the rate of 4% in order to provide a
level playing field to indigenous goods which have to bear sales tax. This duty is to
calculated on the aggregate of –
assessable value (AV);
basic duty of Customs;
surcharge
Anti-Dumping Duty
Dumping means exporting goods in a foreign market at a price which is less than their
cost of production or below their "fair" market value available.
HS CodeItem Description w.e.f. 01.03.13 Custom Duty Unit Type Import
Policy Notes- Section VII-Plastics and Articles thereof; Rubber and Articles
Thereof
Polyethylene having a specific gravity of less than 0.94

Polyethylene having a specific gravity of less than 0.94: Linear low density polyethylene
(LLDPE)
HS Code Item Description W.e.f. Custom Duty Unit Type
3901 I. primary forms polymers of ethylene, in primary
390110 Polythylene having a specific gravity of less than 0.94
39011010 Polythylene having a
specific gravity of less than
0.94:Linear low density
polyethylene (LLDPE)
01.03.13 Customs Basic
Duty:
7.5 kg
Basic Duty Pref:
Addl Duty(CVD): 12
Spl Addl
Duty(Spl.CVD):
4
Excise Cess
Customs Cess 3
39011090 Polyethylene having a
specific gravity of less than
0.94: Other
01.03.13 Customs Basic
Duty:
7.5 kg
Basic Duty Pref:
Addl Duty(CVD): 12
Spl Addl
Duty(Spl.CVD):
4
Excise Cess
Customs Cess 3
39012000 Polyethylene having a 01.03.13 Customs Basic 7.5 kg

specific gravity of less than
0.94: Polyethylene having
a specific gravity of 0.94 or
more
Duty:
Basic Duty Pref:
Addl Duty(CVD): 12
Spl Addl
Duty(Spl.CVD):
4
Excise Cess
Customs Cess 3
39013000 Polyethylene having a
specific gravity of less than
0.94: Ethylene-vinyl
acetate copolymers
01.03.13 Customs Basic
Duty:
7.5 kg
Basic Duty Pref:
Addl Duty(CVD): 12
Spl Addl
Duty(Spl.CVD):
4
Excise Cess
Customs Cess 3
390190
39019010 Other: Linear medium
density polyethylene
(LMDPE)
01.03.13 Customs Basic
Duty:
7.5 kg
Basic Duty Pref:
Addl Duty(CVD): 12
Spl Addl 4

Duty(Spl.CVD):
Excise Cess
Customs Cess 3
39019090 Other 01.03.13 Customs Basic
Duty:
7.5 kg
Basic Duty Pref:
Addl Duty(CVD): 12
Spl Addl
Duty(Spl.CVD):
4
Excise Cess
Customs Cess 3
EXPORT PROCEDURES
Procedures have to be followed by (a) ‘person-in-charge of conveyance’ and (b) the
exporter. The procedures are similar to procedures for import, of course, in reverse
direction.

CH.7:- PRESENT TRADE BARRIER FOR IMPORT/EXPORT IN
PACKAGING
Goods and products from European Union nations enter Belgium without any duties
or tariffs. However, goods from nations outside of the European Union face import duties
and a value-added tax (VAT). Depending on the product, these taxes amount to an
average of 5% to 6% of the total value of the product. Consequently, many goods from
outside of the EU face a price disadvantage.
Belgium is part of the harmonized trade system of the European Union. Common
Customs Tariff (CCT) is applicable to goods from non-EU countries, including Australia.
Most duties are ad valorem (%), based on the GATT Valuation Code (approximate CIF
value).
Belgium is a member of the European Union (EU) and preference is given to
associate members of the Union and to developing countries and European Free Trade
Association (EFTA) members. The European Community has steadily replaced national
rules and regulations with European-wide directives. These must be met in addition to all
local and national regulations in Belgium.
All merchandise coming into Belgium must clear Customs and is subject to customs
duty assessment unless the goods are duty or tax exempt by law. Customs duties are,
generally, an ad valorem rate (a percentage), which is applied to the transaction value
(euro) of the imported goods based on the cost of the goods, insurance, and freight
charges. Some articles, however, are dutiable at a specific rate of duty (so much per
piece, liter, kilo, etc.) and others at a compound rate (combination of both ad valorem and
specific rates).
ECO-TAX (ENVIRONMENTAL TAX)
Eco tax will be added at the time of import on some products such as: packaging
materials made from paper and plastic; disposable cameras; batteries and industrial
packaging; containers used to transport solvents, glues and pesticides and the actual
pesticides. The tax is levied to assist the local government to control the cost of the
environmentally safe disposal of waste by-products associated with these type products.

A packing list is compulsory if the shipment contains more than one package and if the
contents of each package are not shown in the commercial invoice. In all circumstances
a packing list facilitates clearance. All discounts must be clearly shown. Digital signatures
are now recognized as a legal instrument for most commercial transactions.

CH.8:- POTENTIALS FOR IMPORT/EXPORT IN INDIAN MARKET
New packaging material developments
High-performance packaging has been developed with strong barrier characteristics, and
also in certain instances active and intelligent components too, respectively, adapt to
changes in pack contents and environment and extend shelf life; or provide information
on the pack and its contents to promote supply chain efficiencies.
New developments in packaging materials were rated as the fourth most important driver
to growth out of those detailed in Table E.1, with 18% of respondents viewing this as
critical, 46% as very important and 36% as fairly important. Key areas under
consideration include:
High barrier materials
Active packaging
Intelligent packaging
Nanotechnology
Digital print for packaging
Paper and board
The world market for paper and board packaging was valued at $164.7 billion in 2003,
representing an increase of 10% on 2002 – principally as a result of the weakness of the
dollar boosting non-US sales –with consumption growing at an annual average rate of
3% since 1999. North American markets accountedfor 32% of sales at $52.2 billion,
growing at a rate of just 0.4% over the period as US demand fell back.Growth was of the
order of just over 3% in Asia, depressed somewhat by weak Japanese demand
wheresales fell by almost 3% year-on-year.
The fastest growing markets for paper and board packaging between 1999-2003 were in
eastern Europe,with investment in new capacity on the up as major players in this sector
– as well as key customers – haveshifted the balance of production away from high-cost
locations in western Europe. In addition, there hasbeen strong growth in Russian paper
and board packaging demand, with consumption rising from $1.2billion in 1999 to almost
$3 billion in 2003.

On the whole, the paper and board packaging industry has experienced difficult trading
conditions in developed markets in recent years, affected by downward pressure on
prices from end-customers, exacerbate by overcapacity within the industry. With only
very modest growth in shipment volumes and declining shipment values in some mature
markets, there has been a greater focus on developing markets in Asia, Latin America
and eastern Europe. While there was strong output growth in both Asia and eastern
Europe in 2003, output fell back in South America with corrugated board volumes down
by around 6% .

CH.9:- BUSINESS OPPORTUNITIES IN FUTURE
The India's packaging industry is growing at an annual rate of more than 15
per cent, driven by high demand for processed food and other consumer
areas.
Western European Packaging industry is dominated by Belgium, France,
Italy & U.K. Paper and Board Leads with 36% of the world market followed
by Plastics. World packaging industry has been growing at a rate of 3-5%
per annum. . The technology and innovation in this sector is improving
day-by-day.
Belgium can buy the waste plastic and paper board materials which are
used in India and can recycle the product that will help the country to attain
high return.
At the similar time the India is been benefited as the recycling of paper and
plastic in India is comparatively lower than that of Belgium.
The competitive Advantage of Belgium is that the country focuses more on
environmental protection better than India so they can sell the concepts of
their packaging like waste management.
Can establish more number of companies that are following Belgium’s
formula for recycling the Packaging Materials.
India has established itself in multilayer films which is competitive
advantage of India. India can outsource this packaging to Belgium and the
country can pack its food and beverages in this type of packaging which
will help to gain the cost advantage

CH.10:- CONCLUSION
Belgium is leading in Diamond Industry, Glass, Pharmaceuticals, Confectionary
industry, food and beverages, metals and cosmetics etc., so there is a high potential
need of well managed packaging industry that will add the value in Belgian market in both
ways i.e, economic and market growth. Belgium has a very high opportunity to grow in
this sector because packaging is the most important aspect of any product to make it a
complete finished good. If the packaging of the product is not proper it will be detrimental
for the industry. That will have a negative impact on the image of the each industry and
the economy of the country. The organized packaging profession is in boom. So every
developing country has advantage to enter in this industry.
There are a number of market developments with major implications for the
packaging industry. Designs have to improve continuously to meet the changing market
and sustainability needs. Emerging markets, with a growing middle class, adopting a
consumption life style, implies business opportunities. New lean, functional and
convenient packaging, are paths to follow, both in mature and emerging markets.
Fluctuating raw material prices in combination with pressure for price reductions from
consolidated brand owners and retailers is a challenge for the industry. Demands are
changing as retailers globalize and increase penetration in emerging markets. Also
packaging suitable for e-business is a future demand together with active and smart
packaging. The need for packaging has been “long-lasting/ sustainable”, but the designs,
materials, styles and functions have evolved and developed tremendously over the years.
Today market demands are getting stronger for packaging development supporting a
sustainable society.
Packaging must perform well in all three magnitudes of sustainability, i.e. people
(social), profit (economy) and planet (environment). A good package should be cost-
efficient and provide value to generate revenue; it should have a good user interface
(handleability, information etc) and should be lean on resources, recoverable and prevent
its contents from being spoilt. Innovation, knowledge generation and transfer are key
elements to realise this and WPO – World Packaging Organisation tries to contribute
through e.g. the World Star (Student) Award Scheme, within the framework of its mission:
“Better Quality of Life through Better Packaging to More People”

To summarize, also in limited growth, mature markets in western Europe, Japan
and North America, there remain opportunities for growth driven by more functional and
convenient packaging, as well as general growth across a range of consumer goods
areas. At the same time, rapid growth in packaging usage in the fast-growing economies
of Asia, Middle East, Latin America and also eastern Europe has presented new
opportunities for packaging suppliers.

ANALYSIS
OF
TRAVELS & TOURISM INDUSTRY

CH.1:- INTRODUCTION OF THE SELECTED COMPANY / INDUSTRY /
SECTOR AND ITS ROLE IN THE ECONOMY OF SPECIFIED COUNTRY
Belgium ranked 21st on the World Economic Forum's 2007 “ Travel and
Tourism Competitiveness Inde”, lower than all the neighbouring countries.
Although the country scored highly for 'natural and cultural resources', it was
ranked only 114th in the world for both 'price competitiveness' and 'availability of
qualified labour'. An investigation of "tourism for all" social tourism practices operating across the
then 15 EU Member States was a further initiative of the 2001 Belgian Presidency.
Belgium also has led the development of social tourism policy and practice41.
Signatories to the Tourism 2023 Vision commit to taking action individually and as
an industry group to achieve a sustainable industry by 2023.
It is based on six principles
i. protecting the environment;
ii. developing employees;
iii. providing customers with mainstream sustainable products;
iv. ensuring that destinations benefit from tourism;
v. innovating to create sustainable transport and resorts; and
vi. Developing a business which is environmentally, socially and financially
sustainable.

INTRODUCTION OF THE COMPANY
BCD Travel is a family-owned company founded on January 3, 2006.The company was
born when BCD Holdings N.V. announced the purchase of TQ3 Travel Solutions
Management Holding GmbH and a majority interest in The Travel Company. Combined
with WorldTravel BTI, these two companies became BCD Travel’s ownership.
About BCD Travel
As a leading provider of global corporate travel management, BCD Travel simplifies and
streamlines the business of travel. This benefits the organization on every level: from the
bottom line to the business traveler. BCD Travel operates in more than 90 countries, with
US$17.2 billion in total sales and a combined worldwide work force of 10,800 people.
BCD Travel is a BCD Holdings N.V. company..
About BCD Holdings N.V.
BCD Holdings N.V., a Dutch family-owned company founded in 1975 by John Fentener
van Vlissingen, is a market leader in the travel industry. The BCD Holdings companies
are BCD Travel (global corporate travel management), Travix (online travel:
CheapTickets, Vliegwinkel, BudgetAir and Vayama), Park 'N Fly (off-airport parking),
TRX (travel transaction processing and data integration), Airtrade (consolidating),
VakantieXperts (leisure) and Parkmobile International (mobile parking and traffic
applications). BCD Holdings employs approximately 13,000 people and operates in more
than 90 countries with total sales, including franchising, of US$20.3 billionFacts and
Figures

Market position : number 1
Employees over 500
Locations Antwerp, Brussels, Liège, Gent
Global Reach BCD Travel operates in more than 90 countries on six continents
Headquarters
Belgium Antwerp
Europe Utrecht, The Netherlands
Global Utrecht, The Netherlands
Americas Atlanta
Asia Pacific Singapore
MISSION, VISION AND VALUES
Our Mission
To power our customers’ success by making the most of their travel investment, keeping
travelers safe and enhancing the traveler experience.
Our Vision
To promote global business growth and positive social impact by improving our clients’
performance, their travelers’ lives and communities worldwide.
Our Values
Vision
We look beyond the horizon to anticipate change. We deliver tomorrow’s travel, today.
We push the boundaries of what we do and how we do it. We embrace the new and use
it intelligently. We are passionate about shaping the next generation of business travel.
Innovation
We’re creative, and we love solving problems in new ways. With a genuinely talented
groupof people, great products, open minds and clients with complex and unique
challenges, we just can’t help ourselves.

Service
Business travel isn’t just about technology and systems. It’s what we do for people with
them that counts. Simply put, we like helping people. We put our customers first—
whether we’re talking about colleagues, clients or partners.
Integrity
We deliver what we promise, and only promise what we can deliver. We do what we say
with warmth, humor, and a great deal of thought. (That’s why people enjoy working with
us!)
Teamwork
We are natural partners with our clients, colleagues, and our community, and we are at
our best when working together to produce extraordinary results. We create bonds that
stretch across departments, organizations, countries and time zones.
Strength
We aim to always exceed our financial goals and the expectations of our clients, our
colleagues and our shareholders. We build our human resources by giving exciting
opportunities to our own people, and bringing aboard new people whose skills enhance
and expand our already strong base. We’re committed to growing our global footprint
together with our customers.

CH.2:-Structure, Functions and Business Activities of selected Industry / Sector / Company
Simplifying and streamlining the Business of Travel
BCD Travel combines service leadership with flexible technology, intelligent
data analysis and strategic solutions to provide travel management advantages to
customers of all sizes, all around the globe.
Our integrated and global technology infrastructure gives you the resources
to access, analyze and act on the dynamic data your travel program is producing
at any given moment in time.
Our consistent service delivery provides your travelers with a broad range of
resources to help them stay satisfied, productive and focused on their business
objectives. Our comprehensive industry insight and strong, stable ownership help
you navigate safely through a rapidly changing and complex business travel
landscape.
A customized solution
Online booking tools can drive significant savings through reduced agent-
assisted booking fees. We have the expertise to help customize an online solution
that best fits needs. We offer the ability to integrate with virtually every
commercially available online booking tool.
Why choose Business Online?
Are you looking for a modern booking tool that is accessible online? Are
you looking for a simple, straightforward solution, and don't want to purchase extra
software to get started? Then Business Online is the ideal solution for you.
Business Online makes optimal use of your travel processes, can be
adapted to your company model, and monitors adherence to your travel policy.

Business Online is ideal for companies who want to streamline their business
travel booking processes while lowering the total cost of travel.
Here is a summary of some features:
Full itinerary with flight schedule, time zone converter,
exchange rate, visa and health information
English and Dutch translation of the booking tool
Full functionality for travel bookers
Availability of detailed traveler profiles
Fare comparisons : the best deal for the best price,
including low-cost carriers
Invoicing via AirPlus, American Express and VISA
Why choose Enterprise Online?
Enterprise Online is one of the most advanced solutions for booking business
travel. With Enterprise Online, you not only have complete control over the
booking process but also over the prior purchasing and approval steps preceding
the booking.
Enterprise Online is a booking tool that can be adapted to your wishes and
requirements. Which is why it is perfectly suited to companies that want to book
their own business trips simply and safely.
Summary of specific features:
Reflects the hierarchy of your organization within the system structure
Possibility of adapting the concept and layout of the site
Multilingual : available in many languages
Supports multiple currencies
Able to integrate several approval levels
Variety of system control levels
Variety of payment options allowed when booking
Modifiable data fields to allow for detailed descriptions when invoicing
Can be implemented in multiple locations and departments

CH.3:- COMPARATIVE POSITION OF TOURISM INDUSTRY OF
BELGIUM WITH INDIA
Tourism industry in india has been developed very rapidly in comparision to
Belgium. economy of the country has contributed a lot due to tourism sector
Ministry of tourism made immense efforts to develop tourism .Ministry of Tourism
made uniform efforts to develop quality tourism infrastructure at tourist
destinations and circuits.
Ministry of Tourism released Social Awareness Campaigns on Television, Radio,
Internert and outdoor media with the objective of sensitizing the masses and
stakeholders about the importance of tourism
Ministry of tourism ,india performs various activities like developing the policies.
promotions and advertising, planning ,controlling .in short it manages each and
every activities systematically and this is the reason that india has grown in
tourism sectors
A maximum amount of `50.00 lakh is approved for each rural tourism project under
this scheme for development of tourism related infrastructure
various schemes are implemented to develop villages . The promotion and
marketing of village tourism is also aimed at generating revenue for the rural
communities through tourists visitation
In the year 2010, the tourism sector had a substantial growth as compared to
2009. The Foreign Tourist Arrivals (FTA) in India during 2010 were 5.58 million as
compared to the FTAs of 5.17 million during 2009 which shows a growth of 8.1%.
The growth rate during 2009 over 2008 was (-) 2.2%. FEE from tourism during
2010 were ` 64889 crore as compared to ` 54960 crore during 2009, registering a
growthrate of 18.1%. The growth rate in FEE from tourism during 2009 was 8.3%.
The tourist industry generates 2.8% of Belgium's Gross Domestic Product and
employs about 3.3% of the working population (142,000 people). 6.7 million
people travelled to Belgium.which is very less in comparision to india

Belgium has got good natural and cultural riches.but due to its bad economic
condition it cannot make huge investments in tourism sector.no doubt country is
doing well in other sectors like steel, glass etc
Various countries like India ,China , Malaysia, Singapore have made efforts in
developing tourism sector and have improved their economic conditions.belgium
should also makes efforts to develop tourism
Belgium generates very less income in comparision to other countries .belgium
has not made more efforts in marketing their tourism sector

CH.4:- PRESENT POSITION AND TREND OF BUSINESS (IMPORT /
EXPORT) WITH INDIA / GUJARAT DURING LAST 3 TO 5 YEARS
Why India is Popular for Tourism ?
India is a vast country with diverse cultures and traditions.
Our country offers a great attraction for those who crave to know about the
splendour and magnificence of one of the oldest civilizations of the world and for
its scenic beauty, right from Himalayas to Kanyakumari and from Gujarat to
Arunachal Pradesh.
We also have a stable political government which a pre-requisite to promote
tourism.
We are famous for our hospitality.
Tourism in India is a large industry.
The World Travel and Tourism Council calculated that tourism generated $121
billion or 6.4% of the nation's GDP in 2011. It was responsible for 39,3 million jobs,
7.9% of its total employment. The GDP of the tourism sector has expanded 229%
between 1990 and 2011. The sector is predicted to grow at an average annual
rate of 7,7% in the next decade.
In a 2011 forecast the World Travel and Tourism Council predicted the annual
growth to be 8,8% between 2011 and 2021. This gave India the fifth rank among
countries with the fastest growing tourism industry.
India has a large medical tourism sector which is expected to grow at an
estimated rate of 30% annually to reach about 9,500 crore by 2015.
The Travel & Tourism Competitiveness Report 2011 ranked the price
competitiveness of India's tourism sector 28th out of 139 countries. It mentions that
India has quite good air transport (ranked 39th), particularly given the country’s stage
of development, and reasonable ground transport infrastructure (ranked 43rd).
India's rich history and its cultural and geographical diversity make its international
tourism appeal large and diverse. It presents heritage and cultural tourism along
with medical, business and sports tourism.

Recent Trends In Indian Tourism :
The tourist numbers and activities in India seem to suggest more of an optimistic
scenario. The gloomy phase of 2008-09 has been mediated successfully with
focused policy
interventions and industry initiatives that in turn added momentum to the growth
process.
From a negative growth of -2.2% in 2009/08, foreign tourist arrivals increased
considerably to register a growth of 8.1% in 2010/09. This turn-around is indeed
encouraging given the fact that global economy was still recovering and has not
reached its usual growth trajectory.
In the contrary, the increase in dollar terms was comparatively less at about 20.8%
during the same period. This could perhaps be attributed to the factors like
variations in the
exchange rate as well as reduced tourist expenditure. Another pertinent dimension
worth noticing is the relationship between the growth in tourist arrivals and the
earnings during this period. For instance, in rupee terms, the annual increase in
earnings has been much faster to that of arrivals with the figures for 2009/08 and
2010/09 recording 8.3% and 18.1% respectively.
Further, while examining the monthly change, it was also observed that the
earnings were fairing much better with only first three months of 2009 accounting a
negative change over corresponding months previous year. But, when it came to
the arrivals, barring December, as the scenario in 2009 was that of either negative
or negligible growth compared to 2008.

Statistics of tourism by state
Share of top 10 states/UT's of India in number of foreign tourist visits in 2011 (provisional)
Rank State/Union Territory Number Share in %
1 Maharashtra 4,815,421 24.7
2 Tamil Nadu 3,373,870 17.3
3 Delhi 2,159,925 11.1
4 Uttar Pradesh 1,887,095 9.7
5 Rajasthan 1,351,974 6.9
6 West Bengal 1,213,270 6.2
7 Bihar 972,487 5.0
8 Kerala 732,985 3.8
9 Karnataka 574,005 2.9
10 Himachal Pradesh 484,518 2.5
Total of top 10 states 17,565,550 90.1
Others 1,929,329 9.9
Total 19,494,879 100
Share of top 10 states/UT's of India in number of domestic tourist visits in 2011 (provisional)]
Rank State/Union Territory Number Share in %
1 Uttar Pradesh 155,430,364 18.3
2 Andhra Pradesh 153,119,816 18.0
3 Tamil Nadu 137,512,991 16.2
4 Karnataka 84,107,390 9.9
5 Maharashtra 55,333,467 6.5
6 Madhya Pradesh 44,119,820 5.2
7 Rajasthan 27,137,323 3.2
8 Uttarakhand 25,946,254 3.0
9 West Bengal 22,256,968 2.6
10 Gujarat 21,017,478 2.5
Total of top 10 states 725,981,871 85,3
Others 124,874,769 14.7
Total 850,856,640 100

CH.5:- POLICES & NORMS OF BELGIUM FOR TOURISM INDUSTRY
The International tourism; expenditures for travel stuff (US dollar) in Belgium was
last reported at 18679000000 in 2010, according to a World Bank report published
in 2012.
The International tourism; expenditures for passenger transport stuff (US dollar) in
Belgium was last reported at 1879000000 in 2010, according to a World Bank
report published in 2012.
The International tourism; expenditures (% of total imports) in Belgium was details
at 5.60 in 2010 according to a World Bank report in print in 2012.
The International tourism; expenditures (US dollar) in Belgium was last reported at
20558000000 in 2010, according to a World Bank report published in 2012.
The International tourism; expenditures (US dollar) in Belgium was last reported at
20558000000 in 2010, according to a World Bank report published in 2012. a
person who makes several trips from a country during a given period is counted
each time as a new departure.
The International tourism; receipts for passenger transport stuff (US dollar) in
Belgium was last information at 1196000000 in 2010 according to a World Bank
report available in 2012. In addition to the services covered by passenger fares--
including fares that are a part of package tours
The International tourism revenue for travel stuff (US dollar) in Belgium was last
details at 10235000000 in 2010 according to a World Bank report available in
2012. These revenue should include any other prepayment made for goods or
services received in the destination country.
The International tourism revenue (% of total exports) in Belgium was last details
at 3.08 in 2010 according to a World Bank report published in 2012. They also
may contain revenue from same day visitors, except for when these are important
enough to justify separate classification.
The International tourism revenue (US dollar) in Belgium were last details at
11431000000 in 2010 according to a World Bank report available in 2012. . These

revenue include any other prepayment made for commodities or services received
in the destination country.
City tax is 1.8% (calculation formula: number of hotel rooms multiply by average
rate for a double room counting breakfast multiply by number of days open
multiply by 65%). The city tax should always be an broad part of the charge and
not charge alone.
Today, twenty-two EU countries (Austria, Belgium, the Czech Republic, Denmark,
Estonia, Finland, France, Germany, Greece, Hungary, Italy, Latvia, Lithuania,
Luxembourg, Malta, Netherlands, Poland, Portugal, Slovakia, Slovenia, Spain,
Sweden), plus Norway, Liechtenstein, Monaco, Iceland and Switzerland fully apply
the provisions of the Schengen acquis and may move freely.
Other aliens i.e. national of any country other than those referred to over wish to
stay in Belgium for longer than three months necessitate a long-term visa. Official
documents drawn up in a language other than French Dutch English or German
must be translated by a confirmed translator
When roving into Belgium you might be ask to present one or more of the following
documents: a hotel reservation return ticket or some form of proof that you have
sufficient funds to cover your visit (e.g. cash, cheques or credit cards that are
accepted in Belgium or an original financial support certificate initialled by the
respective embassy or consulate).
Time required to issue visa48 hours to 8 weeks, depending on nationality and
resident status and whether applying by post or in person. Certain nationals must
apply in person (contact Consulate or Consular section at Embassy for further
details).
Short-stay (single- and multiple-entry): usually valid for 6 months from date of
issue for stays of maximum 30 or 90 days per entry. Transit (single- and multiple-
entry): valid for a maximum of 5 days per access including the day of arrival

CH.6:- POLICIES AND NORMS OF INDIA FOR IMPORT OR EXPORT TO BELIGUM INCLUDING LICENSING /PERMISSION, TAXATION
In an attempt to develop tourism in India systematically and to harness full potential of
the industry, GoI has taken several measures from time to time. These include
formulation of the tourism policy and various initiatives to promote tourism infrastructure
development and marketing and promotion activities.
KEY AREAS OF TOURISM POLICY 2002
SALIENTS OF TOURISM POLICY
Position tourism as major engine of economic growth.
Harness direct and multiplier effects of tourism for employment generation and
economic development and to provide impetus to rural development.
Focus on tourism as major driver of tourism growth.
Position India as global brand to take advantage of the burgeoning global travel
trade and the vast untapped potential of the country as a destination.
Acknowledge the critical role of the private sector with the government working as
pro-active facilitator and catalyst.
Create and develop integrated tourism circuits based on Indian’s unique
civilization, heritage, and culture partnership with states.

Ensure that tourist to the India are physically invigorated, mentally rejuvenated,
culturally enriched, spiritually elevated and “feel India from within”.
Open Sky Policy
GoI’s Open Sky policy, which gives permission to domestic airlines to commence
international flights, start-up of various low-cost carriers, and fleet expansion by domestic
players have created immense incentives for domestic travelers to explore far-off
destinations within and outside India.
Foreign Direct Investment
In the hotel and tourism industry, 100% FDI is permissible through the automatic route.
Here, the term ‘hotel’ refers to restaurants, beach resorts, and other tourist complexes
providing accommodation and/or catering and food facilities to tourists. The tourism
industry includes travel agencies; tour operating agencies; tourist transport operating
agencies; and units providing facilities for cultural, adventure and wild life experience
and surface, air and water transport facilities; and leisure, entertainment, amusement,
sports, health and convention/seminar units.
Indian Exports to Belgium 1) Handicrafts and Gifts
2) Leather
3) Jewelry
4) Home Furnishing

CH.7:-Trade Barriers in Import and Export between India & Belgium
Trade barriers refer to government-imposed policies to restrict international trade. Most
commonly, a country’s government employs tariffs, duties, embargoes and subsidies as
trade barriers. However, imposing trade barriers are against the concept of free trade,
popularized by developed nations.
Economic Impact of Trade Barriers
Import restrictions affect international trade relations, which in turn leads to a decline in
exports. Thus, the protectionism regime that is employed to protect certain sectors
actually tends to retard the growth of the entire economy.
The opportunities and challenges of international trade have been an issue of major
concern for the economists and policy makers of the contemporary world. As far as the
challenges facing the international trade are concerned, they vary with the economic and
social scenarios of the countries involved in cross border trade. Be it a developed or
developing economy, the primary challenge of global trade is to maximize the gains from
trade. The countries involved in international trade always try to focus on the efficient
utilization of the opportunities derived from exchange of goods and services with their
trading partners. To utilize the benefits of the open market economy is another major
challenge before world trade.
In this era of globalization, international trade has a crucial role to play so as to bring
about economic and social harmony among the developed and developing nations of the
world. With openness to trade becoming more popular, the issues of trade solidarity both
at the domestic and multilateral level have gained huge importance across the world.
India: Foreign Trade Policy
Till the early 1990s, India was a closed economy: average tariffs exceeded 200
percent, quantitative restrictions on imports were extensive, and there were
stringent restrictions on foreign investment. The country began to cautiously
reform in the 1990s, liberalizing only under conditions of extreme necessity.
India is now aggressively pushing for a more liberal global trade regime, especially
in services. It has assumed a leadership role among developing nations in global
trade negotiations, and played a critical part in the Doha negotiations.

India has recently signed trade agreements with its neighbors and is seeking new
ones with the East Asian countries and the United States. Its regional and bilateral
trade agreements - or variants of them - are at different stages of development.
Trade picture
India is an important trade partner for the EU and an emerging global economic
power. The country combines a sizable and growing market of more than 1 billion
people.
The value of EU-India trade grew from €28.6 billion in 2003 to €79.9 billion in
2011.
EU investment in India more than tripled between 2003 and 2010: going from
€759million in 2003 to €3 billion in 2010.
Trade in commercial services tripled during the same time period, going from
€5.2billion in 2002 to €17.9 billion in 2010.
Belgium Trade, Exports and Imports
As raw materials and natural resources are not sufficient, the balance of trade is
usually towards imports and thus there is always some trade deficit in Belgium.
According to the 2009 estimates, Belgium had an export volume of $296.1 billion and
ranked 13th in the world. This, however, showed a tremendous drop from the 2008
figures, which shone bright at $371.5 billion. The various export commodities include:
Machinery and equipment
Chemicals
Finished diamonds
Metals and metal products
Foodstuffs
Dismantling trade barriers in India
The European Commission's Trade and Investments Barriers Report, published in March
2012, points out that some progress has been made to dismantle trade barriers in India:
Two trade barriers were fully removed in 2012: export restrictions on cotton and
security requirements for telecommunication equipment.

Progress has also been achieved with regard to sanitary and phyto-sanitary rules.
No positive movement has been seen in the area of equity caps.
India's industrial policies contain trade-restrictive elements.
The report also identified India's national manufacturing policy as a key priority for
reform.

CH.8:- TOURISM POTENTIALS AND OPPORTUNITIES IN INDIA
Tourism sector plays vital role in the economy. With its well-built backward and
forward linkages with other sectors of the economy, tourism has the not only be the
economy driver, but also a competent tool for society up liftmen. Although Indian
government had taken remarkable steps to improve the tourism, there is a need to
improve those steps with reference to following points.
Heritage Tourism:
India is enormously rich in terms of its plentiful monuments, palaces, heritage
areas, intangible resources, cultural heritage, arts and crafts etc. These are extended
across the country thus providing for numerous visits. These heritages should be
maintained properly and should be marketed to attract tourist.
Cultural & Rural Tourism:
It helps to showcase rural prosperity in terms of rural living, art, culture and
heritage at rural locations and in villages, which have core capability in fine art and trade,
handloom and textiles. Rural areas also showcase our natural atmosphere The
promotion of village tourism should be aimed and encouraged to generate income for the
rural communities.
Medical Tourism:
India is emerging as a key health check tourism destination of the world because
of its State of the art medical services, reputed health care professionals, quality nursing
facilities, fewer waiting time for availing the medical services etc. These facilities are
limited to some cities only which should be extended to more cities and also to the
villages.
Wellness Tourism:
The centre point is on ‘Body, Mind and Soul’. The Indian structure of medicine,
that is Ayurveda, Yoga, Panchakarma, Rejuvenation Therapy etc are among the early
systems of medical treatment of the world. Global standard healthcare is given at
comparatively low cost and many Ayurveda resorts and centres have come up. These

facilities are more popular in south of india and lots of tourist have to go and travel to
enjoy these facilities. They should be made available to more places.
Eco Tourism:
India has numerous natural/ eco regions including Tiger Reserves, Nationwide
Parks, Sanctuaries, wilderness areas etc. Sustainable tourism developments are taking
place nearby these regions.
Adventure Tourism:
Adventure travel involves exploration or travel to distant, interesting areas. Various
adventure tourism products are being developed together with trekking, camping, skiing,
aerosports etc.
Cruise tourism:
Cruise shipping is being developed as a very vibrant product, mostly in view of the
vast and beautiful shores of India, virgin forests undisturbed idyllic islands, custom etc.
Due to the numerous rivers, River cruise is also being developed.
A. TOURIST ARRIVALS
Foreign tourist arrivals in India during 2010 to 2012 are as follows:
2010 2011 2012
5583746 7846397 8072964
The above table indicates substantial increase in foreign tourists in 12 years

From the above graphs, it is apparent that numbers of foreign tourist visits to India during
last 12 years have been always registering an increasing trend, excluding a decline in
foreign tourist visits in the years 2002 and 2009. This has been due to due to global
disturbances affecting travel post 9/11 and the economic slowdown.
A. INDIA’S SITUATION IN WORLD TOURISM SCENARIO
World Tourism Scenario:
Tourism has become a well-liked global leisure activity. The world tourism situation
shows that in 2012, there were over 940 million international tourist arrivals world over,
with a expansion of 6.6% as compared to 2009. International tourism revenue grew to
US$919 billion in 2012, corresponding to an increase in real terms of 4.7%.
As per the most recent figures, tourism generates 5% of the world’s GDP, 30% of the
worldwide exports of services and one in 12 jobs. Tourism is the third major economic
activity in the European Union providing directly and indirectly as much as 10% of the
GDP and employing as much as 12% of the workforce.
The World Tourism Organization reports the following ten countries (2012) as the most
visited by the number of international travellers.
Tourist in
Rank Country Region millions
1 France Europe 86.8
2 USA North America 79.7
3 China Asia 75.5
4 Germany Europe 63.8
5 Italy Europe 61.5
6 England Europe 58.1
7 Turkey Europe 35.6
8 Belgium Europe 32.4
9 Malaysia Asia 24.5
10 Spain Europe 22.9

France occupied the top place in terms of arrivals, followed by USA, China, These
top 10 countries accounted for 44.4% share of international visitor arrivals in 2012. The
maximum arrivals were in Europe accounting to 50.7% of world tourists. In terms of
international tourism receipts worldwide, Europe’s percentage share is 44.2% of the
world. In terms of outbound travel, Europe contributes to 52.8% of international tourists.
India’s position:
India’s rank in international tourist arrivals was 41st with the percentage share a meagre
0.59%. Tourism is an important contributor to Foreign Exchange Earnings (FEE). In
terms of international tourism receipts worldwide, India’s percentage share is 1.24% of
the world.
The FEE out of tourism stood at USD 16183 million in 2012 as compared to USD 11394
during 2009 and USD 11747 million during 2008.The increase rate in FEE in USD terms
during 2010 was 24.6% as compared to a decline of 3% in 2009 over 2008.

CH.9:- REVIEW OF TOURISM GROWTH AND POSSIBILITIES
While India is affluent in terms of prosperity of its traveller destinations, society and
history; it lags behind in transportation, roads, communication and other service sectors
compared to European countries. To arrive at tourist destinations in India, it sometime
requires extensive and tiring travel unlike in Europe, where the tourist destinations are
nearer and travel is relatively short and pleasant.
Tourism should be developed as an important service sector for India. However, it still
gets only 1.68% of international travellers and much lesser than outbound travels also.
This is the correct time to scale up at a great deal for higher pace, a number of of the
reasons which are preventive India in attracting probable tourists are:
Poor Infrastructure and Accommodation gaps
Awareness of safety in the region
cleanliness and sanitation
Competitors having more competitive packages
Severe scarcity of trained manpower
Perception of tourism environment
Lack of flawless travel
B. ACCOMMODATION INFRASTRUCTURE
The difficulty of accommodation is the largest drawback of Indian tourism sector. India
has only about 129,000 hotel rooms in 1,790 hotels across the country as against
required 250,000. Among them five star hotel room comprise of 28 per cent, four star 6.5
per cent and three star 8.5 per cent. On the other hand total number of hotel rooms in
China is 1,000,000; Thailand 250,000; and Indonesia 270,000.
The requirement of accommodation in the country is estimated at 250 thousand
rooms. The MOT is therefore vigorously involved in monitoring the formation of additional
accommodation.
Following plans/strategy/initiatives should be taken for expansion of accommodation
infrastructure:
RBI should separately give credit for hotel projects without considering them in
commercial real estate; thereby enable them to avail benefit of long term credit at

relaxed regulations and subsidized interest rates. In addition, the External
Commercial Borrowing regulations should be made less stringent by MOF.
MOT should enthusiastically support the Hospitality Sector to meet the maximum
international standards by setting up state of the art infrastructure facilities, new
guidelines for project approval, tax holiday for the entrepreneurs who invest in the
hotel accommodation projects
C. IMPROVED PRIVATE PARTICIPATION
For reforms in the tourism, speedy clearances of hotel projects and to deal with the
problems faced by the hotel industry, Union Cabinet should approve setting up of a
‘Hospitality Development and Promotion Board’ (HDPB).
D. CAPACITY BUILDING EFFORTS
Enhancing the Institutional Infrastructure of Hospitality Education by
- Opening new Institutes of Hotel Management (IHM) and Food Crafts (FCI)
- To increase the capacity of existing IHMs
- Facilitating private sector investments
Hospitality Education to be broad based to cover
- Universities / Colleges
- Polytechnics / Industrial Training Institutes
- Professional Education at +2 level through CBSE and other State Level Boards
Skill development through short term courses for 8th pass youth up to 28 years of age.
Such courses also to be conducted through 2100 Classified hotels
Skills of existing Service Providers to be certified after a short training to enhance
their employability
E. HYGIENE AND SANITATION
This is one of the key differentiating features between developed countries and India.
Hygiene, waste management and uncontaminated water are main concern areas in
tourism. MOT should come up with an action plan to get better about hygiene and
sanitation in general and at destinations in particular:
Sensitizing and formation of general awareness between all stakeholders, together
with local communities
Widespread societal Awareness should be increased drive under ‘Atithi Devo Bhava’
initiative being undertaken

F. TAXATION
The tax structure in the hotels and tourism industry is not as favourable as compared
to the other Asian countries.
Country Taxes on Hotel Tariff
Country Taxes on Hotel Tariff
China 5% Malaysia 6%
Japan 5 % Singapore 7%
Hong
Kong
NIL Thailand 7%
In India the tariff on hotel tariff varies from 20 to 30% (depending on State).
Rationalisation of tariff and creation of globally competitive tariff rates, is an aspect which
could boost tourism.
STRATEGY TO ATTRACT MORE TOURISTS
With the number of tourist in India increasing every year, there is some growth
potential and the drivers the MOT should be working on. The following may be a broad
level strategy to add more number of tourists.
A. MARKETING STRATEGY
Sub branding: INCREDIBLE INDIA campaign has worked well to get a brand image
of India. While continuing this as main branding, sub-branding of key circuits which
will attract tourists should have differential branding to create a top of mind recall and
these could be well-connected brands under the apex brand of India.
Influencing the Influencers: Networking with international tour operators
- Network of dense promotional bodies which ally public-private partnerships at
three levels: national, regional and local are required to promote tourism.
- Referencing on all the large international tourist operators completed by booking
and sales reservation systems of several large transport and accommodation
networks.
B. INTEGRATED DEVELOPEMENT & ACTIVITIES OFFERED TO TOURISTS
Integrated development of prioritised Circuits/ Destinations to become major success
stories need to be focussed upon, as discussed in previous section.

The large diversity of activities which could cover whole set of tourism themes like
culture, discovery and adventure, shopping, religion, entertainment, wellness and
health, MICE, sport and physical activities, etc are required
The strength of governance systems, which often combine the public and private
sectors, notably in the large density of professional associations
The high density of security and hygiene norms which assure clients of trustworthy
and secure services.
C. BEAT THE SEASONALITY OF TOURISM
Innovative Product development coupled with marketing efforts to counter Seasonality of
Tourism will be the key.
D. INCREASED PRIVATE SECTOR PARTICIPATON
Industry incentives: Government has come up with incentives for private players in the
Tourism and Hospitality sector. However, there are more incentives and proactive
involvement with the industry which could be worked out. In most of the tourism regions,
majority of the tourist travel activities are taken care by the private sector. Their
involvement is very critical in bridging the gaps.

BUSINESS OPPORTUNITIES IN FUTURE
Major companies and organisations have now pledged to collaborate to create a
commercially sustainable tourism industry by the year 2023 which benefits
communities in tourist destinations and protects the environment.
The scenarios, vision and a strategy to implement the commitments were
launched at the ABTA Travel Convention in Barcelona on October 8th, 2009. More
than 100 people with expertise in different facets of the industry - including
business leaders, academics, legislators, campaigners and commentators – have
been involved in creating them.
Signatories to the Tourism 2023 Vision commit to taking action individually and as
an industry group to achieve a sustainable industry by 2023. It is based on six
principlesprotecting the environment; developing employees; providing customers
with mainstream sustainable products; ensuring that destinations benefit from
tourism; innovating to create sustainable transport and resorts; and developing a
business which is environmentally, socially and financially sustainable.
An important event in Flanders the coming years will be the commemoration of
World War I, which will start in 2014.
The key findings reveal that most of the survey participants associate destination
Flanders with its popular Belgian chocolates. The fact that Belgium produces
170,000 tonnes of chocolates every year in over 2,000 chocolate shops was rated
as the top most tempting element about the Fabulous Flanders.
It is also interesting to note that both trade and consumers have shown an active
interest in promoting and visiting the Belgian battlefields during the centenary
event of First World War in 2014.


CH.10:- FINDINGS CONCLUSIONS AND SUGGESTIONS
RECOMMANDATIONS
There should be some additional benefits given to the passengers as they are
spending their money for food, drink etc. and gain more tourists.
The city tax should always be an inclusive part of the rate and not charged
separately. Some hotels include City Tax in the rate; some hotels charge the City Tax as a
supplement, so proper tax structure should be there which provides common tax
rate for the tourists. Visa process for the European countries is very easy compared to other non
European countries with whom European union’s don’t have trade agreement , so
there should be some specific agreement required for other non European
countries which develops a good relation with between Belgium and other
countries There should be a standard language for the documents of visa which is
applicable to all countries which makes the visa procedure standard and easy to
understand for the tourists around the world More efforts should be there for increasing the number of tourists in belgium by
developing different policies to attract them
CONCLUSION
The tourist’s policies of Belgium are very nice and easy to understand. The visa procedure is also easy to proceed and also less costlier on average
For any applicants to access visa for Belgium financial support is required with
having a medical certificate which indicates their fitness and avoid spreading any
dieses in the Belgium. As the export is less than import in tourism, causes increase in expenditure rather
than revenue. The visa procedure processing time is also less compared to other European
countries.

ANALYSIS
OF
METAL INDUSTRY

CH: 1 INTRODUCTION OF IRON &STEEL INDUSTRY
The iron & steel industry has been a major and important industrial sector for the Belgian
economy. In fact, from the mid of 19th century, it was the largest factory in the world, in
Seraing, which is owned by the company “John Cockerill” S.A., located in Belgium, and
this factory has become a world leader in steel production for more than a century.
The iron & steel industry in Belgium suffered a significant decline in the period of 1970s
and 80s, due to largely deteriorating global demand and growing competition. The sector
never really picked up again, though there was a recovery in global demand. More
recently, the formation of the Duferco and Arcelor groups has, however, enabled the
historic Steel producers begin to grab the world, whilst maintaining and modernizing a
certain number of facilities. In fact, the present situation demonstrates how central the
iron & steel industry remains to our economy.
Apparently some economies were emerging, such as Asian countries and new EU
Member States, first of all, are large consumers of steel and its many by-products of
steel. Some of them have also become major producers. Factories located in Belgium,
have become profitable once more as a result of a heavy increase in global demand and
hence prices were rising for raw materials and steel products, before faltering again due
to falling global demand. The emerging challenges such as economic and environmental
challenges have led the Bank to consider recent sector developments in terms of
economic impact, and also in relation to some closely linked global factors.
GDP facts & Role of Iron & Steel Industry in India
o The Iron and Steel Industry in India is one of the fastest growing sectors
o The demand drivers for the Indian Iron & Steel industry are increasing in the
activities of the various industries such as automobiles industry, transportation
system, real estate industry, ship building industry, aircraft industry and so on.
o India’s rank is 5th in the world in terms of production of steel
o The quantity of crude steel produced was 50.71 million tons in 2006-07
o The quantity of finished steel produced was 51.9 million tons in 2006-07
o The finished steel production was increased by 16.52%

o The finished carbon steel was produced 24.8 million tonnes in the year 2006-07
o Expectedly India would become the second biggest producer of steel by the year
2016 and the production per year would be 137 million tonnes
o The exports pertaining to the steel industry was 6.26 % in the period 2006-07
Consumption of Iron and Steel Industry in India
o The domestic consumption of steel has increased by12.5% in the last three years
o The domestic steel consumption was 41.14 million tons in the year 2006-07
o The average growth rate is 11.36% of the Indian Iron and Steel Industry
o The construction projects all over India are major consumer of steel
o The per capita consumption of steel in India is 35kgs

CH:-2 STRUCTURE/FUNCTION & BUSINESS ACTIVITIES OF IRON &
STEEL INDUSTRY
Background
The establishment of Tata Iron and Steel Company (TISCO) in 1907 was the starting
point of modern Indian steel industry. Afterwards a few more steel companies were
established namely Mysore Iron and Steel Company, (later renamed Vivesvaraya Iron &
Steel Ltd) in 1923; Steel Corporation of Bengal (later renamed Martin Burn Ltd and Indian
Iron & Steel Ltd) in 1923; and Steel Corporation of Bengal (later renamed Martin Burn Ltd
and Indian Iron and Steel Co) in 1939.1 All these companies were in the private sector.
Key Events
1907*: Tata Iron and Steel Company set up.
1913: Production of steel begins in India.
1918: The Indian Iron & Steel Co. set up by Burn & Co. to compete with Tata Iron and
Steel Co.
1923*: Mysore Iron and Steel Company set up
1939*: Steel Corporation of Bengal set up
1948: A new Industrial Policy Statement states that new ventures in the iron and steel
industry are to be undertaken only by the central government.
1954: Hindustan Steel is created to oversee the Rourkela plant.
1959: Hindustan Steel is responsible for two more plants in Bhilai and Durgapur.
1964: Bokaro Steel Ltd. is created.
1973: The Steel Authority of India Ltd. (SAIL) is created as a holding company to oversee
most of India's iron and steel production.
1989: SAIL acquired Vivesvata Iron and Steel Ltd.
1993: India sets plans in motion to partially privatize SAIL.
Source: * Government of India, Joint Plant Committee Report 2007

The policy envisages steel production to reach at 110 mt by 2019-20 with annual growth
rate of 7.3 percent. As later sections will show these expectations are not excessively
high. With increasing need for large investments in the industry private sector’s role
would be crucial in the development of the steel industry. The future, it appears, will
continue to be dominated by a few large players and the industry will remain oligopolistic
– as it is internationally. Moreover, as shown in Appendix I share of fixed cost to total cost
for selective steel producers in India is very high making it prone to increasing returns to
scale and the consequent market structure (See Table A1.8). TISCO, public sector
entities, POSCO, Jindals, Essar, and Arcelor-Mittal will be among the major players
accounting for the bulk of the 100 plus million tons of production in the future. There is a
key factor behind the predominance of large units and oligopolistic industry structure. And
that is the production process. The following section discusses the process and
underlying technology.

CH.3:- COMPARATIVE POSITION OF IRON & STEEL PRODUCT WITH
INDIA & GUJARAT
COMPETITION SCENARIO (INDIA)
Overview:
From the biggest players like SAIL and Tata Steel, to mid-level players like Bhushan
Steel and Wels pun, the next four years are a time to ramp up. SAIL, a state-owned
public sector undertaking and India's largest steel manufacturer, is planning to increase
its annual production of 12 million tones per annum (mtpa) to 22.5 mtpa by 2011-12.
Tata Steel proposes to increase its steel making capacity to 33-34 mtpa by 2015, besides
increasing the capacity of its Jamshedpur plant from 5 mtpa to 10 mtpa. In addition, the
Tatas are planning to set up a 12-mtpa Greenfield project in Jharkhand, a 6-mtpa plant in
Orissa and another 5 mtpa capacity unit in Chhattisgarh.
According to London-based Iron and Steel Statistics Bureau (ISSB), India's Tata Steel,
which recently acquired Anglo-Dutch firm Corus Group, has been ranked the world's sixth
largest producer of the alloy with an output of 24 million MT. India-born business tycoon
Lakshmi Mittal- controlled Arcelor Mittal has emerged as the largest producer with total
production of 118 million metric tonnes in 2006, after Mittal Steel acquired European
giant Arcelor SA for US$ 38.3 billion in the industry's biggest ever transaction.
Significantly, in the country ranking, India is ranked at the seventh position, with a total
output of 44 million MT (up eight percent from previous year).
As India surges ahead in building infrastructure and catapulting its industry to new
economic highs, investments in steel will pave the way ahead. Mittal Steel has
announced a 12-mtpa Greenfield steel project in Jharkhand and a 12-mtpa Greenfield
steel plant in Orissa.

Major Players of Steel & Iron Industry: Tata Steel:
Tata Steel (earlier known as Tata Iron & Steel Company or Tisco) represents the
country's single Largest, integrated steel plant in the private sector. The company has a
wide product portfolio, which includes flat and long steel, tubes, bearings, ferro-alloys and
minerals as well as cargo handling services. While in terms of size, Tata Steel ranks 34th
in the world; it was ranked first (for the second time) among 23 world class steel
companies by World Steel Dynamics in June 2005. Recent overseas acquisitions are
Tata Steel buying Anglo-Dutch firm Corus for over 12 billion dollars.
With its plant located in Jamshedpur (Jharkhand) and captive iron ore mines and
collieries in the vicinity, Tata Steel enjoys a distinct competitive advantage. The main
plant at Jamshedpur manufactures 5 MTPA of flat and long products, while its recently
acquired Singapore-based company, NatSteel Asia, manufactures 2 MTPA of steel
across Singapore, China, Philippines, Malaysia and Vietnam.
Steel Authority of India Limited (SAIL):
Steel Authority of India Limited (SAIL) is a leading Public Sector Undertaking (PSU) in
which the Government of India owns about 86 per cent of equity. It is a fully integrated
iron and steel maker, producing both basic and special steels for domestic construction,
engineering, power, railway, automotive and defense industries and for sale in export
markets. It is ranked amongst the top ten public sector companies in India in terms of
turnover.
They manufactures and sells a broad range of steel products, including hot and cold
rolled sheets And coils, galvanized sheets, electrical sheets, structurals, railway products,
plates, bars and rods, stainless steel and other alloy steels. SAIL have five integrated
plants and three special steel plants, located principally in the eastern and central regions
of India and situated close to domestic sources of raw materials, including the Company's
iron ore, lime-stone, and dolomite mines. The company has the distinction of being
India’s largest producer of iron ore and of having the country’s second largest mines
network. This gives them a competitive edge in terms of captive availability of iron ore,
limestone, and dolomite which are inputs for steel making.

Bhushan Power & Steel Ltd:
Bhushan Power & Steel Ltd., an ISO 9002 certified company, is a merged entity of
Bhushan Industries Ltd., Bhushan Metallic’s Ltd. and Decor Steel Ltd. Bhushan Steel has
a turnover of more than USD 540 Million and is a leading manufacturer of Flat, Round
and value added products in Steel.
Bhushan have 7 World class and state of art plants at Chandigarh, Derabassi, Kolkata,
and Orissa in India. A completely integrated plant is commissioned under Phase I in
Orissa and Phase II is all set for takeoff. In Orissa plant, technology and equipments are
procured from world-renowned Companies like Luirgi from Germany, ABB Ltd., SMS
Demag, Siemens etc. It is selling its Value added range of products in Secondary Steel
through a large distribution network in India (comprising more than 25 sales offices) and
abroad.
Jindal Steel & Power Limited (JSPL):
Jindal Steel and Power (JSPL), part of the US$4 billion Jindal Organization, has business
interests in steel production, power generation, mining iron ore, coal and diamond
exploration/mining. The current turnover of the company is over Rs. 30 billion and on a
path of catalyzing economic development of the country through its contribution to the
infrastructure sector. JSPL with its obsession for excellence is increasing its portfolio of
value-added products, bringing the world's best to India and making an international
mark. Production Capabilities expanded to serve the infrastructure sector, catalyzing
economic, development and growth. JSPL has the integrated steel plant (as approved by
Joint Plant Committee) at Raigarh in the state of Chhattisgarh, India. The facilities include
world's largest coal-based Sponge Iron Plant with a capacity of 1.37 million TPA using
ten indigenously developed rotary kilns. The company has achieved complete backward
integration with its captive iron & coal mines making it one of the lowest-cost producers of
sponge iron .The steel making capacity has been expanded from 400,000TPA to 1.15
million TPA.
JSPL today is the largest private sector investor in Chhattisgarh with a total investment of
Rs.100 Billion. JSPL has recently signed an MoU with the State Government of Orissa to
set up a 2 million tonne steel plant with an investment of Rs.13.5 billion which would be
expanded to 6 million tone and another MoU has been signed with the State Government

of Jharkhand to set up a 5 million steel plant with an investment of Rs.120 billion.
ESSAR Steel:
Essar Steel Limited (the "Company") is the flagship Company of the Essar Group and
looks after the Group’s interest in the steel business. The Company was incorporated in
June 1976 under the name of Essar Construction Limited and was engaged primarily in
core sector activities, including marine construction, pipeline laying, dredging, and other
port-related activities. In 1984, the Company ventured further into other core sectors
mainly the field of exploration and development, drilling onshore and offshore oil and gas
wells for Indian Public Sector oil exploration companies. In view of this the Company’s
name was then changed to Essar Offshore and Exploration Limited in May 1987. In
August 1987, the Company’s name was changed to Essar Gujarat Limited, to reflect its
highly diversified business interest. In 1988, the Company made an initial public offer for
its shares, which are now listed on Bombay Stock Exchange, National Stock Exchange of
India and 2 other Indian Stock Exchanges.
The Company diversified into the steel business in late 1980s with the purchase of an
HBI Manufacturing plant in Emden, Germany, which was dismantled and relocated to
Hazira, on the West coast of India.
The HBI plant with a capacity of 0.88 MPTA was completed in March 1990 and
commenced commercial production in August 1990. As part of its business strategy of
focusing on the iron and steel sector, the Company hived of its unrelated businesses to a
series of different companies (each of which form a part of the Group and operate at
arm’s length relationship) - Offshore and energy operations were transferred to Essar Oil
Limited in May 1992, Civil and mechanical construction businesses were transferred to
Essar Projects Limited in March 1993. The Company with a vertical integration program
in mind, commenced construction of world-class state-of-the-art technology Hot Rolled
(HR) sheets and coil plant in 1992. The plant commenced trial production in April 1995
and commenced commercial production in April 1996. To reflect its business strategy of
focusing on steel making operations, the name of the Company was changed from Essar
Gujarat Limited to Essar Steel Limited in December 1995.

CH:-4 PERSENT POSITION & TERND OF IMPORT & EXPORT OF INDIA
& BELGIUM
India enjoys traditional, warm and friendly relations with Belgium. Trade relations go
back to the 17th century when ships sailed from Ostend to Indian ports. India
established diplomatic relations with Belgium in 1948 and there has been regular
interaction at high levels since then.
Important Bilateral Treaties and Agreements, with brief notes:
• Agreement on Avoidance of Double Taxation- August 1997
• Bilateral Investment Protection Agreement signed between India and BLEU in
November 1997.
• Cultural Agreement- September , 1973
• Air Services Agreement- April, 1967
Commercial and Economic Relations, with trade, aid and investment details:
Commercial and Economic relations are governed by Agreement on Economic,
Industrial, Scientific and Technological Cooperation between BLEU and India in March
1990 and other EU and WTO Agreements. Belgium has emerged India’s second
largest trade partners within EU with bilateral trade in 2004 at 6.49 billion euros, 75% of
which is in diamonds. India’s aim is to diversify bilateral trade which is dominated by
diamonds to areas of information and communication technology, pharmaceuticals,
biotechnology where there is a tremendous potential for synergy.
The liberalization of the Indian economy in the 1990s aroused Belgian interest in
India. The initial interest translated into an increasing number of official and business
visits to India in recent years. Crown Prince Philippe led three economic missions to
India(1995,1998, 2005). The visits generated enormous interest on either side resulting
in several viable deals in the form of joint ventures and technology tie-ups. According
to the Secretariat for Industrial Assistance(SIA) Belgium’s total investment approvals
into India for the period 1991- Sep.,2004 touched a record figure of Rs. 46,402.5
million (approx. US $ 1.2 billion), with 1998 being a particularly good year account for
about 80% of this amount. The actual investment flows for this period, however, have

not kept pace with the approvals. There are an estimated 231 joint ventures, most in
the small and medium 8 category. Belgium Company Tractabael is the largest investor.
BARCO and BEKAERT are established in India for many decades. During the 2005
visit of the Economic Mission, 5 MoUs were signed. CII signed 3 MOUs with Belgian
companies Agoria, VBO, Flanders Institute of Logistics. IBA Pharma of Belgium and
MK Ali Manekia, a non-resident Indian signed MoU for research and development
activities in the health sector. IBA Molecular Imaging signed the MoU with Indian
Diagnostic Laboratories of Dewang Chand Agrawal for Molecular Research.
Major items of Indian exports to Belgium are iron & steel products, minerals fuels, oils
and products thereof, apparels and clothing accessories, organic chemicals, fishery
products, man made staple fibres, electrical machinery etc. Major items of imports to
India from Belgium are precious stones and metals, boilers, machinery and mechanical
appliances, iron & steel products, pharmaceuticals, organic chemicals, plastic & its
products, electrical machinery & equipments, photographic & cinematography
equipments, measuring equipment, wood pulp etc. In the case of investment, some
Indian companies have acquired business in Belgium.
Global trade and investment practices of Belgium & India(Belgium)
Principal Exports: Machinery and equipment, chemicals and pharmaceuticals,
diamonds, metals and metal products, foodstuffs, plastic & rubber
Total Exports: Euros 197.1 billion in 2004. Belgium is the 10th largest exporter in the
world.
Principal Imports: Machinery and equipment, chemicals, diamonds, pharmaceuticals,
foodstuffs, transportation equipment, oil products
Total Imports: Euros 188.9 billion in 2004. Belgium is the 9th largest importer in the
world.

Top 10 Trading partners of India for 2008-09 :
TABLE:-4
Country Trade 2008-09 (Rs. In crores)
Trade Balance
CHINA 1,63,202 -92,676
USA 1,55,353 12,254
UAE 1,52,668 -1,934
SAUDI ARABIA 1,05,602 -64,303
GERMANY 67,602 -19,497
SINGAPORE 63,280 2,934
U K 50,144 524
HONG KONG 50,129 1,772
BELGIUM 41,552 -5,294
NETHERLAND 33,099 19,049

CH.5 POLICIES AND NORMS OF BELGIUM FOR IMPORT / EXPORT INCLUDING LICENSING / PERMISSION, TAXATION
Belgium is part of the European Union so they follow all common trade policy for all
member countries of EU. The Belgian government has published regulations relating to
customs and other pieces of tax legislation which can be found on the following website:
Tariffs
Customs Transit
Customs Valuation
Rules of Origin
Cultural Goods
Counterfeiting and Piracy
Licensing: trade Import licenses with due consideration for the provisions of relevant
European Union trade agreements and the needs of the specific importing country.
They have to follow some regulations related to quality, types of product, uses of product
etc.
Quality Standards: According to EU's "New Approach to Technical Harmonization",
definite products are required to meet the specific quality standards including toys,
machinery, telecommunications terminal equipment, medical devices, electrical
equipment, appliances, etc which are mostly directly or indirectly related to metal
industry. Qualified products must hold a CE mark to show its compatibility, fixed onto the
product by a manufacturer or importer as self-declaration of compliance.
IMPORT REGULATIONS:
Policies and norms of Belgium
The agreements signed and in oblige between India and Belgium are as under:
Social Security concord in November 2006 (came into force in September 2009); concord
on cooperation in the field of Science & Technology, November 2006; concord on

Avoidance of Double Taxation (DTAA) – August 1997; Bilateral Investment Protection
concord (BIPA) signed between India and BLEU in November 1997; Cultural harmony-
September, 1973; and Air Services Agreement- April, 1967
Belgium is a federal state, the three regions have large self-rule over the design and
implementation of policy supporting renewable energy sources and power efficiency of
residential housing. Each state therefore has its own strategy in this regard and its own
set of policy dealings.
Power efficiency of suburban housing is supported in all regions by a broad set of
instruments Which includes loans and premiums for investment in lagging, glazing,
heating, appliances, energy audits and probability studies. Here in Belgium Investment is
also supported by the federal government by financial incentives and VAT reductions. The
support schemes are defined on a yearly basis.
The main endorsement scheme for renewable energy is green certificates. Here all three
regions possess their own green certificate (GC) schemes. A allocation obligation on
electricity suppliers to supply an increasing ratio of their electricity from renewable
sources. The federal government has introduced an added scheme for offshore airstream.
The justification for public support for investment in solar panels is spelled out in the
programming certificates of the Walloon area and of Hainaut. The intention goes beyond
solar energy production is- By installing stellar panels on communal buildings the
government is looking for to increase the consciousness of the people, set an example in
the use of renewable energy and give to a positive image of the area. The programming
certificates of the Flemish state do not bring out any particular rationale for public
interference in power efficiency in societal board.
Belgium is a federal state with three stages of government –
o federal,
o regional,
o linguistic communities – a complex division of responsibilities.
The three regions of Flanders, Wallonia and Brussels-Capital are mainly liable for power
efficiency, renewable vigor sources (except offshore wind which is the competence of the

federal government), power R&D (except nuclear) and the allocation and supply of
electrical energy and gas
CH.6 IMPORT AND EXPORT POLICY AND NORMS OF INDIA IN IRON &
STEEL INDUSTRY
Iron & Steel and Scrap
Steel is decidedly the vital component of a country's economy and is considered
as the crux of modernisation. The level of per capita consumption of steel is treated as
one of the important indicators of socio-economic development and living standards in
any country. Steel continues to be the foremost engineering material, environment-
friendly and is recyclable.
The finished steel production in India has grown from a mere 1.1 million tonnes in
1951 to 66.01 million tonnes in 2010-11. The growth in the steel sector in the early
decades after independence was mainly in the public sector units. However, following the
adoption of new economic policy and subsequent deregulation and decontrol of Indian
Iron & Steel Sector, the 1990's witnessed accelerated growth in the private sector,
catapulting its share of finished steel from 45% in 1992-93 to 80.1% in 2010-11.
Liberalisation of the Indian Steel Sector
The Government's new economic policies have opened up opportunities for
expansion of the Steel Industry. With a view to accelerating growth in the steel sector, the
Government since 1991 has been initiating and implementing a number of policy
measures. These measures have impacted the Indian steel sector to achieve a positive
growth.
NATIONAL STEEL POLICY
The National Steel Policy (NSP) was announced in 2005. The salient features of the NSP
2005 are as under:

1) The NSP has set a target of 110 million tonnes of domestic steel production by
2019-20. This would require about 190 million tonnes iron ore. To meet the
additional iron ore requirement, the Government plans to take the following steps:
(a) Create additional mining capacity of 200 million tonnes iron ore.
(b) Encourage investments totalling to about ` 20,000 crore.
(c) Ensure that clearances from authorities of Environment & Forest be obtained
within a specified time frame.
(d) To make investment plans for large number of iron ore leases which are idle.
(e) Renewal of existing leases only against credible mining investment plans.
(f) Grant of fresh leases only against new norms and stringent assessment of
technical and financial capabilities of the applicants.
(g) Restrictions on long-term exports of iron ore to a maximum of 5-year contract.
(h) Encourage sintering and pollicisation so as to use fines which make up about
90% of the present exports.
2) Projections for requirement of coking coal and non-coking coal were fixed at 70
million tonnes and 20 million tonnes, respectively, to achieve the target steel
production. The NSP has recommended first priority to the Steel and Sponge Iron
Industry in allocation of higher grade (below 12% ash content) non-coking coal.
The policy makes it clear that 85% of the requirement of coking coal will have to
be imported. Further, reduced rate of production of non-coking coal would
necessitate import of non-coking coal as well for utilisation in the steel sector. The
coal shortages have prompted the NSP to call for a constant review of allocation
and pricing of natural gas as a suitable alternative.
3) The NSP assumes that 60% of the new steel capacity would come up through
blast furnace route, 33% through sponge iron & EAF route and 7% through other
routes. Sponge iron units are expected to increase capacity from 13 million tonnes
at present to 38 million tonnes by 2020, especially in Jharkhand and Odisha. The
NSP envisages a judicious blend of exports and domestic supply of steel.
4) The NSP also seeks the up gradation and modernisation of the refractory industry.

5) The NSP seeks to examine and formulate corrective measures to obtain fiscal
incentives which are usually available to other infrastructure projects as also the
rationalisation of customs and excise duty structure for reducing the fiscal and
revenue deficits.
6) NSP 2005 is presently under review and Ministry of Steel has formulated a
Committee in May, 2012 to review the existing National Steel Policy 2005.
TRADE POLICY
As per the modified Export-Import Policy incorporated under the Foreign Trade
Policy (FTP) for 2009-14, the imports of primary forms of pig iron, spiegeleisen, sponge
iron, ferroalloys, stainless steel, remelting scrap, as also the semi-finished products of
iron, non-alloy steel or stainless steel (such as flat-rolled products, bars, rods, coils and
wires), primary and semi-finished forms of other alloy-steels, etc. are unrestricted.
Similarly, the exports are also allowed freely. In order to preserve iron ore resources for
domestic
FOREIGN TRADE
Exports
Exports of iron and steel (total) increased sharply by 66% in 2010-11 to 10.17
million tonnes from 6.12 million tonnes in the previous year. Steel exports in 2010-11
comprised of finished steel (including cold rolled sheets) 5.1 million tonnes (50%) and
semi-finished steel (including steel ingots) 3.51 million tonnes (34%). Other items
together accounted for remaining 16% exports. Exports in 2010-11 were mainly to
Belgium (14%), USA (11%) and Saudi Arabia, UAE, Iran and Kuwait (6% each). Exports
of pig and cast iron including spiegeleisen increased to 15 lakh tonnes in 2010-11 from
6.2 lakh tonnes in the previous year. Exports were mainly to Thailand (56%), China
(27%), Rep. of Korea (5%) and Japan (4%)
Imports
Imports of iron and steel (total) in 2010-11 decreased slighly to 14.40 million
tonnes from 14.44 million tonnes in the previous year. Imports in 2010-11 comprised of
semi-finished steel including ingots 5.9 million tonnes (41%) iron and steel scrap 4.6
million tonnes (32%) and finished steel including cold rolled sheets 3 million tonnes
(21%).

WORLD REVIEW
The world production of pig iron in 2010 was about 1,085 million tonnes as against
978 million tonnes in 2009. China, Japan, India, Russia, Rep. of Korea, Brazil, Ukraine,
Germany and USA were the principal producers. World crude steel production in 2010
increased to 1,418 million tonnes from 1,231 million tonnes in 2009. China was the top
producer accounting for 44% of world's crude steel production, followed by Japan (8%),
USA (6%) and India (5%). Other important producers were Russia, Republic of Korea,
Germany, Ukraine, Brazil, Turkey and Italy. use on cheaper rates, export duty on iron ore
has been increased w.e.f. 30/12/2011 to 30% ad valorem on all varieties of iron ore
(except pellets).

CH.7:- PRESENT TRADE BARRIERS FOR IMPORT /EXPORT OF IRON & STEEL PRODUCT:
Relations between India & Belgium
(Trade barriers between India-Belgium)
In this era of globalization of the economic environment, international business plays an
important role in shaping the social, and economic performance as well as the prospects
of countries around the world. International business is of prime importance, especially
for developing countries. India is an important trade partner of the EU and a growing
global economic power. The growth in the trade of goods between India and the EU has
been strong. India exports a variety of products to the EU. The major export items are
textile, cloths, jewellery and gems, organic chemicals, machinery, leather goods,
pharmaceuticals, 39electronic goods, iron, steel, food, etc. Economic and trade relations
with the EU have always been very important for India. The EU and India trade in goods
as well as in services. In 2009, the EU had an export business of €27.5 billion with India,
and import from India was €25.4 billion in the trade of goods. Also, the EU services
export to India was of €8.6 billion and import of services from India €7.4 billion.
Barriers are obstacles preventing entrant firms from being established in a particular
market (Anders, 2009). For every firm looking to invest in an international market, it is
important to understand what will prevent it from being successful there. Also, for the firm
already doing business, it is necessary to know barriers to the further growth. Some
barriers exist because of the government policies and regulations, and some are hidden
barriers. National culture and social forces have the power to restrict the activities of
international business. The nations that have an intense political unrest can change their
attitude towards foreign companies at any time; in turn, this instability makes an
unfavorable atmosphere for the international trade. For export performance in
international business, access to the foreign market is a critical determinant. Barriers to
trade have a negative impact on the foreign market access. Tariff barriers are not very
important due to several rounds of the WTO. The naturally existing barriers, or hidden

barriers’ are language and customs, but this does not mean that they are impossible to
overcome. Nevertheless, these non-tariff barriers should not be ignored as they have a
great effect on international trade. These barriers affect more the developing countries
than the developed ones.
The EU is India’s major trading partner among the many. There is a remarkable growth in
trade between India and the EU. Between years 2001 to 2010, the average annual
growth of India’s export to the European Union was 18% and imports to India from the
EU 19.5%; the largest importer of Indian goods is Germany. Figure 1 show that according
to a report of the European Commission, the EU import from India increased from 1.9%
to 2.2% in 2008–2010 and EU export to India increased from 2.4% to 2.6%.India’s export
consists mainly of industry and manufactures (48%), agro-food products (4%), textile
goods (20%), services (18%). Export of India to the EU concerns mainly three sectors:
textile, services and industry, and manufactures. Only 14% of India’s export is absorbed
by the EU. India is still not a significant destination for goods and services of the EU.
CHART :-2
1. Bilateral Treaties and Agreements:-
The various agreements that are signed and in force between India & Belgium are as
follows:- Social Security Agreement in November 2006 (came into force in September
2009); Agreement on cooperation in the field of Science & Technology, November 2006;
Agreement on Avoidance of Double Taxation (DTAA) – August 1997; Bilateral

Investment Protection Agreement (BIPA) signed between India and BLEU in November
1997; Cultural Agreement- September, 1973; and Air Services Agreement- April, 1967
etc.
2. Economic and Trade Relations:-
Belgium has emerged as one of India’s important trading partners in the EU. Gems and
jewelry constitutes over 75% of the bilateral trade. India’s IT sector is represented well in
Belgium, with all the big IT companies and their establishments. Along with this several
Indian companies in the chemical sector have also established their offices/warehousing
facilities in Belgium, and more of them are near the port city of Antwerp. Belgian business
interests in India cover energy, dredging, construction, ports, banking and finance,
chemicals and fertilizers, electronics and software, solar energy and biotechnology.
3. Bilateral Trade:-
Belgium is the second largest trading partner of India in the European Union with annual
bilateral trade turnover amounting Euro 10.4 billion in 2010. India is the 5th largest
exporter to Belgium (after USA, China, Japan and Russia) and 2nd largest importer of
Belgian products in 2010 (after USA). The major items to Belgium by of Indian are -
Precious stones; Textiles and garments, Iron and steel, Chemical products, Organic
chemicals, Mineral products, Machinery and Electrical Equipments etc. The major items
of Indian imports from Belgium are- Precious stones, Machinery and mechanical
appliances, Iron and steel, Chemical products, machinery and mechanical appliances &
parts thereof, boilers, Organic chemicals, Plastics and articles thereof, Plastic and rubber;
Pharmaceutical products etc. Memorandum of understanding on cooperation in railway
sector has been agreed upon.

CH.8:- POTENTIAL FOR IMPORT-EXPORT IN INDIA/GUJARAT MARKET:
Iron and steel is the second largest item in Belgium’s import basket. In 2012, these
imports amounted to US$ 7.7 bn with a share of 14% in Iran’s total import basket.
Major suppliers to belgium are UAE, South Korea, Germany, Turkey and China.
Potential to enhance India’s exports to Belgium can be accessed from the fact that
India’s exports of US$ 192 mn in 2012 accounts for only 2.5% of Iran’s total
imports, a steep decline from the 16.7% share in 2010.
“Our modenization and expansion is on track as we believe this is the right time to
get prepared for the better time and I think the sector will revive by 2010-11," SAIL
director commercial Shoeb Ahmed said. He added that the company would add 10
million tons (mt) by 2010-11.
SAIL would be pouring Rs 54,000 crore in the expansion programme to gear up its
production capacity to 26.2 mt from the current level 15 mt.
Ahmed said, "Global steel production in 2008 was down 1.2 percent to 1,327 mt
but in December, steel production was down 23.4 percent to 84.4 mt, against of
105 mt as projected.
Major producers even cut production by 30 to 40 percent."
Domestic steel production by 2010-11 could reach 80 to 85 mt, from around 60 mt,

as demand from the domestic market would continue to grow with the economy
growing at 6 percent next year.
TABLE:-4:
Tata Steel has undertaken Brownfield expansion to enhance its production
capacity to 10.5 million tons from the present 6.8 million tons. In the April-
December period, Tata Steel has registered a 45.3 percent rise in net profit at Rs
11,469 crore, while net sales for the consolidated entity rose 26.63 percent to Rs
1,20,914 crore.

CH.9:- BUSINESS OPPORTUNITIES IN FUTURE
Unexplored Rural Market:
The Indian rural sector remains fairly unexposed to their multi-faceted use of steel.
The rural market was identified as a potential area of significant steel consumption way
back in the year 1976 itself. However, forceful steps were not taken to penetrate this
segment. Enhancing applications in rural areas assumes a much greater significance
now for increasing per capital consumption of steel. The usage of steel in cost effective
manner is possible in the area of housing, fencing, structures and other possible
applications where steel can substitute other materials which not only could bring about
advantages to users but is also desirable for conservation of forest resources.
Opportunities for the EU Steel sector and its sub-sectorsg of iron and
New market opportunities and improved bargaining power through acquisitions and mergers
Even though the European steel industry has consolidated significantly within
recent years, there is still room for further consolidation in the steel industry and its sub-
sectors through mergers and acquisitions, notably to match players at the supply and the
demand sides and improve the steel industry’s bargaining power. Increased consolidation
-regionally or even globally - improves the foundation for shaping a business strategy
designed to access the best capabilities, knowledge, and assets from wherever they
reside and apply them wherever required thus improving management capacity over the
business cycle. Already, some steel companies have become large regional or global
players with production facilities across the globe. Their global presence increases their
capacity to meet the demands of global customers with considerable bargaining power
and with specific product standards and requirements.
Acquisitions of companies outside Europe and mergers between EU companies
and non- European companies also hold the potential of giving the EU industry access to
new markets. Moreover, mergers do not in themselves result in better conditions and new

business opportunities. This very much depends on the ensuing integration process and
the strategy development, implementation, and management.
The above does not fully apply to the foundry sub-sector. The clear tendency is
that foundries are becoming integrated parts of customers, while mergers of more
foundries are relatively rare. However, investments in EU based foundries by actors
outside the EU are taking place, and some foundries cooperate in holdings to work more
efficiently.
Increased upstream participation and integration
Upstream participation and integration form valuable strategic possibilities for the
European steel industry with a view to ensuring sustainable access to raw materials and
energy, e.g., setting up production operations in countries close to natural resources and
by acquiring iron ore mining capacities to obtain a in-house supply of iron-ore. Setting up
own power plants is an option currently explored by Arcelor-Mittal. In 2005, the company
already produced 1/3 of its own power needs.
Upstream process and raw material efficiency
Upstream processing and optimisation of raw material utilisation is another way to
strengthen the steel industry's raw material efficiency, thus dampening the consequences
of supply-side sensitivity. Moreover, such improvements may lead to lower energy
consumption and CO2 emission (see further below).
Cleaner and safer technologies
More efficient technologies constitute an important opportunity in terms of increasing
energy efficiency and reducing emissions. Thus, technological innovation with a view to
cleaner and safer technologies are important, partly required by legislation, but also
having the potential of reducing costs and meeting the increasing demand for cleaner
and safer technologies (also part of Corporate Social Responsibility/CSR). Most
importantly, cleaner and safer technologies provide an important strategic opportunity in
terms of proactively pursuing new business opportunities.

CH:-10:- CONCLUSION & SUGGESTION
The Arcelor Mittal Group was one of the world's leading steel producers for more
than a century, before going into decline in the 1970s.
It is expected that India would become the second biggest producer of steel within
the year 2016 and the production per year would be 137 million tones.
The Belgian ports play a major role in transporting the raw materials necessary for
steel production and conveying the semi-finished and finished products in transit.
Opportunities:
The biggest opportunity before Indian steel sector is that there is enormous scope for
increasing consumption of steel in almost all sectors in India. The following graph gives a
glimpse of untapped potential of increasing steel consumption in India even to reach the
comparable developing and lately developed economies like China and other Europe a
quantum jump in steel consumption will be required.
India has rich mineral resources. It has abundance of iron ore, coal and many other raw
materials required for iron and steel making. It has the fourth largest iron ore reserves
(10.3 billion tonnes) after Russia, and Australia. Therefore, many raw materials are
available at comparatively lower costs. It has the third largest pool of technical manpower
next to United States and the erstwhile USSR capable of understanding and assimilating
new technologies.
Unexplored Rural Market:
The Indian rural sector remains fairly unexposed to their multi-faceted use of steel. The
rural market was identified as a potential area of significant steel consumption way back
in the year 1976 itself. However forceful steps were not taken to penetrate this segment.
The usage of steel in cost effective manner is possible in the area of housing, fencing,
structures and other possible applications where steel can substitute other materials
which not only could bring about advantages to users but is also desirable for
conservation of forest resources.

Export Market Penetration
It is estimated that world steel consumption will double in next 25 years. Quality
improvement of Indian steel combined with its low cost advantages will definitely help in
substantial gain in export market.
The Indian Government's new Liberal economic policies have opened up
opportunities for expansion of the Steel Industry. These measures have impacted
the Indian steel sector to achieve a positive growth.
The modified Export-Import Policy incorporated under the Foreign Trade Policy
(FTP), the imports of primary forms, also the semi-finished products are
unrestricted. Similarly, the exports are also allowed freely.

ANALYSIS
OF
GEMS & JEWELLERY INDUSTRY

CH.1:- INTRODUCTION OF DIAMONDS:
Among all the major natural resources on earth, diamonds have often been
considered the most mysterious. For centuries they have been prized for their
extraordinary brilliance and hardness. Battles have been fought over diamonds, fortunes
have been won and lost and lovers around the world have prized the stone as a token of
their deepest affections.
What is a diamond? Super hard and luminescent
For centuries diamonds have been associated with supernatural qualities, including
the power to protect their wearer and confer good health. Some people swallowed
diamonds in hopes of recovering from sickness. Ancient Hindus believed diamonds gave
off silent vibrations that could heal the human brain and heart. Some believed diamonds
could reconcile a quarreling husband and wife—hence the reference to the diamond as
the “reconciliation stone.”
The word diamond comes from the Greek word adámas, meaning adamant or
unbreakable, and indeed hardness is one of the qualities that has always made
diamonds so valuable. Measured on the Moos hardness scale, diamonds score a 10, the
highest possible rating. Diamonds are also extremely high in luminescence, the ability to
catch the light and sparkle with different colors. Cut and polished to show off their
brilliance, diamonds have a visual appeal like no other stone.
Origins: deep within the earth
Diamond crystals form deep within the mantle of the earth when carbon is exposed to
extreme pressure and very high temperatures. Volcanic rock formations such as
kimberlite or lamproite pipes serve as pathways that convey the fragments of rocks and
crystals from the mantle to the surface. The diamonds, along with vast quantities of
magma, are blasted upward in the course of violent eruptions.
Kimberlite pipes, the richest source of mined diamonds, are usually shaped like a carrot
and can extend as deep as 1 to 2 kilometers underground. Lamproite pipes are
shallower, up to 0.5 kilometer in depth, and typically have a broader, martini-glass shape.
Diamond-rich lamproite pipes are extremely rare. To date the only economically viable
diamond-bearing lamproites have been discovered in Western Australia. Kimberlites are

more common and are found in southern Africa, Russia and Canada. Kimberlite and
lamproite pipes are known as primary diamond sources.
Secondary diamond sources are deposits that have been removed from the primary
source (a kimberlite or lamproite pipe) by natural erosion and eventually deposited in
riverbeds, along shorelines, in glaciers and on the ocean floor. They are also known as
alluvial deposits. Although alluvial deposits account for only 10-15 percent of the world’s
diamonds, they are generally higher-quality stones given that they retain more volume
after polishing; they therefore command a higher price.
The location of the diamond deposits determines the mining method that producers
use Diamonds found deep in the earth are extracted through open-pit and underground
methods. Alluvial mining methods are employed to extract diamonds from deposits of
sand, gravel and clay. Diamonds located in the seabed are mined through marine mining
techniques

Uses of diamonds: jewels and industrial tools
Diamonds serve two main functions today: jewelry and industrial uses. Slightly more
than 50 percent of the volume of diamonds extracted becomes gemstones for jewelry, yet
they account for more than 95 percent of the total value.
Polished diamonds have always been considered among the world’s most precious
gemstones. They account for about 40 percent of all jewelry manufacturing; engagement
rings are the largest category of diamond jewelry. Jewelers usually set the diamonds in
precious metals such as gold or platinum to emphasize the sparkle of the stones.
Stones not suited for jewelry, called “bort,” are used for industrial purposes. Key
characteristics that make them valuable for industrial uses include the following:
Hardness As the hardest natural substance, diamonds can work with other materials
without breaking.
Thermal conductivity Diamonds are among the best conductors of heat and have a
melting point of 6,420 degrees Fahrenheit.
Optical dispersion Diamonds have great capacity to refract light, with a refraction index
of 2.42; in comparison the refraction index of glass is 1.52.
Given their hardness and conductivity, diamonds suit a number of industries. They serve
as drill bits for machinery and as abrasive
slurries to cut and polish other materials.
They are also used inthe production of
microchips and computer processors, and they
serve as components in lasers. Today more
than 95 percent of industrial diamonds are
synthetic—that is, they are mostly produced
using high-pressure, high-temperature
synthetic processes that mimic conditions deep within the earth’s mantle.

CH.2:- STRUCTURE, FUNCTION AND BUSINESS ACTIVITIES OF
GEMS AND JEWELLERY INDUSTRY
Business activities
Upstream Business Activities
Upstream business activities are the core business activities or based on activities
which consist of exploration, and Exploration is an activity aimed at obtaining information
on the condition geology to find and specified in the Work Area.
Exploitation is a series of activities aimed to produce final products from the specified
Work Area, which consists of drilling and completion of wells, construction of
transportation facilities, storage, and processing
Mining: The first stage in the value chain of the Gems and Jewellery Industry is mining,
i.e. the extraction of gold/diamonds from their natural deposits. Diamonds are typically
mined by pipe mining or by alluvial mining. Pipe mining refers to the extraction of
diamonds from volcanic pipes, while alluvial mining involves the extraction of diamonds
from riverbeds or ocean beaches. Gold mining consists of the processes and techniques
employed in the removal of gold from the ground and there are several techniques by
which gold may be extracted from the earth.
Diamond/Gemstone Processing by De Beers:
The 'Diamond Pipeline'
Rough diamonds are sent directly from De Beers mining operations in Africa, or
secondary mining producers in Canada and Russia to De Beers' Diamond Trading
Company (DTC) in London, Gaborone, Kimberley and Windhoek, for sorting and resale.
The rough stones are separated into 16,000 categories based on size, color and quality,
then divided by human or automated sorters into individual lots called "boxes." The DTC
is part of the DeBeers Group supply-chain known as the Central Selling Organization
(CSO), which combines ("aggregating") supplies of rough diamonds from multiple
sources into one wholesale market.
De Beers Sightholders

The DTC holds a sale called a "site" or "sight" ten times per year in London and
Johannesburg, where De Beers sells the "boxes" to its select group ("supplier of choice")
of 125 "sightholders" or diamond manufacturers, cutters, and retailers . De Beers (DTC)
sets the price of each box in advance, determining the quantity and quality that each site-
holder will receive. A 'sight' can have a value of between $500,000 to $2,000,000 USD.
(Source: http://www.allaboutgemstones.com/diamond_pipeline.html)
The sightholder then transports the box of rough diamonds back to diamantaire firms
(cutting and polishing factories) located around the world. Many Sightholders are also
cutters. Rough diamonds are cut in various geographic regions according to tradition and
the skill-sets of the labor force. India cuts the vast majority of small stones (20 carats or
less) in Mumbai (Bombay) and Surat, while large stones are primarily cut in Antwerp, Tel
Aviv, Ramat Gan, and New York. Other major cutting centers are located in
Johannesburg, China, and Thailand.
The diamonds are then re-sold from the cutting and polishing (manufacturing) centers to
wholesalers (Diamond Bourses), or to jewelry manufacturers around the world. Both

traders and manufacturers may sell diamonds "upstream" and "downstream" through the
diamond pipeline, to take advantage of market fluctuations. Once the diamonds are set
into jewelry, they are sold to retailers or direct to the customer.
1. Procurement: This refers to the obtaining of rough diamonds by CPD
manufacturers. India has traditionally been procuring and processing the small
size diamonds (generally 0.5 to 25 points9), though this trend is now changing and
large size factories have started procuring larger size diamonds.
Processing
1. Planning of cut.
2. Cutting.
3. Polishing.
4. Grading.
A mined diamond stone first needs to be planned forcutting – i.e. it is carefully examined
by the cutter and then marked for cutting.
Assorting and Planning: Assorting refers to the categorisation of rough diamonds into
different types, while planning refers to determining how a diamond needs to be cut so as
to get the maximum yield / maximum value from the rough diamond. Planning is one of
the most critical aspects in the value chain of the CPD segment. Planning may be done
manually or by using planning machines and software (with basic knowledge of computer
operation) for example, the Sarin or Helium Technologies. Procured rough diamonds are
mainly of two types –“make-able” diamonds (i.e. rough diamonds that can directly
polished) And rough diamonds that need to be first planned and cut before faceting /
polishing.
Cutting and Polishing: Once planned, the diamond is cleaved/sawed, i.e. it is first cut
into one or more pieces based on the plan. Cutting may be done by each company/cut
diamonds may be procured from smaller companies that do only sawing work on job lot
basis. Cutting may be done by laser machines or by blade sawing machines by placing
the rough diamonds in ‘dops’ or cup-shaped holders. The use of laser machines has
been on the rise.
Grading: A diamond's cost is based on the characteristics known as the "4 Cs", namely,
Clarity, Colour, Cut and Carat. Grading refers to the determining the ‘level’ of each of
these characteristics for a diamond – for example, How colourless is the diamond
(Colourcharacteristic)? What is the level of inclusions in the diamond (Clarity

characteristic)?How good are the proportions and shape of the diamond (Cut
characteristic)? How big is the diamond (Carat characteristic)?
Colour: Colour quality is critical because the more colourless the diamond, thegreater its
rarity and value.
Clarity: Clarity refers to whether or not inclusions can be seen within a diamond. The
common scale used is based on 10-power magnification. The purer a diamond, the
greater its value.
Cut: Cut refers to the shape of the diamond and the proportions of the stone. When a
stone is well cut, light is reflected from facet to facet, then dispersed through the top. The
better the cut, the greater the sparkle. Diamond cut is typically graded as: Ideal,
Excellent, Very Good, Good, Fair and Poor
Carat: A“carat” is the gemologist’s standard measure of a diamond’s weight. It is
important to note that size alone is meaningless unless cut, clarity and colour are
considered.
2. Trading: Trading refers to the process by which cut and polished diamonds are
sold.
3. Design: In this phase, designs are made either as per an order placed by a
customer or based on trends seen in the market. Designs are made on paper or
using CAD, which is the trend nowadays. Designs are then validated with the
customer, samples are made, re-validated with the customer and the design is
finalised.
4. Export / Retail: Gold jewellery / stone studded jewellery is exported / retained for
domestic use. India currently exports a small proportion of gold jewellery, and
most of the jewellery produced is consumed in the domestic market.

CH.3:- COMPARATIVE POSITION OF GEMS & JEWELLERY WITH
INDIA AND GUJARAT
India’s position in the global market
The global market for gems and jewellery is estimated to be worth USD 85
billion with key markets such as South Africa, USA, Italy, Belgium and Israel
having registered an average compounded annual growth rate (CAGR) of 5-10% in
the last decade.
World’s largest hub for diamond processing
Largest consumer of Gold in the world
2nd largest producer of gold jewellery in the world
World’s largest cutting and polishing industry
The global market for gold is estimated to be 3,300tonnes
India’s exports in Gems &Jewellery was USD 20.89 billion in 2007-08
The sector contributes 13.4% to India’s total exports
11 out of 12 stones set in jewellery are cut and polished in India
Diamonds processed in India account for 55% share in terms of value,
80% in terms of cartage and 90% in volume, of the total world market
94% of global workers involved in diamond industry are in India
Gems and Jewellery is one of India 's leading foreign exchange earning sectors.
It accounted for 16.7 per cent of India 's total Merchandise Exports.
India Gems &Jewellery exports are expected to grow at a whopping 15 to 20 per
cent in FY 2011-2012.
Total estimated jewellery sales In India is expected to reach USD 21billion by 2010 and
USD 37 billion by 2015
Indian Gems &Jewellery Industry Snapshot (2006-07)
billion Jewellery market size USD 13.5
billion Diamond Jewellery USD 1.2
Gold Jewellery market growth 15%

Diamond Jewellery market growth 27%
Gujarat: The Gems &Jewellery Hub of India
Gujarat accounts for 72% of the world’s share of processed diamonds and 80% of
total diamonds processed in India. Almost 8 out of 10 diamonds in the world today
are processed in Gujarat.Diamonds processed in Gujarat were estimated to be
worth USD 9000 million (2004-05), constituting 80% of India’s total diamond.
Small Industry Cluster
Region Gems &Jewellery Clusters
Ahmedabad Diamond processing, Gold & Silver
Jewellery
Surat Diamond Processing, Jewellery
Palanpur Diamond Processing
Bhavnagar Diamond Processing
Navasari Diamond Processing
Rajkot Gold & Silver Jewellery

Special Economic Zone– Gems &Jewellery SEZ
(Source: Industries Commissionerate / iNDEXTb, Governmentof Gujarat,
2007,IndianDiamondInstitute)
Khambhat Gemstone (Agate)

CH.4:- PRESENT POSITION AND TRADE OF BUSINESS I.E IMPORT
AND EXPORT WITH INDIA
The relationship of Belgium with India is much better for trading. Antwerp is the
primary supplier of rough diamond to India's massive manufacturing centre. And as we all
know that the city of Antwerp plays in the international diamond trade. As New York City
is to the global financial markets, Antwerp is to the diamond industry with more than 500
years of history as a center for diamond cutting, polishing and trading;
Antwerp today remains the world’s major global diamond hub. It is the key destination
for the secondary, or open, rough-diamond market. Indeed, more than 80 percent of the
world’s rough-diamond volume is traded in Antwerp. Once diamonds are sorted in
Antwerp, they are shipped for cutting and polishing to manufacturing facilities around the
world. Many of them come back to Antwerp to be sold to jewelry manufacturers.
More than 50 percent of the world’s polished diamonds are traded in Antwerp through
three of the four diamond exchanges. In addition to gem-quality diamonds, Antwerp is
also the center of a vibrant trade in industrial diamonds. About 40 percent of the world’s
natural industrial diamonds pass through the city within an area known as the Square
Mile are four diamond bourses, five diamond banks and more than 1,850 companies that
conduct diamond business and provide services to the industry, including rough-diamond

producers, rough-diamond dealers, manufacturers, polished-diamond dealers, insurance
brokers, security firms and shipping and logistics companies.
Even the major players that are not based in Antwerp generally have representatives
there Given the globalization of the economy and transformation of the diamond trade,
Antwerp must constantly reinvent itself by offering new services and support
infrastructure to ensure it stays at the heart of the business.
Import in India
In all over the world out of the total annual $14 billion rough diamond market, India
imports (for re-export) about $8 billion roughs every year, translating into about 130
million carats a year. It is about 70 percent supply of all diamonds worldwide.
As per GJEPC's calculation, India's rough diamond imports in 2009-10 (April-March)
stood at $9.03 billion, up from $7.91 billion a year ago. India's 2009 net diamond account
improved by 94 percent to negative $83.6 million. India's diamond imports increased to
25 percent in 2009 from 20 percent in 2008 mainly because of cost-competitiveness in
small and middle range jewellery.
India's diamond processing industry generates annual revenue of around Rs 60,000-
70,000 crore, 80 percent of which comes from Surat-based units. Besides the UAE, the
US and Europe, exporters are exploring new markets like China, Russia, Korea, Brazil
and Malaysia.
Growth opportunity in Gujarat.
In Gujarat even the growth of the diamond sector in growth form. In Gujarat there are
many cities in which rough diamond had polished and exported. Surat is the heart of
diamond industry.70 percent of the rough diamond had import, polished and exported all
over the world. Surat diamond industry is looking up following increased demand from
China and other nations. However Belgium’s polished diamond exports fell 22 per cent to
$739.4 million in November 2009, the Antwerp World Diamond Centre (AWDC) said. By
volume, polished exports declined 8 per cent to 583,332.61 carats as their average price
fell 15 per cent from a year ago to $1,267.50 per carat. The country’s rough imports grew
43 per cent to $731.7 million in November, while its rough exports rose 64 per cent to
$838.6 million. Net rough imports, the extent to which rough imports exceeded exports,
fell to a deficit of $107 million, compared with net imports of $72,000 a year ago.

Exports
During the Fiscal Year 2010-11, the total exports for gems and jewellery stood at US$
43139.24 million as compared to US$ 29368.72 million during the fiscal year 2009-10.
During the same period, the sector registered a growth of 46.89 per cent over the
previous year.
Composition of Exports
Cut and polished diamonds: The export of cut and polished diamonds grew
manifold in 2010-11 as compared to 2009-10. In 2010-11, the export of cut and
polished diamonds was US$ 28251.92 million as compared US$ 18237.56 million,
recording a growth of 54.91 per cent.
Coloured Gemstones: Export of coloured gemstones was registered at US$
314.54 million in 2010-11 as compared to US$ 286.78 million in 2009-10, showing
a growth of 9.68 per cent.
Gold Jewellery: Export of Gold jewellery also grew in 2010-11, registering US$
12885.59 million as compared to US$ 9669.10 million in 2009-10. A growth of
33.27 per cent was recorded.
Summary of provisional figures of Export of gems & jewellery items during April-May
2012
Items April-May2012
April-May 2012 (Same ports as current year)
% Growth/decline over previous Year
US$ in
Million
US$ in Million US$
Cut & Pol Diamonds 2595.88 4292.02 -39.52
Gold Jewellery-D.T.A 334.33 316.89 5.50
SEZ/EPZ (included Gold Jewellery & Gold Medallions and coins)
2556.32 1957.23 30.61
Total 2890.65 2274.12 27.11

Coloured Gemstones 42.94 43.59 -1.49
Silver Jewellery 78.7 89.85 -12.41
Others * 12.27 4.60 166.74
Net Exports 5620.44 6704.18 -16.17
Exports of Rough Diamonds
232.28 250.42 -7.24
Others 7.23 16.91 -
Total Exports 5859.95 6971.51 -15.94
(Source: The Gem & Jewellery Export Promotion Council (GJEPC))
CH.5 POLICIES AND NORMS OF BELGIUM COUNTRY FOR DIAMONDS,
GEMS AND JEWELLERY INDUSTRY
Import-export duty is livid if the goods are exported into Belgium by countries except
EU nations.
Diamond office:
Diamond office was established with the view to regulate and fulfilling necessary
formalities of imports and exports of the diamond and gems. This includes three
departments import department, export department, and expertise department.
Licensing:
License is required if the exports are from non-EU countries. Diamond Office also
holds "general" licenses covering most exports. It can even happen that Belgium country
itself has to apply for import licence.
Kimberley certificate:
KP certificate is must for import and export of rough diamonds and gems. Trade can
be between KP participants only. In EU 3 Authorities deals in the verification, they are
Antwerp, London and Idar-overseen. In Belgium the FPS Economy affirms the import and
issues the KP Certificates for export at Diamond Office. For export of rough diamonds,
diamond trader has to provide “conclusive evidence” to prove that the rough diamonds he

possesses is lawfully abiding.
Belgium Export Import Policy of Diamonds, Gems and Jewellery
The EU is considered as a single entity without internal trade barriers. EU member
states may also impose restrictions of trade with third country as per their international
laws.
1. Between Belgium and Countries Outside European Union
Below you find an overview of the restrictions and formalities under Belgian and EU
law depending on the country of origin or provenance and the country of destination.
The formalities and requirements set out below apply regardless of whether the traded
diamonds are to be incorporated in jewellery or used for industrial purposes.
1.2 Obligations under Belgian law 2.1 Registration
Diamond traders are trading diamonds in Belgium with the following HS Codes which
is needed to register at Licence Service of the Federal Public Service Economy. HS
Codes: Is the harmonized commodity description and coding system of internationally
standardized system of name and number for trade product.
2.2 Import and export formalities.
Prior to export of import of diamonds the dealers need to clarify the weight, the value,
and classification and documentation origin of the diamonds to the diamond office where
physical checking will be done.
2.3 Annual Declaration of stocks and activities.
Traders need to file with the FPS economy the annual stock, trading done, the value
and imports and exports done throughout the year.
2.4 Obligations under EU law: restrictive measures.
Restrictive measures may comprise arms embargoes other specific or general trade
restrictions financial restrictions (freezing of funds or economic resources and economic
resources available), restrictions of admission (visa or travel bans), or other measures.
Restrictive measures may target governments of third countries and non-state entities
such as companies and individuals.

Policies & Norms import and/or export diamonds (gems) in Belgium:
1 Upon registration as a self-employed person:
1. A copy of the identity card;
2. Proof of the company registration number given by the Crossroads Bank for
Companies;
3. The profession card, given by the FPS Economy, if the self-employed person is a
foreign national.
2 Upon the registration of a company:
1. A copy of the identity card of all business managers;
2. Proof of the company registration number issued by the Crossroads Bank for
Companies; registration will not be allowed if the company has not been registered
with the Crossroads Bank beforehand;
3. A copy of the notarial instrument of establishment and/or extract from the Belgian
Official Gazette;
4. the FPS economy issues the profession card if the business manager is a foreign
citizen
5. If the company exercises the business manager, member of the management
committee at another company or mandate of director, the permanent
representative must present a copy of his identity card and appointment;
6. If none of the business managers of the Belgian company is in possession of a
permanent place of living in Belgium, they accord powers to an authorized person
residing in Belgium and representing the business manager. The business
manager must present a copy of his identity card and appointment, duly signed by
both parties.
Customs Duties and VAT
Export: In Belgium the export of diamonds (Gems) is exempt from taxes: no duties or
VAT have to be paid.
Import: From January 1st 1999, all categories of diamonds (Gems) in Belgium are
exempt from import duties. The importer must pay 21% V.A.T., calculated on the amount
showed on the invoice (freight and insurance included) converted into EURO’s. Belgium
has a system of VAT exemption for local markets and imports if the dealer abide with

Article 42, & 4 of the VAT legislation. He or she has to sign a declaration stating his
intention of availing VAT exemption. The importers do not have to pay the VAT amount at
the precise time of import. The Diamond office will credit the amount to customs and will
send an invoice to the diamond dealer at the end of the month concerning the imports of
European Union -goods, Diamond Office does not intervene: the importer himself will
inform the Value added tax.-administration by means of his book keeping.
CH.6:- POLICY AND NORMS OF INDIA FOR IMPORT/EXPORT FOR THE GEMS AND JEWELLERY
Policies for the Import of Gold / Platinum / Silver by Nominated Banks / Agencies
A. Import on consignment basis
Gold, platinum, silver may be imported by the nominated agencies/banks on
consignment basis where the ownership will remain with the supplier and the
importer (consignee) will be acting as an agent of the supplier (consignor).
B. Import on unfixed price basis
The nominated agency/bank may import gold, platinum, silver on outright
purchase basis subject to the condition that although ownership shall be passed
on to the importer at the time of imports itself, the price of gold shall be fixed later,
as and when the importer sells the gold to the users.
A. Direct Import of Gold

AD Category bank can open Letters of Credit and allow remittances on behalf of
EOUs, units in SEZs in the Gem & Jewellery sector and the nominated agencies /
banks, for direct import of gold, subject to the following-
1. The import of gold should be strictly in accordance with the Foreign Trade
Policy.
2. Suppliers and Buyers Credit, including the usance period of LCs opened for
direct import of gold, should not exceed 90 days.
3. Banker's prudence should be strictly exercised for all transactions pertaining to
import of gold. Any large or abnormal increase in the volume of business of the
importer should be closely examined to ensure that the transactions are bonafide
trade transactions.
4. The financial standing, line of business and the net worth of the importer
customer should be commensurate with the volume of business turnover.Apart
from the above, in case of such transactions banks should also make discreet
enquiries from other banks to assess the actual position. Further, in order to
establish audit trail of import/export transactions, all documents pertaining to such
transactions must be preserved for at least five years.
5. AD Category bank should follow up submission of the Bill of Entry by the
importers as stipulated.
A Statement on half yearly basis (end March / end September) showing the quantity and
value of gold imported by the nominated banks/ agencies in Gem & Jewellery sector.
Both the statements shall be submitted, even if there is 'Nil' position and they should
reach the aforesaid office of RBI by the 10th of the following month / half year to which it
relates.
EXPORTS POLICIES
(A) General policies- The Reserve Bank of India, as per their authorized dealer
(banks) circular No. 1 dated 12.02.1994 had liberalised the procedures for the
exports of Gem and Jewellery. Hence, even in the absence of letters of credit or
advance remittances, prior permission from the Reserve Bank of India for exports,
is not required

The exports are done in the following two ways.
1) Bank through shipments:
In this case the documents are addressed to the consignee's bankers for the account
of the importer. The consignee gets the delivery of the goods only against payment, if the
documents are sent on COD basis or against acceptance of shipping documents by
signing the original Bill of Exchange if they are shipped on Usance basis, as per the
terms of the contract
2) Direct shipments:
In this case, the documents are addressed in the name of the consignees, who have an
excellent track record regarding payments, long standing business relations etc., with the
exporters. The advantages of shipping the goods directly to the consignees are:
Speedy delivery of the export parcels to the clients, since the importers need not wait
for the full set of bank documents to be received through their bankers.
(B) Export of Rough Diamonds.
The export of rough diamonds is permissible of the imports made against the relevant Bill
of Entry for the replenishment benefit which is affected on or after 13-4-1998.The
exporter shall furnish Bill of Entry in his own name, for the import of rough diamonds. This
means that if the rough diamonds exported are bought in the local market or if they are
taken against a transfer licence,
(C) Export of Cut and Polished Diamonds
For the export of cut and polished diamonds, the following documents are required.A set
of 21 (twenty one) copies of export invoice, for the following reasons.

(A). In the case of exports through airfreight, 5 (five) copies of invoices for the customs,
out of which two will be attested by them after due verification of the goods. Three will be
attached with the shipping bills. In the case of exports by air mail post parcel 4 (four)
copies of invoice have to be prepared for the customs. 3 (three) will be attested and given
back by the customs, situated in the Foreign post office and one will be kept by them, for
their records.
(B). 1 (one) copy of the invoice as packing slip for keeping in the export parcel. This will
enable the customs in the client's country to verify the contents with the invoice
immediately.
(C). 1 (one) copy of the invoice is to be enclosed with the airway bill.This will enable
speedy delivery of the parcel,. Otherwise, the importer has to wait for the full set of
documents to be received by his bankers, which may take a longer period. This is more
helpful, in the cases of direct shipments.
(D) 5 (five) copies of invoices to be given to the consolidators/couriers of the parcels.One
will be kept with them for their record, Two copies of the invoice to the importers. He will
submit one copy to the customs at the destination and the last copy will be retained by
him for record purpose.
(E) 1 (one) copy of the invoice for the exporter's file.
(F). 2 (two) copies of the invoice for mailing to the clients, with a covering letter,
mentioning the details of the exports, including the terms and mode of payment to be
effected by them.
(d) Export of Cut and Polished Diamonds For Certification
With a view to facilitate certification/grading by international laboratories/agencies of cut
and polished diamonds weighing 0.50 carats and above, the exporters have been
permitted as per Para 8.13 (b) of the Exim Policy to export and return of such diamonds
for certification purposes.
Licencing policies
(A) Import Licenses

Except for goods included in the negative list which require licence under the Foreign
Trade Policy in force, AD Category - I banks may freely open letters of credit and allow
remittances for import
(B) Diamond Imprest licences for the Import of Rough Diamonds.
The Diamond Imprest licences are advance licences issued to facilitate the regular
diamond exporters to import sufficient rough diamonds so that their production cycle does
not get hampered.
(c) Bulk Licence for Rough Diamonds
These are licences issued for the import of rough diamonds for certain categories of
importers from any sources. The supply/export of rough diamonds shall be completed
within 12 (Twelve) months from the date of issue of the licence or within a period of three
months from the date of import, whichever is later.
The bulk licence will be issued based on the following criteria-
o For an exporter, the value of the bulk licence shall not exceed 50% of the
annual average value of export of cut and polished diamonds made by the
applicant during the preceding three licensing years.
o For any overseas company with its branch in India, the entitlement shall not
exceed 50% of annual average turnover of the preceding three licensing
years.
o The validity of the bulk licence is for a period of 12 months from the month
of issue.
(d) Further licence
The bulk licence holder can apply for subsequent licence even before the expiry of the
previous bulk licence provided he submits the proof to the licensing authority of it.

CH.7:- PRESENT TRADE BARRIES FOR IMPORT/EXPORT OF GEMS & JEWELLERY INDUSTRY
Foreign Trade Policy
In India, the main legislation concerning foreign trade is the Foreign Trade (Development
and Regulation) Act, 1992. The Act provides for the development and regulation of
foreign trade by facilitating imports into, and augmenting exports from, India and for
matters connected therewith or incidental thereto. As per the provisions of the Act, the
Government :-
(i) may make provisions for facilitating and controlling foreign trade;
(ii) may prohibit, restrict and regulate exports and imports, in all or specified cases as well
as subject them to exemptions;
(iii) is authorised to formulate and announce an export and import policy and also amend
the same from time to time, by notification in the Official Gazette;
(iv) is also authorised to appoint a 'Director General of Foreign Trade' for the purpose of
the Act, including formulation and implementation of the export-import policy.

The key strategies for achieving its objectives include:-
Unshackling of controls and creating an atmosphere of trust and transparency;
Simplifying procedures and bringing down transaction costs;
Neutralizing incidence of all levies on inputs used in export products;
Facilitating development of India as a global hub for manufacturing, trading and
services;
Avoiding inverted duty structure and ensuring that domestic sectors are not
disadvantaged in trade agreements;
Upgrading the infrastructure network related to the entire foreign trade chain to
international standards;
Revitalizing the Board of Trade by redefining its role and inducting into it experts
on trade policy; and
Activating Indian Embassies as key players in the export strategy.
The FTP has identified certain thrust sectors having prospects for export expansion and
potential for employment generation. These thrust sectors include: (i) Agriculture; (ii)
Handlooms & Handicrafts; (iii) Gems &Jewellery; and (iv) Leather & Footwear.
Accordingly, specific policy initiative for these sectors has been announced.
For the gems and jewellery sector:-
Permission for duty free import of consumables for metals other than gold
and platinum up to 2 per cent of Free On Board (f.o.b) value of exports;
Duty free re-import entitlement for rejected jewellery allowed up to 2 per
cent of f.o.b value of exports;
Increase in duty free import of commercial samples of jewellery to Rs. 1
lakh; and Permission to import of gold of 18 carat and above under the
replenishment scheme.
Gem and Jewellery Export Promotion Council (GJEPC)

The Gem and Jewellery Export Promotion Council is a representative body of trade. The
following initiatives have been taken by the council in order to enhance competitiveness
such as:
Preparation of a medium term exports strategy for various sectors including gems
and jewellery by the Ministry of Commerce.
Exploring the possibility of direct procurement of rough diamonds from mining
countries.
Promotion of Indian diamonds and jewellery abroad through advertisements,
publicity and participation in international fairs, buyer-seller meets and direct
approach to market retailers.
Market study through experts in the field to identify new markets.
Promotion of export of 'hallmark' jewellery from India to assure foreign customers of
quality and purity of jewellery made in India.
CH.8:- POTENTIAL FOR IMPORT-EXPORT IN INDIA/GUJARAT
MARKET
Traditionally the focus of the gems and jewellery manufacturers has been on the large
global markets. Indeed for years, these international markets have given large and
growing business to Indian exporters and have contributed in creation of significant jobs
in the country. The Indian players, duly supported by the Government of India are placed
highly competitively in the market.
During the last few years, the Indian domestic market has shown very promising signs,
evident from the stupendous growth and increase in penetration of the brands and
organized retail across the categories namely FMCG, Durables, Apparels, and Home
Improvement etc.
MARKET STRUCTURE AND POTENTIAL

Gems &Jewellery exports are the back-bone of the sector and also of our overall exports.
The current slowdown had hit the sector badly and in 2008 some months showed
negative growth.
However the sector is expected to grow at a CAGR of 15% to reach a size of US $ 58
billion by 2015 from the current US $ 25 billion. The government has taken significant
steps for the Gems &Jewellery exports in terms of duties and taxes, infrastructure (SEZ,
EPZ’s etc) and policy (EXIM Policy for 2002-07) but this is not the time to get complacent
for the government or the industry as the recent global economic crisis has shown. We
need to keep working at making the sector more resilient and competitive especially in
the wake of rising competition from countries such as China.

The domestic market of gems and jewellery is estimated to be in the US $ 18-20 billion
range and is expected to grow by about 13% per annum to reach US $ 35-40 billion by
2015. Given the fragmented nature of the business it is very difficult to estimate the exact
range. With per capita consumption almost 1/10th that of any matured market India
presents a very large potential market. If some of the recommendations suggested by us
in this report are acted upon appropriately, the industry market size could potentially
reach to US$27- 35 billion. More importantly there is a significant opportunity to create
additional value through higher margins possible through differentiation and branding.
Currently however the market is fragmented across the value chain. There are more than
300,000 Gems &Jewellery players are there in the country.Modern retail players have
only 4%-6% share, which is perhaps one of the lowest when compared to Apparel (20%),
Footwear (35%), Books and Music (11%) and CDIT (7%). The industry has also lagged
behind relatively to attract the capital; professionals and process/technology know-how to
scale up the operations and take the industry into a different orbit. The good part is that
India is now beginning to move towards branded jewellery and the consumers have
accepted the modern retail formats.
CH.9:- BUSINESS OPPORTUNITY IN FUTURE
Indian hand-made jewellery has a large ethnic demand in various countries with
sizeable Indian immigrant population such as the Middle East, South-East Asian
countries, USA, Canada, Belgium and so on.
In jewellery, exports are only 1-2% of the total world market; hence there is good scope
for jewellery exports. Evidently, the exports have increased to US $ 1,087 million in 1999
- 2000, registering a growth of 24% over the previous year. For ensuring the growth,
Indian industry will have to gear up for developing quality that suits the western states in
design, polish and finish of the jewellery.
India opportunities

The future growth of Indian jewelry industry lies in finding new markets and in adding
value. Worldwide, jewelry is a big business, which is extremely lucrative as margins are
high compared to diamonds, as branding can demand high premiums.
India was a late entrant to the global jewelry market and its industry took off after
establishment of the export processing zones in 1990, especially the special economic
zone in Mumbai that accounts for 40 % of India's exports
Opportunities for Gujarat therefore, include:
Manufacturing and marketing gold jewellery and diamond studded Jewellery Manufacturing and marketing of branded jewellery through franchisee outlets Setting up a training institute for Jewellery manufacturing.
Gujarat Economic Snapshot
Gross Sate Domestic Product USD 45.3 Billion
Industrial Growth Rate 12.9% (2008 – 2012)
Exports 19.2 % of India
Inflation 10.3% apox
Per Capita Income USD 722
Urbanization 37.36%
Gujarat has exhibited a 12.9% high industrial growth rate from 2008 to 2012. In India’s
11th Five Year Plan and has achieved a GDP growth of 10.2% as per the set target,
which was the highest amongst all States in India.
Gujarat in diamonds industry
Investment in Gujarat; a world class Business destination

Gujarat accounts for almost 80 % of the diamonds processed in India. Of this, 90 % are
processed by about 10,000 diamond units located in and around Surat alone. Rest of the
diamond units are located in Ahmedabad, Palanpur, Bhavnagar, Valsad and Navsari.
The advantages of investing in diamond processing in Gujarat are:
1. Low cost, economic and skilled labor 2. Availability of large number of skilled labor 3. Easy availability of institutional and Bank finance 4. Relaxed government rules and regulations
5. Other competitive world centers like Hongkong, Thailand, Taiwan, Korea, U.S.A.,
Italy, etc. are becoming costlier with decreasing availability of skilled labor.
CH.10:- CONCLUSION, SUGGESTION
In the gems and Jewellery industry in India and Belgium, what I have observed is in the
form of certain initiatives by the entrepreneurs in various domains of operations to
strengthen their competitiveness in domestic as well as the global market. India is largest
consumer of gold – jewellery and 2nd largest producer of gold – jewellery in the world.
India’s gems and jewellery export are expected to growth at 15-20 % in coming year. Import
and exports regulations are friendly for registered diamond dealers and foreign countries.
KP certificate is considered must if you want to have trade in rough diamonds and gems
with Belgium (and all EU countries).

Previously, trade policy was based on the objectives of self-reliance and self-sufficiency.
Now a day it’s driven by factors like export led growth, improving efficiency and
competitiveness of the Indian industries. Duty free import of consumables for metals other
than gold and platinum up to 2% of Free On Board (F.O.B) value of exports and re-import
entitlement for rejected jewellery as well. There is increase in duty free import of commercial
samples of jewellery to Rs. 1 lakh. 18 carat and above import gold is permitted. Personal
carriage of gold up to 10 kg is allowed.
The importance and attraction of the Industry can be judged by the fact that over 1
million people are employed in the industry and it is still growing at the rate of approximately
15 % every year. The biggest advantage that Indian Jewellery has is its low cost. Exports
are only 1-2% of the total world market; hence there is good scope for jewellery exports. Gujarat accounts for almost 80 % of the diamonds processed in India.

ANALYSIS OF PHARMACEUTICAL
INDUSTRY

CH.1:- OVERVIEW, BUSINESS ACTIVITIES AND STRUCTURE OF THE PHARMACEUTICAL SECTOR
The Pharmaceutical Value Chain is separated into two specific phases: Research &
Development and
Supply Chain, with each phase consisting of four sub-activities:
According to Deutsche Bank, the globalmarket for pharmaceutical products is ~$800mm.
The industry has recorded 10% of annual sales growth in the last 30 years, and
underlying volume growth has remained strong . Mix of pharma business activities: scale & scope Large Scale
Pfizer Manufacturing N.V.:
1. 2nd largest production site of Pfizer worldwide (Pfizer’sbiggest site in Europe)

2. 200 million units of sterile therapeutics, are produced and packaged ever year
3. Over 1,400 workforce in Puurs, Flanders
4. Production distributed to 170 countries worldwide
Start-Up
Movetis:
1. Movetis was founded in November 2006 as a spin-off from Johnson & Johnson
2. Movetis NV focuses on the finding, improvement, and commercialization of drugs
for the treatment of diseases in the gastrointestinal (GI) area
3. Went public in 2009 with an IPO of €98mm on revenues of €1.2mm
4. Moventis has 35 employees and its headquarter in Turnhout, Belgium
Production
Federa S.A
1. Independent contract manufacturer that covers pre-formulation to commercial
manufacturing
2. Specialized in manufacturing, filling and packaging of injectables in syringes,
ampoules
Operates as a subsidiary of Catalent Pharma Solutions which is headquartered in
Somerset, NJ.
1)Pfizer Leadership and Structure
Pfizer's Executive Leadership Team is the company's senior-most leadership and
decision-making management body. It brings jointly our top leaders to spotlight on major
financial, strategic and equipped decisions for the company.
Universal Research and Development at Pfizer combines research and technology units
that have deep disease area expertise and cutting-edge science and platforms with an
efficient R&D operating model, to discover and develop innovative therapeutic programs
in small molecules and biotherapeutics, including vaccines.
We manage our operations through five operating segments - Primary Care; Specialty
Care and Oncology; Established Products and Emerging Markets; Animal Health; and
customer Healthcare. Each of these segments is led by an executive with clear
accountability for results - from product development following proof of concept to
providing access to patients and through to the end of the product's life cycle. These

segments are provided with the assets to pursue attractive growth opportunities and to
deliver benefits to all who rely on us around the world
Biopharmaceutical R&D Organization
. We continue to build the world's premier biopharmaceutical R&D organization.
Our aspirations are to carry unmatched innovation, the best inside and outside
science, and business leading productivity within a lively, diverse culture.
Pfizer now has broader and deeper syndrome area knowledge in our Research
Units, increased modality and technology capabilities in our Biotechnology Units,
and an approach that harnesses our strengths to find the newest, most innovative
and valuable medical solutions.
Company Background
Jubilant Organosys Ltd., headquartered at Noida, near New Delhi in India, was set
up as Vam Organic Chemicals Ltd. in 1978. Jubilant Organosys is a part of the
group, Jubilant Corporation, which operates in four business areas – life science
products and specialty chemicals, oil and gas (exploration and production), food,
and services. As the company made its transition from a bulk and specialty
chemicals company to an integrated pharmaceutical company, it changed its
corporate identity by renaming itself as Jubilant Organosys in 2001, to reflect the
company’s changed business profile.
Jubilant Organosys is one of India’s largest Custom Research and Manufacturing
Services (CRAMS) companies.The company is a drug discovery and development
services provider along with being a leading active pharmaceutical ingredients
(API) company in India. It operates in three business lines – pharmaceuticals and
life science products, Industrial products, and recital polymers.

The company’s product offerings include APIs, such as ‘carbamazepine’,
‘oxcarbazepine’ and ‘citalopram’, ‘pyridine’ and its derivatives, a range of fine
chemicals, dosage forms, solid polyvinyl acetate, vinyl pyridine latex, binders and
organic intermediates such as ethyl acetate and acetic anhydride which are mainly
marketed in the US and European markets.
Jubilant Organosys has its manufacturing locations in India and the USA.The
company sells its products in both regulated and unregulated manufacturing
facility approved by the US FDA for dosage for ms in Maryland, USA and APIs in
Nanjangud near Mysore The company operates in India through its three
subsidiaries – Jubilant Biosys Ltd. (for bio/chemo informatics databases and drug
discovery services), Jubilant Chemsys Ltd.(for medicinal chemistry services) and
Clinsys India Ltd. (for clinical research).The company also has its subsidiaries in
the USA (Jubilant Pharmaceuticals, Inc., Clinsys, Inc.), Belgium (PSI, PSI N.V.)
and China.

CH.3:- COMPARATIVE POSITION OF PHARMA INDUSTRY OF BELGIUM WITH INDIA
Pharmaceutical industry today in India:
The number of just Indian pharma companies is quite low. Indian pharma industry is
mostly function as well as controlled by leading foreign companies having subsidiary in
India due to ease of use of cheap labour in India at lowest cost. In 2002, over 20,000
registered drug manufacturer in India sold $9 billion worth of formulations and bulk drugs.
85% of these formulations were sold in India while over 60% of the bulk drugs were
exported, mostly to the United States and Russia. Most of the players in the market are
small-to-medium enterprises; 250 of the major companies control 70% of the Indian
market.
Most pharma companies working in India, even the multinational, employ
Indians approximately wholly from the lowest ranks to high level management. Mirror the
social structure, firms are very hierarchical. Home-based pharmaceuticals, like many
other businesses in India, are often a mix of public and private enterprise. Although many
of these companies are publicly own, leadership passes from father to son and the
founding family holds a most excellent part share.
Indian Players dominate the domestic market Indian companies dominate the domestic market, while MNCs have significant
presence, with GSK leading the domestic sales tally. 8 out of the top 10 pharma
companies are domestic players. Presently, multinational pharma companies have a
share of around 20-22 per cent in the domestic pharma market. GSK was the market
leader in 2006 with a share of around 6.45 per cent of the total retail sales, followed by
Ranbaxy which is India’s number one pharmaceutical company. Pfizer one of the pharma
based company which exist in both India & Belgium.

Chart showing Current distribution chain in INDIA:
Problems afflicting Pharmaceutical Industry : The pleasure of imitation drugs toward the inside the market is larger than ever before
and so is the hazard of pilferage.
· Clinical effectiveness of medical reps is a challenge and so are qualified professionals.
· Domestic market – price controls on several drugs, drug prices in India are already
amongst the lowest in the world.

· Continuous rise in R&D expenditure puts pressure on the industry to increase
productivity.
• Dominating generic drugs: Indian companies are more focused on generics whereas
branded drugs market is yet to be fully captured
· Strong pricing competition among local manufacturers has led to low margins .
CH.4:- PRESENT POSITION AND TREND OF BUSINESS (IMPORT /
EXPORT) WITH INDIA / GUJARAT DURING LAST 3 TO 5 YEARS.
The analysis of the supply of pharmaceuticals revealed that although the industry is
characterised by considerable entry barriers, it is only moderately concentrated. The
supply of pharmaceuticals has features of monopolistic competition, where every supplier
holds monopoly power within a niche market. As such, the mode of competition focuses
strongly on R&D activities because the invention of a new medicine allows a company to
enter new markets or prevents entry in markets that it is itself already active in.
R&D is costly but if successful, it pays off. The market for pharmaceutical products
is worldwide and the majority (western) countries use a large split of their profits on
health (around 6 to 10%). The national budgets that are spent on pharmaceuticals range
from around 1% to 2% of GDP. On average, European countries spend around 1.5% of
their income on pharmaceuticals. Given these basic characteristics of demand and
supply, how does the EU pharmaceutical industry perform? From a point of view of
competitiveness, this question should be address from dissimilar perspective.
The sector is even more important in terms of R&D and innovation and thus, in terms of
its potential contribution to meeting the ambitions of the Lisbon Agenda. The sector
accounts for a large share of total high-tech R&D expenditure (33% in 2003)125 and is
also among the best rising sectors in terms of real business R&D expenditure. Data for
the 1995-2008 period show that R&D intensity (as measures by the share of R&D in
value added) has increased considerably during this period. Whilst the US is still the most
important market in terms of the total value of pharmaceutical sales, the value of EU
pharmaceutical production surpasses that of the US. This is reflected in the EU’s strong
position in international trade of pharmaceuticals. EU exports are the largest of the world,
and the EU accounts for a major share of imports in many countries. EU as whole has a
large and growing trade surplus in pharmaceuticals reaching some €32 billion in 2007.

This is especially due to exports from Germany, UK, France, Ireland and Belgium.
Although the overall performance of the EU pharmaceutical sector appears to be good
some indicators point to potential weakness. For example, the US has a better
performance with respect to pharmaceutical innovation, and also seems to have a higher
productivity rate. In terms of profitability, EU companies are at a similar level vis-à-vis US
companies.
Top 10 Sectors Attracting Highest FDI Equity Inflows for the year 2012-13 (April-
December)
Ranks Country %age to total
Inflows (in terms of US$)
1 Services Sector (Financial & Non-Financial) 19%
2 Construction Development: Townships,
Housing, Built-Up Infrastructure #
12%
3 Telecommunications (Radio Paging, Cellular
Mobile, Basic Telephone Services)
7%
4 Computer Software & Hardware 6%
5 Drugs & Pharmaceuticals 5%
6 Chemicals (other than fertilizers) 5%
7 Power 4%
8 Automobile ndustry 4%
9 Metallurgical Industries 4%
10 Hotel & Tourism 3%

CH.5 & 6:- NORMS AND POLICIES OF BELGIUM AND INDIA FOR
IMPORT AND EXPORT
Exim policy of india
In exercise of the powers conferred under Section 5 of The Foreign Trade (Development
and guideline Act), 1992, the essential administration hereby notifies the Export and
Import Policy for the duration of 2002-2007. This Policy shall come into force with result
from 1st April, 2002 and shall continue in force upto 31st March, 2007 and will be co-
terminus with the Tenth Five Year Plan (2002-2007). However, the Central Government
reserves the right in public interest to make any amendments to this Policy in exercise of
the powers conferred by Section-5 of the Act. Such adjustment shall be made by means
of a Notification published in the Gazette of India.
Transitional Arrangements
Any Notifications made or Public Notices issued or anything done under the previous
Export/ Import policies, and in force instantly before the beginning of this Policy shall, in
so far as they are not incompatible with the provisions of this Policy, carry on to be in
force and shall be deem to have been made, issued or done under this Policy. License/
certificate/permissions issued before the commencement of this Policy shall continue to
be valid for the purpose for which such license/ certificate/ permission was issued unless
otherwise stipulated.
Restriction and Regulation
In case an export or import that is permitted freely under this Policy is subsequently
subjected to any restriction or guideline, such export or import will generally be permitted

notwithstanding such restriction or guideline, unless otherwise predetermined, provided
that the shipment of the export or import is made within the original validity of the
irrevocable letter of credit established before the date of imposition of such restriction
Objectives objectives of this Policy are:
To facilitate steady growth in exports to attain a share of atleast 1% of global
merchandise trade.
To promote constant economic development by providing access to necessary
raw materials, intermediates, components, consumables and capital goods
needed for augmenting production and providing services.
To recover the technological potency and effectiveness of Indian agriculture,
industry and services, thereby improving their aggressive strength while
generating new employment opportunities, and to encourage the attainment of
internationally accepted standards of quality.
To provide consumers with better power goods and services at internationally
competitive prices while at the same time creating a level playing field for the
domestic producers.
Effort taken by Goverment
The objectives will be met through the equivalent efforts of the State Governments and all
the departments of the Government of India in general and the Ministry
Effort taken by Goverment
of Commerce and Industry and the Directorate General of Foreign Trade and its network
of Regional Offices in particular, with a shared vision and commitment and in the best
spirit of facilitation, in the interest of promotion of trade in goods and services.
General Provisions
Exports and Imports free unless regulated

Exports and Imports shall be free, except in cases where they are in time by the
provisions of this Policy or any other law for the time being in force. The item wise export
and import policy shall be, as specified in ITC available and notify by Director General of
Foreign Trade, as amended from time to time.
Compliance with Laws
Every exporter or importer shall comply with the provisions of the Foreign Trade
(Development and Regulation) Act, 1992, the Rules and Orders made there under, the
provisions of this Policy and the terms and conditions of any licence/certificate/permission
approved to him, as well as provisions of any other law for the time being in force. All
imported goods shall also be subject to domestic Laws, Rules, Orders, Regulations,
technical specifications, environmental and safety norms as applicable to domestically
produced goods. No import or export of rough diamonds shall be permitted unless the
shipment parcel is accompanied by Kimberley Process (KP) Certificate required under
the procedure specified by the Gem & Jewellery Export Promotion Council (GJEPC).
Interpretation of Policy
If any question or doubt arises in respect of the interpretation of any provision contained
in this Policy, or regarding the classification of any item in the ITC or Schedule Of DEPB
Rate the said question or doubt shall be referred to the Director General of Foreign Trade
whose decision thereon shall be final and binding. If any question or doubt arises whether
a license/ certificate/permission has been issued in accordance with this Policy or if any
question or doubt arises touching upon the scope and content of such documents, the
same shall be referred to the Director General of Foreign Trade whose decision thereon
shall be final and binding.
Indian Pharmaceutical Industry: Policies & Orders
When we talk about pharmaceutical policy, it implies a branch of health policy that covers
various aspects of the pharmaceutical industry like as the development of new
medicines, provision and use of medications within a health care system, considering
both brand name and generic drugs. Phramaceutical policies also cover products derived

from living sources referred as , biologics which are different from chemical compositions,
vaccines and natural health products. Let us discuss the main pharmaceutical policies of
India under the following heads:
Drugs Price Control Order (DPCO): Drugs and formulations have been subjected to
price control from a very long time, almost 3 decades now. The economic reforms
presented by the Government of India in July 1991, targeted the Pharmaceutical Industry
only in 1994 and that too partially. Price control in a large number of industries has
already been abolished.
Intellectual Property Rights (IPR): The Agreement on Trade-Related Aspects of
Intellectual Property Rights (TRIPS) provides for minimum norms and standards in
certain categories of intellectual property rights which are discussed in this section.
Pharmaceutical Policy 2002: The essential objectives of Government's Policy relating
to the drugs and pharmaceutical sector were enumerated in the Drug Policy of 1986.
Norms and policies of Belgium in pharmaceutical sector
Taxation
The rate of VAT on pharmaceutical products varies. Usually OTC products attract the
standard VAT rate (one exception, is Greece, where the VAT rate both for POMs and
OTCs is 8%), whereas prescription-only medicines (POMs) usually attract a lower VAT
rate (e.g.the Netherlands it is 6%, in France it is 4%; in Finland it is 8%), although
exceptions exist (e.g. Denmark applies 25%; Ireland applies 21%). In Ireland, prescription
drugs administered orally are exempt whilst all other types are taxed. In the UK,
prescription-only medicines are VAT exempt.
Pharmacists are paid or reimbursed the public price of drugs, which includes VAT. The
greatest part of total pharmaceutical expenditure is covered by social health insurance
funds.
Thus, taxes on reimbursed drugs increase their costs. In recognition of this, many
countries levy VAT at a reduced rate on prescription drugs.
Taxes on publicly funded goods and services are a transfer of funds from one public body
to the central treasury. Deficits in the healthcare budget can be reduced by lowering the
VAT rate. Additional taxes unique to the pharmaceutical industry include taxes on
advertising expenditure or those occasionally imposed on pharmaceutical sales of

reimbursable products as part of restrictive cost-containment policies. An example of the
latter policy is Belgium: in August 1997, a tax (3%) was introduced on reimbursed sales
and increased it to 4% for 1999.
The publicity surrounding the introduction of taxes may increase prescribes’ sensitivity to
the importance of drug costs, but is unlikely to sway their choice between drugs.
TAX STRUCTURE IN BELGIUM
PERSONAL INCOME TAX
Belgium personal income tax rates are progressively between 25% - 50%.
Taxable Income (EUR) / Tax Rate %
EUR 0 - 7,900 25%
EUR 7,900 - 11,240 30%
EUR 11,240 - 18,730 40%
EUR 18,730 - 34,330 45%
Above EUR 34,330 50%
Zero-bracket Amount: EUR 6,430 for each taxpayer
Additional tax-free allowance for dependent children:
- 1 child: EUR 1,370
- 2 children: EUR 3,520
- 3 children: EUR 7,880
Municipal taxes must be added to the tax rates above.
An individual resident in Belgium is liable to personal income tax on his worldwide income
and on certain capital gains. Special rules apply to foreign employees temporarily
resident in Belgium. An individual is regarded as resident only if he spends a certain
period of time in Belgium and has his main home or his centre of economic interest in
Belgium. A non-resident individual is liable to tax on his Belgian-sourced income only.

Total taxable income is the aggregate of net income or profits arising from an occupation
or business, real estate, personal property, and miscellaneous sources, reduced by
deductions that may be set against total income.
CAPITAL GAINS AND LOSSES: Capital gains are treated as ordinary business income
taxable at normal corporation tax rates of Belgium. However, there are a few exceptions:
- under certain conditions, rollover relief is granted for gains on fixed assets held for
business purposes for more than five years
- unrealized gains are exempt provided they are credited to a specific non-distributable
reserve
- realized capital gains on shares are exempt from tax if dividends on the shares qualify
for the participation exemption.
Capital losses are tax-deductible if they relate to fixed assets used for business
purposes. Unrealized capital losses on shares (booked devaluations) are not tax-
deductible.
Realized capital losses on shares are generally not deductible. Capital losses realized on
the liquidation of a company are deductible up to the value of the capital actually paid-up.
TAXATION OF DIVIDENDS: Dividends received by a company with a contribution of at
least 10% or an investment of at least EUR 1.2 million in the distributing company, are
95% deductible from the financial profits of the recipient if the shares have been held for
an continuous period of at least one year. For example, all dividends are first included in
taxable income and then 95% of eligible dividends are deducted out again (subject to a
maximum of the net taxable profits of the company for the period). The remaining 5% is
taxable at normal corporation tax rates as part of the overall taxable profits of the
company.
The 95% deduction is not available where the profits of the payer are subject to a tax
regime which is substantially more advantageous than the Belgian tax regime. This will
be deemed to be the case if the effective tax rate suffered by the company making the
distribution is less than 15%. However, this criterion does not apply to companies
established in the European Union.

CH.7:- PRESENT TRADE BARRIERS OF BELGIUM IN PHARMACEUTICAL SECTOR
1.Pharmaceuticals sector in the EU
The following document aims to give an overview of the EU’s pharmaceuticals sector,
both innovative and generic, in relation to external EU trade, the EU industry’s position
within the global pharmaceuticals market, and the trade barriers faced when importing
medicines to third country partners. Key points within the document include:
The pharmaceutical industry’s intrinsic link to public health, and the complex
regulatory burdens arising from this relationship that can potentially have an impact
on trade. A strong EU industry presence, providing over 640,000 jobs directly, 113,000
ofWhich are highly skilled. The high level of research and development spending on new
drugs outlaid by the EU’s innovative pharmaceutical sector (16% of business
expenditure: the highest Percentage of any industrial sector), and the extended length of
time (8-12 years), it can take for a new drug to enter the market. Increasing importance of
biological products.
2. Main trade issues
The EU as a World leader in the trade of pharmaceutical products, enjoying a trade
surplus of €47.8bn in 2010, a steady growth in exports witnessed since 2001 and an
ability to adapt to and enter new and growing markets. It does, however, face strong
competition from traditional producers such as the US and Japan, along with growing
competition from fast developing economies such as China and India.
EU industry continues to encounter some tariff barriers in certain countries, such as India.
However, it is the wide range of non-tariff barriers (NTBs) that are the key focus of the
industry. The different sub-sectors and type of pharmaceutical products face the same
type of NTBs.

Such barriers can arise due to a divergence in international regulatory regimes, which
can be the result of a country’s public health history and culture. Such barriers can also
be used as protectionist measures to help foster local industry.
The key NTBs include:
Regulatory barriers such as the registration and certification of new and generic
drugs,Other barriers related to market authorization such as unnecessary repetition of
clinical trials in third countries and burdensome good manufacturing practice
requirements; A lack of transparency in the amendment and implementation of pricing
and reimbursement regimes in third countries.
Intellectual property rights and the counterfeiting of medicines are also concerns for EU
industry, as a leader in R&D and in new fields within the pharmaceuticals sector.
A lack of patent protection or data protection in certain third country markets could lead to
abuses of EU industry patent right, while the counterfeiting and falsification of medicines
is a clear danger to the health of patients. The potentially flawed practice of patent
linkage is also a specific concern for the EU’s generic industry.
This can sometimes take the form of direct subsidies, however, numerous indirect
policies are also being practiced, such as discrimination in public procurement and
pricing policies and local production incentives.
Pharmaceuticals sector in the EU
Definition sector and sub-sector:
Though there are many different types of pharmaceutical medicines, broadly, as a sector,
pharmaceutical products can be placed in either of two camps: innovative and generic.
Innovative pharmaceuticals are essentially 'new' medicines brought to market, that
remain under patent protection. Once patent and data protection have expired, other
pharmaceutical companies are able to market their own, identical and cheaper versions,
labeled 'generics', of the previously patented, innovative medicine.
A number of the large innovative pharmaceutical companies will produce both

types of products while there are many generic-only companies. Both innovative and
generic pharmaceutical firms share many trade barrier problems in terms of non-tariff
barriers (NTBs) and general market access issues, while tending to hold divergent
positions on some issues i.e. length and nature of Intellectual Property Right (IPR)
protection.
An important distinction can be made between 'chemical' and 'biological' products.
This latter is a pharmaceutical product that contains biological material such as proteins,
DNA or bacteria, as opposed to a 'none—biological' chemical compound. Both industry
and Member State responses have highlighted the increasing importance of this type of
product that can be subdivided into biopharmaceuticals and biosimilars (the term for a
biological medicinal product claimed to be similar to an already approved reference
product), for the sector.
These two types of pharmaceutical products can be produced by both innovative and
generic companies.
In terms of trade barriers these two categories of products face many of the samebarriers
and challenges. Indeed, as far as newer fields such as biosimilars are concerned, the EU
has taken a notable lead in providing a sound regulatory framework, which has not yet
been reciprocated in many of the World's leading producers and economies.
Due to its obvious relationship with public health, the pharmaceuticals sector is regulated
compared to other industrial sectors, and subject to government interventions, both within
the EU and in third countries.
Such interventions range from the regulatory standards and frameworks that a
pharmaceutical product must go through before it can be placed on the market (e.g.
clinical trial testing, formal registration and certification), to controlling the price and/or
reimbursement for drugs where there is a public health system in place, either to control
budgets or to ensure the public an adequate access to medicines.
Access to medicines is also an important issue for the industry on a broader level. Third
countries and other interested bodies often promote or justify the imposition of certain
trade barriers and price regulation as a means to ensure access for the poor, and it is
clear that the sector has to balance its activities as a private, profit making industry with
its role as the provider of essential medicines.

Ranking of Industrial Sectors by Overall Sector R&D Intensity (R&D as Percentage
of Net
Sales – 2009 – source EFPIA):
Main competitors
Traditionally, companies in the US, Switzerland and Japan have been the EU's main
competitors in the global export market for pharmaceuticals, as well as the largest trading
partners for the EU in this sector. Of these major partners, only Switzerland has a trade
surplus with the EU, standing at approximately €6.1bn for the period January to
December 2010.
The EU is the second global manufacturing location for pharmaceuticals behind the US
and ahead of Japan, and holds a dominant position in a number of areas, including the
production of vaccines where 90% of major manufacturer’s global output is produced in
Europe.
The EU's exports accounted for an predictable 15.5% of the global Pharmaceuticals
market in 2010.

Europe is now facing increasing competition from emerging economies ,which are fast-
growing but also fast-changing markets.
In the generics sub-sector China, and notably India have made rapid progress due to low
cost and less regulated production conditions compared to the EU. For example, until
2005 there existed process patents in India, but not products patents, and the medicines
themselves were not protected making foreign medicines were easier to copy.
In addition, there is rapid growth in the research environment in emerging countries such
as
Brazil, China and India, resulting in further migration of economic and research activities
outside of Europe to these fast-growing markets. China increased the yearly value of its
exports to the EU by 720% between 2001 and 2010, and India's development has seen it
create a trade surplus with the EU in this sector (€-428m January-December 2010),
which has increased significantly over the last decade, and particularly from 2005
onwards, as India has steadily grown into one of the world's leading producers and
exporters of generic medicines.
Key Trade Issues
The Pharmaceutical industry has traditionally faced a wide range of barriers to
trade,including a range of TBT/NTB barriers, intellectual property rights and issues on the
specific pricing and reimbursement of drugs in particular countries.
On top of this, the sector can also be faced with cultural barriers to trade. For example, in
2010 Indonesia published a decree that announced its intention to ban certain products,
including medical products, containing porcine material. This would have affected a large
percentage of vaccines produced by the pharmaceutical industry.
Summary of respondent recommendations
In general, many respondents to the sector fiche questionnaire, including industry,
haveasked for the EU to help its companies and promote the interests of EU producers.
This 17 type of recommendation is clearly not limited to this industry. However, it could
be argued that the pharmaceutical industry is almost unique in amongst industrial sectors
in two key ways: Firstly, the industry is often selling its products directly to governments
and their delegated public authorities. Secondly, due to the intrinsic link to public health,

and the different ways governments can approach this issue (for both economic and
cultural reasons),the sector often faces diverse and complicated regulatory regimes in
different countries, which may differ from accepted international standards and add
additional burdens on top of those standards (see under section 3 above). Specific
suggestions from respondents include the establishment of local EU trade
representatives in key trade partners in order to help EU pharmaceutical companies, both
generic and originator, with gathering important information on regulatory requirements
and overcoming trade barriers.
Such a system could be complemented by setting up an information website portal with
comparative information on requirements for pharmaceutical companies with regard to
trade.
Another suggested option would be to require a legal representative of all players to be
present in the EU to even out the balance.
Seek sustainable business development and proper balance of IPR in trade agreements.
Where possible, the EU can look to enforce relevant TRIPS articles regarding patents
and regulatory data protection, including the protection of clinical trial data.
Also, where appropriate, the EU can encourage key emerging markets to adopt
international standards and avoid individual extra requirements.
However, the EU should also seek to find the correct balance in bilateral and multilateral
trade agreements, in order that it does not impose TRIPS +requirements on countries
where this may have an adverse affect on either public health or the ability of the EU to
import its own generic medicines.
Where appropriate, trade negotiations, including FTAs could look to harmonize and
reciprocate trade access, barriers, transparency (including regulations on pricing and
reimbursement policies), foreign direct investment, and other areas of mutual long-term
benefit to the EU and its trading partners.
The majority of respondents state that fair prices and a level playing field with countries
from outside the EU is key for the long term sustainability of the sector. Some of the EU's
third country partners have a competitive advantage in fields such as generics and bio
similar , and can sell their products at very low prices due to environmental, economic,
and taxation factors etc.

Where such an advantage is has been brought about by unjustified trade barriers, the EU
could seek opportunities to encourage their removal.

EXPORT & IMPORT OF PHARMETICAL SECTOR
Being centrally located in the European continent, Belgium’s trade is the hallmark of all its
activities. Belgium’s trade is further helped by its well developed transportation network,
diversified commercial and industrial base.
Belgium Trade, Exports and Imports
As raw materials and natural resources are not sufficient, the balance of trade is usually
towards imports and thus there is always some trade deficit in Belgium
According to the 2009 estimates, Belgium had an export volume of $296.1 billion
and ranked 13th in the world. This, however, showed a tremendous drop from the 2008
figures, which shone bright at $371.5 billion. The various export cMachinery and
equipment ommodities include.
Machinery and equipment
Chemicals
Finished diamonds
Metals and metal products
Foodstuffs
The following countries are the biggest export partners of Belgium
Germany
France
Netherlands
UK
US

Italy
The trade balance is slightly skewed towards imports. According to the 2009 estimates,
Belgium reported its import volume at $315 billion and ranked 11th in the world. This was,
however, lower than the 2008 figure of $387.7 billion.
The various imported commodities are:
Raw materials
Machinery and equipment
Chemicals
Pharmaceuticals
Foodstuffs
Raw diamonds
Transportation equipment
Oil products
TRADE AND INVESTMENT
Major trading partners: USA, Germany, Netherlands, France and UK.
Belgium’s external trade is concentrated within the EU: 73.1% of its exports are
to EU partners, and 75% of imports are from the EU.
The UK is Belgium’s fifth largest supplier and its fourth largest export market.
Belgium is the sixth largest market for UK exports. In 2010, Belgian exports to
the UK amounted to €13.8bn, while Belgium’s imports from the UK amounted
to almost €12.7bn
IMPORTS:
As per the Directorate General of
Commercial Intelligence and Statistics (D.G.C.I.S.)

Kolkata, value of imports of “Medicinal and
Pharmaceuticals Products” for the period 2002-03 to
2010-11 is as under:
It may be observed that the imports shown declined in growth in the year 2010-11
compared to previous year. The country is almost self-sufficient in production of most of
formulations/ pharmaceuticals products. As such imports are being resorted to on quality
& economic considerations and not necessarily due to non-availability from domestic

sources. Manufacturers of Drugs & Pharmaceuticals are free to produce any drugs
approved by the Drug control authorities.
The share of Exports of the “Drugs Pharmaceuticalsand Fine Chemicals” in the total
National Exportsdeclined from 4.50% to 4.20% during the period 2006-07 to 2010-11,
However in the absolute terms thereis growth in Exports. The share of imports is
declined0.7% to 0.6% in the corresponding period.

Being centrally located in the European continent, Belgium’s trade is the hallmark of all its
activities. Belgium’s trade is further helped by its well developed transportation network,
diversified commercial and industrial base.
Cooperation /Export Promotion of Pharmaceuticals
The important focus area for the Department of Pharmaceuticals is promotion of Indian
pharma exports. The Department participated in the following International Cooperation
events during 2011-2012 :-
1. Participation in 9th Session of India-Uzbek Inter-Governmental Commission on Trade,
Economic ,Scientific & Technological Cooperation held on 4-5 May, 2011 in Tashkent.
2. Participation in the Meeting of Biotechnology and Life Sciences Working Group under
India-US High Technology Cooperation Group held in July,2011 in New Delhi.
3. Participation in India Russia Forum on Trade and Investment held in November, 2011
in Moscow and the Roundtable on Pharmaceuticals.
4. Participation in Seminars organized by the Embassy of India, Jakarta in cooperation
with PT.
Strategic Asia held in Jakarta, Indonesia.
The Department of Pharmaceuticals also provided financial assistance for the following
activities/events
for promotion and development of the Pharma sector:
1. Preparing detailed scope of work, preparation of expression of interest for selection of
global onsultants for developing India as a Global Innovation Hub by 2020.
2. Assistance to Institute of Economic Growth for conducting a study on “Growth of
PharmaceuticalIndustry in India”.
India pharma summit-2011
The division of Pharmaceuticals in collaboration organized “India Pharma Summit
2011”, on 29th November, 2011 in New Delhi with Federation of the Indian
Chamber of Commerce and Industry (FICCI) and WHO (world health organisation)
India .
The theme of India Pharma Summit 2011 was“Indian Pharma – Road Map for
Global Leadership in Generic Medicines”. The India Pharma Summit was a one
day event to showcase India’s capability in the Pharma Sector before all the
stakeholders as well as to provide the networking opportunities to the Indian

Pharma Industry for having a meaningful interaction with various stakeholders. It
provided a platform that brings all the stakeholders such as policy makers from
Government of India, State Governments ,Indian Pharma Industry, Regulatory
Authorities from focus countries, Academia, Global Pharma Leaders/Experts on
one platform and facilitate a meaningful interaction so as to generate a healthy
debate as well as to come up with the solutions to issues of the problems being
faced by Pharma Sector.
India Pharma Summit 2011 was the 3rd event in successful series after the
Department of pharmaceuticals was carved out of Department of Chemicals &
Petrochemicals in July 2008.
Export and domestic growth
INTERNATIONAL SALES ON CONSOLIDATED BASIS
GEOGRAPHICAL DISTRIBUTION OF PHARMA INDUSTRIES

EXPORT GROWTH
GLOBAL MARKET PHARMA GROWTH RATE
PROJECTED GROWTH

Top Indian pharma cos to grow 20% in 2013
Top Indian pharma players will continue to grow strongly at over 20 per cent in
2013, primarily led by exports to the US market, India Ratings said in its outlook
for the sector.
“We believe that top players of the sector will continue to grow strongly in 2013
(over 20 per cent per annum), primarily led by exports.
Indian rating report on outlook for Indian pharmaceuticals for 2013 said that “Of
the export markets, Indian pharma will focus on the US market which presents
significant opportunities for the next two years for generics, due to patent cliffs and
recent changes in healthcare policies,”
Patent expiry opportunities, coupled with efforts to contain healthcare spends, are
likely to drive the generic market in developed countries. Affordability and
availability will make a case for generics usage in the branded generic developing
markets.

As per IMS Health, global generic spending is expected to increase to $430 billion
by 2016 from $242 billion in 2011. .
R&D spends have increased over the last few years as pharma players have built
robust portfolios of products approved by USFDA. Most companies also have a
strong pipeline of products awaiting approval, it said.
Robust new product pipelines may bear fruit in 2013 on commercialization.
Incremental capex requirements, however, are likely to remain modest in the year
as many companies benefit from existing infrastructure which would be sufficient
for expected increase in operations, according to the agency.
Observing that the growth drivers for domestic pharma market would remain
intact, India Ratings said the decision of National Pharmaceutical Pricing Policy
(NPPP) 2011 to increase the number of drugs under price control will not have any
major impact on the sector’s profitability.
The pharma industry has also performed well on exports front, too, with exports
having been increased from Rs 386 billion in 2008 to Rs 775 billion in 2012.
A rise in demand for generics in developed markets will be led by patent expiries
and an expansion of generics usage due to efforts taken to control healthcare
costs by governments, according to the report.
India pharma industry may be among top-10 by 2020 According to Stating that the Indian pharmaceutical industry is on a “good growth
path’, a CII-PwC report said it is likely to be among the top-10 global markets in
value terms by 2020.
However, the industry “will have to watch out for the regulatory interventions,”
according to the report titled “India Pharma Inc: Gearing up for the next level of
growth”.
High burden of disease, good economic growth leading to higher disposable
incomes, improvements in healthcare infrastructure and improved healthcare
financing are driving growth in the domestic market.
The Indian Pharma Industry has been rising at a compounded yearly growth rate
(CAGR) of more than 15% over the previous five years and has important growth
opportunities. However, for the industry to sustain it till 2020, Companies will have
to rethink their business strategy. They will have to adopt new business models
and think of innovative ideas to service their evolving customers faster and better.

Sujay Shetty, leader, Pharma Life Sciences, PwC India also said that the Industry
has seen many regulatory interventions over the last one year, which will require
careful consideration by Pharma Companies as they plan their future strategies.
Pharma Companies will continue to grow both organically and inorganically
through alliances and partnerships and focus on improving operational efficiency
and productivity. Developments in the health insurance, medical technology and
mobile telephony can help in the industry’s growth by removing financial and
physical barriers to healthcare access in India.
India pharma industry may be among top-10 by 2020 According to Stating that the Indian pharmaceutical industry is on a “good growth
path’, a CII-PwC report said it is likely to be among the top-10 global markets in
value terms by 2020.
However, the industry “will have to watch out for the regulatory interventions,”
according to the report titled “India Pharma Inc: Gearing up for the next level of
growth”.
High burden of disease, good economic growth leading to higher disposable
incomes, improvements in healthcare infrastructure and improved healthcare
financing are driving growth in the domestic market.
The Indian Pharma Industry has been rising at a compounded yearly growth rate
(CAGR) of more than 15% over the previous five years and has important growth
opportunities. However, for the industry to sustain it till 2020, Companies will have
to rethink their business strategy. They will have to adopt new business models
and think of innovative ideas to service their evolving customers faster and better.
Sujay Shetty, leader, Pharma Life Sciences, PwC India also said that the Industry
has seen many regulatory interventions over the last one year, which will require
careful consideration by Pharma Companies as they plan their future strategies.
Pharma Companies will continue to grow both organically and inorganically
through alliances and partnerships and focus on improving operational efficiency
and productivity. Developments in the health insurance, medical technology and
mobile telephony can help in the industry’s growth by removing financial and
physical barriers to healthcare access in India.

CH.9:- FUTURE OPPORUNITIES OF PHARMACETICAL SECTOR IN BELIGUM
State of Cluster Development: Belgium has developed strong export-oriented
clusters, such as: biopharmaceuticals; chemicals; plastics; and jewelry, collectibles
and precious metals. From 2009

Key Issues facing Belgian Competitiveness
Belgium has high political risk, due in part to the country’s parliamentarian system
and its federalist structure.
Belgium holds the world record for number of days without a formed government.
This political instability and lack of environment. There is wide disparity on whether
Belgium should remain united or not.
This shows results from a 2010 survey which highlights that most people in
Flanders support a separate country rather than a unified Belgium government
structure impacts the country’s businesses outlined in, Belgium’s increasing
budget deficit and government debt is a source of macroeconomic risk.
Belgium’s government debt is projected to increase further in 2011-2015. As the
government pursues tightened fiscal policies to reduce the deficit, there is an
increased risk of economic contraction and declining competitiveness (due to a
higher tax burden).
Belgium’s aging population also poses a challenge, as the older generation will
serve as dependents to a much smaller, tax paying, labor force.

In terms of microeconomic risks, four areas require improvement: first, Belgium
has low transparency of government policy-making. Government policies and
regulations are often inconsistent across the three regions. This is challenging for
the private sector, especially when a firm seeks to expand geographically across
the country.
Second, the regulatory framework is overly complex. The country’s decentralized
structure and a lack of regulatory harmonization across the regions increase the
cost of doing business in Belgium.
Third, Belgium has low levels of R&D investment and innovation output. Improving
innovation productivity would be an important enabler to upgrade the
competitiveness of existing clusters.
Finally, Belgium has one of the highest tax rates in the world which may limit
business investments and R&D. The regions have worked to mitigate the effect on
research by offering tax subsidies for R&D investments in sectors such as life
sciences. However, as the tax system relies heavily on labor.
BusinessOpportunities in future:
The Indian pharmaceutical industry’s major opportunities for are in the areas of:
• generics (including biotechnology generics)
• biotechnology
• outsourcing (including contract manufacturing, information technology (IT)and
R&D outsourcing).
Generics
Prescription drugs worth $40 billion in the U.S. and $25 billion in Europe are
due to lose patent protection by 2007-08
. Indian firms will likely take around 30 percent of the increasing global generics
market, the Associated Chambers of Commerce and Industry of India
(Assocham) forecast.
Currently, the Indian industry is estimated to account for 22 percent of the
generics world market. Low production costs give India an edge over other
generics-producing nations, especially China and Israel, says Assocham's
president Mahendra Sanghi

. He suggests that it will be easier for Indian firms to win larger generics
market shares overseas than at home, particularly in the U.S. and Europe.13
Indian drug manufacturers currently export their products to more than 65
countries worldwide.1
4 Their largest customer is the U.S., the world's biggest pharmaceutical
market.
The use of generic drugs is growing quickly in the U.S. due to cost pressure by
payers and the introduction on January 1 this year of the Medicare Part D
prescription benefit, giving seniors and people with disabilities prescription drug
coverage for the first time. With 74 facilities, India has the largest number of
U.S. Food and Drug Administration (FDA)- approved drug manufacturing
facilities outside the U.S. Indian firms now account for 35 percent of Drug
Master File applications and one in four of all U.S. Abbreviated New Drug
Application (ANDA) filings submitted to the FDA.15 Analysts at Credit Lyonnais
Securities Asia say they expect the number of generic drug launches by Indian
companies in the U.S. to increase from 93 in 2003 to over 250 by 2008.16
In January 2006, the Indian exporters' representative body, the Pharma Export
Promotion Council (Pharmexcil) said it planned to raise a number of concerns
with the U.S. government over what it sees as barriers to trade with them. One
is a U.S. regulation that disqualifies Indian firms from bidding for government
contracts, and another is the requirement Indian drug manufacturers submit
separate applications for each U.S. state (there is no U.S.-wide regulatory
requirement), even when the firms have FDA-approved products and
facilities.17
The U.S. continues to be an attractive market for Indian firms, despite the
challenges of price erosion and the launch of “authorized generics” by
innovator companies, says Ranjit Shahani, vice chairman and managing
director, Novartis India Ltd, and President of the Organisation of
Pharmaceutical Producers of ndia.
He does not see any increase in nontariff barriers there, and in fact feels that
trade between India and the U.S. is “set to rev up following President George
W. Bush's visit to India on March 1, 2006, with both countries going all out to
liberalize market access.” The main concern of the U.S.
FDA appears to be , he says, but he does not believe this to be an obstacle for
reputable Indian manufacturers. Moreover, while the World Trade Organization

(WTO) Doha Trade-Related Aspects of Intellectual Property rights (TRIPs)
national emergency/compulsory license agreement presents exporting
opportunity for Indian firms, Shahani stresses that the firms must have anti-
diversion measures in place in order to protect their reputation.
Biotechnology Generics Firms based in India and China could be among the first to bring biogenerics
(generic versions of biological products) to the regulated markets and faster
than expected. The first biogeneric product was approved by the European
Medicines Agency (EMEA) which refers to these products as “biosimilars,” in
April 2006.
IMS estimates that biotechnology products accounted for 10 percent of global
pharmaceutical sales in 2004, or about $55 billion in worldwide sales for the
year.19 By 2003, the U.S. accounted for 62 percent of the global biotech
drugs market, while in that year Japan's share of the total had fallen to 7
percent from 28 percent in 1994.20 Patents on the first generation of
blockbuster biopharmaceuticals are beginning to expire, and the high cost of
these products means the generic versions will find large markets among hard-
pressedgovernments and other payers. Sales of biogenerics are flourishing in
the unregulated markets. The only regulated-market approvals so far are in
Australia, granted in October2004 for the recombinant DNA growth hormone
Omnitrope, manufactured by Sandoz, as well as in the EU, granted in April
2006.
Outsourcing
IT Outsourcing India's status as an information technology superpower, with access to
specialist skills and 24/7 work hours, is a huge advantage as it strengthens its
position as the destination of choice for contract research, including drug
discovery.

Eighty-two percent of U.S companies overall rank India as their first-choice IT
outsourcing destination, says leading international clinical research
organization Chiltern International,28 adding that IT and IT enabled services
(ITES) companies have been expanding their activities in India to new
business segments such as bioinformatics and life
sciences; those doing so or planning to include Accenture, Intel, Satyam,
Cognizant, IBM.
Opportunity in Developed Economies
Japan, Us And Europe are the most important economies in global
pharmaceutical market.
Developed markets such as USA, Top 5 EU countries and Japan are estimated at
US$295-305bn, US$135-145bnand US$64-68bn respectively with single digit
growth rates (refer chart 23 & Table 4). The generics opportunity with in this
market is relevant for India. Around ten percent of this market estimated between
US$49.4 – 51.8 billion can be taken as the size of the opportunity for Indian
generics.
Generics need not be promoted to doctors in many markets such as USA and
assume character of a commodity in these countries. The cost of promoting to
doctors and setting up drug promotion structures would other wise be very high for
Indian firms and the only entry cost in generics markets in these countries is
limited to the cost of developing a DMF (Drug Master File) or ANDA (Abbreviated
New Drug Applications) and the filing costs. In view of this, many developed
economies are important target opportunities for pharmaceutical generic
manufacturers.
Emerging markets (Brazil, China, India, Mexico, Russia, South Korea and Turkey)
are estimated at US$85-90bn. (12-13%) and rest of the world is estimated at
US$125-135bn growing at 7-8 percent in the coming years. Emerging markets
have significant generic component due to historic reasons of patents applicability.
Bio-generics Opportunity Bio-generics are nothing but generic versions of biological products. With around
200 companies, India's biotechnology sector is growing fast and is in the early

stages of development with initial emphasis on vaccines and bio-services. The
break-up of Indian domestic biotechnology market is given in chart 19. This
industry grew by 37 percent in the year 2006-07. Total biotechnology exports
stood at US$763 million during 2006-07 with 75 percent of it coming from
biopharmaceuticals.
IMS estimates that biotechnology products accounted for over 10 percent of global
pharmaceutical sales, 20 Patents on the first generation of blockbuster
biopharmaceuticals are beginning to expire. Sales of bio-generics are flourishing in
the unregulated markets. The only regulated-market approvals so far are in
Australia, granted in October 2004 for the recombinant DNA growth hormone
Omnitrope, manufactured by Sandoz, as well as in the EU, granted in April 2006.
■ There is rapid growth in the market and research environment in emerging
economies such as Brazil, China and India, leading to a migration of economic
and research activities outside of Europe to these fast-growing markets. In 2011
the Brazilian and Chinese markets grew by more than 20% (20.0% and 21.9%
respectively) compared with an average market growth of 2.6% for the fi ve major
European markets and 3.6% for the US market (source: IMS).
■ In 2011, North America accounted for 41.8% of world pharmaceutical sales
compared with 26.8% for Europe. According to IMS data, 56% of sales of new
medicines launched during the period 2006-2010 were on the US market,
compared with 24% on the European market.
■ The fragmentation of the EU pharmaceutical market has resulted in a lucrative
parallel trade. This benefits neither social security nor patients and deprives the
industry of additional resources to fund R&D. Parallel trade was estimated to
amount to € 5,100 million (value at ex-factory prices) in 2010.
CH.10:-RECOMMENDATIONS & CONCLUSION Recommendations to Improve Belgium’s Competitiveness
Firstly, to address the political risk of fragmentation, Belgium should pursue
policies to promote social cohesion and improve regional disparities. Government
programs to support academic exchange and inter-regional business partnerships
can improve social cohesion. Developing a long-term national strategy for
competitiveness will also promote national unity. A national action plan to improve

prosperity will allow the Belgian government to better coordinate activities between
the regions and encourage efficiency-enhancing collaboration such as joint
marketing initiatives and joint design and sponsorship of training.
Secondly, to address the government’s fiscal deficit, Belgium will need to reduce
government spending and raise taxes. A continued privatization program can
reduce ongoing expenditure, improve efficiency and may increase extraordinary
receipts. The government should also restructure its tax policy to shift the burden
towards VAT. A consumption tax is a good substitute for receipts from income
taxes and has less of a decorative effect on labor supply.
Thirdly, to address the challenges of different regional regulations, the federal
government should centralize regulation to ensure that federal and regional
legislative processes do not overlap. Fourthly, Belgium must improve its low levels
of R&D investment and innovation output. This requires targeted effort across
three stages with collaboration between government, universities and private
sector participants. Belgium needs to increase its R&D expenditure to match the
OECD average. Fiscal incentives can support this, for example through tax credits
and a national investment fund which matches private sector establish a working
party to identify barriers to innovation (e.g., a lack of particular skills, the
complexity of the regulatory system, intellectual property laws, etc).
Ensuring wide participation from the academic and industrial sectors will ensure
that a collaborative and integrated approach is taken. Belgium can improve the
commercialization of R&D efforts by strengthening technology transfer offices.
Finally, Belgium needs to increase the country’s low rate of labor force
participation. Policies should discourage early retirement by increasing tax rates
on early withdrawal of retirement or pension funds.
Improving child-care services, adopting better policies for maternity leave, and
introducing flexible at-home employment opportunities may help increase female
labor participation contributions. Belgium also needs to improve the productivity of
R&D to increase the number of patents developed.
From the above graph and pharmceutical cluster we would imagine the position of
belgium in pharma industry.
Belgium is doing lot of thing in pharma sector with help of diagram we can imagine
but for better growth it need to achieve better factors to get success in
pharmcetical industry.

Conclusion:
The EU industry, while facing strong competition from traditional economies such
as the US and Japan, and also from emerging economies such as China, India
and Brazil, remains strong in the international marketplace. As the export statistics
above (and below in Annex I),demonstrate, all subsectors of the EU industry
appear to be able to adapt well to a changing global market place, and are able to
exploit new and emerging markets throughout the World economy.
There are, however, clearly present and future challenges to the industry, both in
maintaining it's strong position as a market leader, and particularly in overcoming
non-tariff barriers to entry which are both numerous and diverse in nature. Indeed,
the EU sector's strong presence throughout the World marketplace can be a
weakness as well as a strength when attempting to tackle these trade barriers.
As a world leader in the sector, the EU industry takes a global approach to trade
issues and barriers listed above There is a risk that industry is potentially focusing
its efforts too widely, and this is true for both originator and generic sub sectors.
The sector may, therefore, face a future challenge in how it prioritizes the type of
barriers it wants to address and in which markets. As part of their submission, the
industry has provided an extensive trade barrier list, and as a follow-up exercise
the Commission will work with the industry to analyze and priorities this lies list.
Belgium is the second largest exporter of biopharmaceutical products in the world
with a market share of 13% in 2007, second only to Germany.55 From 1997 to
2007 Belgium’s world export market share increased by 7%, while Germany’s
market share increased by 1.2%./
In terms of total export value, the cluster ranks second in the country with exports
of $50bn in 2007,just behind the automotive cluster whose exports amounted to
$52bn.57 60% of the cluster’s total production is exported to the rest of the world.
The cluster employs an estimated 27,300 workers, with 26,000 people working for
pharmaceutical firms and 1,300 for biotech firms.59 Roughly 5,000of these jobs
are in R&D0 Belgium pharmaceutical production has grown at a 7.1% CAGR
between 1995 and 2010.

Belgium’s pharmaceuticals cluster map is outlined in Core activities fall into four
categories: R&D, clinical trials, manufacturing and marketing/sales. The
government plays a key role by creating legislation and enforcing certain
regulations (e.g., drug approval; pricing and reimbursement processes; and health
and safety regulations). In addition, regional investment and trade bodies
encourage inward investment; both from new and existing cluster participants.
Belgium also hosts several related clusters that complement the pharmaceutical
cluster, including: biotech, chemicals, agribusiness and logistics. Each related
industry supports a different pharmaceutical activity. For example, the biotech
cluster complements R&D activities through commercialization of new research
discoveries. The chemicals cluster complements manufacturing through
supporting product and process expertise. The logistics cluster plays an important
role in distributing pharmaceutical products to Belgium’s global customers.
From above diagram we observe about Export and Import of phamcetical sector
with Belgium and India and both of them we concluded that better growth rate
would be possible in pharmaceutical sector but it needs to look after by European
union agreements.
Drugs and Health activities are look by the Government.
The company now wants to expedite its clinical research operations and is in the
process of building a global organization focusing on clinical research with multiple
facilities in the USA, Europe and India.
There is rapid growth in the market and research environment in emerging
economies such as Brazil, China and India, leading to a migration of economic
and research activities outside of Europe to these fast-growing markets. In 2011
the Brazilian and Chinese markets grew by more than 20% (20.0% and 21.9%
respectively) compared with an average market growth of 2.6% for the fi ve major
European markets and 3.6% for the US market (source: IMS).
In 2011, North America accounted for 41.8% of world pharmaceutical sales
compared with 26.8% for Europe. According to IMS data, 56% of sales of new
medicines launched during the period 2006-2010 were on the US market,
compared with 24% on the European market.
The fragmentation of the EU pharmaceutical market has resulted in a lucrative
parallel trade. This benefits neither social security nor patients and deprives the
industry of additional resources to fund R&D. Parallel trade was estimated to
amount to € 5,100 million (value at ex-factory prices) in 2010.

This is finally concluded that still market rate, market growth .its share etc can
grow faster in pharmaceutiual sector in belgium ,if it is look with proper norms and
policies.

ANALYSIS
OF AUTOMOBILE INDUSTRY

The Belgium car industry has a long the past reaching back to the end of the 19th century
and has always been one of the main drivers of the national economy. An outward-
looking sector, it exports a significant amount of its production worldwide. As a country
with long-standing links to car manufacturing, Belgium has a highly capable and
professional workforce Belgium is home to very rich and diverse automotive industry.
The Belgian car industry has always been one of the main drivers of the national
economy. While more than six million vehicles (roughly one car for every two Belgians)
are registered in Belgium with more than 500,000 new registrations every year, Belgium
represents a small market relative to the US. The most important consideration for
American exporters to keep in mind in creating auto-related goods for the European
market is that the design must fit European specifications and style.
Belgium global contractors also run in Africa, Asia, Australia and Central and South
America. The international commitment of Belgium contractor is not new. At the turn of
the 20th century, they were already involved in ambitious projects such as the railways in
Russia and China, the tramways in Cairo, the Paris subway, and various projects in
Central Africa.
Belgium really is the home and exporter of wonderful new contractors, great
architect, engineering and design offices, high-tech material and construction material
manufacturers, all creating and building the future.
Belgium is home to numerous world-leading enterprises operating in widely
differing sectors. Because of the strong presence of automotive suppliers and assembly
plants in the region, some of these big corporations have focused as well on the
automotive industry.
Belgium is home to an immensely rich and diverse automotive industry. Several
multinationals have established themselves in Belgium; medium sized Belgian
companies, moreover, specialise in the finishing of luxury, top-of-the-range cars, and we
should not forget the Belgian manufacturers Van Hool and Jonckheere who specialise in
buses and coaches. Also important are the logistics hubs, suppliers and competence

centres, which are contracting not only in Belgium but as well with companies throughout
the world.
A well industrial transportation system plays a key role in the development of an
economy, and India is no exception to it. With the growth of transportation system the
Automotive Industry of India is also growing at rapid speed, occupying an important place
on the 'canvas' of Indian economy. Today Indian automotive industry is fully capable of
producing various kinds of vehicles and can be divided into 03 broad categories: Cars,
two-wheelers and heavy vehicle.
In Belgium benchmarks the current public automotive research activities at international
level, in particular the European Union with Brazil, Canada, China, India, Japan, Malaysia,
Russia, South Korea, the United States and 13 EU Member States. EAGAR identifies the
national road transport visions and roadmaps, research priorities, supported key topics,
technology pathway, as well as the level of investment. This enables a direct comparison
of national automotive R&D policies relating to the environment, safety and congestion.
The EAGAR study provides a key perspective on global investments designed to
improve automotive vehicle technologies for a greener, safer and smarter road transport
system. Overview of national road transport visions, research agendas and roadmaps
Comparison of automotive research priorities and Investments focused on vehicle
technologies. Characteristics of National automotive research funding systems and
approaches Potential international cooperation areas from a European perspective this
study benefits the competitiveness of Europe and enables
the stakeholders to adjust its visions & plans for the future.
It is available from the EAGAR website WWW.EAGAR.EU as deliverable D.5.1 from
September 2010.
Belgium has notched up second place, behind Hong Kong and ahead of Singapore, in
the global Foreign Direct Investment (FDI) Attraction Index published by the United Nations
Conference on Trade and Development (UNCTAD).
As regards the contribution of FDI and foreign affiliates to the economy.(in terms of
value added, employment wages, tax receipts, exports, R&D expenditures and formation)
Belgium is also second in the world, behind Hungary and ahead of the Czech Republic.
Over the next one year, some 20 new cars will be seen on Indian roads. Take note
of this, Maruti Udyog is coming up with new Zen and the diesel version of Swift during the

next few months. Hyundai will also be unmasking the Verna and a brand new diesel car.
General Motors will be launching a mini and may be a compact car.
Honda, Suzuki, General Motors and Hyundai, the global automakers had
already launched their premium SUVs in the market to broaden their portfolio and create
product excitement in the segment estimated at about 10,000 units annually. Foreign
auto makers, including Ford Motor Co. , General Motors Corp., Honda Motor Co. Ltd.,
Toyota Motor Corp., DaimlerChrysler AG and Hyundai Motor Co. Ltd., are looking to
increase their presence in India and use it as an export hub.
Exports of auto components, whose manufacturing costs are 30-40 per cent lower
than in the West, have grown at 25% a year between 2011 to 2012.Belgium is an
attractive country for vehicle manufacturers. Not only does it offer a highly qualified
workforce with a proven track record of high productivity; it also has the ports to enable
rapid distribution and research centers to test parts and components and look into the
potential of new technologies.
In 2011-12, Belgium turned out 724,498 vehicles, most of them destined for the
export market. Of this total number of vehicles made in Belgium, 434,875 were private
cars, 245,256 were vehicles for transporting people or goods, 43,068 were utility vehicles
weighing in excess of 3.5 tonnes and 1,286 were coaches.
Belgium’s national accounts are drawn up based on the definitions of the European
system of national and regional accounts (ESA 1995). Gross domestic product is a key
variable calculated in the system of national accounts. The calculation is performed
according to three approaches: production, income and expenditure at current prices.
There are many reason for that we can invest in Belgium like Strategic location,
Infrastructure, Smart taxation, Quality of the workforce ,Helpful authorities ,Quality of life.
The regional accounts contain data on the indicators per branch of industry and the
income accounts of households for the regions, provinces and districts. The sector is
strongly characterized by globally organized foreign manufacturers of hardware and
software products for industrial automation. This sector continues to develop extremely
quickly through the very widespread presence of these manufacturers in our country, the
relatively many engineering and integrator companies, rapidly rising demand for newer
and more highly performing solutions from our local production companies and ever
shorter PLCs (Product Life Cycles) in this type of high-tech product for outsourcing this
usually non-core activity in production companies

Producers of industrial automation products are present but there are a few of them
in terms of numbers. They are oriented more towards niche markets and develop
hardware and software for specific solutions such as mechanical engineering, but are
growing steadily and gaining in importance in the Belgian economy.
Today’s automotive industry is affected by many trends. Governments are tempering
the need for revenue with increased competition for labor and capital. Tax authorities are
adapting their enforcement strategies, focus and policies in response to the changing
dynamics of business. Companies are balancing competing priorities, ensuring they
maintain compliance while adding value.
Through Ernst & Young’s Global Automotive Center, we can assist you with these
critical issues. Our 7,000 automotive-focused professionals collaborate and share
knowledge around the world, to provide consistent, high-quality service to our
automotive clients Our global automotive analysts continuously monitor the industry's
ecosystem to identify events that pose significant uncertainty - in terms of opportunities
or risk - and assess potential outcomes and implications for stakeholders.
Belgium is an attractive country for vehicle manufacturers. Not only does it offer a
highly qualified workforce with a proven track record of high productivity; it also has the
ports to enable rapid distribution and research centers to test parts and components and
look into the potential of new technologies.
Flanders also has its very own innovation network, called Flanders' DRIVE. This
initiative offers companies and research establishments like universities the possibility of
exchanging know-how and launching joint projects. The network sets out to boost the
production and development capacities of suppliers based in Flanders.
Historically, the automotive industry has been very strongly rooted in Belgium.
The Belgian automotive industry has been characterized in the past by a high volume of
production (assembly) of passenger cars and heavy trucks for foreign OEM. In 2008,
724,500 vehicles were produced (of which over 90 % for export), which makes Belgium
one of the highest-per-capita automotive manufacturing countries.
The main assembly companies are Ford, Volvo, VW, and Opel. Despite its very
high productivity (amongst the world best), this assembly industry is currently under
every heavy pressure. Renault closed its assembly plant in 1997, VW changed its
production to a smaller volume of Audi and GM has decided to close Opel Antwerp.

The most recent evolution is the announced take-over of Volvo by Geely
(China), which might give an extra impulse to the Volvo-Gent assembly plant which is a
major producer within Volvo. Inversely, OEMs such as Toyota are expanding their
European Headquarters in Belgium, expanding into an engineering and manufacturing
management centre. Furthermore Belgium has a worldwide reputation for its
development and production of buses, trucks, trailers, and agricultural automotive
equipment, among which Van Hool and VDL Jonckheere (buses) and CNH (agriculture).
The main challenge for the automotive industry in Belgium (and essentially located in
Flanders) is to retain its competiveness in the globalised world. Strategic programmers for
innovation have been developed in all Belgian Regions, Wallonia: Plan Marshall pours la
Wallonia and Brussels-Capital: Regional Plan for Innovation
In Flanders, a specific Automotive Round Table has led to a 10-pointsaction plan,
including innovation, and which is now being further transformed in actions under the
new Flemish government (2009-2014). The main actor to give shape to the automotive
innovation action plans is the Competence Centre Flanders’ Drive. Furthermore, the
Flemish government is evaluating strategic programmers towards electric vehicle
technology, including the support of field testing. These plans have yet to be further
concretized at the date of this report.
Challenges related to environment are less explicitly related to the Belgian
automotive industry as such (more to the car buyers and traffic users), and are rather an
intrinsic part of the national and regional environment policy which follows to a major
extent the EU policies. Part of this environment policy addresses road transport, but
rather on the level of homologation legislation, standards, tax policy, traffic control, and
law enforcement.
This is essential because a major part of the automotive industry concerns the
assembly of products, where the impact of policy makers on the actually developed
products is small. Belgium is a fast emerging destination for Indian exports. Besides, iron
and steel, capital goods, and chemical material and products, India imports huge quantity
of pearls and precious stones especially rough diamonds from Belgium.
It can be reveals that exports to Belgium have grown at the rate of 21.27% in the year
2002-03 over the previous year and correspondingly the total exports of India have also
grown at almost same level (22.06%).Similarly, on the imports side, we observe a
contrasting behavior between growth in imports from Belgium and growth in total imports of
India.

The importance of Belgium in the continental Europe is always to be seen through
the prism of it being the headquarters of two significant International organizations i.e.,
European Union and NATO( North American Treaty Organization). Belgium’s position in
the international affairs is one that counts on its immaculate stand on global issues of all
types and its say in the global foras can hardly be under-estimated. In view of the
venerated International reputation that the country has gained, it is quite necessary to
continue to strengthen the chords of relationship.
With exemption of the low cost scenario a key challenge for automotive companies
(OEMs) is to put considerable resources into the development of new power train
technologies. Many companies have already announced to introduce electric vehicles
(EV) and plug-in hybrid electric vehicles(PHEV) for 2012 which reflect that they are
currently developing these products (considering the long development times for new
innovations and products).
Moreover, new manufacturing technologies have to be adopted as well in order to
increase flexibility and reduce cost. In addition, common efforts to standardize
technological development have to be realized.
The development and diffusion of new technologies such as advanced driver
assistance systems, electric vehicles or hydrogen fuelled cars can be interpreted as
radical innovations. These types of innovations and technologies build on a different set of
engineering and scientific principles and substitute existing technologies and
competencies of the established industry. Organizational change
Another challenge particular for the engineering teams will be the handling of
inherent trade-offs in designing new vehicles. The achievements of different goals
related to sustainability, effectiveness and safety is associated with difficult decision-
making, for instance in relation to the use of new materials. The need for recycling
may limit the number of different materials and plastics being used and will also require
labelling of components.
The design process of the car needs to take into account at an early stage the
requirement for recycling and improved dismantling technology. New logistic strategies
and services in relation to the re-use may have to be adopted, too. Again, this is
relevant in all scenarios.
In addition, global car manufacturers are acting in different context and environments

and hence have to follow divergent strategies in order to respond to manifold
challenges on different geographical markets and locations due to different taxations,
environmental awareness, regulation, etc.
Due to diverging and more heterogeneous market needs manufacturer have to
enlarge their portfolio and to invest in flexible manufacturing technologies The availability
of a specific infrastructure with sensors is a necessity for the development of
innovations around the theme of driver assistance and safety. Such innovations and
applications require an infrastructure which enables the communication and system-level
control.
The automotive industry can also benefit greatly by using knowledge from the
aircraft and aviation industry but also the computer and consumer electronics
industry, mostly regarding the (co-) development and use of new materials, navigation,
driver assistance and safety system In addition, the automotive industry may co-
operate with developers and producers of alternative bio-fuels such as biogas.
From the perspective of the innovation system, the automotive industry so far
has often rather enacted the institutional environment and created new market
needs and seldom responded just to customer demands, hence innovations were rather
technology driven (push innovations).
However, consumer preferences have changed and will change and may
have a stronger impact on the business policy and product portfolio of car
manufacturers (OEM) in the future. We will see a stronger involvement of end
customers in the development process and hence user innovation and open innovation
models will have to be adopted by automotive firms to address this issue and keep their
competitive position. The initiative to develop an open source car can be referred to
in this context.
Social structures such as norms, values, expectations, procedures, standards
and routines are part of the institutional environment being a strong driver for the
development of the automotive industry. As history shows institutions are relatively
resistant to change and have a high level of resilience in general.
The transformation of (innovation) systems often happens over a long period.
The introduction of airbags, air conditions and low emission engines demonstrate
institutional change, which are now accepted and internalized while they were
unaccepted 20 years ago. Due to its highly complex products, the automotive industry is

one of the most regulated sectors in the EU.
Regulation has a significant impact on the manufacture of motor vehicles and
vehicle parts. The most important regulations concern safety standards,
environmental compatibility, norms and standardization, and IPR-regulations.
Regulations could be a barrier to innovation if the passenger car market is
fragmented into national markets with divergent policies in respect of car taxation,
which is real challenge in Europe (EC 2002). In 2005 the Competitive Automotive
Regulatory System for the21st century (CARS 21) a high level group comprising major
stakeholders (EC, member states, trade unions, industry etc.) was founded.
An already mentioned above a broad bundle of regulation is related to environmental
issues and safety. Literature on innovation in the automotive sector suggests that an
extensive and extending regulatory framework may either hamper or open new
trajectories to innovation. Regulations such as vehicle safety, reduced vehicle
weight or noise of tires, fuel consumption, recycling, composite materials, avoidance
of toxic materials and alternative drives hamper innovation (Eads, 1980)
In the empirical literature on gazelles, there is no explicit consensus of how to define
a cut-off point in terms of high growth. In fact, there is a wide range of different
explanations on how to choose (a probably largely arbitrary) such a cut-off point of
growth. In general, the cut-off point indicates the frontier at which high-growth firms
become gazelles.
The following cumulative examples give an overview on the existing descriptive
literature. Different studies, most of them are widely used in the literature; define high
growth firms as having a turnover growth rate of at least 20 % p.a. for three or more
consecutive years (Birch & Me doff, 1994; Birch, pHaggerty, & Parsons, 1993; Reuber &
Fischer 2005; Nicholls-Nixon, 2005, Sims & Oregon, 2006; Tatum, 2007). Audio, Arenius,
& Wallonia’s (2000) and Aces, Parsons, & Spencer (2008) define high growth firms
as firms that obtain at least 50% turnover growth during each of three consecutive
financial years.
Further studies employ a relative cut-off point and use the top growing 5 % or 10
% of high growth firms (Kirchhoff, 1994; Schreyer, 2000; Davisson & Delmar, 2003,
2006; Parker et.al., 2005).

The results obtained for cooperation confirm the assumption that firms being active
in cooperation’s might be more likely to become gazelles. The report on sectoral
innovation systems in Europe (2008) points out that gazelles may act in clusters and that
collaboration may have an impact on these firms to become gazelles.
Nevertheless, the results show that there are decisive differences when different
innovation cooperation’s are used. Most of the high-growth firms have cooperation
arrangement on innovation activities. Gazelles tend to have more national clients and
customers and are more active in innovation cooperation’s (e.g. Consultants, private red
institutes) in other countries.
Gazelles in other sectors are integrated in the value and supply chain of the
automotive and broader the transport equipment sector. Gazelles in the textile industry or
the knowledge intensive business sector are often oriented towards attractive supply-
markets of the automotive industry, for instance. Thus, suppliers in the textile industry can
generate considerable growth rates on the basis of their supply function to local
producers in the automotive industry and their indirect integration in a global supply chain.
The EU-25 automotive sector represents about 8% of total value added in the EU-25
manufacturing industry and shows impressive figures for R&D- and Innovation expenditures
are significantly above the average of medium-high-technology manufacturing.
Although new EU member countries are advancing rapidly, both on supply and
demand side, view countries (in the first place Germany) clearly dominate the sectoral
economic and innovation system in Europe. Even if statistical data elides the difference
between passenger cars and commercial vehicles it is of considerable relevance for
innovation and market development.
Our results show a differentiated picture of innovation in automotive sector,
reinforcing significant strengths of the automotive sector but also posing future challenges
and need for policy intervention. Innovation expenditures in the automotive sector are
considerably above industry average, but are frequently driven by external factors, e.g.
Developments in machinery and equipment, materials, electronic equipment. Innovation
throughout the value chain plays a significant role.
The automotive sector is dominated by enterprises belonging to a few very large
enterprise groups. Innovation in the automotive sector is affected by powerful supply and
network structures with a decisive role being played by systems (mega) suppliers.

The whole design and development process has been reorganized in the recent
years as tasks are organized parallel and interactively synchronized. Beyond a new
organization of innovation processes in multidisciplinary teams the direct involvement of
systems and component suppliers became necessary. We could show that peripheral actors
have become more strongly connected to actors in the centre since the end ofthe1980s.
The European automotive sector was already undergoing a process of restructuring
before the onset of the current financial and economic crisis. While the current crisis
merelyserved to compound existing inherent structural problems it will be a barrier for
innovation in the short-term.
The analysis of Potential barriers to innovation verified global financial crisis but also
market protectionism as barriers of innovation. While innovation has for decades been
driven by technological considerations, market factors are becoming even more decisive
(both as potential barriers and drivers) in innovation activities.
European policy can support the reorientation towards new emerging markets via
supporting technological development but also via fostering the establishment of
European standards in foreign markets.
The analysis of eco-innovation opportunities also showed a wide range of
incremental eco-innovations in this sector, but firms down the supply chain have a more
reactive rather than active innovative behavior in the face of potential environmental
regulations.
Several recent technology roadmaps for the automotive industry have painted a
relatively clear picture of the technological alternatives under way which might gradually
lead to a new area of mobility. The projected image of a smooth manageable transition to a
new paradigm proved illusionary.
More ambitious policy objectives have to overcome potential conflicts and trade-offs
between short-term competitive, environmental, transport and social policies and
interests at the European and national levels. Furthermore paradigmatic shift towards
alternative concepts of mobility and transport requires long term structural change of
industry and transport infrastructure and a better synchronization of legislations (about
environmental issues) and automotive innovation cycles
The extant policy has drawn many overseas companies into India but needs to be
more investor friendly, address emerging problems and be WTO compatible. The Indian

car market is full of possibilities; but present demand profile inhibits volume production,
save by a few, and conduces contention rather than competition.
World over, the majors have consolidated to elevate technology, enlarge product
range, access new markets, cut costs and ingraft versatility. They have resorted to
common platforms, modular assemblies and systems integration by component suppliers
and E-Commerce.
The automotive industry is in the midst of a major structural transformation in today's
globalised scenario. "System Supply" of integrated components and sub-systems is
becoming the order of the day, with individual small components being supplied to the
system integrators instead of the vehicle manufacturers.
In this process, most of the SSI units manufacturing smaller individual components
are on their way to become tier 2 and tier 3 suppliers, while the larger companies
including most MNCs are being transformed into tier 1 companies, which purchase from
tier 2 & 3, and sell to the auto manufacturers.
Initiatives relating to investment, tariffs, duties and imposts will be the instruments to
achieve the Policy objectives. These path government’s economic reform and are in
harmony with the commitments made to WTO .Increased resource allocation to the
highways sector to ensure collateral up gradation and development of road infrastructure
in step with the increase in the population of vehicles. An appropriate regulatory
framework for smooth movement of traffic, safety and environmental aspects.
The incidence of import tariff will be fixed in a manner so as to facilitate development
of manufacturing capabilities as opposed to mere assembly without giving undue
protection; ensure balanced transition to open trade; promote increased competition in
the market and enlarge purchase options to the Indian customer.
The Government will review the automotive tariff structure periodically to encourage
demand, promote the growth of the industry and prevent India from becoming a dumping
ground for international rejects. In respect of items with bound rates viz. Buses, Trucks,
Tractors, CBUs and Auto components, Government will give adequate accommodation to
indigenous industry to attain global standards.
In consonance with Auto Policy objectives, in respect of unbound items i.e., Motor
Cars, MUVs, Motorcycles, Mopeds, Scooters and Auto Rickshaws, the import tariff shall
be so designed as to give maximum fillip to manufacturing in the country without
extending undue protection to domestic industry.

The conditions for import of new Completely Built Units (CBUs), will be as per Public
Notice issued by the Director General Foreign Trade (DGFT) having regard to
environment and safety regulations. Used vehicles imported into the country would have
to meet CMVR, environmental requirements as per Public Notice issued by DGFT laying
down specific standards and other criteria for such imports. Appropriate measures
including anti dumping duties will be put in place to check dumping and unfair trade
practices.
The ownership of cars in India is just 6 per thousand of population as against 500 in
the developed economies. The contribution of the auto sector to the GDP and
employment is likewise low. Expansion of local demand holds great potential and is vital
to install scale volumes of production. Domestic demand mainly devolves around small
cars not exceeding 3.80 meters in length. Small cars occupy less of road space and save
on fuel.
These capture more than 85% of the market. India can build export capability and
become an Asian hub for export of small cars. The growth of this segment needs to be
spurred. Multi Utility Vehicles MUVs are an important mode of economical mass transport
in rural India due to poor road infrastructure and lack of good State transport system.
They are the first vehicle purchased by a number of farmers, traders, small
businessmen in rural and semi-urban markets. The Government will Endeavour to
provide fiscal incentives to this sector. Commercial Vehicles presently excise duty on
commercial vehicles sold by a manufacturer whether as a chassis or with a complete
body is 16%. However, no duty is levied on the body that is built by an independent body
builder on chassis bought from a manufacturer.
This dispensation inveigles production of the complete trucks and buses by the chassis
manufacturer and is detrimental to safety standards. The Government shall promote
Research & Development in automotive industry by strengthening the efforts of industry
in this direction by providing suitable fiscal and financial incentives.
The current policy allows Weighted Tax Deduction under I.T. Act, 1961 for sponsored
research and in-house R&D expenditure. This will be improved further for research and
development activities of vehicle and component manufacturers from the current level of
125%.
In addition, Vehicle manufacturers will also be considered for a rebate on the

applicable excise duty for every 1% of the gross turnover of the company expended
during the year on Research and Development carried either in-house under a distinct
dedicated entity, faculty or division within the company assessed as competent and
qualified for the purpose or in any other R&D institution in the country.
This would include R & D leading to adoption of low emission technologies and
energy saving devices. Government will encourage setting up of independent auto design
firms by providing them tax breaks, concessional duty on plant/equipment imports and
granting automatic approval. Allocations to automotive cess fund created for R&D of
automotive industry shall be increased and the scope of activities covered under it
enlarged.
The Porter's 5 Forces tool is a simple but powerful tool for understanding where
power lies in a business situation. This is useful, because it helps you understand both
the strength of your current competitive position, and the strength of a position you're
considering moving into.
With a clear understanding of where power lies, you can take fair advantage of a situation
of strength, improve a situation of weakness, and avoid taking wrong steps. This makes it
an important part of your planning toolkit.
Conventionally, the tool is used to identify whether new products, services or businesses
have the potential to be profitable. However it can be very illuminating when used to
understand the balance of power in other situations
Manufacture and export of small cars, Multi Utility Vehicles (MUV), two & three
wheelers, tractors, components should be further promoted in lieu of the current export
trends. Appropriate Tariff Policy should be followed to attract further investments in the
Automobile Sector. Measures should be taken to expand the domestic market.
Exports should be more encouraged. Policy initiatives for competitiveness and
development of technology should be taken. Infrastructure development around identified
automotive clusters should be undertaken. Emphasis should be on more product
innovation and Value added services as the current customer demands better products
and services aggressively. Setting up of virtual SEZ and Auto Parks for auto component
industry should be considered.
India is also an emerging market for worldwide auto-giants. Due to low cost of Labor
many multinational companies are investing in India. Its automotive industry has Grown

very rapidly from the middle of 1990’s. Recently, there are two big investments expected
to boost the sector further, one is from Maruti and the other is from Honda.
Tata’s proposed investment to manufacture cheap car is also expected to boost the
Industry. India is the second most populated country in the World, and the growth rate of
Indian economy is very high, which indicates the presence of huge demand in different
Industrial sectors. Automobile industry is not the exception in this regard. Indian
Automobile sector has huge demands from its own country.
This demand also attracts the 19 Giant automobile suppliers throughout the world to
come and invest in the Indian Automotive industry. Due to the contribution of many
different factors like sales incentives, Introduction of new models as well as variants
coupled with easy availability of low cost Finance with comfortable repayment options,
demand and sales of automobiles are rising continuously.
Government has also contributed in this growth by liberalizing the norms for foreign
investment and import of technology and that appears to have benefited the Automobile
sector. The production of total vehicles increased from 4.2 million in 1998- 99 to 7.3
million in 2003-04. It is likely that the production of such vehicles will exceed 10 million in
the next few years.
The increase in the exports of automobile sector is also due to the adaptation of
international standards. After a temporary slump during 1998- 99 and 1999-00, such
exports registered robust growth rates in last few years Hence, many players are looking
for an external market for Indian automobiles. The prospect of component industry is
quite positive. The leading local firms have established over 200 technical cooperation
agreements with foreign firms to be able to reach international standards in cost and
manufacturing.
The 2012 global automotive industry is poised for growth while marked by cautious
optimism. Despite the situation in Europe, global automotive production is forecast to hit
record search year through 2017. Global vehicle assembly should increase this year by
up to five million units, driven by NA and BRIC production increases.
Indeed, for the first time in history, All major automotive markets have recovered
from2009 lows, except for Europe emerging market vehicle assembly exceeded

established market assembly and is expected to do so in the future .Looking further out,
vehicle assembly is expected to grow by 40% and reach100 million units around 2017.
Global capacity utilization is also expected to slightly increase to about 85% in the
same time frame. The sector is strongly characterized by globally organized foreign
manufacturers of hardware and software products for industrial automation. This sector
continues to develop extremely quickly
The sector is strongly characterized by globally organized foreign manufacturers of
hardware and software products for industrial automation. This sector continues to
develop extremely quickly through the very widespread presence of these manufacturers
in our country, the relatively many engineering and integrator companies, rapidly rising
demand for newer and more highly performing solutions from our local production
companies and ever shorter PLCs (Product Life Cycles) in this type of high-tech product
for outsourcing this usually non-core activity in production companies
In addition to these foreign players, a series of Belgian university or non-university
companies develop and produce industrial hardware and software for industrial
automation in explicit market niches so that even more tailored solutions can be offered
to ever more demanding users.
Thanks to the international success which they post and partly thanks to the strong
support from the Belgian and regional authorities, these companies can develop their
activity on an accelerated basis into a promising, dynamic industrial activity.
With 11,000 direct employees (18,000 indirect) and a turnover of EUR 2.5 billion in 500
companies the sector is an important player in the Belgian industrial landscape.
The players in the area of industrial automation in Belgium are strongly dominated
by major suppliers such as ABB, Rockwell, Siemens, and Schneider, who in addition to
supplying products and services also offer installations and customer-oriented solutions.
They act as value added sales divisions. Their activities are service oriented but they also
offer added value in the pre-assembling of solutions for Belgian industry.
Producers of industrial automation products are present but there are a few of them
in terms of numbers. They are oriented more towards niche markets and develop
hardware and software for specific solutions such as mechanical engineering, but are
growing steadily and gaining in importance in the Belgian economy.
In addition to suppliers of products we have a large group of “Solution Providers”,

who play an increasingly strong role. They integrate the total solution for the customer
and look for the most optimum technical and economic solution. In addition, there are
consulting and sector consultancies which influence the sector indirectly
The Government of India (GOI) allows the imports of automobile and components,
production machinery, Computerized Numerically Controlled (CNC) machinery tools and
dies without government approvals and on payment of applicable customs duty. The GOI
also allows licensing arrangements and joint venture opportunities in this sector. Foreign
investment up to 100% is allowed in the automotive industry sector.
The Indian automobile industry is a mature industry segment with several MNCs
competing with local companies. The Indian automobile market is set to expand
exponentially in the next 5-10 years, given the strong growth in demand. McKinsey
projected that the Indian middle class will reach 550 million by 2025, from the present
200 million growing middle class with strong purchasing power, signaling a sustained
growth for the automobile sector.
Realizing a strong latent potential, international automobile manufacturers are
finalizing major new investment plans. These include: Ford $500 million, Ashok
Leyland-Nissan $500 million, Nissan-Renault $1 billion, VW (put in U.S. $$), Honda
$250 million, and Tata Motors $240 million.
The results obtained for cooperation confirm the assumption that firms being active
in cooperation’s might be more likely to become gazelles. The report on sectoral
innovation systems in Europe (2008) points out that gazelles may act in clusters and that
collaboration may have an impact on these firms to become gazelles.
Nevertheless, the results show that there are decisive differences when different
innovation cooperation’s are used. Most of the high-growth firms have cooperation
arrangement on innovation activities. Gazelles tend to have more national clients and
customers and are more active in innovation cooperation’s (e.g. Consultants, private red
institutes) in other countries. The distribution of gazelles at the sectoral level (nice-
codes: industries / sectors) sorted by different growth categorizations. Shows relatively
low shares of gazelles for the automotive sector.
As analyzed by mituschetal. (2010) gazelles tend to emerge in growing industries and
earlier phase of business-life-cycles. Gazelles emerging in a declining industry might
realize growth at the expense of job losses in other

firms. Thus, net effects on employment might be small. Although the proportion of
gazelles in the sector manufacture of transport equipment is small. Gazelles in other
sectors are integrated
International players compete with Indian automobile manufacturers in the passenger
cars and commercial vehicle space. Ashok Leyland, Mahindra & Mahindra, and Tata
Motors are the major home grown companies that compete aggressively in the passenger
cars and commercial vehicle segment. Indian automobile components ventures compete
with international leaders such as Delphi, Visteon, and Bosch.
Indian companies have formed joint ventures with leading foreign companies to
manufacture components locally. Global automobile manufacturers including Ford,
General Motors, and Toyota have set up their international purchasing offices in India to
source components for their global operations.
India is the second most populated country in the World, and the growth rate of Indian
economy is very high, which indicates the presence of huge demand in different industrial
sectors. Automobile industry is not the exception in this regard. Indian automobile sector
has huge demands from its own country. This demand also attracts the 19giant
automobile suppliers throughout the world to come and invest in the Indian automotive
industry.
Belgium is often considered the home base of assemblers, manufacturers and
importers of vehicles. Thanks to its “open economy,” almost all foreign car makers are
represented in Belgium. On an annual basis, about one million cars and 90,000
commercial vehicles, buses and coaches are assembled in Belgium.
The country’s assembly industry includes Ford, Opel, Volvo and Audi and employs
60,000 direct employees. This production is valued at $14.1 billion. In addition, more
than 260 automotive suppliers employ 25,000 people. These companies are active in
industrial production, logistics, engineering, R&D, ICT, services, etc.
The Belgian car market has grown at a steady rate in the past 10 years.
According to the Belgian Federal Government there were 5.16 million cars in 2009,
compared to 5.06 million the year before. This is an increase of 1.8%; 2006 saw an
increase of 1.44 percent. Households average two-three cars each and family members
are spending more time in their cars, between commuting and vacationing, amounting to
about one hour per day.

Overwhelmingly, Belgians prefer manual transmissions, which account for more than
90% of cars sold. Belgians also prefers engines that have a lower consumption rate.
Higher fuel efficiency of diesel engines and the lower cost of diesel fuel drive demand
for diesel engines. Diesels now represent more than 60% of all vehicles in Belgium.
The size of cars being purchased is diversifying. Small family cars remain the most
popular type of car in Belgium (24%), followed by station wagons (14.3%), and small
urban cars (10.4%).

ANALYSIS
OF
FOOD & BEVERAGE
INDUSTRY

CH.1 & 2:-INTRODUCTION, FUNCTION AND BUSINESS ACTIVITIES OF
FOOD & BEVERAGES
Belgium has its own special dish. Butter, cream, beer and wine are liberally used in
cooking. The nation is particularly famed for, among other things, its waffles, its
chocolate, its beer and its mussels. Some claim that the frite, or deep-fried potato chip,
was invented in Belgium.
Restaurant bills always include drinks, unless they have been taken at the bar separately.
In the latter case, this is settled over the counter. The majority of cafes have licences to
serve spirits. Beers and wines are freely obtainable everywhere and there are no
licensing hours.
FUNCTIONS OF FOOD AND BEVERAGE SECTOR
• Project and portfolio management. Companies must implement a global project
and portfolio management framework to improve the effectiveness of their innovation
efforts, while also maintaining the flexibility to adapt to local requirements and
regulations.
• Specification management. Companies must maintain full traceability of accurate
and complete product data through the entire product structure— from finished
products down to ingredients and packaging materials.
• Supplier management. Companies must maintain visibility of the supply chain
entities and sourcing approvals as far upstream in the supply chain as needed to
ensure traceability, food safety, and compliance.
• Formulation and bill of materials management. Companies must ensure product
integrity by better managing product formulations and reformulations, with a real-
time understanding of the impact on compliance, nutrition, and other product
characteristics.
• Packaging and labeling management. Companies must develop and revise
product packaging and labels more effectively, improving cross-functional tasks
among technical, marketing, and design teams.

• Compliance and quality management. Companies must proactively ensure
compliance throughout the product lifecycle and fully integrate product quality
and food safety into the process of developing and managing products.
• Data syndication. Companies must be able to seamlessly harmonize product
data across internal systems and synchronize standardized product data with their
trading partners through external data pool.
BUSINESS ACTIVITIES OF FOOD AND BEVERAGE SECTOR
Belgium Top 10 Import Commodities:
Mineral fuels, mineral oils and products of their distillation; bituminous
substances; mineral waxes
: 10003.1p
Other made-up textile articles; sets; worn clothing and worn textile articles; rags : 11591.6
Fish and crustaceans, mollusks and other aquatic invertebrates : 13183.8p
Articles of apparel and clothing accessories, not knitted or crocheted : 13676.6p
Electrical machinery and equipment and parts thereof; sound recorders and
reproducers, television image and sound recorders and reproducers, and parts
and accessories of such articles
: 15243.1p
Organic chemicals : 16400.4p
Iron and steel : 20334p
Pharmaceutical products : 62328
Nuclear reactors, boilers, machinery and mechanical appliances; parts thereof
BELGIUM - RECENT DEVELOPMENT OF THE EXPORTS AND IMPORTS
: 85100.4

GLOBAL EVOLUTION
10 Months 2011 (compared with 2010)
Year Exports Imports Balance % Cover
2010 231.66 211.65 20.02 109.5
2011 250.78 232.05 18.73 108.1
Variation 2011/2010 8.3 % 9.6 % - -
(In USD billions - Average value 10 months 2004 : USD 1 = EUR 0,81458)
BELGIUMS TOP 10 CUSTOMERS
10 Months 2011
Rank – Country EURO
millions
Total %
Germany 40,401.3 19.8
France 34,827.7 17.0
Netherlands 23,886.9 11.7
United Kingdom 17,489.9 8.6
U.S.A 13,515.9 6.6
Italy 10,680.4 5.2
Spain 7,982.7 3.9
G-D Luxembourg 4,014.7 2.0
India 3,574.3 1.7
Sweden 2,759.0 1.4

BELGIUMS TOP 10 SUPPLIERS
Rank – Country EURO millions
Total %
Germany 34,598.7 18.3
Netherlands 31,460.3 16.6
France 23,378.3 12.4
United Kingdom 13,122.3 6.9
Ireland 11,755.2 6.2
U.S.A 10,528.7 5.6
Italy 6,050.4 3.2
Japan 5,663.9 3.0
PR China 5,415.1 2.9
Sweden 4,104.8 2.2

CH.3:- COMPARATIVE POSITION OF FOOD AND BEVERAGE SECTOR
OF BELGIUM WITH INDIA AND GUJARAT
Diplomatic relations between India and Belgium were recognized in 1948 and our
bilateral relations are cordial and friendly. In current times, Belgium has accepted the
growing meaning of Asia and has emphasize the value of support economic relations
with India
Belgium Embassy in society with FIEO and the Belgian-Luxembourg Business
Association (BLBA) with the hold up of Flanders Investment Trade Agency and Wallonia
Export & Investment Agency, controlled a seminar on February 22, 2012 at New Delhi.
Belgium rank fourth in India’s total exports to EU countries and India’s exports to Belgium
showed an increase of 67.49 % at $6.29 billion in 2010-11.
Belgium’s manufacturing industry is varied and well developed. The industry is strong in
areas such as steel, textiles, chemicals, food handing out pharmaceuticals, automobiles,
electronics and machinery. The manufacturing industry in Belgium is primarily concerted
in the heavily occupied Flanders region in the North
Agricultural: The agricultural sector has been abating but is large enough that Belgium
can meet most of its own demand for sugar, eggs, butter and meat. Belgium is also a net
exporter of vegetables and horticultural produce. Other agricultural products that Belgium
produces are cereals, wheat, maize and potatoes.
This incisive report provides expert analysis for Alcoholic Drinks, Beer, Confectionery,
Dairy, Frozen Food, Juices, Milk, Savory Snacks, Soft Drinks, Spirits and wine data on
value, volume and segmentation for Alcoholic Drinks, Beer, Confectionery, Dairy, Frozen
Food, Juices Milk, Savory Snacks ,Soft Drinks, Spirit sand Wine provide textual analysis
of the industry's projection Incorporates in-depth five forces aggressive environment
analysis and scorecards include five-year forecasts for Alcoholic Drinks, Beer,
Confectionery , Dairy, Frozen Food, Juices, Milk, Savory Snacks, Soft Drinks ,Spirit sand
Wine. The Belgian alcoholic drinks market generated total revenues of $11.2 billion in
2009, representing a compound annual rate of change (CARC) of -0.8% for the period
spanning 2005-2009

FOOD & DRINKS
There are over 800 kinds of beers made in Belgium. Belgians consume in average 150
liters of beer per person per year. The world's first beer academy opened in Herk-de-
Stad, in the Belgian province of Limburg, in 1999.Jean Neuhaus invented the pralines
chocolate in Brussels in 1912.
Belgium produces 220,000 tonnes of chocolate per year. This amounts to 22 kg of
chocolate per inhabitant annually, i.e. 61 grammes per day in average.
The world's biggest chocolate selling point is Brussels National Airport
TRADE & INDUSTRY
According to the WTO's International Trade Statistics for 2003, Belgium is the world's first
exporter of chocolate in 2000 & medicaments & the world's forth exporter of other
pharmaceuticals, sugar confectionery in 2001-2002, third in 1999, non-alcoholic
beverages, eggs & cereals flour/starch, among others. Beer is the most popular drink in
the country, and one can find a whole variety of beer in Belgium. Belgium is the first
foreign investors in some developing countries, like Bulgaria.
OVERVIEW OF THE INDIAN AGRICULTURE AND FOOD PROCESSING SECTORS
AGRICULTURE
Agriculture is a segment of the Indian economy. In the 1950s, the contribution of
agriculture to the overall GDP was in the range of 51 per cent. However, growing
emphasis on the industry and service sectors and changes in the Indian economy has
resulted in a drop in the proportion of the agriculture sector. Today, agriculture
contributes around 18 per cent to the GDP and accounts for about 15 per cent of the total
exports. Nearly 58% of the population at a halt depends on agriculture for a livelihood.
India is geographic area of 329 million hectares, the cultivable land in India is about 167
million hectares. India’s favourable climatic conditions and rich natural resources have
helped India become the world’s largest producer of a range of commodities such as
coconut, banana, mango, pulses, cashew nuts, ginger, turmeric and black pepper.
Improved infrastructural facilities like refrigerated transportation, cold storage and
packaging and new technology like IT and biotechnology, has helped the agricultural
sector to develop more significantly in the recent years.

In terms of global farm output, India ranks second and is the second largest producer of
rice, sugar, wheat, cotton, fruits and vegetables in the world. In 2007–08, the production
of food grains in India grew by 6.2 per cent to reach 230.7 million tonnes
INDIAN FOOD PROCESSING SECTOR
Major products of the food processing sector include:
processed fruits and vegetables
meat and poultry
milk and milk products
marine products
plantation crops
processed grain
bakery products
alcoholic beverages
high protein foods
FRUITS AND VEGETABLES
The total cultivated area of fruits and vegetables is about 12 million hectares (7 per cent
of the total cultivation area) and the country produced about 206 million tonnes in 2006–
07, accounting for about 10 per cent of the global production of fruits and 15 per cent of
the global production of vegetables. The country witnessed an increase of 22.7 per cent
over 2005–06, which was around 167.9 million tonnes
Meat and Poultry
Meat
India is the 7th largest producer of meat in the world and of the total world meat
production of 285 million tonnes; India contributes to about 2.1 per cent. In 2006–07, the
production of meat in India stood at 6.1 million tonnes.
POULTRY MEAT
India is the ninth largest producer of poultry meat in the world.
This sector has undergone a major change since the 1960s, from being a backyard
occupation to an activity of great commercial significance. In 2006–07, poultry meat
production stood at 2.1 million tones.

DAIRY PRODUCTS
Dairy is one of the main contributors to the Indian food processing industry. In 2006–07,
the total market size of the dairy industry was valued at US$44 billion and is expected to
reach US$91 billion by 2015.
CHEESE
In 2007–08, the cheese market was estimated at US$244 million.the Indian cheese
market was estimated at 54 000 tonnes. The consumption of cheese is comparatively
low, as cheese in India is a luxury, while in developed countries they are a part of the
daily meal. Mumbai with a market share of 30 per cent is the largest market for cheese in
India
ICE-CREAM
The market for ice -creams was estimated at US$265 million in 2006–07, growing at the
rate of 12–14 percent the Major players such as Amul, Hindustan Unilever and Mother
Dairy, have a significant presence in the country.
CONFECTIONERY
The confectionery market largely consists of chocolates, hard -boiled sugar
confectionery, toffees, gums, mints and lozenges, lollipops, fruit rolls, etc. In 2006–07, the
Indian confectionery market was estimated at US$0.6 billion, an increase of 12.8 per cent
over the previous year.
CHOCOLATE
The organised chocolate market in India was estimated at US$0.3 billion in 2006–07 and
in terms of volume it was estimated at 35 700 tonnes for the same year. The per capita
consumption of chocolates in the country is 300 g as against 1.9 kg in developed
countries. this market is growing at about 15 per cent per annum.
BAKERY PRODUCTS
The bakery products sector is one of the largest segments among the processed food
markets in India. In 2006–07, the annual turnover of bakery products, which includes
bread, biscuits, cakes, pastries, buns, rusk, etc. was estimated at US$0.9 billion.
BISCUITS

the biscuit market was estimated at 1.7 million tonnes in 2007 Biscuits, production trends
2005–08 (million tonne) Biscuits are broadly categorised as glucose, milk based, marie,
arrow root and other variants such as cream, wafer cream, salt crackers, cookies,
assorted, etc. This growth is mainly on account of exemption from Central Excise Duty on
biscuits with MRP up to US$2.5 per kg.
PCKAGED/CONVENIENCE FOODS
The packaged/convenience foods sector had rapidly developed over the last decade
mainly due to increase in educated nuclear families with disposable incomes, change in
lifestyles and food habits and more working women preferring convenience foods. The
packaged/convenience food segment comprising of ready-to-eat and ready-to -cook food
products is highly fragmented with small players accounting for almost 75 per cent of the
output in terms of volume and 50 per cent in terms of value.
JAMS AND TOMATO BASED PRODUCTS (SAUCES/KETCHUPS)
The fruit jam market was estimated at 26 700 tonnes by volume. The penetration of fruit
jams in India is very low at 3 per cent, with urban penetration in the country being 9 per
cent and rural penetration being 0.3 per cent. Kissan from Hindustan Unilever and Sil
from Marico are the most popular brands in the country.
FRUIT JUICE/DRINKS
The organised fruit beverage market which includes nectars, drinks and juices is among
the fastest growing segments in the beverages category and was valued at US$0.3 billion
in 2006–07, growing at annual rate of 25 per cent. While the fruit drink sector dominates
the market with a 77 per cent market share, the fruit juice and nectar sector accounts for
23 per cent of the market.

CH.4:- PRESENT POSITION AND TREND OF BUSINESS IMPORT –
EXPORT SUMMARY OF FOOD & BREWAGES IN BELGIUM
Trade in local currencies to boost intra-BRICS trade: FIEO Chief
Mr M. Rafeeque Ahmed, President, FIEO, welcomed the agreement amongst BRICS
members to promote trade in local currencies which will reduce dollar and euro part of an
empire and insulate exporters from sharp fluctuations in currencies. The FIEO Chief said
the move will increase intra-BRICS trade which is at present below potential. Intra-BRICS
exports are at around 9% while intra-BRIC Imports get up at 12%. India’s trade with
BRICS was$87 billion in 2010-11, showing 45% growth, with export surmounting to $29.5
billion while import surmounting to $57.5 billion. The move may also address the issue of
widening trade deficit amongst some of the BRICS partners, said Mr Ahmed, as trade in
local currencies will encourage imports from such countries to those countries having
approving trade balance. Wine
Wine consumption is growing (10% from 2003 to 2008), fuelled by media coverage of its
alleged health benefits and discounters and private label making it more affordable. The
top
five sellers in the market, with 25% share of still wine between them in 2007, are all
private
labels (from Delhaize, Aldi, Colryuyt, Lidl and Carrefour). Boxed wines are growing with
20% of Delhaize’s sales coming from them.Continued market growth is predicted by
Euromonitor at 1.5% CAGR volume and 0.8% in value. Still wine accounts for 85% of
total volume, with red white wine amounting to 53% (down from 57% in 2003), white 32%
and rosé 15%. 75% of volume (47% of value) goes throughoff-trade, exactly the same
proportions as five years ago.
BEHIND THE BRANDS
Food justice and the ‘Big 10’ food and beverage companies

Companies continue the journey toward better social responsibility and sustainability
In recent years, companies have made a number of important commitments to address
their social responsibility and sustainability. Among the most notable, PepsiCo has
publicly recognized the human right to water and Coca-Cola has pledged to become
water neutral by 2020 through its Live Positively Program.94 In 2010 Associated British
Foods (ABF) introduced a policy to source all palm oil from sustainable sources by 2015
(via the Roundtable on Sustainable Palm Oil)95 and for the first time published an
assessment of its corporate responsibility.96
In addition, some of ABF’s largest subsidiaries, including Twinings Ovaltine, have
committed in their code of conduct to pay farm workers a living wage, or enough to meet
their basic needs.97 In 2012 Unilever committed to engaging with at least 500,000 small-
holder farmers in its supply network, to ‘improve their agricultural practices and thus
enable them to become more competitive’.98 In 2009, Mars was the first in the industry to
commit to sourcing 100 percent of its cocoa from certified sources by 2020 and Nestle
launched its own strategy to engage in ‘areas with the greatest potential for joint value
optimization between our business and society’.99 In 2012, General Mills agreed to align
its reporting with
Now, Oxfam’s Behind the Brands campaign evaluates where companies stand on
policy in comparison with their peers and challenges them to begin a ‘race to the top’ to
improve their social and environmental performance. By targeting specific areas for
improvement along the supply chain, the campaign pinpoints policy weaknesses and will
work with others to shine a spotlight on the practices of these companies.

Behind the Brands is a part of the GROW campaign. Oxfam’s GROW campaign aims to
build a better food system: one that sustainably feeds a growing population (estimated to
reach nine billion people in 2050) and empowers poor people to earn a living, feed their
families and thrive.
Oxfam’s campaign focuses on 10of the world’s most powerful food and beverage
companies – Associated British Foods (ABF), Coca-Cola, Danone, General Mills, Kellogg, Mars, Mondelez Internatonal (previously Kraft Foods), Nestlé, PepsiCo and
Unilever – and aims to increase the transparency and accountability of the ‘Big 10’
throughout the food supply chain.
At its core, the campaign features the Behind the Brands scorecard. The scorecard
examines company policies in seven areas critical to sustainable agricultural production,
yet historically neglected by the food and beverage industry: women, small-scale farmers, farm workers, water, land, climate change, and transparency.
According to the scorecard rankings, Nestlé and Unilever are currently performing better
than the other companies, having developed and published more policies aimed at
tackling social and environmental risks within their supply chains. At the other end of the
spectrum, ABF and Kellogg have few policies addressing the impact of their operations
on producers and communities.
Yet the scorecard also clearly shows that all of the Big 10 – including those which score
the highest – have neglected to use their enormous power to help create a more just food
system. In fact, in some cases these companies undermine food security and economic
opportunity for the poorest people in the world, making hungry people even hungrier.
Behind the Brands reveals that the social responsibility and sustainability programs which
companies have implemented to date are typically tightly focused projects to reduce
water use or to train women farmers, for example. But these programs fail to address the
root causes of hunger and poverty because companies lack adequate policies to guide
their own supply chain operations.
Important policy gaps include:
• Companies are overly secretive about their agricultural supply chains, making claims of
‘sustainability’ and ‘social responsibility’ difficult to verify;
• None of the Big 10 have adequate policies to protect local communities from land and
water grabs along their supply chains;
• Companies are not taking sufficient steps to curb massive agricultural greenhouse gas
emissions responsible for climate changes now affecting farmers;

• Most companies do not provide small-scale farmers with equal access to their supply
chains and no company has made a commitment to ensure that small-scale producers
are paid a fair price;
• Only a minority of the Big 10 are doing anything at all to address the exploitation of
women s
India is the world’s second largest producer of food next to China, and has the potential
ofbeing the biggest with the food and agricultural sector. The food processing industry is
oneof the largest industries in India-it is ranked fifth in terms of production,
consumption,export and expected growth. The food industry is on a high as Indians
continue to have afeast. Fuelled by what can be termed as a perfect ingredient for any
industry - largedisposable incomes - the food sector has been witnessing a marked
change in consumptionpatterns, especially in terms of food.Increasing incomes are
always accompanied by a change in the food basket. Theproportionate expenditure on
cereals, pulses, edible oil, sugar, salt and spices declines ashouseholds climb the
expenditure classes in urban India while the opposite happens in thecase of milk and milk
products, meat, egg and fish, fruits and beverages.For instance, the proportionate
expenditure on staples (cereals, grams, pulses) declined from45 per cent to 44 per cent
in rural India while the figure settled at 32 per cent of the totalexpenditure on food in
urban India.A large part of this shift in consumption is driven by the processed food
market, whichaccounts for 32 per cent of the total food market. It accounts for US$ 29.4
billion, in a total estimated market of US$ 91.66 billion. The Confederation of Indian
Industry (CII) has estimated that the food processing sector has the potential of attracting
US$ 33 billion of investment in 10 years and generate employment of 9 million person-
days. The Government has formulated and implemented several Plan Schemes to
provide financial assistance for setting up and modernizing food processing units,
creation of infrastructure, support for research and development and human resource
development in addition to other promotional measures to encourage the growth of the
processed food sector .Food processing is a large sector that covers activities such as
agriculture, horticulture, plantation, animal husbandry and fisheries. It also includes other
industries that use agriculture inputs for manufacturing of edible products. The Ministry of
Food Processing,
Government of India indicates the following segments within the Food Processing
industry:
• Dairy, fruits & vegetable processing
• Grain processing

• Meat & poultry processing
• Fisheries
• Consumer foods including packaged foods, beverages and packaged drinking water.
Though the industry is large in size, it is still at a nascent stage in terms of development
of the country's total agriculture and food produce, only 2 per cent is processed.
Corporate Catalyst India A report on Indian Food Processing Industry The industry size
has been estimated at US$ 70 billion by the Ministry of Food Processing, Government of
India. The food processing industry contributed 6.3 per cent to India’s GDP in 2003 and
had a share of 6 per cent in total industrial production. The industry employs 1.6million
workers directly. The industry is estimated to be growing at 9-12 per cent during the
period 2002 to 2007.Value addition of food products is expected to increase from the
current 8 per cent to 35 percent by the end of 2025. Fruit & vegetable processing, which
is currently around 2 per centof total production will increase to 10 per cent by 2010 and
to 25 per cent by 2025.The highest share of processed food is in the dairy sector, where
37 per cent of the total produce is processed, of this only 15 per cent is processed by the
organized sector. The food processing industry in the country is on track to ensure
profitability in the coming decades. The sector is expected to attract phenomenal
investments of about Rs 1,400 billion in the next decade.

CH.5:- POLICIES AND NORMS OF BELGIUM FOR IMPORT / EXPORT
INCLUDING LICENSING / PERMISSION, TAXATION
POLICIES AND NORMS OF BELGIUM
The agreements signed and in force between India and Belgium are as under:
Social Security Agreement in November 2006 (came into force in September 2009);
Agreement on cooperation in the field of Science & Technology, November 2006;
Agreement on Avoidance of Double Taxation (DTAA) August 1997; Bilateral Investment
Protection Agreement (BIPA) signed between India and BLEU in November 1997;
Cultural Agreement- September, 1973; and Air Services Agreement- April, 1967
There is three regions of Flanders, Wallonia and Brussels-Capital are principally
responsible for energy efficiency, renewable energy sources, energy R&D and the
distribution and supply of electricity and gas.
FOOD SAFETY AUTHORITY (EFSA)
The European Food Safety Authority is providing independent scientific advice on food
and feed safety. The CIAA is an active member of European Food Safety Authority
Stakeholder Consultative Platform and Emerging Risk Stakeholder Group. the CIAA has
contributed to various conferences, including an event entitled ‘Can science and
innovation deliver a more sustainable food chain’ and the organisation continues to
contribute to input into EFSA’s work on food related issues.
FUTURE EU TRADE POLICY
In November 2010, the European Commission adopted its Communication ‘Trade,
growth and world affairs: Trade policy as a core component of the EU 2020 Strategy’
which builds upon the ‘Global Europe’ strategy and sets priorities for European trade
policy for 2010 to 2015.
Trade Group Member
Belgium is a member of the following organizations and EU Unions: World Trade
Organization,(WTO)
Belgium Luxemburg Economic Union, (BLEU)

Belgium, Netherlands, Luxemburg Economic Union,(BENELUX)
Customs Union with Turkey, Andorra and San Marino
European Union (EU)
European Monetary Union,(EMU)
LICENSES FOR IMPORT AND EXPORT
An Import License is required to be provided when the goods are presented for import
clearance. the designated agency the European Union licenses, national licenses, and
surveillance forms based on the type of commodities imported .
QUOTAS
Bilateral agreement quotas or "quantitative limits of import" have been assigned to
specific countries for specific products to allow the controlled importation of specific
products.
DANGEROUS GOODS CERTIFICATION
Some goods may require DG certification. Examples of some commodities that may
require dangerous goods certification are perfumes, liquor, chemicals, etc.
PREFERENTIAL CERTIFICATE OF ORIGIN DOCUMENTS
Belgium is a participating member in many trade groups and has some bilateral and
multilateral preferential agreements, which offer duty rates for qualifying goods imported
directly from nations, which are granted these preferences
IMPORT DUTIES
All merchandise coming into Belgium must clear Customs and is subject to customs duty
assessment unless the goods are duty or tax exempt by law. Customs duties are,
generally a percentage, which is applied to the transaction value (euro) of the imported
goods based on the cost of the goods, insurance, and freight charges a specific rate of
duty (so much per piece, liter, kilo, etc.) and others at a compound

EXCISE DUTIES
Excise taxes are accessed against certain commodities, which are normally identified as
"luxury" goods. The excise tax is normally assessed against tobacco products, perfumes
and alcohol products but can also be accessed against other goods as deemed by
Belgium regulations.
WATCH DUTY RATE
Watches imported into Belgium are subject to classification and duty assessment based
on a per item basis. The actual duty and the final rate of duty are determined based on
the classification of the watch at the time of entry processing with customs.
BELGIUM IMPORT PROHIBITIONS
The importation of certain classes of merchandise may be prohibited or restricted to
protect the economy and security of Belgium and other EU member states, to safeguard
consumer health, well-being, and to preserve domestic plant and animal life. Some
commodities are also subject to an import quota or a restraint under bilateral trade
agreements and arrangements.
These requirements apply to all importation types, including shipments made by mail.
The exporter should make certain that the Belgium importer has provided proper
information to
(1) Permit the submission of necessary information concerning packing, labeling, etc.
(2) ensure that necessary arrangements have been made by the importer for entry of the
merchandise into Belgium.
BELGIUM EXPORT PROHIBITIONS
Export controls form of export licensing and permit requirements for controlled
commodities. Export controls may be product specific, technology specific or country
specific.
The following is a listing of commodities prohibited or restricted for export from Belgium
Goods subject to the Dual-Use and Related Goods, (Military equipment) (Export Control)
Regulations 1995 (DUEC)
Certain cultural goods, antiques and works of art

•Counterfeit coins and bank notes
•Goods bearing false origin statement
•Counterfeit or pirated goods
•All CITES goods
•Wild animals Weapons
•Explosives
•Some agriculture products
•Some medicines & drugs Euratom goods
•Precursors, CFC's
•Some Phytosanitary goods
•Waste products
•Meat, cheese, milk products
•Some drugs
TAXATION OF BELGIUM
Value-added tax (VAT) is due on any supply of goods or services made in Belgium,
where it is a taxable supply made by a taxable person in the course of a business carried
on by said person.The standard VAT rate is 21 percent., social housing reduced to 6
percent
margarine pay television and as from 1 August 2005 services rendered by operators
providing access to radio and television programs by means of a decoding device
installed at the customers’ premises.
.meals as from 1 January 2010 (beverages: 21 percent). There is a reduced rate of 6
percent for certain goods and services social housing
1 food and drinks
2 books

3 drugs and medicine
4 admission to cultural, sporting, and entertainment events
5 hotel and camping accommodation
6 Funeral services. Services of composers and authors
7 distribution of water Agricultural services People Transport
THE LIST OF GOODS SUBJECT TO A ZERO-RATE INCLUDES
Newspapers and periodicals
Waste products (metal scrap).
The list of exemptions with right to deduct input VAT includes amongst others
•export of goods
•intra-Community supply of goods
•supplies with respect to aircrafts and sea-going vessels; and
•Supplies to embassies, consulates, and international institutions.
The list of exemptions without right to deduct input VAT includes amongst others
•financial services
•letting of immovable property
•hospital services
•medical care
•educational services
If your business makes taxable supplies or provides services within the scope of VAT in
Belgium you will be required to register and in principle account for Belgian VAT. No VAT
registration threshold exists in Belgium.

All group members are jointly and severally liable for the debts of the other VAT group
members for the time of their membership and a group member must remain in the VAT
group for a minimum of three years. However, if the group conditions are no longer met,
a premature exit is possible or mandatory.
VAT grouping is not applicable on cross-border transactions.
Most registered businesses are required to submit VAT returns on a monthly basis. if
your annual turnover is less than EUR1,000,000, you may opt to submit quarterly VAT
returns. When filing quarterly VAT returns, your business has to make advance payments
at the latest on the 20th of each second and third month of the quarter.
Businesses in the following sectors need to submit a monthly VAT return when the
taxable annual turnover exceeds the hold of EUR200,000
•mineral oils
•mobile phones, computers, peripheral equipment, and accessories; and
•motorized vehicles subjected to the regulation regarding registration.
On 1 January 2010 a new hold was added. VAT taxable persons are also obliged to file
monthly VAT returns when they exceed the limit of EUR 400,000 for intra-Community
supplies of goods on a yearly basis. Monthly VAT returns have to be filed following the
quarter where in the hold of EUR 400,000 is reached.
An annual listing must be completed each year (at the latest on 31 March) showing the
supplies for an amount of more than EUR250 exclusive of VAT to customers registered
for VAT in Belgium. Failure to submit the listing may result in a penalty of up to
EUR2,500. Penalties for any mistakes in the listing are between EUR25 and EUR1,250
If you sell goods to a customer who is registered for VAT in another EU Member State
and the sale involves the removal of those goods from Belgium (either by you or your
customer) to that Member State, then you do not need to charge VAT and you may
exempt the supply as an intra-Community dispatch. You must obtain your customer’s
VAT number and quote it together with the reference “Exempt from Belgian VAT - article
39bis of the Belgian VAT Code” on your invoice. You should also obtain evidence of the
goods’ removal from Belgium.
If you sell goods to a customer who is not registered for VAT in another EU Member
State, you will have to charge Belgian VAT. If your sales exceed a certain threshold for

that Member State you may have to register in the Member State under what is known as
the Distance Selling Scheme.

Topic-6
Policies and Norms of India in Import / Export to the Belgium
Import Procedure :
Export Procedure :

CH.7:- PRESENT TRADE BARRIERS FOR IMPORT/EXPORT GOODS
There are several types of tariffs and barriers that a government can employ:
Specific tariffs
Ad valorem tariffs
Licenses
Import quotas
Voluntary export restraints
Local content requirement
Legal and Illegal Trade Barriers
Illegal - it violates international agreements and rules; or
Legal - it does not violate rules and agreements
Customs duties
Customs procedures:
Technical regulations & standard
The total all food and drink market* in Belgium and Luxembourg was worth Euro 29.4
billion in 2011, made up of Euro 29.4 billion in retail (100.0%) and Euro 0.0 billion (0.0%)
in foodservice.
Since the 1930s, many developed countries have reduced tariffs and trade barriers,
which has improved global integration and brought about globalization.
Free trade benefits consumers through increased choice and reduced prices, but
because the global economy brings with it uncertainty, many governments impose tariffs
and other trade barriers to protect industry.

CH.8:- POTENTIAL FOR IMPORT/EXPORT IN INDIA
Economic liberalization and rising income of middle class population have had a positive
impact on consumer spending and consumption in both rural and urban areas. Indian
consumer now spends a significant proportion of disposable income on food and other
essential commodities.
The Indian fast food market is growing at an annual rate of 25-30 per cent, according to a
report published by market research firm RNCOS in September 2010, titled ‘Indian Fast
Food Market Analysis’.
Our new research report “Indian Food and Drinks Market: Emerging Opportunities” has
projected that the Indian food, beverages and tobacco market will grow at a CAGR of
around 7.5% during 2009-2013 to around US$ 330 Billion by 2013. All the segments
registered uptrend in terms of consumption and sales between 2005 and 2009, but the
alcoholic segment outperformed other segments.
Food Processing Sector In India - August 2012
The proportionate expenditure on staples (cereal, grams, pulses) decline from 45 per
cent to 44 per cent in the rural India while the figure settled at 32 per cent of the total
expenditure on food in urban India.
A large part of this shift in consumption is driven by the processed food market, which
accounts fro 32 per cent of the total food market. It accounts for US$ 29.4 billion, in total
estimated market of US$ 91.66 billion.
Business Opportunities Food And Drinks Sector 2012
The Indian food services industry is expected to grow at a compound annual growth rate
(CAGR) of around 12 per cent during 2012-2015, according to a RNCOS research report,
'Indian Food Services Market Forecast to 2015'.
According to another report, the industry is estimated to be nearly worth US$ 13.56 billion
and is growing at a healthy CAGR of 17 per cent. The food services sector in India is
expected to reach US$ 24.77 billion by 2015, according to a Franchise India report
released at the Indian Restaurant Congress.

As per RNCOS research report titled, ‘Indian Organic Food Market Analysis’. The report
further expects that the sector will post significant growth during 2011-2013, growing at a
CAGR of 15 per cent.
Food Industry Sector Report - December 2010
Report published by market research firm RNCOS in April 2010, titled ‘Indian Food and
Drinks Market: Emerging Opportunities’ the Indian food and beverages market is
expanding rapidly and is projected to grow at a compound annual growth rate (CAGR) of
about 7.5 per cent during 2009-13 and would touch US$ 330 billion by 2013.
The food retail industry, currently at US$ 70 billion is predicted to grow more than double
to US$ 150 billion by 2025.

CH.9:- BUSINESS OPPORTUNITIES IN FUTURE
Highlights
The Belgian alcoholic drinks market generated total revenues of $11.2 billion in
2009, representing a compound annual rate of change (CARC) of -0.8% for the
period spanning 2005-2009.
The Belgian beer market generated total revenues of $5.6 billion in 2009,
representing a compound annual rate of change (CARC) of -2.6% for the period
spanning 2005-2009.
The Belgian confectionery market generated total revenues of $1.6 billion in 2009,
representing a compound annual growth rate (CAGR) of 5.5% for the period
spanning 2005-2009.
The Belgian dairy market generated total revenues of $5.6 billion in 2009,
representing a compound annual growth rate (CAGR) of 1.6% for the period
spanning 2005-2009.
The Belgian frozen food market generated total revenues of $1.6 billion in 2009,
this representing a compound annual growth rate (CAGR) of 3.4% for the period
spanning 2005-2009.
The Belgian juices market generated total revenues of $607.3 million in 2009,
representing a compound annual growth rate (CAGR) of 1.9% for the period
spanning 2005-2009.
The Belgian milk market generated total revenues of $2.8 billion in 2009,
representing a compound annual growth rate (CAGR) of 1.9% for the period
spanning 2005-2009.
The Belgian savory snacks market generated total revenues of $364.6 million in
2009, representing a compound annual growth rate (CAGR) of 2.5% for the period
spanning 2005-2009.

The Belgian soft drinks market generated total revenues of $4.9 billion in 2009,
representing a compound annual growth rate (CAGR) of 2.9% for the period
spanning 2005-2009.
The Belgian spirits market generated total revenues of $1,140.4 million in 2009,
representing a compound annual rate of change (CARC) of -0.3% for the period
spanning 2005-2009.
The Belgian wine market generated total revenues of $4.2 billion in 2009,
representing a compound annual growth rate (CAGR) of 0.6% for the period
spanning 2005-2009.
The Department of Foreign Affairs and International Trade (DFAIT) highlights the following opportunities in the Belgium market for exporters: health and
organic foods, energy foods and sport drinks, snacks, ethnic foods, ready-made
and microwaveable products, frozen and fresh fruit and vegetables, dried fruits
and nuts, wine, specialty meat and non-meat products, and seafood.
Belgium's significant food processing industry also creates demand for
international bulk and intermediate goods for distribution both within Belgium and
the EU.
The fish market in Belgium has seen the greatest growth in the past decade, and
there is growing demand for frozen fish and crustaceans as there is already high
consumption of mussels and oysters. Fish farming is still beginning to be adapted
in the EU, and due to ecological issues and quotas, growing demand for fish and
seafood may need to be sourced from imports.
Belgians are expressing boredom with their traditional foodservice and retail
offerings, and possess a tradition of gastronomy, cultural diversity, and willingness
to try new foods, which makes Belgium a popular test market for food products,
and ideal for Canadian exporters.

CH.10:- CONCLUSION
As the demand of foods there are more opportunity in the Belgium market for
exporters in to following areas health and organic foods, energy foods and sport
drinks, snacks, ethnic foods, ready-made and microwaveable products, frozen and
fresh fruit and vegetables, dried fruits and nuts, wine, specialty meat and non-meat
products, and seafood.
Fish market is also more demanding in Belgium market so there is good
opportunity is there in that business in Belgium.
The Belgium: Food and Beverages Industry Guide is an essential resource for top-
level data and analysis covering the Belgium Food and Beverages industry.
This incisive report provides expert analysis with distinct chapters for Alcoholic
Drinks, Beer, Confectionery, Dairy, Frozen Food, Juices, Milk, Savory Snacks,
Soft Drinks, Spirits and Wine.
Belgium's significant food processing industry creates demand for international
bulk and intermediate goods for distribution both within Belgium and the EU.
The fish market in Belgium has seen the greatest growth in the past decade, and
there is growing demand for frozen fish and crustaceans as there is already high
consumption of mussels and oysters.

ANALYSIS OF CHEMICAL INDUSTRY

CH.1:- INTRODUCTION, ROLE AND STRUCTURE OF CHEMICAL
COMPANY OF MCCOY SOUDAL
INTRODUCTION
Mccoysoudalis a 50:50 joint venture company between the McCoy Group of India and
The Soudal Group of Belgium. It is one of the largest manufacturers of Sealants,
Adhesives and Polyurethane (PU) Foams in the World. Now with 11 manufacturing
plants, operations spread in more than 35 countries and product availability in more than
120 countries, we are the larges and one of the oldest companies globally in our field.
Overview of products:
▪ McCoy Soudal Sealants Adhesives & PU Foams
McCoy Soudal is a joint venture company between the McCoy group of India and Soudal
group of Belgium. It is one of the largest manufacturers of Sealants, Adhesives and
Polyurethane (PU) Foams in the world, with seven manufacturing plants and operations
spread in more than 30 countries and product availability in more than 120 countries.
Key Markets:
Textile, Cosmetics, Pharmaceuticals, Paper, Paints, Rubber, Construction, Retail.
Role of Company:
The Belgian chemicals industry is one of the most diversified and integrated chemicals
clusters in the world. The Belgian cluster (especially in Antwerp Port) is the biggest in the
world after Houston. 11 of the top-15 global chemicals groups have production facilities In
Belgium. The share of the chemical industry in the total Belgian economy is twice the size
of the average in the European Union and even bigger than in the traditional chemicals
country Germany.
►To offer the chemical sector additional support, the federal government together with
Essenscia (the Belgian federation of the chemicals industry and life sciences) have
established a High Level Group (HLG) for the chemicals sector. This HLG works in five
thematic working groups, i.e. innovation, energy, logistics, taxation and the labour

market. Based on practical topics the working groups look for solutions to reinforce the
investment climate and the sector’s competitive capacity.
STRUCTURE
▪hrowing lights on the JV between McCoy Silicones Ltd and Soudal NV Belgium which
took place in April 2010, he added that the ambition of McCoy group is to have its own
identity and the desire of Soudal group to expand their respective positions in the vibrant
and growing Indian marketplace, brings the two companies together on one platform.
▪ Soudal plans to leverage McCoy's leadership status, established network and marketing
expertise in the Indian marketplace and McCoy by integrating Soudal's 44 years of
experience in Sealants, Adhesives & Foams, R&D developments & global manufacturing
base, believes to offer the largest range of sealants, adhesives & foams in the Indian
subcontinent.
▪It serves professionals in construction, retail channels and industrial assembly and has
45 years of experience with endusers in over 100 countries. With 11 manufacturing sites
in 4 continents and 35 subsidiaries worldwide, Soudal ensures optimal technical and
logistical support.

CH.3:- COMPARATIVE POSITION OF CHEMICAL INDUSTRY WITH IN
BELGIUM, INDIA &GUJARATCHEMICAL INDUSTRY IN BELGIUM
Belgium represented a turnover of 45 billion euros in 2009 and added value of more than
10 billion euros. This represents one quarter of industrial activity in Belgium. The sector
employs 91,500 people.
Employment in the chemicals industry has stayed stable during the past twenty years.
The number of jobs in industry overall fell in the same period, with the logical
consequence that the chemicals industry’s share rose: from 13.6% in 1990 to 17.4% in
2009. Furthermore, 1 direct job in chemicals generates 1.6 indirect jobs in other sectors.
The chemicals industry is therefore one of the most important sectors in Belgium.
Top 15 World Chemical Companies 12 with Production in Belgium
Antwerp (Belgium) Europe’s Largest Chemical Cluster
Representing the biggest chemical cluster in Europe, Antwerp is home to the most
important chemical companies in the world. BASF, Bayer, BP, DuPont, Evonik, Ineos,
Kaneka, Monsanto, Nippon Shokubai, Solvay, Total have major operations in Antwerp.
Process integration and diversity result in an enormous network where all chemical
products are present in a complete value chain, unique in the world. This network turns
Antwerp into a dominant player for a wide range of key chemicals and plastics.
Chemical Industry is one of the most significant sectors for the Indian economy.

STRENGTHSOFGUJARAT
Port:Highestnumberofportsin the country
Cargo handled at Kandla, a majorport41.5MMT(12%ofIndia)
Chemical port terminal (3 MMT)-only one in India
LNG terminal sat Dahej (5 Mn TPA)& Hazira (5 MnTPA)
Rail: Broad Gauge Rail network across the state
Airport:11 Airports with an international airport at Ahmedabad
Power: A power sufficient state with highest per capita power consumption in the
country
Others: Pioneering work in Water ,Urban Development, Industrial Parks

CH.4:- POSITION & TREND OF CHEMICAL INDUSTRY IN BELGIUM
Being centrally located in the European continent, Belgium’s trade is the hallmark of all its
activities. Belgium’s trade is further helped by its well-developed transportation network,
diversified commercial and industrial base.
However, as Belgium must import a substantial amount of raw material to flourish, the
nation relies heavily on imports and thus is exposed to global market volatility. Thus, the
year 2008-09 proved challenging for the country. The GDP dipped from $394.9 billion in
2008 to $381.4 billion in 2009
Belgium Trade, Exports and Imports
As raw materials and natural resources are not sufficient, the balance of trade is usually
towards imports and thus there is always some trade deficit in Belgium.
The chemical industry is the second largest manufacturing sector in Belgium. The
chemical industry represents 1/5 of the total turnover in Belgium and 20% of the total
export in Belgium.
According to the 2009 estimates, Belgium had an export volume of $296.1 billion and
ranked 13th in the world. This, however, showed a tremendous drop from the 2008
figures, which shone bright at $371.5 billion. The various export commodities include:
Machinery and equipment
Chemicals
Finished diamonds
Metals and metal products
Foodstuffs
The following countries are the biggest export partners of Belgium:
Germany, France, Netherlands, , UK, US, Italy.
Trade Ties
▪India’s industry minister Kamal Nath noted that India and Belgium are keen on
strengthening bilateral relations by diversifying and boosting trade between the two

countries.
In his address at the Luncheon Session on “India and Belgium Partners in a Globalised
World” with His Majesty Albert II, the Minister said the bilateral trade between the two
countries during 2007-08 was US$8.6 billion that represented a growth of 13 percent over
the 2006-07 trade which stood at US$7.6 billion.
▪Since the formation of World Trade Organization, structural changes have happened in
chemicals trade. There has been reduction in tariff for chemical imports in developed
countries.
▪However, non-tariff barriers associated with environmental issues are influencing the
chemical imports by developed countries. India has been increasing its export of
chemical products in the recent years.
CHEMICALS AND PETROCHEMICALS: Project Opportunities in Gujarat

CH.5:- POLICIES AND NORMS OF MCCOY SOUDAL GROUP OF INDIA
AND MCCOY SOUDAL GROUP OF BELGIUM
the United States in all aspect of the ruling
including:
► gaming,
► Duty
►business issues,
►physical condition care, child wellbeing
►funding writing and fulfillment, and
► Discussions with state and restricted government
MCCOY PLAN: Key points of the McCoy Plan:
5 year business strategy for all government departments and agencies
Low cost budgeting; accrual accounting
organization and directorial costs cut in half
explanation of the tax burden on people and companies
co-ordinate service delivery throughout Alberta
new training, skills development and educational opportunities for people across
Alberta
Support for local communities so that they can do things their way.
ENVIORNMENT POLICY:
►The mission of the Center for ecological Policy and Behavior (CEPB) is scientific
analysis of the interactions among policy institutions, human behavior, and political
decisions in the context of environmental and natural resource conflicts. Through
developing and testing theoretical models from social science, seeks to derive practical
lessons that can be used to improve environmental policy.

►Environmental behavior is influenced by stakeholder beliefs and values, access to
information, scientific knowledge, scale and causes of the environmental problem, and
existing policy institutions. The complexity of how all of these factors interact makes it
difficult to determine appropriate policy solutions for different environmental problems.
Common features of CEPB studies are the use of multiple theoretical frameworks and
scientific methods of data acquisition and quantitative analysis to help unravel these
complex issues.
We focus on a wide variety of environmental problems and issues, including division
management, climate change, forest management, marine/coastal systems, biodiversity,
and agriculture. Our faculty and students work both locally and internationally, with recent
projects in Brazil, Bhutan, Costa Rica, and India.
►The CEPB team includes an actively engaged group Graduate students come from
diverse backgrounds including "natural and social sciences" and are enrolled through the
Graduate Group in Ecology. Recent graduates have gone on to become academics,
researchers, or policy analysts in universities and governmental agencies.
CORPORATE TAXATION POLICIES OF BELGIUM
►Companies from the chemical and life sciences industry contribute significantly to the
budget of national, regional and local authorities through the payment of various taxes.
This is a financing source for social, environmental and economic policies.
► At the same time, the chemical and life sciences sector benefits from subsidies and
tax incentives which are often related to longer-term projects with a focus on the
sustainable development of chemical and life sciences activities in Belgium
.►In 2009, companies and employees from the chemical and life sciences industry
contributed around €4 billion to the state budget after deduction of subsidies and tax
incentives.
This represents about 40% of the sector’s value added.
LEGAL POLICIES OF SAFTEY IN BELGIUM

►disturbing the sum total contribute chain. accomplish requires all companies
manufacturing or importing chemical substances into the European Union in quantities of
one tone or more per year to register these substances
.► Registrations are submitted to the European Chemicals Agency (ECHA) and contain
information on the substance's properties, uses and risk management measures.
►This information must be passed along the supply chain to downstream users so they
knowhow to use substances safely. Arrive at also restricts the manufacture, import,
placing on the market and/rouse of certain dangerous substance and use precise
approval is required for ‘substances of very high concern’.
CHARECTRISTIC FOLLOWED BY MCCOY SOUDAL MANUFACTURING
●Plastics offer light weight solutions
● Lightweight plastics can play an important role
●Plastics are the basis for high-performance building components.
● The annual energy consumption of a passive house is already exceeded
International and European quality standards governing Norms:
●Quality is the key to international markets
. Commercial class standards are used as a common trading language for buyers and
sellers and as a reference for quality control.
Quality requires the setting of the necessary quality standards:
To build trust and open market opportunities
To encourage high quality production
To improve the profitability of producers
To protect consumer interests

Commercial quality covers
● A range of parameters describing the internal and external
Characteristics of the product
That is necessary to ensure transparency in trade and obtain good levels of flavor. It lies
between essential qualities such as food or nutritional safety and marketing claims.
International standards
●The UNICCO’s Committee on Trade (CT) works to develop closer economic relations
Among Member States, as well as to better integrate their cost-cutting measure into the
world
Economy. It makes policy recommendations, develops standards for use in trade and
Assist portion country in implement them. It also suggest traditions and wealth of
Creating legal and administrative frameworks for fostering trade, investment and
business
Growth.
Quality standards according to the following standard layout making chemical product:
1. Definition of products
2. General provisions concerning quality: these are general requirements relating to
Physical condition, hygiene appearance, damp absence of overseas smell and/or
Tang, development and /or maturity the condition of the create must be such
As to enable them to withstand handling and transport and arrive in a satisfactory
Circumstance at the leave of target they also contain requirements on
Classification in defined
According to their excellence individuality and the extent of in no doubt defect.
3. Provisions concerning sizing

4. Provisions concerning tolerances
5. Provisions concerning presentation
6. Provisions concerning marking (labeling)
7. Annex I: supplementary provisions
8. Annex II: note on the interpretation to be given to the provisions concerning
Presentation and packaging of the produce
►POLICIES OF CONSUMER PROTECTION MCCOY OF BELGIUM
Principal and consumer protection
●The Code Alimentary system presents a unique opportunity for all countries to
Join the international community in formulating and harmonizing food standards
And ensuring their global implementation.
● It is also allows them a role in the development of codes governing hygienic processing
practices and recommendations relating to compliance with those standards.
● The significance of the food code for consumer health protection was underscored in
1985 by the United Nations Resolution 39/248 whereby guidelines were adopted for use
in the elaboration and reinforcement of consumer protection policies. The Guidelines
advise, “When formulating national policies and plans with regard to Governments should
take into account the need of all consumers for food Security and should support and, as
far as possible, adopt
Principles from the Codex Alimentary or, in their absence, other generally accepted
international
Values.”

Promoting Controversy Of chemical sector in India:
●National award for Technology Innovation
A scheme of national awards for technology innovation in various fields such as dyes,
pesticides, it is to be formulate under this scheme, the Government would institutionalize
awards for terrific contributions ended in technology innovations. The collection for
awards would be made by a Committee Of eminent persons.
● Traffic fair and exhibition the Government would actively
Facilitate and support the marketing and organization of major exhibitions and events in
order to provide a platform to the Indian chemical manufactures to show case their
strengths
.
●Market Development
The Government would travel around new avenues of export of chemical from India to
Latin American, African and Middle East countries through our embassies and missions
overseas

CH.6:- Policies and norms of export and import in India to chemical sector.
Import policies.
The liberalization of Indian economy started with the external sector. The Rupee was
devalue in two stages in July 1991. This was immediately followed by closure of direct
export subsidy. Import licensing was abolished for many items, including capital goods. A
new type of import licence called Exim Scrip was introduced. Exim Scrip was available
against export of goods and it was freely transferable in the market. The licence was valid
for import of a broad range of goods. So, importers wanted Exim Scrips but only
exporters could earn them. The premium on sale of the Exim Scrip was an incentive for
the exporters.
The List of Restricted Items consisted of 11 categories as under:
(a) Consumer Goods (11 entries)
(b) Precious, Semi-precious and other shingle (5 entries)
(c) Safety, Security and related items (6 entries)
(d) seed, Plants and Animals (4 entries)
(e) Insecticides and pesticide (2 entries)
(f) Electronic Items (9 entries)
(g) Drugs and Pharmaceuticals (9 entries)
(h) Chemicals and related Items (2 entries)
(i) Items Relating to Small Scale Sector (16 entries)
(j) Miscellaneous Items (15 entries)
(k) Special Categories (2 entries)

The Exim Policy abolished Actual User condition for freely importable goods. Such a
condition was applicable only for goods imported under a license or when notified so
through a Public Notice. Imports by travelers were governed by luggage Rules, notified
by the Customs.
Export policies.
▪The Govt. Policy, essentially, has been to allow the export of manufactured products
quite freely but restrict export of goods of plant origin, animal source and sandstone
origin. The restrictions are essential in public interest.
▪ For example, free exports of agricultural produce might create scarcity within the
country something no Govt. wants. There are other restrictions too which, because of
international commitments under multilateral and two-sided treaties, are to be respected.
For example, export of textiles to developed countries was restricted through quotas
under the erstwhile Multi Fiber Agreement (MFA) which no longer exists. Export of ozone
depleting substances is restricted under the Montreal Protocol. Exports of perilous
substances are subject to restrictions under the Basel Convention.
▪The Exim Policy specified that all exports contracts shall be denominated in foreign
currency. Contracts for which payments are received through Asian Clearing Union may
be denominated in the currency of the exporter, importer or in any freely adaptable
▪Currency and all such payments shall be deem to have been received in convertible
currency.
Norms of Belgium chemical company:
▪NEW DELHI: With the emergence of Asia as a prominent player in the international
chemical industry, India is also ornamental its position as a required after purpose for the
global chemical players. The problem of the Indian chemical industry is that its present
share stands in the global industry stands at just 3%.
▪It is where the importance of better infrastructure and sustainability assumes
significance for ornamental industrial growth of chemicals. Centre has also said that as
per the present trends, the Indian chemical industry could grow at 11% to touch the size

of $224 billion by 2017.
▪While talking to SME News about the growth prospects of Indian chemical industry, Ravi
Kapoor, MD, Hibachi Color Pvt Ltd and Chairman – Gujarat Chapter of Indian Chemical
committee, said, “This shape is attainable if the current issues of communications, land
availability and investment are addressed. This sector enjoys good growth forecast
although its present share in the global industry is fairly low.”
▪Analysts are of the belief that investment on research and development (R&D) has
potential to enhance India’s global competitiveness in the chemical sector. Even though,
presently India spends just 0.5% but by 2017, the R&D spending needs to touch 4%.
▪It is believed that setting up of a chemical sector committee for novelty can act as a key
raised area to address the efficiency issue. Promotion of development of local cluster
along with modernism centers in universities meant for the chemical industry can also
establish helpful in the long run.
▪Moreover, India should eye for inking global partnerships with nations such as Germany
to learn about the recent innovations in the sector.

Ch.7:- PRESENT TRADE BARRIERS FOR IMPORT/EXPORT OF CHEMICAL INDUSTRY
India’s present share in Global Trade is 0.6%, i.e., US$ 45 Billion & it has been
envisaged by our planners to increase the same to 1% I .e US$ 80 Billion.World is
becoming increasingly competitive & only the best & the most competitive will survive.
Incentives should be made available to the industry where larger MNCs have made
inroads. Chemical Industry is the most important Foreign Exchange earner with major
value additions throughout the value chain. The value is added using knowledge,energy
and Capital.
Current Status
Chemical Industry is an important constituent of the Indian economy having approx. US $
28 billion turnover which is approx. 7% of India’s GDP.In terms of volume, it is 12th
largest in the world, and 3rd largest in Asia. Within India, it constitutes about 15% of
manufacturing capacity and20% of the Excise revenue to the Government of
India.Chemical industry has weightage of about 13% in the index of industrial production.
The global chemical industry is valued at about US $ 1.7 trillion, of which, India’s
chemical sector accounts for just 2%.
Market Development Assistance
The current financial assistance to exporters for participation in International Trade Fair is
upto Rs.1.10 lacs annually.
Suggestion:In view of the dynamic global scenario, the cost of participation in
International Trade Fairs is considerably high. Therefore, the financial assistance to
exporters should be increased to Rs.5.00 lacs or USD 10000, for status holders This

assistance would encourage manufacturer exporters to participate & enhance country’s
image and manufacturing capabilities in the international arena
Reimbursement of Registration Charges
Under Market Access Initiative, Financial assistance shall be available under the scheme
to the Export promotional Councils etc, for reimbursement of Registration charges for
product registration abroad for chemicals, biotechnology and agro chemicals and testing
charges for engineering products.
Suggestion:The Organic and Inorganic sector which is the backbone for Chemicals,
biotechnology sector is deprived from above assistance.
Therefore it is suggested to include Organic and Inorganic sector also under the preview
of above said initiative.
EU REACH Proposal
EU REACH (Registration, Evaluation and Authorization of Chemicals) is a nonTariff
barrier imposed by the European Union. This shall increase burden on the industry and
reduce the competitiveness.
Suggestions:Govt. should create an infrastructure & a cell for assistance (Technical &
financial) so that country’s export and competitiveness of the industry is not hit.Govt.
should establish centers for toxicology and statistical modeling (QSAR) expertise.Testing
laboratories approved by EU should be set up within India.These laboratories should
adhere to various International standards. As there are going to be myriad of chemicals
needing testing, this would result in saving testing cost and most importantly valuable
time.
Duty Free Import of Fuel
Organic and Inorganic chemical sectors are allowed only 4% FOB value of export to
import duty free fuel for captive power plants only. In the Chemical Sector, Energy is

required in two forms i.e. Electrical & Thermal. Substantial energy is utilized in the form of
thermal energy i.e.steam, which is very critical utility in various reaction process as well
as distillation.This utilization of steam cannot be substituted by power, as technology
would not permit for the same. The fuels used for steam generation are Coal, R.F.O,
Furnace Oil, L.D.O. and HSD etc. After considering steam i.e. thermal energy also in the
utility, the cost of utility of chemical industry varies between 10% and 15% of the FOB
value of the product exported. Therefore, it is suggested for upward revision for the duty
free import of fuel for atleast 10% after considering the fuel required via steam for
chemical industry.Duty free Entitlement for Status Holders for incremental growth more
than 25% in FOB value.
Suggestion:The condition of incremental growth for big exporters is very high.For
company’s having high turnover, incremental growth percentage wise may be less but
value wise is high. Therefore, it is suggested that incremental growth limit should be
brought down to 10% for Trading house & above.
Transferability of Advance License
Currently advance license is issued on Actual user condition. It can be converted into
Transferable, once the export obligations are fulfilled with no import of any item allowed
taken place. However, if some of the inputs included in the license have been imported,
the license can’t be converted into transferable for balance of the inputs even after the
export obligations are fulfilled.
Suggestion: There are few imports which are hazardous, difficult to handle & store and
the quantities are uneconomical to import by the license holder. They can be imported by
only those who can combine such licenses and have the requisite infrastructure.
Therefore, in such cases Advance License should be made transferable after fulfillment
of export obligations.
Transpacific Economic Partnership Agreement
ACC also calls for the swift conclusion of negotiations on the Trans Pacific Economic
Partnership (TPP) negotiations. The chemical sector strongly supports the TPP, and
views it as an opportunity to build consensus around new, high-standard trade disciplines

that address current and emerging trade issues. ACC analysis shows that the TPP agreement has the potential of generating $1.2 billion in export growth.In addition to
the TPP, the INDIA.government must explore options for free trade agreements with key
APEC economies not already part of the TPP.
Integrated Risk Information System (IRIS)
EPA’s Integrated Risk Information System is not a regulatory program, but it drives many
other important EPA regulatory and policy decisions that can have a major impact on jobs
and the economy. IRIS is a leading source of health risk information for domestic and
international regulatory bodies, including other EPA program offices. However, IRIS relies
on outdated methods for assessing the safety of chemicals, and lacks the transparency
needed by risk managers who use these assessments. Reforms to IRIS to ensure it
employs a more transparent, rigorous, and science-based approach in its assessments,
are essential to ensuring that our nation’s chemical management system delivers sound
public health decisions, while at the same time encouraging innovation, competitiveness,
and export growth.
Regulatory
Today, Indian chemical manufacturers comply with a massive amount of data collection,
reporting and other regulatory requirements, many of which are vital to ensuring the
health and safety of our products. However, regulations not grounded in science or
lacking a methodology for calculating risk typically impose massive, unnecessary costs
for Indian manufacturers with little or no public benefit. The Indian chemical industry
needs cost effective, science-based regulations that achieve both economic and social
policy objectives.
Innovation through regulation
Innovation, including science and technological progress, is an important source of
enhanced competitiveness for Indian chemical manufacturers, and a driver of economic
and export growth. In the chemical sector, innovation and chemistry are inextricably
linked. From applied technology in medical devices, aerospace, energy efficiency,
computing, cars, fuels and more, chemistry enables technological advancements that
drive further innovation, create jobs and enhance safety in our everyday lives. The Indian

chemical sector’s growth and competitiveness depend on its capacity to innovate and
commercialize new chemical products and applications.
Toxic Substances Control Act (TSCA)
The current regulatory regime under the core Indian chemical management law the Toxic
Substances Control Act – is in need of modernization. TSCA is more than 35 years old,
and needs updating to reflect advances in science and technology, to provide for greater
business certainty, to continue to promote innovation within the industry, and provide
customers confidence that chemicals are safe for their intended uses. Domestic and
foreign consumers should be confident that the Indian employs a regulatory framework
that bases decisions on chemical safety science and state-of the- art testing and
assessment methods. A more efficient and effective chemicals management system can
serve as a catalyst for enhancing the industry’s export performance, while also protecting
human health and the environment.

CH.-8 & 9:- POTENTIAL FOR IMPORT AND EXPORT AND BUSINESS
OPPORTUNITY
▪General Provisions
Goods are imported in India or exported from India through sea, air or land. Goods
can come through post parcel or as baggage with passengers. Potentials naturally
vary depending on mode of import or export. Potentials discussed in this Chapter
are applicable for imports by sea, air or land, but not as baggage or postal dispatch.
▪COMPUTERISATION OF CUSTOMS WORK - Work of customs at Delhi airport
has been computerized. Work at Mumbai port is also computerized. Whenever the
work is computerized, documents like IGM and Bill of Entry have to be filed
electronically. Potential in computerized environment has been specified in CC, New
Delhi PN 22/98 dated 8.5.1998. Guidelines for preparing data file for Bill of Entry and
shipping bills for Mumbai Customs House has been prescribed vide PN 108/99 dated
30-9-1999 and PN 10/2001 dated
30.1.2001.
▪ENTRY – ‘Entry’ in relation to goods means an entry made in a Bill of Entry,
Shipping Bill or Bill of Export. It includes (a) label or declaration accompanying the
goods which contains description, quantity and value of the goods, in case of postal
articles u/s 82 (b) Entry to be made in case of goods to be exported (c) Entry in
respect of goods imported which are not accompanied by label or declaration made
as per provisions of section 84. [section 2(16)].
▪AMENDMENT TO DOCUMENTS - Importer, exporter or 'Person In charge' have to
submit various documents to customs authorities like Bill of Entry, Import Manifest,
Export Manifest etc. Some times, it may become necessary to amend the document
due to various reasons like change in classification, clerical mistake in document,

change in unloading / loading plan of vessel etc. In such case, permission to amend
these documents have to be obtained from customs authorities. [section 149]. Such
permission can be given if there are no fraudulent intentions
Import Potentials
Potentials have to be followed by ‘person-in-charge of conveyance’ as well as the
importer.
WHO IS 'PERSON IN CHARGE' - As per section 2(31), 'person in charge' means (a) In
case of vessel - its master (b) In case of aircraft - its commander or pilot-in-charge (c)
In case of train - its conductor or guard and (d) In case of vehicle or other conveyance -
its driver or other person in charge.
Documents to be submitted by Importer - Documents required by customs
authorities are required to be submitted to enable them to
(a) check the goods
(b) decide value and classification of goods and
(c) to ensure that the import is legally permitted. The documents that are
essentially required are :
(i) Invoice
(ii) Packing List
(iii) Bill of Lading / Delivery Order
(iv) GATT declaration form duly filled in
(v) Importers / CHAs
declaration duly signed
(vi) Import Licence or attested photocopy when clearance is under licence
(vii) Letter of Credit / Bank Draft wherever necessary
(vii) Insurance memo or insurance policy
(viii) Industrial License if required
(ix) Certificate of country of origin, if preferential rate is claimed.
(x) Technical literature.
(xi) Test report in case of chemicals

(xii) Advance License / DEPB in original, where applicable
(xiii) Split up of value of spares, components and machinery
(xiv) No commission declaration. – A declaration in prescribed form about
correctness of information should be submitted. – Chapter 3 Para 6 and 7 of
CBE&C’s Customs Manual,
2001.
Assessment of Duty and Clearance
▪The documents submitted by importer are checked and assessed by Customs
authorities and then goods are cleared. Section 2(2) defines ‘assessment’ as
follows – ‘Assessment’ includes provisional assessment, reassessment and any
order of assessment in which the duty assessed is Nil. Thus, ‘assessment’ includes
●Noting of Bill of Entry: –
▪ Bill of Entry submitted by importer or Customs House Agent is cross-checked with
‘Import Manifest’ submitted by person in charge of vessel / carrier. It is noted if the
description tallies. ‘Noting’ really means taking on record by customs officer. This
date is relevant for determining rate of customs duty. Thoka number (serial number)
is given in the import section. Otherwise, it is returned for clarifications. In case of
EDI system, noting is done by the system itself which also generates bill of entry
number.
▪Date of presentation of bill of entry is highly relevant and the rate of duty as
applicable on this date will be considered for calculating the duty payable. Bill of Entry
is accepted only after proper scrutiny vis-a-vis import manifest and various
declarations given in bill of entry and attached documents like invoice, bill of lading
etc. If such documents are not attached, the authorities can refuse to accept the Bill
of Entry, and hence submission of such incomplete Bill of Entry cannot be taken as
date of presentation of Bill of Entry - Simla Agencies v. CC -
1993 (63) ELT 248 (CEGAT).
●Prior Entry of Bill of Entry: -
▪After the goods are unloaded, these have to be cleared within stipulated time -

usually three working days. If these are not so removed, demurrage is charged by
port trust/airport authorities, which is very high. Hence, importer wants to complete
as many formalities as possible before ship arrives. Proviso to Section 46(3) of
Customs Act allows importer to present bill of entry upto 30 days before expected
date of arrival of vessel. In such case, duty will be payable at the rate applicable on
the date on which ‘Entry Inward’ is granted to vessel and not the date of
presentation of Bill of Entry, but rate of exchange will be as prevalent on date of
submission of bill of entry. - confirmed in CC, New Delhi circular No 64/96 dated
10.12.1996 and CBE&C circular No 22/97-Cus dated 4.7.1997.
●Assessment of Customs duty: -
▪Section 17 provides that assessment of goods will be made after Bill of Entry is
filed. Date stamp of receipt is put on the ‘Bill of Entry’ and then it is sent to
appraising department either manually or electronically
●APPRAISING THE GOODS –
▪Appraiser has to (a) correctly classify the goods (b) decide the Value for purpose of
Customs duty (c) find out rate of duty applicable as per any exemption notification
and (d) verify that goods are not imported in violation of any law. He can call for any
further documents that may be required for assessment. If he is of the opinion that
goods have to be examined for appraisal, he will issue an examination order, usually
on the reverse of Bill of Entry. If such order is issued, the Bill of Entry is presented to
appraising staff at docks / air cargo complexes, where the goods are examined in
presence of importer’s representative. Assessment is finalised after getting the report
of examination. – Chapter 3 Para 11 and 12 of CBE&C’s Customs Manual, 2001.
●VALUATION OF GOODS: -
▪ As per rule 10 of Customs Valuation Rules, the importer has to file declaration
about full 'value' of goods. If the assessing officer has doubts about the truth and
accuracy of 'value' as declared, he can ask importer to submit further information,
details and documents. If the doubt persists, the assessing officer can reject the
value declared by importer. [rule 10A(1) of Customs Valuation Rules]. If the importer
requests, the assessing officer has to give reasons for doubting the value declared

by importer. [rule 10A(2)].
▪ If the value declared by importer is rejected, the assessing officer can value
imported goods on other basis e.g. value of identical goods, value of similar goods
etc. as provided in Customs Valuation Rules. [This amendment has been made w.e.f.
19.2.98, as per WTO agreement. However, it has been held that burden of proof of
under valuation is on department]. - - Assessing Officer should not arbitrarily reject
the declared value and increase
the assessable value. He should follow due process of law and issue appealable
order. – MF(DR) circular No.
16/2003-Cus dated 17-3-2003.
●APPROVAL OF ASSESSMENT: -
▪ The assessment has to be approved by Assistant Commissioner, if the value is
more than Rs one lakh. (in cases covered under ‘fast track clearance for imports’,
appraiser is also authorised to approve valuation). After the approval, duty payable is
typed by a “pin-point typewriter” so that it cannot be tampered with. As per CBE&C
circular No. 10/98-Cus dated 11-2-1998, Assessing Officer should sign in full in Bill of
Entry followed by his name, preferably by rubber stamp.
EDI ASSESSMENT – In the EDI system, the cargo declaration is transferred to
assessing officer in the groups electronically. Processing is done on the screen itself.
All calculations are done by the system itself. If assessing officer needs clarification,
he can raise a query. The query is printed at service centre and importer replies
through service centre. Facility of tele-enquiry about status of documents is provided
in major customs stations. Under EDI, normally, documents are inspected only after
assessment. After assessment, copy of Bill of Entry is printed at service centre. Final
Bill of Entry is printed only after ‘Out of Charge’ order is given by customs officer. –
Chapter 3 Para 18 to 22 of CBE&C’s Customs Manual, 2001.
●PAYMENT OF CUSTOMS DUTY: -
▪After assessment of duty, necessary duty is paid. Regular importers and Custom
House Agents keep current account with Customs department. The duty can be
debited to such current account, or it can be paid in cash/DD through TR-6 challan in
designated banks.

▪After payment of duty, if goods were already examined, delivery of goods can be
taken from custodians (port trust) after paying their dues. If goods were not
examined before assessment, these have to be submitted for examination in import
shed to the examining staff. After shed appraiser gives ‘out of charge’ order, delivery
of goods can be taken from custodian.
●EXAMINATION OF GOODS: -
▪Examiners carry out physical examination and quantitative checking like
weighing, measuring etc. Selected packages are opened and examined on
sample basis in ‘Customs Examination Yard’. Examination report is prepared by
the examiner.
▪Accelerated Clearance of Imports and Exports Scheme (ACS) – Finance Minister, in
his budget speech on 28-2-
2003, had announced a ‘self assessment scheme’ for importers and exporters. As
per the scheme, importer will himself determine classification of goods including claim
for exemption benefits. Computer System will calculate the duty based on his
declaration. Physical inspection of imported goods will be done by risk- assessment
and management techniques on a computer based system and not on the orders of
customs examining staff. Audit of import documents will not be by existing system of
concurrent audit but will be done by post-clearance audit, as prevalent in developed
countries.
▪Subsequently, a Accelerated Clearance of Import and Export Scheme (ACS) has
been announced vide MF(DR)
circular No. 30/2003-Cus dated 4-4-2003. The scheme is announced through
administrative instructions, without making any change in statutory provisions. Hence,
the scheme is not same as ‘self removal’ under Central Excise. Presently, the scheme
is introduced on trial basis at Air Customs, Sahar (Mumbai), ICD, New Delhi and
Chennai Sea Customs.In case of imports, the scheme will be open to all status
holders under EXIM policy, Central and State Government PSUs and other importers
who have been importing for at least two years and have filed at least 25.

●Bills of Entry in preceding year :. –
▪ In case of exports, the scheme will be open to all status holders under EXIM
policy, EOU/STP/EHTP units whose goods have been sealed in presence of
customs/excise officers, Central and State Government PSUs, manufacturer-
exporters who have been exporting for at least two years and have filed at least 25
Shipping Bills in preceding year and bulk exporters.
▪ Certain sensitive items have been excluded from the provisions. Importer/exporter
intending to avail this facility has to make application to Commissioner. The
clearances will be subject to post clearance audit.
▪Provisional Assessment - Section 18 of Customs Act, 1962 provide that provisional
assessment can be done in following cases
(a) when Customs Officer is satisfied that importer or exporter is unable to produce
document or furnish information required for assessment
(b) it is deemed necessary to carry out chemical or other tests of goods
(c) when importer/exporter has produced all documents, but Customs Officer still
deems it necessary to make further enquiry. In such cases, assessment is done
on provisional basis.
▪The importer/exporter has to furnish guarantee/security as required by Customs
Officer for payment of difference if any. Goods can be cleared after payment of duty
provisionally assessed and after providing the security. After final assessment,
difference is paid by importer or refunded to him as the case may be. If the imported
goods were warehoused after provisional assessment, the Customs Officer may
require importer to execute a bond for twice the difference in duty, if duty finally
assessed is higher [section 18(2)(a)]. The bond is called as 'P D Bond' (Provisional
Duty Bond). The bond is with security or surety. Bank guarantee can also be given
as a security.

▪Checking of duty drawback / license documents - Documents in respect of Duty
Entitlement Pass Book
(DEPB), advance license, duty drawback etc. will be checked.
●Execution of bond and payment of duty: -
Once the duty is assessed, the bill of entry is returned to importer. The Bill of Entry
should be presented to comptist for calculation and pinpointing of the duty. If bond
has to be executed, it will be taken in bond section.
●Payment of duty: -
▪ If goods are to be removed to a warehouse, duty payment is not required. The
goods can be taken to a warehouse under bond, without payment of duty. However,
if goods are to be removed for home consumption, payment of customs duty is
required. CHA or the importer can take it for payment of customs duty. Large
importers and CHA have P.D. accounts with customs. Duty can be paid either in cash
or through P.D. account. P. D. account means provisional duty account. This is a
current account, similar to PLA in central excise. The importer or CHA pays lump
sum amount in the account and gets credit on the amount paid. He can pay customs
duty by debiting the amount in P.D. (Provisional Duty) account. If the importer does
not have an account, he can pay duty by cash using TR-6 challan. Of course,
payment through PD account is very convenient and quick
Export Potentials
▪Potentials have to be followed by (a) ‘person-in-charge of conveyance’ and (b) the
exporter. The potentials are similar to potentials for import, of course, in reverse
direction.
●NO STOPPAGE OF EXPORT CONSIGNMENT: -
▪ Exports are vital for our economy. Any stoppage in export consignment means loss
of export orders to the exporter and loss of foreign exchange to the country. Hence,
it has been provided that movement of export consignment will not be interrupted
and no export consignment shall be withheld for any reason whatsoever. In case of

any doubt, customs authorities may ask for an undertaking that the export is on sole
responsibility of the exporter. [Highlights of EXIM policy 1997-2002 as amended on
13.4.1998].
▪Potentials by person in charge of conveyance – Any new airline, shipping line,
steamer agent should be registered in Customs Systems for electronic
processing of shipping bills etc.
▪The ‘person in charge of conveyance’ has to follow prescribed potentials.
●Entry Outward: -
▪The vessel should be granted ‘Entry Outward’. Loading can start only after entry
outward is granted. (section 39 of Customs Act). Steamer Agents can file
‘application for entry outwards’ 14 days in advance so that intending exporters can
start submitting ‘Shipping Bills’. This ensures that formalities are completed as
quickly as possible and loading in ship starts quickly.
●LOADING WITH PERMISSION: -
▪ Export goods can be loaded only after Shipping Bill or Bill of Export, duly passed by
Customs Officer is handed over by Exporter to the person-in-charge of conveyance.
In case of baggage and mail bags, shipping bill is not necessary, but permission of
Customs Officer is required (section
40).
▪Export Manifest - As per section 41, an Export Manifest/Export Report in prescribed
form should be submitted before departure. [The report is popularly called as ‘Export
General Manifest’ - EGM]. The details required are similar to import manifest. Such
manifest/report can be amended or supplemented with permission, if there was no
fraudulent intention. Such report should be declared as true by the person-in-charge
signing the export manifest. This report is not required if the conveyance is carrying
only luggage of occupants.
▪Potentials to be followed by Exporter – Export potentials have been summarized in
Chapter 3 Part II of
CBE&C’s Customs Manual, 2001.

Every exporter should take following initial steps -–
▪Obtain BIN (Business Identification Number) from DGFT. It is a PAN based
numberOpen current account with designated bank for credit of duty drawback claims
Register licenses / advance license / DEPB etc. at the customs station, if exports are
under Export
▪Promotion Schemes
Exporter has to submit ‘shipping bill’ for export by sea or air and ‘bill of export’ for
export by road. Goods have to be assessed for duty; even if no duty is payable for
most of exports, as ‘Nil Duty’ assessment is also an assessment.
▪Shipping Bill to be submitted by Exporter - Shipping Bill and Bill of Export
Regulations prescribe form of shipping bills. It should be submitted in quadruplicate.
If drawback claim is to be made, one additional copy should be submitted.
▪There are five forms:
(a) Shipping Bill for export of goods under claim for duty drawback
- These should be in Green colour
(b)Shipping Bill for export of dutiable goods - this should be yellow colour
(c) Shipping bill for export of duty free goods - it should be white colour
(d) shipping bill for export of duty free goods ex-bond - i.e. from bonded store room
- it should be pink colour
(e) Shipping Bill for export under DEPB scheme - Blue colour.

▪The shipping bill form requires details like name of exporter, consignee, Invoice
Number, details of packing, description of goods, quantity, FOB Value etc.
Appropriate form of shipping bill should be used.
▪Relevant documents i.e. copies of packing list, invoices, export contract, letter of
credit etc. are also to be submitted. In case of excisable goods, from ARE-1
prepared at the time of clearance from factory should also be submitted.
▪Customs authorities give serial number (called 'Thoka Number') to shipping bill,
when it is presented. Excise formalities at the time of Export - If the goods are
cleared by manufacturer for export, the goods are accompanied by ARE-1 (earlier
AR-4). This form should be submitted to customs authorities. The Customs Officer
certifies that the goods under this form have indeed been exported. This form has
then to be submitted to Maritime Commissioner for obtaining ‘proof of export’. The
bond executed by Manufacturer-exporter with excise authorities is released only
when ‘proof of export’ is accepted by Maritime Commissioner or Assistant
Commissioner, where bond was executed.
●Duty drawback formalities: -
▪ If the exporter intends to claim duty drawback on his exports, he has to follow
prescribed potentials and submit necessary papers. The potentials are discussed in
the chapter on ‘Export Incentives'. He has to make endorsement of shipping bill that
claim for duty drawback is being made. If he fails to do so due to genuine reasons,
Commissioner of Customs can grant exemption from this provision. [proviso to rule
12(1)(a) of Duty Drawback Rules].
●G R / SDF / SOFTEX Form under FEMA :-
▪Reserve Bank of India has prescribed GR / SDF form under FEMA. “G R” stands for

‘Guaranteed Receipt’ form, while SDF stands for 'Statutory Declaration Form’). SDF
form is to be used where shipping bills are processed electronically in customs
house, while GR form is used when shipping bills are processed manually in
customs house.
●Other documents required for export: -
▪Exporter also has to prepare other documents like (a) Four copies of Commercial
Invoice (b) Four copies of Packing List (c) Certificate of Origin or pre-shipment
inspection where required (d) Insurance policy. (e) Letter of Credit (f) Declaration
of Value (g) Excise ARE-1/ARE-2 form as applicable (h) GR / SDF form prescribed
by RBI in duplicate (i) Letter showing BIN Number.
●RCMC certificate from Export Promotion Council: -
▪Various Export Promotion Councils have been set up to promote and develop
exports. (e.g. Engineering Export Promotion Council, Apparel Export Promotion
Council, etc.) Exporter has to become member of the concerned Export Promotion
Council and obtain RCMC - Registration cum membership Certificate.
●Check in customs: –
▪ Document submitted is processed by customs authorities, and following are
checked - Chapter 3 Para 39 of CBE&C’s Customs Manual, 2001.
Value and classification of goods under drawback schedule in case of drawback
shipping bills
Export duty / cess if applicable
Advance License shipping bills are checked to ensure that description in invoice
and final product specified in Advance License matches. If necessary, samples
may be drawn and assessment may be done after visual inspection or testing
Exportability of goods under EXIM policy and other laws - Some exports are totally

prohibited under various Acts e.g. items restricted or prohibited under Foreign
Trade (Regulation) Act; antiques; art treasures; Arms; narcotics etc. Some items
like tea, coffee and coir products can be exported only against
authorization/licence under respective Acts.
●Examination of goods before export: -
▪After shipping bill is passed by export department, the goods are presented to
shed appraiser (exports) in dock for examination. Goods will be examined by
examiner. This inspection is necessary (a) to ensure that prohibited goods are not
exported (b) goods tally with description and invoice (c) duty drawback, where
applicable, is correctly claimed.
▪Customs Act. [The conveyance may be vehicle, ship or aircraft]. After transit,
the goods may go to another customs station.
▪On arrival at customs station, the goods will be liable to customs duty as if it is
first importation in India. - section 55.
▪Transhipment of Goods - Goods imported in any customs station can be
transhipped without payment of duty, u/s 54 of Customs Act. Transhipment means
transfer from one conveyance to another. [The conveyance may be vehicle, ship or
aircraft]. Such transhipment may be to any major port or airport in India. The goods
can be transhipped to any other customs station in India if customs officer is
satisfied that the goods are bonafide intended for transhipment to any customs
station. The facility is available at all customs ports and Inland Container Depots
(ICDs). [Notification No. 50/95-Cus(NT) dated 6-9-95].
▪Goods to be transhipped must be specified in Import Manifest or Import report
and a ‘Bill of Transhipment’ should be submitted to Customs Officer. In case of
goods being transhipped under an international treaty or bilateral agreement

between Government of India and Government of a foreign country, a
Declaration of Transhipment shall be submitted instead of Bill of Transhipment.
[section 54(1)]. [India has such bilateral agreement with Nepal].
▪Such goods should not be ‘prohibited goods’ under section 11 of Customs Act.
The goods should be sealed during transhipment by customs officer. A bond has
to be executed for the purpose. After execution of bond, a certificate from customs
officer has to be submitted within one month that goods have been properly
transferred. [Goods Imported (Conditions of Transshipments) Regulations, 1995].
On arrival at customs station, they will be liable to customs duty as if it is first
importation in India. - section 55.
●TRANSIT AND TRANSHIP: -
▪ Distinction between transit and transshipment is that in 'transit' goods continue to
be on same vessel, while in transshipment, goods are transferred to another vessel
/ vehicle. Hence, potentials are also different.
▪Coastal goods - Coastal goods means goods transported from one port in India to
another port in India, but do not include imported goods. Thus, coastal goods mean
goods taken by ship from one Indian port to another. No export or import is involved,
but control is necessary to ensure that coastal goods are not diverted illegally for
export.
●LOADING OF COASTAL GOODS: -
▪The Consignor should submit bill of coastal goods to Customs Officer (section
93). Form of the bill has been prescribed. These will be loaded by master of vessel
only after ‘bill of coastal goods’ is passed (section 93). Master of Vessel will carry
an ‘Advice Book’ where entries will be made by Customs Officer. This ‘Advice
Book’ has to be presented for inspection of Customs Officers, if called for. After

loading, the vessel can leave only after obtaining written order from Customs
Officer. As per notification No 15/98-NT dated 27.2.1998, exemption has been
granted for delivery of 'Advice Book' at each port of call. However, the 'Advice
Book' will have to be submitted for inspection on board of vessel, when called for.
●UNLOADING OF COASTAL GOODS: -
▪Unloading of coastal goods should be done only at Customs Port or coastal port
appointed by CBEC under section 7 of Customs Act. On arrival, all bills relating to
goods which are to be unloaded will be delivered to Customs Officer. Unloading can
be done only after obtaining permission from Customs Officer. Customs Officer can
inspect goods and ask for questions and documents relating to goods. Goods will be
unloaded at approved place under supervision of Customs Officer.
●IMPORT MANIFEST IS REQUIRED TO BE SUBMITTED BEFORE ARRIVAL OF
AIRCRAFT OR VESSEL:
▪ Section 30(1) of Customs Act provides that Import Manifest should be filed before
arrival of ship or aircraft. Normally, the Agents submit the Import Manifest before
arrival, so that maximum possible formalities are completed before vessel or aircraft
arrives. This also enables importers to file ‘Bill of Entry’ in advance.
▪Grant of Entry Inwards by Customs Officer - Unloading of cargo can start only after
Customs Officer grant
‘Entry Inwards’. Such entry inwards can be granted only when berthing
accommodation is granted to a vessel. If there is heavy congestion at port,
shipping berth may not be available and in such case, ‘Entry Inwards’ cannot be
granted. This date is highly relevant for determining rate of customs duty
applicable.

▪Carrier responsible for shortages during unloading - If the goods are short landed,
the carrier is liable to pay penalty upto twice the amount of duty payable on such
short landed goods. It has been held that tally sheet prepared by Port Trust
authorities on unloading of goods is a statutory document and should be accepted
in preference to steamer survey - Scindia Steam Navigation v. CC - 1988 (33) ELT
(CEGAT) followed in re India Steamship Co. Ltd. - 1992 (57) ELT 510 (GOI).
▪Potential by Importer - The importer importing the goods has to follow prescribed
potentials for import by ship/air/road. (There is separate potential for goods
imported as a baggage or by post.)
▪Bill of Entry - This is a very vital and important document which every importer has
to submit under section 46. The Bill of Entry should be in prescribed form. The
standard size of Bill of Entry is 16" × 13". However, for computerization purposes,
15" × 12" size is permitted. (Mumbai Customs Public Notice No. 142/93 dated 3-11-
93).
▪Bill of Entry should be submitted in quadruplicate – original and duplicate for
customs, triplicate for the importer and fourth copy is meant for bank for
making remittances.
Under EDI system, Bill of Entry is actually printed on computer in triplicate only
after ‘out of charge’ order is given. Duplicate copy is given to importer.
Types of Bill of Entry - Bills of Entry should be of one of three types. Out of these,
two types are for clearance from customs while third is for clearance from
warehouse.

●BILL OF ENTRY FOR HOME CONSUMPTION –
▪This form, called ‘Bill of Entry for Home Consumption’, is used when the imported
goods are to be cleared on payment of full duty. Home consumption means use
within India. It is white colored and hence often called ‘white bill of entry’.
●BILL OF ENTRY FOR:
▪when required on payment of duty. This will enable him to defer payment of
customs duty till goods are actually required by him. This Bill of Entry is printed on
yellow paper and often called ‘Yellow Bill of Entry’. It is also called ‘Into Bond Bill of
Entry’ as bond is executed for transfer of goods in warehouse without payment of
duty.
●BILL OF ENTRY FOR EX-BOND CLEARANCE: -
▪ The third type is for Ex-Bond clearance. This is used for clearance from the
warehouse on payment of duty and is printed on green paper. The goods are
classified and value is assessed at the time of clearance from customs port. Thus,
value and classification is not required to be determined in this bill of entry. The
columns in this bill of entry are similar to other bills of entry. However, declaration
by importer is not required as the goods are already assessed.
●RATE OF DUTY FOR CLEARANCE FROM WAREHOUSE: -
▪ It may be noted that rate of duty applicable is as prevalent on date of removal from
warehouse. Thus, if rate has changed after goods are cleared from customs port,
customs duty as assessed on yellow bill of entry and as paid on green bill of entry
will not be same.

●Mention of BIN on Bill of Entry: –
▪A BIN (Business Identification Number) is allotted to each importer and exporter
w.e.f. 1.4.2001. It is a 15 digit code based on PAN of Income Tax (PAN is a 10 digit
code). [Earlier an EC (Import Export code) number issued by DGFT was required to
be mentioned on Bill of Entry].
▪Filing of Bill of Entry - Normally, Bill of Entry is filed by CHA on behalf of the
importer. Customs work at some ports has been computerized. In that case, the Bill
of Entry has to be filed electronically, i.e. through Customs EDI system through
computerization of work. Potential for the same has been prescribed vide Bill of
Entry (Electronic Declaration) Regulations, 1995.

CH.10:- CONCLUSION
A robust export-led growth strategy must address both domestic and international
policies that systematically disadvantage Indian manufacturing competitiveness. The
purpose of ACC’s “Keys to Export Growth” is to provide insights and actionable
recommendations that will lead to stronger export growth for the Indian chemical sector,
and the Indian economy as a whole. ACC and its members support a broad and
comprehensive policy approach that addresses a range of policy issues.
From energy and tax to trade and regulations, ACC’s “Keys to Export Growth “presents
clear recommendations on public policy issues that can make a positive contribution to
the chemical industry’s efforts to drive innovation, increase productivity, and encourage
investment.
▪Promoting resource efficiency is a policy objective of the Federal Government of
Belgium, but also of the regions, with many cross‐cutting linkages to various policy
fields. Therefore, resource efficiency policies are formulated and introduced by various
Federal Departments, covering different issues and aspects of the resource efficiency
agenda.
▪The development of the Belgium's environmental policy is characterized by a
separation of responsibilities between the national and the regional level.
The Environmental federal level is responsible for:
the establishment of an integrated product policy
the chemical policy
the transit of wastes
the protection against ionizing radiation and radioactive waste management

▪On the Federal level, a mainly horizontal approach is contributed to resource efficiency
with cross-cutting linkages between various governmental bodies and policy fields, such
as:
Federal Public Service (FPS) for Economy, SMEs and Energy
Federal Public Service for Foreign Affairs, Foreign Trade and Development
Federal Department for Sustainable Development
Federal Department for Sciences
These FPS are, for instance, in charge of the general building policy, the financial and
fiscal policy, the energy policy etc. 2011 survey of resource efficiency policies in EEA
member and cooperating countries - BELGIUM

BIBLIOGRAPHY
http://ib.fgov.be/en/important_industries http://commerce.nic.in/trade/international_ta_current_details http://www.nationsencyclopedia.com ec.europa.eu/trade/creating-opportunities/bilateral-relations/countries/india/ www.economywatch.com/world_economy/belgium/export-import.html www.agoria.be www.flaunders .be www.oecd.eu www.un.com www.moft.in www.wallonialogistics.be National Bank of Belgium RBI Ministry of Corporate Taxation, India Department of taxation, Belgium www.Bloomberg.com Government of Belgium , website Government of Gujarat , Portal http://www.fedex.com/us/international/irc/profiles/irc_be_profile.html http://www.indiapackagingshow.com/industry.htm http://www.indiapackagingshow.com/industry.htm http://www.flexfilm.com/index.php?option=com_content&view=article&id=22&Itemid=
46&lang=en http://www.indiapackagingshow.com/AMIF.pdf http://www.cuts-citee.org/PDF/EU-FTAReport.pdf
http://www.tradingeconomics.com/belgium/international-tourism-receipts-us-dollar-wb-data.html
http://www.brugge.be/
http://en.wikipedia.org/wiki/Visa_requirements_for_Belgian_citizens#cite_note-1
http://belgium.visahq.in/embassy/India/
http://in.vfsglobal.be
http://www.vfs-be-in.com/contactus.html
http://www.learn4good.com/travel/belgium_visa.htm
http://www.visitbelgium.com/

http://en.wikipedia.org/wiki/Tourism_in_Belgium
http://diplomatie.belgium.be/en/services/travel_to_belgium/links/tourism/
www.visitbelgium.com https://en.wikipedia.org/wiki/Belgium www.ifitweremyhome.com/compare/IN/BE www.travelmath.com/time-change/from/Brussels,+Belgium/to/India www.numbeo.com › Numbeo › Cost of Living › Comparison www.nationmaster.com/compare/Belgium/India/Economy www.incredibleindia.org/ www.tourism.gov.in/ http://www.google.co.in/search?q=belgium%20pakaging%20process&um=1&ie=UTF-
8&hl=en&tbm=isch&source=og&sa=N&tab=wi&ei=oZwnUYS3FYXSrQeP6IHACA&biw=1024&bih=677&sei=uZwnUaO1I4OKrgfKwoGgCg#um=1&hl=en&tbm=isch&sa=1&q=belgium+packaging+process+flowchart&oq=belgium+packaging+process+flowchart&gs_l=img.3...99425.104358.1.105193.11.11.0.0.0.0.173.1565.0j10.10.0...0.0...1c.1.4.img.jGCBFvc8LPE&fp=1&biw=1024&bih=677&bav=on.2,or.r_cp.r_qf.&cad=b&sei=NDZuUbuzIIS8rAeCnYHQBQ
http://www.austrade.gov.au/Doing-business-in-Belgium/default.aspx http://www.academia.edu/477809/Non-tariff_Barriers_affecting_Indias_Export http://www.worldpackaging.org/publications/documents/market-statistics.pdf LEGISLATION ON PACKAGING AND THE ENVIDONMENT - Europen Green Dot &Packaging Waste Directive Compliance in Europe http://agriexchange.apeda.gov.in/countrysearchnew/expfrmindia.aspx?ctryid=13033&ctr
yn=BELGIUM&menuid=15 http://www.infodriveindia.com/india-import-data/packed-food-import-data.aspx http://www.google.co.in/url?sa=t&rct=j&q=&esrc=s&source=web&cd=1&cad=rja&ved=0CCEQFjAA&url=http%3A%2F%2Fwww.india-exports.com%2Fagro.html&ei=5dNIUNX3K8forAe74IGwCw&usg=AFQjCNGSg0ZTsUQ9gmWMPd31ErrHN5ytZg&sig2=-tfH8_MLiODhg2jqjDVOqQ http://ib.fgov.be/en/ http://www.thefoodworld.com/food-exporters-importers/all/india/ http://www.sallybernstein.com/food/columns/hiremath/hiremath_menu.htm
http://www.globaltrade.net/international-trade-import-exports/f/business/pdf/Belgium/Trade-Policy-EU-27-Food-and-Agricultural-Import-Regulations.html?folderId=48438
http://www.nzte.govt.nz/explore-export-markets/market-research-by-industry/food-and-beverage/pages/food-and-beverage.aspx
Powered by WordPress.com Meeting with Belgium Consul General.pdf Source: Joki Gauthier for Oxfam 2012. For more information on this figure, and to see it
online, visit http://www.behindthebrands.org AF_Processing_Intro.pdf

You may re-use this information (not including logos) free of charge in any format or medium,
under the terms of the Open Government Licence. To view this licence, visit www.nationalarchives.gov.uk/doc/open-government-licence/ or write to the Information
Policy Animal Health and Veterinary Laboratories Agency (AHVLA) : http://www.nationsencyclopedia.com/Europe/Belgium-FOREIGN-
TRADE.html#ixzz2NcCpe54o http://www.defra.gov.uk/food-farm/food/exports/ http://www.fda.gov/medicaldevices/deviceregulationandguidance/importingandexporting
devices/ucm050521.htm Meininger Wine Business International (German) - www.wine-business-interational.com http://www.tradingeconomics.com/belgium/exports http://www.thefoodworld.com/food-exporters-importers/all/india/ http://agriexchange.apeda.gov.in/countrysearchnew/expfrmindia.aspx?ctryid=13033&ctr
yn=BELGIUM&menuid=15 http://www.infodriveindia.com/india-import-data/packed-food-import-data.aspx Meeting with Belgium Consul General.pdf Source: Joki Gauthier for Oxfam 2012. For more information on this figure, and to see it
online, visit http://www.behindthebrands.org AF_Processing_Intro.pdf You may re-use this information (not including logos) free of charge in any format or
medium, under the terms of the Open Government Licence. To view this licence, visit www.nationalarchives.gov.uk/doc/open-government-licence/ or write to the Information
Policy Animal Health and Veterinary Laboratories Agency (AHVLA) http://www.nationsencyclopedia.com/Europe/Belgium-FOREIGN-
TRADE.html#ixzz2NcCpe54o SIGNUP TO: EXPORT DATA| GET FORECAST https://www.awdc.be www.gjepc.org http://www.belgium.be/en/ http://www.oecd.org/belgium/governmentofbelgiumusefullinks.htm https://en.wikipedia.org/wiki/Belgium https://en.wikipedia.org/wiki/Belgium#Geography https://en.wikipedia.org/wiki/Belgium#Economy http://www.diamondland.be/antwerp-diamonds www.dnb.co.in/IndianGemsandJewellerySector/Overview.asp www.nsdcindia.org/pdf/gems-jewellery http://www.indiainbusiness.nic.in/industry-infrastructure/industrial-sectors/gems-jewellery.htm http://technicalsonline.blogspot.in/2011/07/indian-gems-and-jewellery-industry.html http://www.gjepc.org/updates/9039/gem-jewellery-industry

http://business.gov.in/trade/foreign_trade.php http://www.eximbankindia.com http://www.financialexpress.com/news/gems-amp-jewellery-council-seeks-easier-tax-norms/1067600/0 http://www.gjepc.org/news-cat/government http://www.dnb.co.in/IndianGemsandJewellerySector/ForeignTrade.asp http://www.eximguru.com/exim/dgft/exim-policy/2012-2013/chapter_4_duty_exemption_remission_schemes.aspx http://www.brussel.irisnet.be/files-fr/a-propos-de-la-region/competences-
regionales/declaration-gouvernementale-2009-2014/view https://www.cia.gov/library/publications/the-world-factbook/index.html http://europa.eu/abc/12lessons/key_dates/index_en.htm www.pkf.com www.agc.com http://www.agc-group.com http://dgft.gov.in www.investinbrussels.com www.cpivglass.be www.europa.eu http://www.pilkington.com/resources/pfgi2006.pdf]. http://www.pilkington.com/resources/pfgi2007final.pdf]. http://www.saint-gobain.com/en/html/presse/communiques_2000/09.asp http://www.brint.com/IntellP.htm http://www.cptech.org/pharm/belopaper.htm http://www.okuyama.com/index-2.html http://www.questia.com/PM.qst?a=o&d=5000248716 http://www.heritage.org/Research/TradeandForeignAid/BG906.cfm http://hongkong.usconsulate.gov/usinfo/ustr/2000/0501.htmII) http://www.unzco.com/basicguide/c2.html http://www.cbp.gov/xp/cgov/import/ http://www.biztradeshows.com/ http://www.globalsources.com/TRADESHW/TRDSHFRM.HTM http://www.cbp.gov/xp/cgov/import/cargo_control/ftz/about_ftz.xml http://ia.ita.doc.gov/ftzpage/tic.html http://trade.gov/index.asp http://www.lawdog.com/transport/export/custom2.htm http://www.customs.ustreas.gov/ www.tatasteeleurope.com http://www.nationsencyclopedia.com/Europe/Belgium-FOREIGN-
TRADE.html#ixzz269ZCTtcE
http://www.infodriveindia.com/india-export-data/october-2011/chapter-72.aspx
www.asa.in/pdf/surveys.../Iron-and-Steel-Industry-in-India.pdf

www.articlesbase.com/.../import-and-export-business-in-... -
agriexchange.apeda.gov.in/.../INDIAN%20PRODUCTION1.aspx
www.exportersindia.com
www.hotfrog.in/Products/Export-Import/Gujarat
www.wto.org/gatt_docs/English/SULPDF/91720267.pdf http://www.tradingeconomics.com/belgium/balance-of-trade http://www.tradingeconomics.com/india/balance-of-trade http://www.diplomatist.com/dipo1st09/story_13.htm http://ib.fgov.be/en/important_industries/ http://business.belgium.be/en/investing_in_belgium/key_sectors/automotive_sector/ http://business.belgium.be/en/news/news_foreign_investment_attraction.jsp?referer=tcm:
384-187187-64 http://business.belgium.be/en/investing_in_belgium/three_attractive_regions/ http://unctad.org/en/PublicationsLibrary/wir2012_embargoed_en.pdf Business.belgium.be http://business.belgium.be/en/belgium_in_figures/economic_indicators/gross_national_pr
odut/ http://business.belgium.be/en/investing_in_belgium/three_attractive_regions/ http://business.belgium.be/en/investing_in_belgium/ http://business.belgium.be/en/investing_in_belgium/reasons_to_invest/infrastructure/ http://business.belgium.be/en/investing_in_belgium/about_belgium/made_in_belgium/ http://business.belgium.be/en/investing_in_belgium/about_belgium/made_in_belgium/ http://www.oecd.org/economy/outlook/44089863.pdf http://ib.fgov.be/en/important_industries/ http://ib.fgov.be/en/environment/
www.worldbank.org.in/
www.rbi.org.in/
www.tradingeconomic.com/
www.belgium.org.in/

REFERENCES
Belgium-January-2012.pdf
indian_machine_tools_industry.pdf
Manufacturing-Sector-Profile.pdf
Dr. Mohammad Shafi; “Indo-Belgian Trade Relations:
Towards diversification beyond diamonds”; Arabian Journal of Business and
Management Review (OMAN Chapter) Vol. 1, No.7; February 2012; (2012)
http://www.eximguru.com/exim/trade-agreement/india-eu-strategic-partner
tradoc_122567.pdf
Aksoy, A.(1991), ‘The Indian Trade Regime’, Policy Research Working Paper # 989, The World Bank, Washington DC. Aksoy. A. and F.M. Ettori (1992), ‘Protection and Industrial Structure in India’ Policy Research Working Paper # 990, The World Bank, Washington DC Alexander, P.C. (1977), Report on the Committee on Import-Export Policies and Procedures, Ministry of Commerce, Government of India. Bhagwati, J.N. (1965), ‘On the Equivalence of Tariffs and Quotas’ in Baldwin, R (ed.) (1989), Trade, Growth and The Balance of Payments’ North Holland, Amsterdam ( Rand McNally and Corporation, Chicago). Bhagwati, J.N. and T.N.Srinivasan (1975), Foreign Trade Regimes and Economic Development: India, NBER, NewYork. Chadha, R. (2000), ‘The Decade of India’s Economic Transformation: Impact Analysis of Unilateral and Global Changes in Trade Policy,’ Paper presented at the Conference to Honour Professor K.L.Krishna, Centre for Development Economics, Delhi School of Economics, Dec20-22. Chelliah, R.J. (1992), Tax Reforms Committee: Final Report, Parts 1 & 2, Government of
India. Corden, W. M. (1974), Trade Policy and Economic Welfare, Clarendon Press, Oxford. Deardorff, A. (1987), ‘Why do Governments Prefer Non-tariff Barrier?’, Carnegie- Rochester Conference Series on Public Policy, 26, 191-216. Deardorff, A. and R. Stern (1999), Measurement of Non-tariff Barriers, University of Michigan Press, Ann Arbor. Gang, I.and M.Pandey (1998), ‘What was Protected? Measuring India’s Tariff Barriers 1968-1997,’ Indian Economic Review, Vol. xxxiii, No.2, 119-152. Greenaway, D. (1988), ‘Evaluating the Structure of Production in Less Developed Countries in D.Greenway (ed.) Economic Development and International

Trade, Macmillan, London. Greenaway, D. and C. Milner (1993), Trade and Industrial Policy in Developing Countries- A Manual for Policy Analysis, Macmillan, London. Goldar, B.N., A.V.L.Narayana and S.N.Hasheem (1992), ‘Structure of Nominal Tariff Rates in India’ , Studies in Industrial Development, Office of the Economic Advisor, Ministry of Industry, Government of India. Goldar,B.N. and S.N.Hasheem (1992), ‘India’s Tariff Structure: Effective Rates of Protection of Indian Industries,’ Studies in Industrial Development, Office of the Economic Advisor, Ministry of Industry, Government of India. Goldar,B.N. and S.N.Hasheem (1994), ‘Study of India’s Tariff Structure: Effect of Tariff Protection on Domestic Industries,’ Studies in Industrial Development, Office of the Economic Advisor, Ministry of Industry, Government of India. Goldar, B.N. and V.S. Renganathan (1990), ‘Economic Reforms and R&D Expenditure in Industrial Firms in India,’ Indian Economic Review, Vol.46, No.2, 60-75. Hasheem, S.N. (2001), Protection in Indian Manufacturing: An Empirical Study, Macmillan India Ltd, Delhi. Hussain, Abid (1984), Report of the Committee on Trade Policies, Ministry of Commerce, Government of India. Johnson,H.G. (1960), ‘The Costs of Protection and Scientific Tariff,’ Journal of Political Economy, 68,327-345. Joshi, V. and I.M.D. Little (1994), India’s Economic Reforms 1991-2001, Oxford University Press, Delhi. Krueger, A. O. (1981), ‘Interactions between Inflation and Trade Objectives in Stabilization Programs ‘in Cline, W. and S. Weintraub (ed), Economic Stabilization in Developing Countries, Brookings Institution, Washington DC. Krueger, A.O. (1984), ‘Trade Policies in Developing Countries’ in Jones, R.W and P.B.Kennen (ed.) Handbook of International Economics, Vol-1, Elsevier Science Publishers. Meade, J. (1951), The Theory of Commercial Policy, Vol-1: The Balance of Payments, Oxford University Press, Oxford. Mehta, R. (1997), ‘Trade Policy Reforms, 1991-92 to 1995-96: Their Impact on External Trade’, Economic and Political Weekly, April 12, 779-784. Mehta, R. and S.K Mohanty (1999), WTO and Industrial Tariffs: An Empirical Analysis for India, Research and Information System for the Non-Aligned and
Other Developing Countries, Delhi.


