
APRJ-699 A Methodology for Setting Contingency Reserves Using Probabilistic Cost Risk Analysis in
Small To Medium Construction Projects
1
A Methodology for Setting Contingency Reserves Using Probabilistic Cost Risk
Analysis in Small To Medium Construction Projects
Supervisor: Steve Johnson
Word Count 19521
Presented by
Jeremy Hobbs
April 30, 2010.

APRJ-699 A Methodology for Setting Contingency Reserves Using Probabilistic Cost Risk Analysis in
Small To Medium Construction Projects
2
ABSTRACT As one of the largest budget expenditures of k-12 school districts, capital construction represents
one of the ‘riskiest’ endeavours for organizations that are relentlessly risk-averse. Faced with a
roster of decaying schools, the Ontario Government has injected enormous capital funding into the
system; the number of projects is up and so is the expectation that projects will be delivered on-
time and within budget.
In many cases, however, school districts lean on small design and construction staffs, with too many
projects and too little project management experience to ensure a conscious, systematic approach
to project risk. Historically, the approach to managing risk in “large” school construction projects,
which generally cost in the tens of millions of dollars, involved allocating a standard contingency
reserve to the project, amounting somewhere between 5% and 10% of total project cost. The actual
amount was based on past practice and bore little relationship to the actual uncertainty in a
project. Contingency reserves were often seen as buffers for hiding errors or failure to adequately
specify project components or worse, as a ‘bank account’ from which scope expansions could be
funded once underway. With the recent revelation that unused contingency reserves may be
‘clawed back’ into the Provincial treasury, there is no longer any incentive for having excessively
large contingencies attached to a project. Furthermore, no matter how comprehensive a risk
management program that is put in place, contingency reserves of some size will likely always be a
part of tactics for managing uncertainty. There is now a new impetus for making contingency
reserves “the right size” for the job at hand. The challenge is setting the magnitude of the reserves.
In the past twenty years, with the advent of desktop computing power, the approach to setting
contingency reserves for large projects has shifted to a probabilistic model in which risks are
described as probability distribution functions (PDFs) rather than as static values. The intent of this
approach is to develop a more informed view of the uncertainty in a project, which can then be
used as the basis for developing risk management tactics. However, such an approach has
historically been the domain of analysts on extremely large capital projects outside of k-12
education.
This paper, therefore, examines how probabilistic methods can be used to develop a ‘right sized’
contingency model that connects an explicit understanding of the risks facing a project with the
magnitude of the contingency reserve. In addition to providing a review of the literature on
construction risk; approaches for determining contingency reserves and a review of the Monte
Carlo simulation approach, the paper proposes a methodology for setting contingency reserves that
is suitably straightforward for smaller projects typical of a k-12 school district.

APRJ-699 A Methodology for Setting Contingency Reserves Using Probabilistic Cost Risk Analysis in
Small To Medium Construction Projects
3
TABLE OF CONTENTS
Abstract ......................................................................................................................................2
Introduction ................................................................................................................................5
Purpose of the Study ...................................................................................................................6
Research Questions .....................................................................................................................7
Literature Review ........................................................................................................................8
Risk in Construction Projects ...................................................................................................8
The Nature of Risk ...............................................................................................................8
Analyzing Risk ......................................................................................................................9
Risk Assessment ................................................................................................................12
Risk Management ..............................................................................................................13
Project Cost Contingencies ....................................................................................................14
Overview ...........................................................................................................................14
Methods for Contingency Determination ..........................................................................16
Monte Carlo Simulation.........................................................................................................21
Literature Review: Conclusions..............................................................................................26
Research Design ........................................................................................................................28
Developing a Contingency Allocation Model for the UCDSB ......................................................29
The Characteristics of an Effective Approach .........................................................................29
The Proposed Methodology ..................................................................................................31
Introduction ......................................................................................................................31
Prerequisites .....................................................................................................................32
Step 1: Risk Assessment.....................................................................................................37
Step 2: Risk Allocation .......................................................................................................41
Step 3: Cost Risk Analysis ...................................................................................................43
Step 4: Contingency Calculation ........................................................................................45
Assessing the Effectiveness of the Proposed Methodology .......................................................48
An Approach for Study ..........................................................................................................48

APRJ-699 A Methodology for Setting Contingency Reserves Using Probabilistic Cost Risk Analysis in
Small To Medium Construction Projects
4
An Informal Test ....................................................................................................................49
Discussion of Test Results ......................................................................................................50
Conclusions Arising from the Test .........................................................................................53
Subjects for Further Study .........................................................................................................54
Risk Evolution ........................................................................................................................54
Contingency Drawdown ........................................................................................................54
Representing Correlation between Risks ...............................................................................55
Integrated Schedule and Cost Risk Assessment .....................................................................55
Recommendations ....................................................................................................................57
Conclusions ...............................................................................................................................58
Appendix 1: Detailed Risk Breakdown Structure for Large Construction Projects ......................60
Appendix 2: Risk identification table for test case (vankleek hill collegiate institute) .................63
Works Cited ..............................................................................................................................64
APRJ-699 A Methodology for Setting Contingency Reserves Using Probabilistic Cost Risk Analysis in
Small To Medium Construction Projects
5
INTRODUCTION
The Upper Canada District School Board (UCDSB) is a geographically large school district in
Eastern Ontario, with 90 schools, 4000 staff and 30,000 students scattered across 12,000
square kilometers. Like many public bodies across North America that are charged with
maintaining a roster of physical facilities, the UCDSB is facing a pattern of broad decay in the
condition of its schools, as evidenced by an estimated $250 Million backlog in required
maintenance and upgrade activities.
Within the UCDSB, the Facilities Department is charged with two main tasks: the day to day
maintenance and operations of the physical facilities, which includes custodial support, as well
as Design and Construction, which involves major renovation and new construction projects.
The Design and Construction department consists of only 6 project managers, none of whom
are professional engineers. Historically, Design and Construction Projects had, until 1998, been
funded through local taxation and the discretion of the elected Board of Trustees. However, in
1998, that changed as the Provincial Government removed this taxation authority from local
Boards and began funding Boards according to a common formula. In the intervening eight
years, construction projects were therefore funded by the Ministry of Education but because
construction costs regularly exceeded the available funding, additional funding was allocated by
the Board out of regular operating budget to support these problems.
The problem for the UCDSB began in 2006, when a series of regulation changes placing
constraints on how Boards allocated their available operating budgets, made it increasingly
more difficult to supplement Provincial capital funding with ‘local’ operating budget. Coupled
with the introduction of capital accounting provisions through the implementation of Public
Sector Accounting Board (PSAB) accounting standards, this shrinking flexibility has served to
shine a bright and unforgiving light on a pattern of large project cost overruns. The project
which best exemplifies this pattern is the Russell High School (RHS) construction project which,
conceived in 2003 and completed in 2009, ultimately cost almost 55% over the ‘approved’
budget of $11M, coming in at over $17M.
In examining the root causes of this phenomenon, it quickly became obvious that the overriding
issue was a lack of attention to the drivers of project cost risk. On the RHS project, some of the
major failures that contributed to cost overruns involved incomplete understanding of
geological conditions of the site; failure to completely specify major architectural and
mechanical elements; a long time lag between substantial completion of design and the start of
construction, raising the requirement to make last minute design changes to keep up to code;

APRJ-699 A Methodology for Setting Contingency Reserves Using Probabilistic Cost Risk Analysis in
Small To Medium Construction Projects
6
the selection of a construction management contracting approach and finally, the introduction
of many customer change orders without appropriate controls.
This said, in the intervening time most of these risks have been identified and strategically
mitigated or eliminated. However, one of the major risk management strategies – the use of
contingency reserves – remains largely unexamined with the UCDSB retaining its traditional
(and sadly, typical) arbitrary approach to setting their size. This has become problematic for
several reasons:
Unnecessarily large contingency reserves eat into the available budget for building and
equipping a school, meaning that elements may be sacrificed that enhance functionality
or improve efficiency.
Architect’s fees are calculated based upon the anticipated contract price plus
contingency, meaning an artificially large contingency reserves also artificially inflate
architect’s fees, further eroding the budget available for ‘bricks and mortar’
In the new era of education capital funding, contingency funds unused at the end of a
project are ‘recaptured’ by the Ministry of Education and not only can no longer be
applied to the project, but are lost entirely by the Board.
In an environment in which historical practice is to allocate up to 10% of the anticipated
contract price to contingency reserves, this can mean well over a million dollars is diverted
away from “bricks and mortar” and in fact, if Design and Construction staff are extremely
effective in managing project risks, this amount may be lost altogether.
Recognizing that contingency reserves will remain and important means of managing
uncertainty in a project, it is obvious that a more informed means of allocating contingency
reserves is needed.
PURPOSE OF THE STUDY
The purpose of this study, therefore, is to develop a potential approach to sizing the
contingency reserve for construction projects in the UCDSB that explicitly takes into account
the risks facing the project as well as decision-makers’ level of risk tolerance. Such a
methodology must be sufficiently rigourous to produce a view of project risks and their effect
on budget so that contingency reserves can be sized reasonably but also simple enough that
the overall approach is suitable for the scale of projects and skills of personnel in the UCDSB.
The intended effect is to reduce the pressure to determine the ‘correct’ point estimate and
instead focus upon the underlying cost drivers, their potential range of values and

APRJ-699 A Methodology for Setting Contingency Reserves Using Probabilistic Cost Risk Analysis in
Small To Medium Construction Projects
7
consequently, an informed range for the overall estimate. The results and benefits of such an
approach include:
An improved understanding among staff of the drivers of cost, the range of potential
values for those cost drivers, and the actions staff may take to affect the actual value
within the range. In other words, there will be an understanding of cost risks, the
probability and severity of those risks and the repertoire of strategies for managing
those risks.
Decision-makers will have a more thorough understanding of the range of cost
outcomes and the drivers of those outcomes in selecting and prioritizing projects.
Staff and decision makers will be able to set the value of contingency funds in a way that
is informed by a deeper assessment of cost risk and their own comfort level
Improved communication about project costs and risks will lead to improved
satisfaction with project performance.
RESEARCH QUESTIONS
The research proposal, which will be principally conceptual in nature, will be focused principally
within the domain of project management. The following are proposed as research questions:
1. What are the necessary components and attributes of a system that connects project
risks with the sizing of a contingency reserve?
2. How can these effective practices be combined into a system that is sufficiently
rigourous and yet simple enough to be of practical utility in the UCDSB?

APRJ-699 A Methodology for Setting Contingency Reserves Using Probabilistic Cost Risk Analysis in
Small To Medium Construction Projects
8
LITERATURE REVIEW
RISK IN CONSTRUCTION PROJECTS
In order to arrive at a superior approach for the allocation of contingency compared to the
traditional, “crystal ball” method, it is clear from the literature that an explicit link between
project risk and contingency must be made. However, making this connection is by no means
entirely straightforward.
THE NATURE OF RISK
Although the actual wording for definitions of risk vary widely, virtually all definitions concur
that the term risk refers to an uncertain future event that will have a (usually) negative effect
on the objectives for a given project. The Project Management Institute (2000, p. 127) provides
a typical two-dimensional definition of risk which is, “an uncertain event or condition that, if it
occurs, has a positive or negative impact on a project objective.” More typically, the two-
dimensional nature of risk is described using the terms “probability” and “impact”.
Probability itself refers to, “a value between zero and one, inclusive, describing the relative
possibility (chance or likelihood) an event will occur” (Lind, Marchal, & Wathen, 2005, p. 141).
The impact, on the other hand, obviously refers to the “extent of what would happen if the risk
materialized. “ (Hillson & Hulett, 2004, p. 1) and at least with respect to cost risks, is usually
expressed in currency.
While it may be relatively straightforward to assess the impact of a risk in the context of a
project, it is often much more difficult to assess the probability of the risk event coming to
fruition. One major reason for this is that even among projects that are strikingly similar (e.g.
the construction of two similar schools), there are literally thousands of variables that
determine project cost. In other words, projects are unique and therefore while difficult soils
conditions may have been encountered on one project, it may offer little insight into the
likelihood of encountering difficult soils conditions on the next. In many cases, the probability
of a risk is simply unknowable. As a result, risk analysis is often an almost entirely subjective
exercise that is disquieting for technical professionals accustomed to certainty.
In a construction project, as with virtually any type of project, the overall project risk declines as
the project nears completion. This makes intuitive sense; as more becomes ‘known’ about the
effort, the amount of risk, or uncertainty, dries up. Figure 1 illustrates this concept by
demonstrating the declining uncertainty in project cost estimates as construction projects
progress through the earliest conceptual stages toward completion.

APRJ-699 A Methodology for Setting Contingency Reserves Using Probabilistic Cost Risk Analysis in
Small To Medium Construction Projects
9
FIGURE 1: CHART ILLUSTRATING DECLINE IN ESTIMATING VARIANCE THROUGH STAGES OF PROJECT COMPLETION (MOSELHI, 1997, P. 2)
0
10
20
30
40
50
60
Original Concept
Process Design
Complete
Basic Engineering
Complete
Detailed Engineering
Complete
Mechanical Erection
Complete
Financial Completion
Pro
bab
le A
ccu
racy
of
Esti
mat
e (
+/-
)
Project Definition Stages
ANALYZING RISK
Figure 1 clearly illustrates that though risk declines through the various stages in a project, it is
an entity that must be managed up until the minute the project financials are settled. The
challenge, however, is what constitutes management of something as nebulous as risk? The
literature is rife with management approaches, but generally, these approaches all
acknowledge that risk management is an continuous, cyclical process and that it generally
consists of phases of risk identification, analysis, planning, response or implementation and
review (Noor, 2002; Project Management Institute, 2000; Zacharias, Panapoulos & Askounis,
2008.

APRJ-699 A Methodology for Setting Contingency Reserves Using Probabilistic Cost Risk Analysis in
Small To Medium Construction Projects
10
FIGURE 2: GENERIC RISK MANAGEMENT CYCLE
Because risk tends to be a nebulous concept, especially for technical project personnel not
accustomed to dealing with it, simply identifying risks can be a daunting and frustrating task.
This can be made more so if project staff are working in an environment in which there are
powerful cultural forces resisting the discussion of risk and all its negative connotations.
Risks in any project can be known, unknown or unknowable (Carr, Konda, Monarch, Ulrich, &
Walker, 1993, p. 7). Known risks are those that project staff can identify as a concern or
potential issue, even if they do not understand them to be risks per se. Unknown risks refer to
those that are not understood to be risks but that can be elicited from staff through a
facilitative process. Those risks that are unknowable cannot be identified or characterized by
project staff. Obviously, if the mission of technical staff in a project involves managing
uncertainty, then it is essential that a rigourous risk identification process is in place to ensure
as few risks as possible remain unknown or unknowable.
Risk identification is a process that is generally facilitated in a team environment and can be
conducted using such strategies as simple brainstorming, nominal grouping, mind mapping, the
Delphi technique or by reviewing past projects for sources of risk (Crepin-Swift, 2009). Once the
initial challenge of developing an understanding of risk is conquered, however, the volume of
information becomes overwhelming and it becomes difficult to know where to focus effort or
attention. In response, several authors, have proposed the use of a Risk Taxonomy (Carr,
Konda, Monarch, Ulrich, & Walker, 1993), or a hierarchical analog to the Work Breakdown
Identify
Analyze
Plan
Implement
Review

APRJ-699 A Methodology for Setting Contingency Reserves Using Probabilistic Cost Risk Analysis in
Small To Medium Construction Projects
11
Structure, called the Risk Breakdown Structure or RBS (Chang Hak, Sang Bok, Yang Kue, Seo
Young & Hyun Suk, 2008; Chapman, 2001; Hillson D., 2002; Panthi, Ahmed & Ogulana, 2009;
Sonmez, Ergin & Birgonul, 2007). In the same way that a work breakdown structure (WBS)
breaks an overall initiative down into a hierarchically-arranged series of tasks in order to make
work both explicit and manageable, the RBS is designed to structure and make understandable
the risks to a project.
An RBS can be defined generically, to fit any project or class of project, or it can be tailored to
explicitly fit one specific project. Once defined, an RBS can be an invaluable tool on several
fronts: first, an RBS can be used as part of the facilitative process in risk identification, by
helping structure the dialogue and especially, to spur conversation around risks that are
“unknown” by the project team. The RBS can also be used for the subsequent phase of
quantitatively assessing risk, for benchmarking the risk profile of one project against others and
as a framework for organizing the management response to project risks (Hillson D. , 2002).
TABLE 1: SAMPLE RISK REGISTER (RBS) FOR HYDROPOWER PROJECT (PANTHI, AHMED, & OGULANA, 2009, P. 84)
Risk Driver Risk
Changes in the Work
Construction Delay
Delayed Site Access
Availability of Resources
Damage to Persons or Property
Defective Design
Cost of Tests and Samples
Quantities of Work
Inflation
Funding
National and International Impacts
Productivity of Labour
Productivity of Equipment
Suitability of Materials
Defective Work
Conduct Hindering Performance of Work
Labour Disputes
Accidents
Delayed Dispute Resolution
Delayed Payment on Contract and Extras
Change Orders
Insolvency of Contractor or Owner
Subsurface conditions of geology
Subsurface conditions of groundwater
Acts of God
Environmental issues
Regulations
Public Disorder
Political and Social
Construction Related
Financial and Economic
Performance Related
Contractual and Legal
Physical

APRJ-699 A Methodology for Setting Contingency Reserves Using Probabilistic Cost Risk Analysis in
Small To Medium Construction Projects
12
TABLE 2: SAMPLE RISK BREAKDOWN STRUCTURE FOR A GENERIC CONSTRUCTION PROJECT (HILLSON D. , 2002)
Level 0 Level 1 Level 2 Level 3
Planning Approval Delay
Legislation Changes
Ecological Constraints
Other
Increase in Competition
Change in Demand
Cost/Availability of Materials
Other
Client representative fails to perform duties
No single point of contact
Client team responsibilities i l l defined
other
Inadequate project management controls
Incorrect balance of resources and expertise
PM team responsibilities i l l defined
Other
Project objectives i l l defined
Project objectives changed mid design
Conflict between primary and secondary objective
other
Late requirement for cost savings
Inadequate project funding
Funds availability does not meet cashflow forecast
Other
Brief changes not confirmed in writing
Change control procedure not accepted
Unable to comply with design sign off dates
Other
Poor team communication
Changes in core team
Inadequate number of staff
Other
Cost control
Time control
Quality control
Change control
Site
Design
Project Risk
Tactics
Team
Tactics
Task
Environment
Industry
Client
Project
Statutory
Market
Client
Team
PM Team
Targets
Funding
RISK ASSESSMENT
The next step in the risk management cycle, once the major risks to the project have been
characterized, involves quantitatively assessing the risks. Again, there seems to be only generic
consensus in the literature on precisely how to go about quantifying risks, but this consensus
not surprisingly involves characterizing risks by their potential impact and their probability of
occurrence. As will be discussed further below, impact of a given risk is generally characterized
in dollars. Probability, on the other hand, is a more complicated subject and can be framed

APRJ-699 A Methodology for Setting Contingency Reserves Using Probabilistic Cost Risk Analysis in
Small To Medium Construction Projects
13
deterministically, which generally involves a static percentage figure that is determined
subjectively. The other major approach is probabilistic in which risks are described as a
probability distribution. The consensus of the literature seems to be a strong preference for a
probabilistic approach to the assessment of the risk and it has in fact become part of a the
recommended practice of the Association for the Advancement of Cost Engineering (Hollman,
2008).
The assessment of “probability” however presents its own difficulties. First and most obviously,
the quantification of probability must come from technical staff themselves who may not have
a clear understanding of probability concepts themselves. Often, the “riskiest” projects are
those that are unique or that have major components that are novel or untried. With no
experience or comparator projects to judge risk, the margins for estimating error are wide. This
challenge of estimating the probability of unforeseen and perhaps unexperienced events is also
vulnerable to human estimating bias (Hillson & Hulett, 2004, p. 2). The factors that influence
human perception of risk include their familiarity with the source of risk; the perceived
manageability of the risk (the more controllable a risk “seems” to be, the less probable or
impactful it seems) and, the proximity and propinquity of the risk, which refers to how closely
the risk would impact the person assessing it (Hillson & Hulett, 2004, p. 3). Generally speaking,
these perceptual factors conspire to ensure that most assessors of risk tend to radically
underestimate both the impact and probability of even those risks that they have personally
identified (Hillson & Hulett, 2004, p. 3). Simply stated, though quantitative methods for
assessing risk offer the promise of greater certainty, they are ultimately highly vulnerable to the
limitations of human perception.
The one major refinement that appears to be gaining traction in discussions of risk assessment,
is the need for connecting risk drivers with actual project budget line items (Hulett,
Hornbacher, & Whitehead, 2008). Historically, risks – if managed at all – tended to itemized and
managed without an explicit connection to the means by which they influenced budget line
items. In other words, risks may have been quantified individually but their impact on the
project budget could only be understood in aggregate. Now, the move is to describe risks
probabilistically, link them explicitly to individual budget line items so that they can be more
effectively managed and monitored.
RISK MANAGEMENT
Once project risks are identified and comprehensively assessed, it becomes possible to make a
plan for proactively managing them. The Project Management Institute categorizes responses
to risks into four major categories (Project Management Institute, 2000):

APRJ-699 A Methodology for Setting Contingency Reserves Using Probabilistic Cost Risk Analysis in
Small To Medium Construction Projects
14
1. Mitigation strategies involve reducing the probability or impact of the risk itself.
2. Avoidance strategies involve changing the structure of the project so that the risk will
not be encountered at all.
3. Transfer strategies involve “moving” the risk onto another entity. Using a stipulated
price contract is a way of moving cost uncertainty onto a contractor, often at the cost of
an increased price.
4. Acceptance strategies involve, as expected, acknowledging risks, their impact and their
probability and devising means to accommodate them.
Though a complete discussion of all of these strategies is beyond the scope of this study, a
comprehensive risk management plan for any project will likely make use of all four. Especially
early on in a construction project, ‘risky’ alternatives like those requiring environmental
remediation or demolition may be avoided; the risk of poor workmanship may be mitigated by
prequalifying acceptable bidders; the risk of fluctuations in contract prices may be transferred
by choosing to adopt a fixed or stipulated price contract. Finally, those risks that remain
unknown, unknowable or not subject to any alternate management approach may have to be
accepted.
Acceptance of risk, however, does not have to mean blind surrender. First, it is important to re-
emphasize that through the identification and assessment process, it is hoped that most
unknown or unknowable risks would be eliminated and as a result, those that must be accepted
can be done consciously, with at least a reasonable view into their probability and impact.
Second, for risks that impact cost and schedule but that cannot be otherwise managed,
contingency reserves of time and budget may be allocated at the start of the project so that if
the risks come to fruition, the project or worse, the wider organization, is not jeopardized.
PROJECT COST CONTINGENCIES
OVERVIEW
According to Patrascu (1988) contingency is the “most misunderstood, misinterpreted and
misapplied word in project execution. Contingency can and does mean different things to
different people.” Generally, contingency is generally defined as the source of funding for
unexpected events (Gunhan & Arditi, 2007, p. 492).
The Association for the Advancement of Cost Engineering (AACE) defines contingency as, “An
amount added to the estimate to (1) achieve a specific confidence level, or (2) allow for
changes that experience shows will likely be required.” (Hollman, 2008, p. 1). More specifically,
there are specific attributes to cost contingency (Baccarini D. , 2006, p. 2):

APRJ-699 A Methodology for Setting Contingency Reserves Using Probabilistic Cost Risk Analysis in
Small To Medium Construction Projects
15
1. Cost contingency is a reserve of money
2. The amount of money available as a cost contingency at any time in the project is a
function of the cost risks associated with the project at that time
3. From the perspective of decision makers, the inclusion of contingencies within the
overall project budget means that the budget reflects the total financial
commitment they are prepared to make to cover the known and unknown elements
of the project. Contingencies therefore should reflect actual risks to the project
budget as well as decision-makers own comfort level with risk.
4. The contingency affects the behavior of stakeholders to the project: set too high and
the project may look unappealing to decision-makers or sponsors and therefore a
valuable opportunity may be passed up. Set too low and decision-makers may
choose to undertake a project without full understanding of the risks, which exposes
the larger organization should costs exceed the estimate. Stakeholders to projects
can also tend to view the contingency as a ‘slush fund’ from which they can fund
discretionary changes to the project, which defeats the purpose of the fund.
Contingency funds are necessary in order to ensure the smooth completion of design and
construction, with no risk to the project caused by a lack of available funds. However, the funds
tied up by contingency reserves can prevent the parties to the project from undertaking other
important projects. It is therefore important that enough contingency is allocated to deal with
unexpected events, without allocating so much that other opportunities are jeopardized by an
excessively conservative stance.
In construction, there are two main types of generally accepted contingency reserves that are
commonly allocated (Gunhan & Arditi, 2007, p. 493).
Designer Contingency is included in the pre-construction stage and allows for
potential cost increases that occur through the detail design phase of a construction
project. For example, such a contingency may be used to account for uncertainties
in the design of the mechanical systems for a building. Typically, as the design phase
progresses, these unknowns become known and the designer contingency can
therefore by systematically ‘absorbed’ into the individual budget line items for the
project.
Contractor Contingency is included in the construction budget to cover unexpected
events that may occur during actual construction, such as weather-related delays
and surprises with soils conditions. One of the typical ways to control these risks is
to enter into a stipulated-price contract in which the contractor absorbs
APRJ-699 A Methodology for Setting Contingency Reserves Using Probabilistic Cost Risk Analysis in
Small To Medium Construction Projects
16
responsibility for construction risks in return for an expected price premium. This is
the standard approach for public school construction in the UCDSB, but even so,
opportunities for price increases remain if the owner (and their consultants) have
not been thorough with design and specification.
In addition, owners may also elect to include another project contingency to cover
uncertainties in project-related “soft costs” such as furniture and equipment, consultant’s fees,
permits and other line items outside the construction contract itself. In school construction,
these items often amount to 10% or more of the overall construction budget and therefore
merit attention as well.
METHODS FOR CONTINGENCY DETERMINATION
The methods used for contingency estimation are generally divided into Deterministic and
Probabilistic classes (Moselhi, 1997, p. 80), in which deterministic methods - most traditionally
employed - involve the simple assignment of a percentage contingency based upon the
estimate of project cost or based upon subcomponents of project cost. Traditionally in the
UCDSB and more widely , this “Crystal Ball” method for contingencies has been used (Moselhi,
1997, p. 2) which involves setting a “blanket” percentage, usually between 5% and 10% of total
project cost (Moselhi, 1997, p. 2) to cover contingencies. However, the critical limitation of that
model is that it is overly simplistic and fails to explicitly acknowledge the underlying project
risks that drive the need for contingency in the first place and therefore exposes the
organization to the problem of either radically overcompensating for risk or more likely, of
radically underestimating risk (Kamalesh, Ahmed, & Ogunlana, 2009, p. 80). Simply stated, “the
conventional method of contingency allocation is in danger of being overly simplistic and too
heavily dependent on an estimator’s faith in his or her own experience” (Yeo, 1990)
To quantify the problem with this “Crystal Ball” methodology Baccarini (2004) conducted an
analysis of 48 roads projects completed by the Australian government and found that these
projects allocated an average contingency of 5.24% of the award contract value, but that the
average actual variations in the final construction cost was 9.92% (Baccarini D. , 2004, p. 12). In
other words, the contingency allocated was, on average 47% too little to cover the actual
variance in construction costs. Second, he also found that there was no relationship between
the magnitude of contingency allocated at the start of construction and the ultimate variance in
construction cost. Simply stated, there was no evidence that the contingency reserves for these
projects managed successfully to acknowledge the actual risks inherent in the projects.
Other methods that rely predominantly upon deterministic methods include the “Expected
Value Method” (Mak & Picken, 2000) and the Method of Moments. These values differ most

APRJ-699 A Methodology for Setting Contingency Reserves Using Probabilistic Cost Risk Analysis in
Small To Medium Construction Projects
17
obviously from the “Crystal Ball Method” in that rather than treating all project risks in
aggregate and assigning a dollar value to cover all of them, both the Expected Value Method
and the Method of Moments identify individual risks to the project and attempt to quantify
them. The combined value of these individual risks can then be aggregated and a contingency
derived using a number of approaches. If the chief problem with traditional contingency
allocation models is, as Baccarini (2004) observed, a complete disconnection between the
magnitude of contingency and the magnitude of risk to the project, then a more complete view
of project risk seems like a worthwhile place to begin building a more informed approach to
contingency.
In the Expected Value method, individual risks to the project are identified, along with their
impact value (in dollars) and the probability of their occurrence. Generally, risks are classified
into two broad types: fixed and variable. Fixed risks represent risks that either occur or don’t
(e.g. in a recent UCDSB project, a hydro service upgrade amounting to $500,000 was going to
be required or not, in which case the cost would be $0). Variable risks are those that will occur
in some degree (e.g. site remediation of some amount between $100,000 and $1,000,000). For
each risk, the maximum and “average” risk value is calculated with the contingency
representing the sum of the average values of individual risks. This specific approach to
contingency setting by Expected Value was outlined by Mak and Picken (2000) in their process
called Estimating using Risk Analysis (ERA). In Mak and Picken’s study, the accuracy of
contingencies for ERA projects were found to be significantly superior to non-ERA projects with
contingencies set using the traditional “Crystal Ball” method.
The approach known as “Method of Moments” (Yeo, 1990) further extends the Expected Value
approach by expanding the role of probability in the calculation of individual risks, although it
falls short of the pure stochastic process like Monte Carlo simulation because it lacks the
element of randomness. In this method, rather than simply calculating an ‘average’ and a
‘maximum’ value for each individual risk, each cost element is given minimum, most likely and
maximum values (a triangular distribution). For each cost item, the expected value (EV) is
calculated simply as an average of the maximum, most likely and minimum values. The
standard deviation of the cost elements is calculated and assuming the total project cost (the
sum of EV for individual cost elements) follows a normal distribution, z scores can be used to
find contingency at a given level of confidence. For example, if the “most likely” or “expected
value” of a project is $20M, and the calculated standard deviation (based upon the individual
cost elements) is $1M, then in order to have a 90% confidence interval, the contingency would
have to be set so that the overall project budget is 1.3 standard deviations higher than the
mean or at approximately $1.3M.

APRJ-699 A Methodology for Setting Contingency Reserves Using Probabilistic Cost Risk Analysis in
Small To Medium Construction Projects
18
The advantage of the Method of Moments offers many of the same advantages as the ERA or
Expected Value approach over the traditional “Crystal Ball” method: it disaggregates
contingency into a more granular format and thereby attempts to construct a more cause-and-
effect relationship between risk and contingency. One advantage this method has over the
Expected value approach is that the final project cost is at least approximately described as a
continuous probability distribution rather than as a static figure. This helps senior decision
makers recognize the inherent variability of construction costs, even in the most highly
specified and tightly managed project. It also helps decision-makers set contingency reserves
based upon their preferred risk tolerance; rather than setting a contingency as an arbitrary
percentage of construction costs, it can be set so that there is a given probability that the
overall project cost will fall below budget. In many respects, this is a concept that is easier for
senior, non-technical executives to understand.
On the other hand, the method of moments can represent a step backward from the ERA
approach because it focuses on project cost elements rather than on risks and their effect.
According to Hulett (Hulett, Hornbacher, & Whitehead, 2008, p. 4) “we want to know which
risks are important to guide risk responses. Instead, we find out which line items are
important.” In other words, the risk of a late start to construction, for example, may affect
several budget line items. However, in the Method of Moments approach, the connection
between the actual risk and its effect on cost is lost; all that remains is the variability in the cost
of the line item. While this provides insight into the overall cost, it is not helpful in
understanding the most impactful risk drivers, nor does it guide the analyst on how best to
manage the risk. Simply stated, while allocating contingency in response to risk may be a
legitimate risk management tactic, a better approach for the overall organization may be to
mitigate or eliminate the risk altogether.
In contrast to deterministic methods which allocated contingency in a lump sum allowance by
percentage, probabilistic methods involve assigning probability distribution functions to project
cost components and then, through a summative process, developing a probability distribution
function for the overall project cost itself. It is testament to the extent that probabilistic
methods have penetrated cost engineering practice that the AACE itself includes a risk analysis
and probabilistic approach to contingency estimating among its recommended practices
(Hollman, 2008, p. 3), but these methods have been slow to be adopted due to their perceived
complexity (Sonmez, Ergin, & Birgonul, 2007, p. 35).
Probabilistic methods have been broken down into independent and correlated methods,
which were discussed as potential limitations of Monte Carlo simulation specifically in the

APRJ-699 A Methodology for Setting Contingency Reserves Using Probabilistic Cost Risk Analysis in
Small To Medium Construction Projects
19
preceding section. Generally, the literature concurs that though correlated methods are
significantly more complex to model, the broad assumption that cost components are
independent, random variables tends to lead to significant underestimation of required
contingency where correlations are predominantly positive (Moselhi, 1997, p. 4). In other
words, as Wall (1997, p. 241) indicated, approximating some level of correlation is a
significantly greater factor in ensuring the accuracy of Monte Carlo simulation than the choice
of probability distributions for individual cost components.
Both independent and correlated approaches are themselves broken down into direct and
simulated approaches, with direct approaches relying on techniques such as the central limit
theorem and variations (PERT), while Monte Carlo is the most widely used of the simulation
methods and will be discussed further below.
FIGURE 3: METHODS USED IN CONTINGENCY ESTIMATION (MOSELHI, 1997, P. 80)
In all probabilistic method, the contingency is set as the difference between the ‘expected
value’ of the project, which is often set as a baseline estimate or even at the median of the
overall project cost probability distribution ( (Kamalesh, Ahmed, & Ogunlana, 2009, p. 87), and
the desired “comfort level” of decision makers. For example, a project sponsor may intuitively
Methods
Deterministic
Overall Value
Item by Item Value
Probabilistic
Independent
Direct
Pareto Principle (80/20) rule
PERT
Simulation (Monte Carlo)
Correlated
Direct
Simulated

APRJ-699 A Methodology for Setting Contingency Reserves Using Probabilistic Cost Risk Analysis in
Small To Medium Construction Projects
20
wish for 100% likelihood that the project will come in within budget, but in all likelihood, this
would lead to an excessive contingency fund. As a result, project sponsors may choose an
alternate confidence level based upon the overall project cost probability distribution that
achieves a better balance of confidence and affordability.
FIGURE 4: SAMPLE CUMULATIVE PROBABILITY DISTRIBUTION CURVE FOR A SCHOOL CONSTRUCTION PROJECT ILLUSTRATING THE
CONTINGENCY RESERVE AS THE DIFFERENCE BETWEEN THE POINT ESTIMATE FOR THE PROJECT AND THE ESTIMATED PROJECT COST AT 95%
CONFIDENCE. ADAPTED FROM (HULETT, PROJECT COST RISK ANALYSIS, 2002, P. 7)
Though Moselhi (1997) provided the most concise taxonomy for the various methods of
contingency estimating, there are several other emerging techniques that were also identified.
These include regression analysis, which depends to a large extent on processing large sets of
actual data, fuzzy set theory; artificial neural networks (Baccarini D. , 2006) and Analytical
Hierarchy Process (Kamalesh, Ahmed, & Ogunlana, 2009). Even Moselhi (1997, p. 4) proposed

APRJ-699 A Methodology for Setting Contingency Reserves Using Probabilistic Cost Risk Analysis in
Small To Medium Construction Projects
21
an alternate direct correlated model whose chief advantage was simplicity. The detailed
discussion of all of these methods is, however, beyond the scope of this review.
MONTE CARLO SIMULATION
The greatest degree of uncertainty is encountered early in the life of a new project, when
virtually all decisions remain to be made and all events, whether consciously executed or
unexpected surprises, remain to occur. (Smith, Merna, & Jobling, 2006, p. 80) Traditionally,
construction cost estimates have been “point-in-time” estimates that represent a single value
for the cost of a project and its elements, which can lead to miscommunication among
designers, project managers, funders and decision-makers. Traditional point estimates,
especially those delivered early on in the project impart a false sense of accuracy because they
are not capable of describing the wide variability that can occur as risks and opportunities
unfold. For many years, this limitation has been understood,
“it seems that if estimates are to be used as adequate cost indicators and even
cost control tools, their probabilistic nature must be recognized and they must
be expressed not as absolute numbers but in terms of a number with some
indication of the magnitude of the risk that that number may be expected to
change by some stated amount” (Picardi, 1972, p. 3).
Methodologies designed to establish the probabilistic nature of an estimate begin the same
way as a traditional estimate: the breakdown of the overall cost into component elements.
However, rather than describing each cost component in an estimate with one value, the
probabilistic approach sets first to describe each cost element as a probability distribution.
Ostensibly, the probability distribution for any given cost element would describe all of the
actual values achieved for that cost element if the exact same project were conducted many
different times. For example, in the construction of a school, the cost of “metals” may be
described by a lognormal distribution curve, in which variation of costs may be a result of the
commodity costs, profit margins, transportation costs and many other elements dependent on
the specific context for a project. However, these both the data informing the distributions as
well as the choice of distributions themselves are rarely based upon objective and empirical
(Chau, 1995, p. 369). In fact, some sources argued that in order for the technique to be
practically useful, it is necessary to rely more solely on the “gut feeling” (Smith, Merna, &
Jobling, 2006, p. 90) because the scale and scope of the simulation itself makes further
precision irrelevant. In all cases, after the cost structure is identified, the probability
distributions and defining parameters (such as mean, standard deviation, or simply upper and
lower limits) must be defined for each cost element.

APRJ-699 A Methodology for Setting Contingency Reserves Using Probabilistic Cost Risk Analysis in
Small To Medium Construction Projects
22
Subsequently, Monte Carlo simulation is applied which essentially represents repeating the
“construction” of the Project through a very large number of trials (between 1000 and 10,000)
in which a value is chosen for each cost component based upon the shape and parameters of
the probability distribution. For any given trial, all of the chosen values for the individual cost
components are added or otherwise mathematically combined for a “project cost”. This
process is then repeated for the remaining trials and a probability distribution based upon the
overall project cost is generated. However, though the complexity of the probabilistic method
offers the superficial appearance of rigour and precision, like any other system, the quality of
the results is related to the quality of the inputs.
The first major “input” into a probabilistic model for construction costs (aside from the
subjectivity of data lies in the probability distributions chosen to represent the individual cost
components. The @Risk Monte Carlo simulation software that comprises part of Palisade
Corp’s DecisionTools suite contains no fewer than 31 continuous and 8 discrete probability
distributions that an analyst can choose from and yet it is commonly acknowledged (Chau,
1995, p. 370) that due to its simplicity, it is often the simple triangular distribution that is most
commonly employed, to the detriment of the end estimate. However Smith, Merna and Jobling
(2006, p. 91) contended that this very simplicity is necessary precisely because the
quantification of risk is often being attempted at the time in a project (the beginning) when
there isn’t enough information available to more thoroughly characterize the risk.
However, it seems the consensus on proabability distributions for construction cost, is that the
triangular and in fact most symmetrical distributions are inadequate for describing construction
risk. This is due largely to the fact that (Chau, 1995, p. 376): the triangular distribution tends to
underestimate the uncertainty in the cost component variables. In other words, it reinforces
the widely held (Smith, Merna, & Jobling, 2006, p. 90) criticism of subjective approaches to risk
analysis that even the most expert analysts are far too conservative in their assessment of the
uncertainty in any variable: in other words, even the best estimators often woefully
underestimate the best and worst case scenarios.
Though the triangular distribution is justifiably popular due to its ease of use, more frequently
represented is the lognormal distribution which was cited as a preferred model by Picardi in
1972 (p. 4).

APRJ-699 A Methodology for Setting Contingency Reserves Using Probabilistic Cost Risk Analysis in
Small To Medium Construction Projects
23
FIGURE 5: SAMPLE LOGNORMAL DISTRIBUTION
His rationale seems almost too simple and reflects the underlying subjectivity of the overall
methodology, “this assumption is based on intuition and empirical observations: costs are
always greater than zero, costs are more likely to increase than decrease, and a three-
parameter lognormal distribution offers great flexibility in fitting data to it.” This was conclusion
was further supported by Chau (1995, p. 377), Wall (1997, p. 246) using the statistical method
of testing curve fitting supported by the chi-square test. Hulett, after initially advocating the
Triangular Distribution precisely for being understandable by the project personnel often asked
to provide inputs to the risk analysis (2002, p. 4), changed his recommendation later on to
advocate the Trigen distribution (Hulett, Hornbacher, & Whitehead, 2008, p. 14). The rationale
for the use of the Trigen distribution is that it represents an enhancement over the Triangular
distribution in that it offers the analyst the opportunity to set a confidence interval, with the
result of partially compensating for experts’ tendency to underestimate the extremities of a
cost or risk (Salling, p. 10). Figure 6 and Figure 7 illustrate this difference; for both, “experts” set
minima and maxima to -10 and 10 respectively. The triangular distribution treats these as the
absolute bottom and top of the distribution, whereas the trigen distribution treats these as 10%
and 90% confidence intervals, respectively, making the actual minimum and maximum -18 and
+18. Generally, it seems that with over 31 distributions to choose from, the analyst is best
advised to choose the approach that best matches the available data as well as the analyst and
the experts’ own skill sets.
Pro
bab
ility
Cost Outcome

APRJ-699 A Methodology for Setting Contingency Reserves Using Probabilistic Cost Risk Analysis in
Small To Medium Construction Projects
24
FIGURE 6: TRIANGULAR DISTRIBUTION WITH MINIMUM, MAXIMUM AND MEAN OF -10, 10 AND 0 RESPECTIVELY
FIGURE 7: TRIGEN DISTRIBUTION WITH INPUT MINIMUM, MAXIMUM AND MEAN OF -10, 10 AND 0. TRIGEN FUNCTION “CONVERTS” MIN
AND MAX TO 10% AND 90% CONFIDENCE INTERVALS.
Pro
bab
ility
P
rob
abili
ty
Cost Outcome
Cost Outcome

APRJ-699 A Methodology for Setting Contingency Reserves Using Probabilistic Cost Risk Analysis in
Small To Medium Construction Projects
25
In addition to the choice of the probability distributions chosen to represent the various cost
components, another frequently-cited concern with Monte Carlo simulation is the assumption
that all of the cost components or system variables are independent. Monte Carlo simulation
selects values for all cost components independently and randomly based upon their individual
assigned probability distributions. As an example, a value for the cost of masonry could be
chosen at the high end of the distribution, whereas for the same simulation a value at the low
end of the finishes distribution could be chosen. In the real world, these two variables may be
slightly or even strongly correlated so that if one is a higher value, the likelihood that the other
will also be a higher value is also stronger. In fact, Wall (1997, p. 241) argued that, “the effect
of correlations is more significant than the effect of the choice…of distributions”, an
observation that is shared by Isidore, Back and Fry (2001, p. 419) in their discussion of the
relationship of schedule risk to cost risk and also shared by Chau (1995, p. 371).
The solution outlined by Wall (1997, p. 248) is to develop a correlation matrix that related the
cost component variables together so that values chosen by the Monte Carlo software in the
course of a simulation are appropriately correlated. This, however, makes the rather large
assumption that correlations are at least subjectively understood, when in fact they may be
more elusive than the probabilistic cost range for any individual element alone. Further, Isidore,
Back & Fry (2001) point out the even more difficult nature of combining probabilistic models for
schedule and work and then correlating those elements. For example, in a construction project,
delays in the schedule may correlate to increased costs due to inflation, penalties or overtime
and yet the relating the elements of time and cost seem yet more difficult and untested than
relating individual elements of cost. Furthermore, it seems that the software tools for
performing such correlation are nonexistent or at least primitive. Generally, the problem of
correlation is one that intuitively and empirically is a significant one, and yet the added
complexity of further subjective judgments about correlations seems to create a deeper illusion
of precision.

APRJ-699 A Methodology for Setting Contingency Reserves Using Probabilistic Cost Risk Analysis in
Small To Medium Construction Projects
26
LITERATURE REVIEW: CONCLUSIONS
The review of the literature has both confirmed the continued, widespread use of the arbitrary
‘crystal ball’ method for setting construction project contingencies as well as its complete
inadequacy. This is a significant problem because, set too low relative to overall project risk and
the project itself may be threatened when all available funding has been tapped to address
unforeseen circumstances. Set too high and contingency reserves lock away funds that could be
better applied to other initiatives (Gunhan & Arditi, 2007, p. 492). Perhaps the most stinging
indictment of the traditional percentage approach to contingencies was Baccarini’s (2004)
statistical analysis of contingencies in Australian roads projects that demonstrated no
correlation between perceived project risk and the magnitude of contingency. However, it is
one thing to point out the gross inadequacy of one method for determining contingency, but
quite another to propose an alternate approach. So what are the characteristics of an improved
approach to setting contingency?
The first point of consensus for improving the approach to setting contingency is the need to
connect the magnitude of the contingency reserve with the magnitude of project risk. Project
risks need to be first characterized qualitatively using a structured, hierarchical model such as a
risk taxonomy or risk breakdown structure (RBS). Such a taxonomic approach allows the
facilitated risk analysis discussion among project experts to be highly structured, more focused
and more thorough; it provides a basis for ‘rolling up’ risks into categories for macro analysis; it
provides a ready-made structure for risk reporting throughout the project lifecycle and finally, it
provides the standard structure needed to benchmark projects against each other and
ultimately improve the organization’s ability to manage risk.
Second, both the probability and impact of project risks need to be also described
quantitatively in order to ultimately understand the potential financial impact on the project.
Risks can be quantified deterministically, in which they are assigned “static” numerical values,
or they can be described probabilistically, in which they are assigned probability distributions.
Probabilistic methods hold most promise for quantifying risk and impact because they better
describe the inherent uncertainty of risk. In other words, if the probability of occurrence of a
risk was ‘known’, it wouldn’t really be uncertain.
Third, contingency should be scaled both to the overall magnitude of risk on a given project.
There are several approaches to accomplishing this: the expected value method, for example,
tends to sum the expected values of individual risks calculated by multiplying their estimated
impact by their estimated probability. The sum of these expected values represents the
contingency, or at least the starting point for determining the contingency. The method of
APRJ-699 A Methodology for Setting Contingency Reserves Using Probabilistic Cost Risk Analysis in
Small To Medium Construction Projects
27
moments approach, on the other hand, attempts to approximate each cost line item as a
probability distribution and by summing, achieve an approximation of a normal distribution for
the overall project cost. Using z scores, the contingency requirement at a given confidence
interval can be found. The problem with both of these methods is first, that they are both
deterministic and therefore don’t represent the true spectrum of risk impacts as
comprehensively as a probabilistic approach; second, they operate on either individual risks or
individual costs in isolation – there is no explicit connection between individual risks and
individual costs.
Fourth, due to the explosion in desktop computing power over the past two decades, software
is now easily available that can perform the enormous volume of calculations needed for a true
probabilistic analysis. Though many means are available for computationally assessing risk,
Monte Carlo simulation offers an attractive approach because it does not rely on enormous
amounts of actual project data in the way neural networks or linear regression models do. As a
result, with the informed opinion of expert project staff and a readily available software tool
like Palisade’s @Risk, Monte Carlo simulation of risks and project costs is now within the reach
of much smaller organizations.
With risks assessed and connected to project cost line items and with the project cost described
as a probability curve, it is essential that contingency funds be allocated both in response to
overall project risk and to the organization’s appetite for uncertainty; that is, its ability to
accommodate cost overruns in excess of the contingency amount. Simply stated, the higher the
risk and the lower the risk tolerance, the higher the contingency reserve required. If the
underlying purpose of project management is effective communication, then such a process
will ensure that senior decision makers and project stakeholders can make more informed and
conscious decisions, informed by a much more comprehensive view of their project and the
risks associated with it.
This said, while the literature does outline the shortcomings and advantages of some
methodologies for setting project contingencies, very little attention is paid to the fundamental
challenge of the need for widespread subjectivity in the assignment of data to even the most
rigorous model. With Monte Carlo simulation specifically, the cost structure identified, risks,
probability distributions, parameters, correlations and a host of other variables that are chosen
subjectively and largely independently all play a significant role in the resulting project
probability distribution. Finally, very little evident attention has been given to the approach for
setting the “baseline project budget” plus the risk comfort level that determines the

APRJ-699 A Methodology for Setting Contingency Reserves Using Probabilistic Cost Risk Analysis in
Small To Medium Construction Projects
28
contingency fund. These are items that will be proposed as a standard methodology within the
UCDSB contingency setting methodology.
RESEARCH DESIGN
The goal of the research is to develop a proposed methodology for setting contingency values
for large scale construction projects in the UCDSB. The result will be a hybrid paper which
includes the following:
1. Review of the literature focusing on the following elements:
a. Risk in construction and approaches for managing it
b. Contingency reserves and approaches for setting them
c. Probabilistic methods for estimating risk and cost
d. Conclusions regarding the characteristics of a methodology for setting risk-
informed contingencies that would be appropriate for the UCDSB
2. An outline of the proposed methodology which will include a comprehensive overview
of an integrated approach for assessing risk in construction projects; quantitatively
ascertaining its impact on project budget line items and for using probabilistic tools to
generate alternative contingency budgets.
An ethics review for the project is not required because all data collected is publically available
corporate data collected in the course of normal business.

APRJ-699 A Methodology for Setting Contingency Reserves Using Probabilistic Cost Risk Analysis in
Small To Medium Construction Projects
29
DEVELOPING A CONTINGENCY ALLOCATION MODEL FOR THE UCDSB
THE CHARACTERISTICS OF AN EFFECTIVE APPROACH
Largely due to the perceived complexity of the approach, the use of probabilistic methods for
the allocation of contingency reserves have historically been the domain of very large, capital
intensive projects costing in the hundreds of millions of dollars (Heon Han & Hyung-Keun,
2004). However, smaller organizations running smaller projects need to employ probabilistic
methods for exactly the same reasons as larger organizations; these, “smaller” projects also
incorporate substantial risk to the organizations and as such, it needs to be understood not as a
static entity, but as an entity whose impact varies under a range of conditions. For these
organizations, like the UCDSB, however, probabilistic methods must be simplified so that they
can be conducted by a small staff, without the benefit of mathematics background and so they
can be presented simply to the decision-makers that must act on the data. To this end, the
following are the desired characteristics of a suitably simple probabilistic contingency allocation
model for the Upper Canada District School Board.
1. End-to-End Connection from Risk to Contingency: The chief limitation of the UCDSB’s
current approach to contingency allocation is that it is, frankly, uninformed. There is
simply no definable link between the magnitude of the contingency allocation and any
understanding of the risk that ostensibly drives it. As a result, the first and most
significant requirement is that there must be an explicit mathematical connection
between risks that are identified and the magnitude of the resulting contingencies. This
connection will be used to prioritize risks as a first step in the overall risk management
approach for projects.
2. The Use of “Standard” Structures for Defining Cost and Risk: Anecdotally, most UCDSB
staff that would be participating in risk and cost analyses have relatively little
background in either risk, finance or statistics. UCDSB staff generally have difficulty
enumerating the uncertain events that may unfold, at least unless until these
unwelcome events are imminent. A risk breakdown structure (RBS) and standard cost
structure will be of enormous importance for facilitating a discussion to list risks and
assess their impact. While these structures will need to be sufficiently detailed to
adequately describe the project, they will also need to be sufficiently simple to be
effective with the time and skills available.
3. Probabilistic Model: It is probably no surprise that at this stage of the study a
probabilistic approach is recommended as the most effective approach for the new
methodology. However, the deterministic methods of Expected Value and particularly

APRJ-699 A Methodology for Setting Contingency Reserves Using Probabilistic Cost Risk Analysis in
Small To Medium Construction Projects
30
Method of Moments actually come close, in some respects to approximating a true
probabilistic model. In fact the proposed methodology will draw upon elements of these
methods, particularly the approach of directly quantifying individual risks in the EV
model and the summation of individual probability distribution functions that the
Method of Moments approximates. These methods alone would be suitable for a more
simple approach, except for the fact that with the advent of suitable software and easily
accessible computing power, there is little computational hurdle to making the jump
from Method of Moments to Monte Carlo. As a result, a true probabilistic approach is
warranted.
4. No Requirement for Large Data Sets: Some of the most advanced approaches to
probabilistic contingency models, like artificial neural networks, fuzzy set analysis and
linear regression techniques rely on the availability of large, detailed sets of project data
to make forecasts about project contingencies. Unfortunately the UCDSB simply does
not build enough schools in order to generate the data that would be required for such
an approach. Furthermore, detailed school construction data for other Boards across
the Province is simply not available, or at least not in a format that would be useful for
analysis. Furthermore, it would seem that the ‘uniqueness’ and ‘independence’ of
individual projects from one another would make drawing conclusions based on a
pattern of study difficult or misleading. As a result, the probabilistic approach used
within the UCDSB would have to make use of the estimations of project and subject
matter experts. For this reason, Monte Carlo simulation represents a logical approach.
5. Integration of the Point Estimate: Though the contention of this study is that reliance on
the traditional “point estimate” for construction cost is inadequate for managing the
many project variables that threaten a successful outcome, the fact remains the point
estimate is and will be both a valuable source of data and a reporting requirement
within the k-12 education system. Rather than attempt to dismiss or compete with the
point estimate (which represents the informed opinion of expert cost consultants and
architects), the proposed methodology will make use of the point estimate as an
integral part of the process.
6. Simplified Probability Distributions: Again, anecdotally, virtually no participants in
current UCDSB construction projects have deep backgrounds in quantitative risk analysis
or even mathematics. As a result, it would be unreasonable to assume that risk
assessment workshops could be conducted with highly technical discussions of
probability distribution functions (PDFs), measures of variance and other statistical
concepts without losing the interest of participants or the quality of their input. Simply
stated, the precision gained by taking a more technical approach could be more than

APRJ-699 A Methodology for Setting Contingency Reserves Using Probabilistic Cost Risk Analysis in
Small To Medium Construction Projects
31
offset by poor quality of input caused by the confusion of the participants. For this
reason, the choice of probability distributions should be few, and they should be able to
be described with parameters that are readily understandable to project staff.
7. Few Specialized Tools: Because budget, time and available skills are limited, the
methodology must make use of relatively few specialized tools. As a result, Excel 2007
will be the principal data collection tool for the study, which is installed on all 9000
UCDSB desktop PCs, with Palisade’s @Risk 5.5 used only for Monte Carlo simulation.
THE PROPOSED METHODOLOGY
INTRODUCTION
After considering the preferred characteristics of contingency allocation model for the Upper
Canada District School Board’s construction projects, a “four step” process is proposed that
consists of the following major elements, summarized in

APRJ-699 A Methodology for Setting Contingency Reserves Using Probabilistic Cost Risk Analysis in
Small To Medium Construction Projects
32
Figure 8 below:
1. Risk Assessment: includes activities related to qualitatively identifying the risks that are
applicable to the project, characterizing them as fixed or variable risks and
quantitatively expressing their impact and probability as probability distribution
functions (PDFs).
2. Risk Allocation: involves identifying which individual risks apply to which individual cost
line items and to what extent the risks apply/
3. Cost Risk Analysis: involves calculating the financial impact of each individual risk on
each individual cost line item, summing these into risk PDFs for each cost line item and
ultimately, into a single, risk-adjusted PDF representing total project cost. Monte Carlo
simulation is then run in order to generate a cumulative probability curve representing
the range of total risk-adjusted project costs.
4. Contingency Analysis: Using the cumulative probability curve, the total, risk-adjusted
cost of the project at 50%, 60%, 70%, 80%, 90% and 100% confidence intervals is
determined. For each confidence level, the difference between the risk-adjusted total
project cost and the base project cost (or point estimate) is calculated as the
contingency reserve for that level.
5. Decision: The decision on the contingency should be handled through project
governance and will be consistent with the organization’s appetite for risk, or in other
words, its ability to weather overruns in cost beyond the contingency reserve.

APRJ-699 A Methodology for Setting Contingency Reserves Using Probabilistic Cost Risk Analysis in
Small To Medium Construction Projects
33
FIGURE 8: SUMMARY OF PROPOSED UCDSB PROBABILISTIC METHODOLOGY FOR DETERMING CONSTRUCTION CONTINGENCY
PREREQUISITES
Prior to initiating the very earliest steps of the contingency allocation model, it is essential that
the team that will be conducting the contingency analysis is prepared with a few basic
prerequisites.
1. Project Organization: Contingency allocation, especially in projects that are highly visible
and very important for the enterprise, is not a function that can be performed in
isolation. If some of the goals of a new model for contingency allocation include
improved awareness of project risks and their implications; better alignment between
the overall business context and the risk management strategies of major projects, and
better overall transparency, then it is essential that project governance structures and
roles are in place prior to these decisions. While the topic of project governance is
beyond the scope of this report, in the UCDSB major construction projects are overseen

APRJ-699 A Methodology for Setting Contingency Reserves Using Probabilistic Cost Risk Analysis in
Small To Medium Construction Projects
34
by a steering committee that is formed in the earliest stages of the project. This group is
composed of the Board’s CFO, the executive responsible for Facilities, the executive
responsible for the school(s) in question and the Chair of the Board and the Trustee for
the school. In the UCDSB it will be the domain of the project team to actually conduct
the contingency analysis, but it will be the responsibility of the Steering Committee to
set the desired contingency based upon their chosen confidence level, informed by the
business context for the wider organization.
2. Point Estimate: An independent point estimate for the construction project that is the
best available estimate at the time the risk analysis is conducted is required. First, in the
construction world, the point estimate still represents the standard approach for
estimating construction costs and is required even if the Board internally takes a
probabilistic approach; Second, point estimates are delivered periodically throughout
the project development process and are developed by independent cost analysts that
therefore represent a highly informed ‘opinion’; Third, probabilistic methods require a
‘base’ or ‘most likely’ estimate and the point estimate will perform this function. For the
purposes of the contingency analysis, it may seem obvious but it is still worth pointing
out that the point estimate should not contain any contingency funds that the estimator
may have thought to include. Any good estimate is going to include assumptions about
the conditions at the time of construction and these assumptions should, where
possible, be made explicit.
3. Standard Comprehensive Cost Structure It is essential, however, that the point estimate
be delivered in a standard format. A standard format comprises a series of cost line
items that are common for similar construction projects and that is simplified
sufficiently in order to be useful in the risk process. Often, cost estimates provided by
third parties are elemental – they list project costs very precisely, often down to
individual fasteners and items like hand dryers. While this provides for a very thorough
point estimate, attempting to characterize and apply risk to every ‘element’ of such an
estimate would be near-impossible and not consistent with the UCDSB’s need for
simplicity. As a result, the standard cost structure includes aggregated line items for
construction by division, but also includes elements that the third party point estimate
would not, namely, the ‘soft costs’ of a project like furniture and equipment, architect
and consultant fees, permits and other elements outside of construction ‘proper’. The
standard structure will provide the basis for allocating individual risks to cost line items
and ultimately, will allow the risk profiles for a project at different stages to be
compared. Table 3 below represents a standard cost structure used by the UCDSB for
construction projects.

APRJ-699 A Methodology for Setting Contingency Reserves Using Probabilistic Cost Risk Analysis in
Small To Medium Construction Projects
35
TABLE 3: SAMPLE STANDARD CONSTRUCTION PROJECT COST STRUCTURE USED IN UCDSB
Class A Estimate
February 2009Post Tender Budget
Construction Tender Budget
Divis ion 1: Genera l Requirements 996,000.00$
Divison 2: Si tework 1,959,246.00$
Divis ion 3: Concrete 776,919.00$
Divis ion 4: Masonry 1,211,002.00$
Divis ion 5: Metals 1,260,627.00$
Divis ion 6: Wood 346,746.00$
Divis ion 7: Thermal and Moisture 1,094,263.00$
Divis ion 8: Doors and Windows 620,650.00$
Divis ion 9: Finishes 960,161.00$
Divis ion 10: Specia l ties 314,230.00$
Divis ion 14: Conveying Systems 45,000.00$
Divis ion 15: Mechanica l 2,441,195.00$
Divis ion 16: Electrica l 1,418,257.00$
Construction Cost Subtotal 13,444,296.00$ 12,064,245.00$
Overhead and Profi t 5.0%
1.6% Net GST 1.6% 1.6%
Subtotal Construction Tender Budget 14,342,374.97$ 12,257,272.92$
Risk Allowance Budget
Des ign Contingency
Construction Contingency
Subtotal Risk Allowances
Project Cost Budget
Land and Land Acquisition
Land Purchase 27,000.00$ 27,000.00$
Legal 83,050.00$ 64,500.00$
Appra isa ls
Surveys , Assessments and Geotechnica l Studies 19,000.00$ 19,000.00$
Subtotal Land and Land Acquisition 129,050.00$ 110,500.00$
Furniture, Equipment and Infrastructure
Furniture, Equipment and Infrastructure 295,000.00$ 320,000.00$
Securi ty, Alarm and Monitoring Infrastructure -$
Intrus ion Detection System 7,000.00$ 7,000.00$
Survei l lance System 23,400.00$ 23,400.00$
Access Control System 102,000.00$ 102,000.00$
PA, Sound and Lighting, Etc. -$
Publ ic Address Systems -$ -$
Stage Lighting Systems 19,900.00$ 19,900.00$
IT and Telecom Infrastructure -$
IT - Pass ive Subsystem -$ -$
IT - Active Subsystem 13,200.00$ 13,200.00$
Telephony -$ -$
Subtotal Furniture, Equipment and Infrastructure 460,500.00$ 485,500.00$
Demolition and Remediation
Consultant Fees Related to Contract Preparation 30,000.00$
Demol i tion and Remediation of Exis ting VCI 1,100,000.00$ 1,029,755.00$
GST For Demol i tion 16,476.08$
Subtotal Demolition and Remediation 1,100,000.00$ 1,076,231.08$
Facility Design and Engineering
Project Ini tiation Phase Consultant Fees 46,787.00$ 46,787.00$
Cost Consultant Fees 28,362.00$ 28,362.00$
Minis try Advisor Fees
Seismic Engineering 12,000.00$ 12,000.00$
Geotechnica l Studies and Surveying
Construction Materia ls Testing 15,000.00$ 15,000.00$
Roofing Consultant Fees 10,000.00$ 10,000.00$
Architect and Consultant Fees ($) 906,353.00$ 906,353.00$
Subtotal Facility Design and Engineering 1,020,830.24$ 1,018,502.00$
Miscellaneous Project Costs
Hydro Contingency -$ -$
Additional Disbursements 10,500.00$ 10,500.00$
Si te Control Guarantee Annual Maintenance 15,000.00$ 15,000.00$
Si te Control Guarantee -$ -$
Permits and Licenses 27,288.00$ 27,288.00$
Subtotal Misc Project Costs 52,788.00$ 52,788.00$
Subtotal Project Cost Budget 2,763,168.24$ 2,743,521.08$
Total Project Budget 17,105,543.21$ 15,000,794.00$

APRJ-699 A Methodology for Setting Contingency Reserves Using Probabilistic Cost Risk Analysis in
Small To Medium Construction Projects
36
4. Risk Breakdown Structure: For the same reasons a standard cost structure is needed, so
too is a standard risk breakdown structure. At the highest level, the RBS will be common
across construction projects and perhaps even across projects that are technically quite
different (like IT and Construction), however for individual projects as specific risks
emerge (e.g. some projects require environmental site remediation whereas others
don’t), those specific risks can be added to the RBS. Because the UCDSB currently does
not have any kind of RBS, Risk Register or Risk Taxonomy, an RBS has been developed
and proposed for the purposes of this study and is tailored specifically to large scale
construction projects in a k-12 school district. The detailed RBS is included Appendix 1
and summarized below.
It is worthwhile noting that in the act of producing a cost estimate for construction, it is
expected that a competent cost estimator will be aware of certain assumptions made
during the assembly of the estimate: market conditions both in the jurisdiction of the
construction and more widely; trends in commodity costs; the complexities of the
design; the anticipated schedule for construction and other factors will all weigh into
the estimate. The intent of the risk assessment, therefore, is not to duplicate the cost
estimate, but rather to seek out risks to the estimate itself; in simple terms, reasons why
there may continue to be uncertainty in the estimate itself. This distinction has the
effect of simplifying the task for the Client and also avoiding the duplication of a cost
estimator’s assessment of the future.

APRJ-699 A Methodology for Setting Contingency Reserves Using Probabilistic Cost Risk Analysis in
Small To Medium Construction Projects
37
FIGURE 9: PROPOSED UCDSB CONSTRUCTION PROJECT PROJECT RISK TAXONOMY
5. Software Tools: Because the proposed process is math-intensive, of course it makes
sense to have the software tools required to perform the needed calculations. For the
purposes of this methodology, Microsoft Excel 2007 will be used to capture and analyse
all data with the support of Palisade @Risk 5.5 for the purposes of performing the
probabilistic analyses.

APRJ-699 A Methodology for Setting Contingency Reserves Using Probabilistic Cost Risk Analysis in
Small To Medium Construction Projects
38
STEP 1: RISK ASSESSMENT
RISK IDENTIFICATION
Risk identification refers to the process by which individual risks are identified, categorized and
described. In the proposed methodology, the following data will be gathered on each risk
identified in this stage:
i. Name – a short descriptor that makes the risk easily identifiable and understandable to
most project stakeholders
ii. Number – a unique combination of alphabetic and numeric (e.g. 1,2,3 or R1, R2, R3) that
is specific to the individual risk and not used to characterize any other individual risk.
iii. Type – refers to whether the risk is fixed or variable. The expected value approach for
quantifying risk deterministically specifies that not all risks necessarily occur at all. Fixed
risks are those that either occur or they don’t (with probability of each) and when they
do occur, they have a range of effect that can be described with a probability
distribution. An example of a fixed risk might be the risk that the local municipality
requires the school Board to pay for the construction of a traffic circle at an intersection.
There might be a 40% chance this risk will come to fruition and, therefore, a 60% chance
it won’t. On the other hand, variable risks refer to those that are certain to occur but
that impact the project over a range of values. An example of a risk might be
fluctuations in the value of the Canadian dollar.
The proposed approach for gathering this information would be to conduct a workshop of
technical project staff, perhaps including the architects and even the cost consultants in which
the RBS would be used as a basis for a brainstorming session designed to elicit as many risks as
possible without evaluating them. Once an exhaustive list was established, it would be culled
through a group exercise in validating and categorizing risks to be retained, and discarding
those that are redundant or not applicable. Specific risks that have been identified but that are
not already included in the RBS would be added to the appropriate category.
As an enhancement to this step, it may be useful to extend the analogy of the RBS as it
compares to the Work Breakdown Structure (WBS) by including an RBS Dictionary that contains
more explanatory data on each individual risk. The WBS Dictionary described by the Project
Management Institute (Project Management Institute, 2000) is not intended as a book of
definitions but rather to provide detailed background on each work package, including
assumptions, dependencies and other notes. So too could an RBS dictionary provide much
more valuable context to each individual risk that would be useful as the project evolves and
later, for comparing the current project to other benchmarks.

APRJ-699 A Methodology for Setting Contingency Reserves Using Probabilistic Cost Risk Analysis in
Small To Medium Construction Projects
39
RISK QUANTIFICATION
Risk quantification is the process of assigning quantitative values to the risks that have been
identified in the previous step. Though there will appear to be similarities to the deterministic
expected value approach and also to the method of moments approach, this is the point at
which the probabilistic proposed methodology really begins to obviously diverge. Not
surprisingly, the two elements that must be quantified in this step are the impact of the risk and
its probability of occurring.
QUANTIFYING RISK IMPACT
For the purposes of quantification, “impact” of a risk will be taken to mean the effect that
the risk may have on the base or point cost estimate for a given line item. For example, if
the point estimate for sitework is $1M, then a given risk (e.g. unforeseen geologic
conditions) may impact that amount by actually decreasing the cost (low), increasing the
cost (high) and in fact, the project team may feel that the most likely scenario is even
somewhat different than the point estimate.
The impact of an individual risk is quantified probabilistically by describing it with a trigen
distribution. The rationale for choosing the trigen distribution, as described earlier and
supported by Hulett (Hulett, Hornbacher, & Whitehead, 2008) is for both its simplicity
and for the fact that it somewhat compensates for the propensity of even the most
informed technical experts to underestimate the extremities of a risk impact.
The source of information for quantifying impact may vary. In many respects, such as
impact of a risk that additional traffic controls may need to be constructed, there may be
sources of data within or outside the organization that can inform the decision. On the
other hand, the impact of some risks like geological conditions or even weather may be
unknowable and therefore may rely on an educated guess. Wherever possible, the
assessment team should rely on actual data from previous or similar projects in order to
assess the impact of risks.
The trigen distribution requires the assessment team to enter three parameters for
impact: the low impact, the most likely impact and the high impact. The format for these
parameters is a percentage. In other words, the project team may decide that the best
case scenario is that the risk of unforeseen geological conditions may decrease the cost
by 5% in which case they would enter -5.0% or -0.05 for the low estimate. For each risk,
similar entries are made for the most likely case and the high case.

APRJ-699 A Methodology for Setting Contingency Reserves Using Probabilistic Cost Risk Analysis in
Small To Medium Construction Projects
40
Again, because the intent of using the trigen distribution is to simplify the risk assessment
process, it is expected that the project team members will understand these three
parameters in non-statistical terms. In other words, “worst case scenario”, “best case
scenario” and “most likely scenario” are terms that will replace the technically more
accurate statistical terminology. Though the team members will perceive the “worst case”
and “best case” figures they have provided as the absolute upper and lower limits of the
risk, in fact the use of the trigen distribution substitutes these figures as the 10% and 90%
confidence intervals by default, meaning the lower and upper absolute limits are
significantly lower and higher respectively. In this way, the trigen distribution attempts to
“correct” for managers predisposition to underestimate the extremities of risk.
Once the parameters for the individual risk impacts have been entered, in another
column the risk impact can be described with a trigen probability distribution which is
available in @Risk 5.5 as an Excel function. Figure 10 below illustrates a sample trigen
distribution describing the impact of the risk of “Geological Issues” on a fictional project.
In this distribution, the “best case” was defined as -5% of the base estimate, however it
can be easily seen that by substituting this intuitive figure as the 10% confidence interval,
the lower bound actually becomes approximately -23% and the upper bound +75%.
Because these figures represent such a dramatic departure from the lower and upper
bounds that the assessment team identified, it may ultimately be necessary to ‘tune’ the
distribution by deviating from the 10% and 90% confidence intervals.
FIGURE 10: ILLUSTRATION OF TRIGEN DISTRIBUTION FOR GEOLOGICAL ISSUES RISK IMPACT WITH LOWER LIMIT OF -5%, MOST LIKELY
IMPACT OF +10% AND HIGH IMPACT OF +50% AT 10% AND 90% CONFIDENCE RESPECTIVELY.
Pro
bab
ility
Cost Outcome

APRJ-699 A Methodology for Setting Contingency Reserves Using Probabilistic Cost Risk Analysis in
Small To Medium Construction Projects
41
QUANTIFYING RISK PROBABILITY
If the brainstorming of risks and the assessment of their potential impact may seem a
frustratingly ambiguous exercise for technical staff, then the assessment of the
probability of individual risks can only seem even more so. Especially in an environment,
like the UCDSB, that has never engaged in a formal risk assessment process, not only is
their precious little hard data to draw upon for discussions of probability, but the lack of
experience dealing with risk and probability in general makes estimation a difficult
exercise. As a result, though it would be appealing to call upon experience or better yet,
historical data, it is anticipated that probability assignments will be made by intuition
informed by the best available information.
Risks in the UCDSB methodology will be categorized as fixed (either happens or it doesn’t)
or variable (100% probability of occurrence). For variable risks, the assignment of
probability is straightforward: it is 100%. For these types of risks, it is the impact PDF that
introduces variance in the project cost.
For fixed risks, project staff will assign a static probability of the risk occurring. For
example, in the construction of Vankleek Hill Collegiate Institute (VCI), early on in the
design phase it was uncertain whether a local hydro service would need to be upgraded
and the decision was at the discretion of the local utility. This was therefore a fixed risk –
either the utility would decide it needed to be upgraded (in which case the estimated
impact was $500,000) or they would decide it didn’t need to be upgraded. The
assessment of the probability of the “yes” decision was largely subjective because so little
design of the mechanical and electrical components of the facility had been completed.
As a result, it was initially determined to calculate probability at 60% likelihood of
occurrence. Once the probability of the fixed risk occurring is established, it is easy
enough to calculate the probability of it not occurring. If the probability of the fixed risk is
P(f), then the probability of the risk not occurring is simply 1-P(f). In the case of the
Vankleek Hill high school, the probability of not requiring a hydro service upgrade was
40% (or 100%-60%).
The probability of fixed risks is then described using Palisade @Risk in Excel as a discrete
probability function. Discrete probability functions describe scenarios in which outcomes
are a series of distinct values rather than a continuous range of values and are described
by an x-table (a list of the possible values) and a p-table (the probability of each individual
value). In the case of fixed risk, the possible values are simply “yes, it occurs” and “no, it
doesn’t occur” which can together be represented mathematically by the x-table, {1,0}. In

APRJ-699 A Methodology for Setting Contingency Reserves Using Probabilistic Cost Risk Analysis in
Small To Medium Construction Projects
42
the case of the Vankleek Hill example, the p-table would represent the probabilities of
either requiring a hydro upgrade or not and would be represented mathematically as
{0.6,0.4}.
Once both the impact of individual risks and their probabilities have been quantified, the
“overall risk” is calculated for each individual risk by multiplying the impact PDF for each
risk by the probability PDF for each risk. As an example, the Excel and @Risk formula that
would generate the Overall Risk value for the fixed risk of “Geological Issues” would be:
Overall Risk=RiskDiscrete({1,0},{0.6,0.4})×RiskTrigen(-0.05,0.1,0.5,10,90)
Table 4 below demonstrates the key data that will be captured in the risk assessment
process and how it would be represented in Excel. It is important to note that for columns
represented as PDFs, only a static value representing the mean value for that PDF is
shown and therefore doesn’t reflect the overall risk picture – this can only be
demonstrated after a Monte Carlo simulation is run.
TABLE 4: EXCERPT FROM RISK IDENTIFCATION TABLE SUMMARIZING RISKS, RISK PROBABILITY, RISK IMPACT AND OVERAL RISK. NOTE THAT
COLUMNS THAT ARE REPRESENTED BY PROBABILITY DISTRIBUTION FUNCTIONS (RISK-ADJUSTED PROBABILITY, RISK-ADJUSTED IMPACT AND
OVERALL RISK) SHOW ONLY STATIC VALUES AND ARE NOT REPRESENTATIVE OF THE MATHEMATICAL RISK.
STEP 2: RISK ALLOCATION
With risks itemized and quantified, the next step in the process lies in determining which
individual risks in the RBS apply to which individual line items in the standard cost structure
format of the most recently available point estimate, and to what extent. This step, like all
Overall
Risk PDF Type OccuringNot
Occuring
Risk-Adjusted
Probability of
Occurence
LowMost
LikelyHigh
Risk-
Adjusted
Impact
Risk
1 Unfami l iari ty with des ign Trigen V 100.0% 0.0% 100% -0.05 0.02 0.05 0.28% 0.28%
2 Lack of Independence Trigen V 100.0% 0.0% 100% -0.01 0.01 0.01 0.07% 0.07%
3 Lack of Capabi l i ty or Experience Trigen V 100.0% 0.0% 100% -0.02 0.00 0.01 -0.43% -0.43%
4 Incomplete speci fication Trigen V 100.0% 0.0% 100% -0.10 0.00 0.15 2.15% 2.15%
5 Technica l Requirements Change Trigen F 10.0% 90.0% 0% -0.05 0.00 0.01 -1.73% 0.00%
6 Voluntary changes to scope or speci fication Trigen F 30.0% 70.0% 0% 0.01 0.05 0.07 4.14% 0.00%
7 Project Type Trigen F 100.0% 0.0% 100% -0.02 0.00 0.04 0.86% 0.86%
8 Site Conditions Trigen V 100.0% 0.0% 100% -0.05 0 0.10 2.15% 2.15%
9 Connections to Services – Water Trigen V 100.0% 0.0% 100% -0.01 0 0.02 0.43% 0.43%
10 Connections to Services – Sanitary Trigen V 100.0% 0.0% 100% -0.01 0 0.02 0.43% 0.43%
11 Connections to Services – Hydro Trigen V 100.0% 0.0% 100% -0.01 0 0.01 0.00% 0.00%
12 Connections to Services – Heating Fuel Type Trigen V 100.0% 0.0% 100% -0.01 0 0.015 0.21% 0.21%
13 Connections – Transportation Trigen V 100.0% 0.0% 100% 0 0.01 0.05 2.30% 2.30%
14 Environment Trigen V 100.0% 0.0% 100% 0 0.01 0.05 2.30% 2.30%
15 Technology Trigen V 100.0% 0.0% 100% -0.01 0 0.02 0.43% 0.43%
16 Partnerships Trigen F 10.0% 90.0% 0% -0.02 0 0.01 -0.43% 0.00%
17 Demol i tion Trigen F 100.0% 0.0% 100% -0.01 0 0.2 8.35% 8.35%
18 Securi ty and Si te Management Trigen V 100.0% 0.0% 100% 0 0.01 0.02 1.00% 1.00%
19 Land Acquis i tion Trigen F 100.0% 0.0% 100% -0.4 0 1 25.85% 25.85%
Risk ImpactRisk Description
Estimator’s
Capability and
Experience
Project Scope and
Specification
Project Complexity
Risk Probability

APRJ-699 A Methodology for Setting Contingency Reserves Using Probabilistic Cost Risk Analysis in
Small To Medium Construction Projects
43
those preceding it will be conducted in a workshop for technical project staff and applicable
consultants.
In theory, this process will be straightforward. The standard cost lines from the point estimate
will be in rows in one Excel spreadsheet and the individual risks identified and characterized in
the RBS will be arrayed in columns across the top of the sheet, creating a matrix. For each cost
line item, the team will review the list of risks and for each individual risk, determine if it applies
to the cost line. If it does apply to the cost line, the team will indicate what proportion of the
cost is ‘acted upon’ by the risk. For example, if a risk that the cost of metals will increase exists,
it may not apply to the full cost of mechanical and electrical work, however in the ‘metals’ line,
which encompasses all structural steel, the risk may apply to virtually the entire cost.
Hulett (Hulett, Hornbacher, & Whitehead, 2008) proposed a model in which risks are allocated
to cost lines in their entirety. In other words, a risk either applied to the entire cost or it didn’t.
The approach of identifying the proportion of a cost line item that is ‘influenced’ by the risk is
an attempt at refining the approach so that contingency is not over-allocated.
TABLE 5: EXCERPT FROM RISK ALLOCATION TABLE FOR SAMPLE CONSTRUCTION PROJECT DEMONSTRATING HOW RBS RISKS ARE
ALLOCATED TO COST LINES
Unf
amili
arit
y w
ith
desi
gn
Lack
of
Inde
pend
ence
Lack
of
Capa
bilit
y or
Exp
erie
nce
Inco
mpl
ete
spec
ific
atio
n
Tech
nica
l Req
uire
men
ts C
hang
e
Vol
unta
ry c
hang
es t
o sc
ope
or s
peci
fica
tion
Proj
ect
Type
Site
Con
diti
ons
Conn
ecti
ons
to S
ervi
ces
– W
ater
Conn
ecti
ons
to S
ervi
ces
– Sa
nita
ry
Conn
ecti
ons
to S
ervi
ces
– H
ydro
Conn
ecti
ons
to S
ervi
ces
– H
eati
ng F
uel T
ype
Conn
ecti
ons
– Tr
ansp
orta
tion
Envi
ronm
ent
Tech
nolo
gy
Part
ners
hips
Dem
olit
ion
Secu
rity
and
Sit
e M
anag
emen
t
Land
Acq
uisi
tion
Budget Line Item Point Estimate 1 2 3 4 5 6 7 8 9 10 11 12 13 14 15 16 17 18 19
Construction Tender Budget
Divis ion 1: General Requirements 996,000.00$ 1.00 1.00 0.10 1.00 0.50 1.00
Divison 2: Si tework 1,959,246.00$ 1.00 0.20 0.10 1.00 1.00 0.50 0.10
Divis ion 3: Concrete 776,919.00$ 1.00 0.00 0.10 1.00
Divis ion 4: Masonry 1,211,002.00$ 1.00 1.00 0.00 0.10 1.00
Divis ion 5: Metals 1,260,627.00$ 1.00 0.00 0.10 1.00
Divis ion 6: Wood 346,746.00$ 1.00 0.00 0.10 1.00
Divis ion 7: Thermal and Moisture 1,094,263.00$ 1.00 0.00 0.10 1.00
Divis ion 8: Doors and Windows 620,650.00$ 1.00 0.00 0.10 1.00
Esti
mat
or’s
Capa
bilit
y an
d
Expe
rien
ce
Proj
ect
Scop
e
and
Spec
ific
atio
n
Proj
ect
Com
plex
ity

APRJ-699 A Methodology for Setting Contingency Reserves Using Probabilistic Cost Risk Analysis in
Small To Medium Construction Projects
44
STEP 3: COST RISK ANALYSIS
The process of cost risk analysis essentially involves using the same format of cost/risk matrix
used in the risk allocation step , except in this iteration the actual expected value calculations
are completed that calculates the expected cost impact of each individual risk that applies to
each individual line item. Table 6 illustrates an example of such a table used to calculate the
expected value of each individual risk. This step is one that doesn’t require the entire project
team and so could be conducted by the Project Manager or the Facilities Department Financial
Analyst assigned to the project. However, thanks to the computational power of both Excel and
@Risk, it literally only takes seconds to complete the simulation and therefore it may be
powerful to do the actual calculations in a workshop context so the results of the previous
estimations can be seen.
The methodology for the cost risk calculations are as follows:
i. For each cost line, the spreadsheet determines by formula if each individual risk
applies to that line item.
ii. If the risk applies, the expected value of the risk is calculated by multiplying the
point estimate for that line item by the proportion of the line item impacted by the
risk (identified in the risk allocation step) and then finally, by multiplying that result
by the overall risk probability distribution function established in the Risk
Assessment Step. As an example, for the Sitework line item (value according to point
estimate of $1M) the fixed Geological Issues risk only impacts 30% of the budget. As
a result, the PDF for the overall impact of the geological impact risk would be
multiplied by 30% of $1M or $300,000.
iii. For each cost line item, the expected values of the applicable risks are summed and
treated as an output, summarizing the total risk profile for that line item. Similarly,
for each individual risk, the expected value of the risk as it applies to each cost line
item is summed, providing an impact profile for that risk across the entire project.
iv. The expected values of all individual risks are summed and added to the project
point estimate, thus creating a probability distribution function that provides a risk-
informed view of total project cost.
v. With all formulas and probability distribution functions identified, the Monte Carlo
simulation is run, with up to 10,000 iterations. In each iteration, any cell that is
defined by a PDF has a value that is randomly chosen based upon the applicable
PDF. The cost risk formulas are then calculated using the randomly chosen values for
each iteration and the resulting outputs are charted on a cumulative probability
curve, which has a sigmoid shape. The cumulative probability curve for the total,

APRJ-699 A Methodology for Setting Contingency Reserves Using Probabilistic Cost Risk Analysis in
Small To Medium Construction Projects
45
risk-adjusted project cost, therefore is composed itself of up to 10,000 data points
calculated through the iterative cycle.
The resulting cumulative probability curve for the overall, risk-adjusted total project cost is
reflective of both the individual cost line items and the individual risks acting on those line
items, in proportion to the impact and probability of each risk. Again,using the example of how
the geological issues risk impacts sitework, the following figure summarizes how, for an
individual risk acting on an individual line item, the cost impact of the risk would be calculated
in each iteration.
FIGURE 11: SUMMARY OF HOW COST RISK IS CALCULATED FOR INDIVIDUAL RISKS ACTING ON INDIVIDUAL COST LINE ITEMS. IN THIS
EXAMPLE, THE INDIVIDUAL RISK IS THE RISK OF GEOLOGICAL ISSUES ON SITEWORK. THE GEOLOGICAL RISK IS A FIXED RISK WITH A 30%
PROBABILITY OF OCCURRING. IMPACT IS GIVEN BY A BEST CASE SCENARIO OF REDUCING BASE COSTS BY 5%, A MOST LIKELY IMPACT OF A
10% INCREASE AND A WORST CASE IMPACT OF A 50% INCREASE OVER BASE. THE RISK IS APPLICABLE TO ONLY 30% OF THE SITEWORK COSTS
OF $1M IN TOTAL.
Though the calculation can be represented rather simply, the complexity of constructing the
overall model through Monte Carlo simulation can become quite daunting. In a project with 40
cost line items and 30 individual risks, it would only take two risks acting on each line item to
create 80 different calculations in each of 10,000 iterations for a total of 800,000 total
calculations comprising the eventual cumulative probability curve. It is not surprising, therefore
that the processing power of Excel and @Risk are necessary to digest such an enormous pool of
data.

APRJ-699 A Methodology for Setting Contingency Reserves Using Probabilistic Cost Risk Analysis in
Small To Medium Construction Projects
46
TABLE 6: EXCERPT FROM COST RISK ANALYSIS TABLE ILLUSTRATING EXPECTED VALUE OF EACH RISK CALCULATED BY LINE ITEM BASED UPON
APPLICABILITY (ALLOCATION) AND RISK PROBABILITY DISTRIBUTION FUNCTION.
STEP 4: CONTINGENCY CALCULATION
Of course it is essential to keep in mind that the ultimate purpose of these thousands of
calculations is to arrive at a more informed view of the financial impact of risk on the project
and therefore, an equally informed way of determining the magnitude of the desired
contingency reserve as a key risk management tactic. As was demonstrated in Figure 4, which
illustrated the use of the cumulative probability curve in setting a contingency for a
construction project, the core concepts proposed for this methodology are as follows:
1. The magnitude of the contingency reserve at a given confidence level is the difference
between the estimated total project cost at that confidence level and the base project
cost or the total project cost generated in the point estimate.
2. The desired confidence level that determines the magnitude of the contingency reserve
should be set as a core function of project governance in a manner that is consistent
with the risk appetite of the business given its prevailing operating conditions.
Unf
amili
arit
y w
ith
desi
gn
Lack
of
Inde
pend
ence
Lack
of
Capa
bilit
y or
Exp
erie
nce
Inco
mpl
ete
spec
ific
atio
n
Tech
nica
l Req
uire
men
ts C
hang
e
Vol
unta
ry c
hang
es t
o sc
ope
or s
peci
fica
tion
Budget Line Item Point Estimate 1 2 3 4 5 6
Construction Tender Budget
Divis ion 1: General Requirements 996,000.00$ 2,645.96$ 4,980.00$ -$ -$ -$ -$
Divison 2: Si tework 1,959,246.00$ -$ 9,796.23$ -$ 42,089.89$ -$ -$
Divis ion 3: Concrete 776,919.00$ -$ 3,884.60$ -$ -$ -$ -$
Divis ion 4: Masonry 1,211,002.00$ 3,217.14$ 6,055.01$ -$ -$ -$ -$
Divis ion 5: Metals 1,260,627.00$ -$ 6,303.14$ -$ -$ -$ -$
Divis ion 6: Wood 346,746.00$ -$ 1,733.73$ -$ -$ -$ -$
Divis ion 7: Thermal and Moisture 1,094,263.00$ -$ 5,471.32$ -$ -$ -$ -$
Divis ion 8: Doors and Windows 620,650.00$ -$ 3,103.25$ -$ -$ -$ -$
Divis ion 9: Finishes 960,161.00$ -$ 4,800.81$ -$ 20,626.85$ -$ -$
Divis ion 10: Specia l ties 314,230.00$ -$ 1,571.15$ -$ 6,750.51$ -$ -$
Divis ion 14: Conveying Systems 45,000.00$ -$ 225.00$ -$ 966.72$ -$ -$
Divis ion 15: Mechanica l 2,441,195.00$ 6,485.25$ 12,205.98$ -$ 52,443.46$ -$ -$
Divis ion 16: Electrica l 1,418,257.00$ 3,767.73$ 7,091.29$ -$ 30,467.99$ -$ -$
Construction Cost Subtotal 13,444,296.00$ 16,116.08$ 67,221.48$ -$ 153,345.42$ -$ -$
Overhead and Profi t 5.0%
1.6% Net GST 1.6%
Subtotal Construction Tender Budget 14,342,374.97$
Esti
mat
or’s
Capa
bilit
y an
d
Expe
rien
ce
Proj
ect
Scop
e
and
Spec
ific
atio
n

APRJ-699 A Methodology for Setting Contingency Reserves Using Probabilistic Cost Risk Analysis in
Small To Medium Construction Projects
47
Once the cumulative ascending probability curve has been generated, it is the job of the project
team to perform the required calculations of contingency reserves at 50%, 60%, 70%, 80%, 90%
and 100% certainty for presentation to the Steering Committee or alternate governing body.
Figure 12 illustrates how the cumulative probability curve for an fictitious sample project with a
point estimate of $5.22M would be used to determine total risk-adjusted project costs at
various confidence levels.
FIGURE 12: CUMULATIVE ASCENDING PROBABILITY CURVE ILLUSTRATING RANGE OF RISK-ADJUSTED TOTAL PROJECT COSTS FOR A SAMPLE
PROJECT WITH A POINT ESTIMATE OF $5.22M.
Pro
bab
ility

APRJ-699 A Methodology for Setting Contingency Reserves Using Probabilistic Cost Risk Analysis in
Small To Medium Construction Projects
48
TABLE 7: TABLE ILLUSTRATING RISK ADJUSTED PROJECT COSTS AND RESULTING CONTINGENCIES (RISK ADJUSTED COST-BASE COST) AT EACH
LEVEL OF CONFIDENCE TAKEN FROM FIGURE 12.
Base 50% 60% 70% 80% 90% 100%
Project Cost 5,200,000.00$ 5,700,000.00$ 5,830,000.00$ 5,980,000.00$ 6,150,000.00$ 6,400,000.00$ 7,800,000.00$
Contingency 500,000.00$ 630,000.00$ 780,000.00$ 950,000.00$ 1,200,000.00$ 2,600,000.00$
Project Cost at Confidence Levels
As can be easily seen from
APRJ-699 A Methodology for Setting Contingency Reserves Using Probabilistic Cost Risk Analysis in
Small To Medium Construction Projects
49
Table 7, the cost of increased confidence becomes quite high as the desired confidence level
approaches 100%. At this point, it would be up to the governance process for the particular
project to make a decision on the appropriate confidence interval and assign contingency
accordingly.
Historically, it has been past practice of the UCDSB to split the total contingency for a project
into design contingency, which is intended to accommodate uncertainty in the design phase
resulting from the lack of definition of the project, particularly early on in the process. The
UCDSB has also carried construction contingency, but that amount is specifically tailored for
uncertainty in the price of the actual facility construction arising from competition, market
pricing, and changes or unforeseen events during actual construction. For all of the amounts
illustrated in

APRJ-699 A Methodology for Setting Contingency Reserves Using Probabilistic Cost Risk Analysis in
Small To Medium Construction Projects
50
Table 7 it is expected that these would represent the totality of contingencies assigned to a
project and thus the individual amounts would be apportioned according to the preference of
the organization between design, construction and any other contingency funds.

APRJ-699 A Methodology for Setting Contingency Reserves Using Probabilistic Cost Risk Analysis in
Small To Medium Construction Projects
51
ASSESSING THE EFFECTIVENESS OF THE PROPOSED METHODOLOGY
AN APPROACH FOR STUDY
Thoroughly testing the effectiveness of the proposed methodology would require project cost
data collected at intervals throughout the entire lifecycle of a school construction project, so
primarily due to time constraints, such a study is outside the scope of this paper. If such a study
were to be undertaken, the following steps would be recommended:
1. At predefined intervals throughout the project, project risk would be assessed and
quantified using the proposed methodology. These intervals would likely coincide with
points in the project at which ‘official’ revisions to the budget would be issued, which
themselves coincide with the availability of new project cost estimates. Using the
UCDSB’s current project management methodology, this approach would result in
revised risk assessments at the following points:
a. Schematic Design (Start of Detailed Design)
b. 40% Design Development
c. 60% Design Development
d. 90% Design Development
e. Post-Tender (when winning bid price is known)
2. At each stage, the risk would be assessed using the latest point estimate as the “base
case”. Contingencies at the desired confidence level (determined prior to the schematic
design estimate) would be calculated at each stage. It would be expected that the major
drivers of risk, such as incomplete specification, would decrease in significance over
time, thereby reducing the size of the contingency.
3. Areas for focusing study might include:
a. Evolution of contingency funds as a percentage of the base project cost over
time to inform contingency drawdown methodology
b. Tracking of risk ‘events’ to determine if forecasted probabilities and impacts
were ‘accurate’ and whether RBS captured all risks material to the project. This,
essentially would involve comparing the latest project estimate against the last
and determining which risks were applicable in any changes to the estimate.
c. Examining the cumulative project cost curves of multiple projects using the
methodology to determine if the confidence intervals in the probability curve are
actually reflected in actual project costs.
Obviously, with a typical school construction project taking up to two years or more from
conception to occupancy, collecting data on multiple projects when only one or two are in

APRJ-699 A Methodology for Setting Contingency Reserves Using Probabilistic Cost Risk Analysis in
Small To Medium Construction Projects
52
progress concurrently, will take some time. However, the only way to both improve the quality
of estimates of risk and to determine their validity is now to collect empirical data.
AN INFORMAL TEST
While a full study using data from multiple, complete projects is beyond the scope of this
paper, it is nonetheless instructive to determine whether the proposed methodology has the
potential of being useful at all by applying it loosely on an isolated test case.\
For this purpose, a school construction project that is already underway – the replacement of
Vankleek Hill Collegiate Institute (VCI) – was used to stimulate thinking and provide baseline
cost data. The approach for this interim test was as follows:
1. Using the RBS proposed in Appendix 1, the probabilities and impacts of these risks as
they applied to the VCI project were quantified. The probability of a risk was
characterized by determining whether it was variable or fixed and if fixed, what the
probability of occurrence was. The impact of a risk was quantified by determining the
minimum, most likely and maximum cost impacts of the risk and applying those
parameters to a trigen PDF. There are two major notes about the approach taken for
this task that merit mention: first, staff in the UCDSB Design and Construction
Department were asked to think about the risks as they stood early in the detail design
phase of the project, almost 18 months ago, rather than now as the project nears 70%
completion. This was simply to provide a scenario in which the widest possible range of
risks applied to the project and the need for contingency would therefore be at virtually
its highest point. Second, staff made entirely subjective judgments about the nature and
quantum of risks applicable to the project, only referring to reference data anecdotally.
The table arising from this exercise is included in Appendix 2
2. UCDSB staff then turned to the next worksheet to allocate risks to each of the cost lines.
Again, staff subjectively discussed each risk individually and then reviewed each cost line
to determine if that individual risk applied. If the risk applied, a further subjective
judgment was made about what proportion of the cost line item was impacted by the
risk (0-1.0).
3. Finally, a Monte Carlo simulation was run with 5000 iterations using Palisade’s @Risk
5.5, generating a cumulative ascending cost curve for the total project cost, a tornado
graph built using regression coefficients and some further analysis conducted using
Excel. A brief discussion of results follows.

APRJ-699 A Methodology for Setting Contingency Reserves Using Probabilistic Cost Risk Analysis in
Small To Medium Construction Projects
53
DISCUSSION OF TEST RESULTS
The base estimate for the Project was $17,105,543.21 including all construction costs, taxes,
furniture and equipment and other project soft costs.
FIGURE 13: CUMULATIVE ASCENDING COST CURVE FOR TOTAL PROJECT BUDGET FOR VANKLEEK HILL COLLEGIATE INSTITUTE (SAMPLE)
17.65 21.315.0% 90.0% 5.0%
0
0.002
0.004
0.006
0.008
0.01
16
17
18
19
20
21
22
23
24
Values in Millions ($)
Total Project Budget
Total Project Budget
The results for this cost curve (Figure 13) are very surprising. For a project with a base cost of
$17.1M, the risk-adjusted total project cost parameters come in as follows:
i. Minimum cost: $16.1M
ii. Maximum cost: $23.9M
iii. Mean cost: $19.4M
iv. Standard Deviation: $1.1M
The results are startling for a couple of reasons. First, it would almost certainly be an
unpleasant surprise to a CFO used to receiving point estimates to discover the a project has
even a small chance of approaching $24M – almost 50% higher than the point estimate. This is
borne out by the standard deviation of $1.1M, seemingly quite a substantial measure of
dispersion. Another way of looking at the cumulative cost curve is that the 5% lower confidence
limit is $17.65M, meaning that the project has even less than a 5% chance of coming it at a total
Pro
bab
ility

APRJ-699 A Methodology for Setting Contingency Reserves Using Probabilistic Cost Risk Analysis in
Small To Medium Construction Projects
54
cost less than the point estimate – or more than a 95% likelihood of coming in higher than the
point estimate.
These results may be explained by the inherent pessimism of the people rating risk impact and
probability or simply inexperience with this means of rating risks. However, the severity of
results are not beyond conception: in the construction of another secondary school, which was
completed in 2009, the final cost of the project was more than 50% higher than the original
estimate precisely because many of the risks outlined in the RBS were not managed or even
acknowledged. Furthermore, this project does admittedly contain several elements that are
deemed to introduce cost risk: the complexities of land expropriation, demolition and an
untested design all contributed to a project with more uncertainty.
How would this translate into a recommendation for contingency? Table 8 below illustrates the
possible contingency values that such a probability distribution would generate. Given that
historical practice would be to allocate approximately 10% of the total project cost to
contingency budgets, it is rather obvious that even at the lowest level of confidence (50%), the
contingency reserve generated would exceed typical practice – 13% of the total base project
cost.
TABLE 8: TABLE OF POSSIBLE CONTINGENCY VALUES AT VARIOUS LEVELS OF CONFIDENCE FOR TEST OF CONTINGENCY ALLOCATION
METHODOLOGY ON VANKLEEK HILL COLLEGIATE PROJECT
This said, it is unlikely that Board trustees or other senior stakeholders would take much
comfort in a contingency reserve that only proposes 50% likelihood that the project will come
in under budget. Moving to a higher level of confidence is expensive – to move from a 50%
confidence interval to a 70% confidence interval “costs” almost 23% more in contingency
reserve.
Much of this is due to the high standard deviation or dispersion of risk in the project. One
approach to making contingency reserves more affordable would be to reduce this dispersion
by employing alternate strategies to manage risk rather than simply ‘accepting’ all risk by
allocating contingency to cover it. Fortunately, the proposed methodology holds the promise of
answering the next question: what are the risks that are the major contributors to overall
project risk?
Base 50% 60% 70% 80% 90% 100%
Project Cost 17,105,543.21$ 19,385,294.25$ 19,668,064.62$ 19,990,708.57$ 20,341,026.25$ 20,870,105.37$ 24,000,000.50$
Contingency 2,279,751.04$ 2,562,521.41$ 2,885,165.36$ 3,235,483.04$ 3,764,562.16$ 6,894,457.29$
% of Project Cost 13% 15% 17% 19% 22% 40%
Project Cost at Confidence Levels

APRJ-699 A Methodology for Setting Contingency Reserves Using Probabilistic Cost Risk Analysis in
Small To Medium Construction Projects
55
This question can be answered by looking at a tornado graph (Figure 14) generated by @Risk
that demonstrates the prioritized risks in the order in which they ‘contribute’ or vary with
overall project cost.
FIGURE 14: TORNADO GRAPH ILLUSTRATING CORRELATION OF RISKS IN DESCENDING ORDER TO OVERALL RISK-ADJUSTED PROJECT COST
FOR TEST CASE OF VCI COST RISK ASSESSMENT
0.58
0.43
0.27
0.26
0.20
0.20
0.15
0.14
0.14
0.14
0.12
0.12
0.10
0.07
0.05
0.05
-0.1 0
0.1
0.2
0.3
0.4
0.5
0.6
Incomplete specification
Competitiveness
Project Type
Aggregate Schedule Delays
Voluntary changes to scope or specification
Errors and Omissions – Estimate
Commodity Markets
Site Conditions
Lack of Independence
Demolition
Unfamiliarity with design
Aggregate Schedule Delays
Errors and Omissions- During Construction
Furniture and Equipment – Price
Voluntary changes to scope or specification
Weather Related Costs
Coefficient Value
Total Project BudgetCorrelation Coefficients (Spearman Rank)
Intuitively, the tornado graph illustrates that the risk of incomplete specification (due to the
early stage of design) represents the most significant uncertainty in the cost estimate for the
overall project, followed by competitiveness. Were this graph being used as one clue to focus
risk management efforts in an attempt to reduce the dispersion of project cost, then some
hypotheses that might be drawn would be the need to increase the level of specification of the
design drawings and to ensure that tendering for the project occurs during the time of year
when there are the most qualified contractors bidding on the job. While the underlying values
for these correlations may be suspect due to the subjectivity of the exercise, it can at least be
said that the significance of both these risks makes intuitive sense.
Another way to view risk data for the purposes of focusing risk-management efforts could be to
use a chart like that in
Ris
k

APRJ-699 A Methodology for Setting Contingency Reserves Using Probabilistic Cost Risk Analysis in
Small To Medium Construction Projects
56
Figure 15 which shows the contribution of each risk to project cost

APRJ-699 A Methodology for Setting Contingency Reserves Using Probabilistic Cost Risk Analysis in
Small To Medium Construction Projects
57
FIGURE 15: CHART ILLUSTRATING CONTRIBUTION OF RISKS TO OVERALL RISK ADJUSTED PROJECT COST
$- $100,000.00 $200,000.00 $300,000.00 $400,000.00 $500,000.00 $600,000.00 $700,000.00
Unfamiliarity with design
Lack of Independence
Lack of Capability or Experience
Incomplete specification
Technical Requirements Change
Voluntary changes to scope or specification
Project Type
Site Conditions
Connections to Services – Water
Connections to Services – Sanitary
Connections to Services – Hydro
Connections to Services – Heating Fuel Type
Connections – Transportation
Environment
Technology
Partnerships
Demolition
Security and Site Management
Land Acquisition
Errors and Omissions – Estimate
Errors and Omissions- During Construction
Damage due to Act of God
Damage due to Vandalism
Damage or Other Loss – General
Weather Related Costs
Contractor Insolvency
Other
Aggregate Schedule Delays
Competitiveness
Commodity Markets
Tax Implications
Currency
Cost of Land
Furniture and Equipment – Specification
Furniture and Equipment – Price
Consultant Costs
Permits and Fees
Other
Contribution to Overall Project Cost
Ris
k
CONCLUSIONS ARISING FROM THE TEST
The informal and subjective test of the methodology described above is simply not sufficient to
draw conclusions about the accuracy or effectiveness of the approach. However, the test was
sufficient to demonstrate that the technique of linking risk analysis to individual cost line items
and using that data to probabilistically generate potential contingency reserves is perfectly
feasible. In fact, given that the prevailing ‘crystal ball’ approach to setting contingency reserves
generally uses 10% of the total project cost as a reserve, even the quick, subjective test
managed to generate a 13% contingency at the lowest recommended level of confidence –
close enough to indicate potential.
More importantly, however, the process of explicitly and quantitatively linking risk analysis to
project cost and contingency opens the possibility of vastly improving risk management in that
efforts can be informed by data and results measured against forecast. It raises the possibility
that traditional perceptions about risks and their impacts can be challenged by real data, and

APRJ-699 A Methodology for Setting Contingency Reserves Using Probabilistic Cost Risk Analysis in
Small To Medium Construction Projects
58
finally it raises the possibility that contingency reserves, like all risk management strategies can
be informed by the actual risk tolerance of the larger organization.
Finally, given that the actual quantification of the risks – although subjective and very informal
– took only about an hour of staff time and given that the subsequent Monte Carlo simulation
and contingency analysis took only minutes, it seems the proposed methodology is indeed
simple and streamlined enough to be suitable for the UCDSB environment.
SUBJECTS FOR FURTHER STUDY
Though this represents a detailed outline of a methodology for calculating and deciding upon
cost contingency, the study itself has raised several issues that could themselves be focal points
for further research.
RISK EVOLUTION
It should be no surprise, referring to Figure 1: chart illustrating decline in estimating
variance through stages of project completion Figure 1, that project risk is not a static
entity. Risk – which really refers to uncertainty – is at its peak in the early stages of the
Project and declines to zero at the moment the project is closed out financially. As a
result, it seems obvious that risk needs to be continually reassessed throughout the
course of the project, however in keeping with the pragmatic requirement of simplicity,
it seems too much to simply say it should be reassessed “continually”. As a start, it
would be reasonable for the UCDSB to align its risk assessment iterations with the
standard phases already in place for project management. These phases see updated
scope statements, independent third-party estimates and revised budgets at the end of
the schematic design phase; at 40% design development; at 60% design development;
at 90% design development and at the acceptance of the successful bid. It would be
useful, therefore to reassess risk at each of these points to see if in fact it is declining or
changing shape and where changes are occurring.
CONTINGENCY DRAWDOWN
If one accepts that overall project risk declines as a project matures, then it seems a
logical conclusion that contingency, as a response to risk, should also decline. In other
words, as some risks come to fruition, contingency reserves will need to be tapped. On
the other hand, as other risks fail to translate into events, the contingency that was
allocated can perhaps be repurposed. In either case, it would be useful for the UCDSB or
any organization to have an approach for drawing down contingency budgets prior to

APRJ-699 A Methodology for Setting Contingency Reserves Using Probabilistic Cost Risk Analysis in
Small To Medium Construction Projects
59
entering into a project so it is done systematically and not treated as a windfall with
which to expand scope. In the course of study, authors Mak and Picken (2000), Noor
(2002) and Rowe (2005) have proposed contingency drawdown approaches ranging
from the intuitive to the formula-driven. Such an approach should also include a
strategy for apportioning the overall contingency reserve assigned to a project between
design contingency, construction contingency, owner contingency and other classes of
reserve at each stage in the project evolution. This will represent an area for further
study for the UCDSB, especially as it balances a requirement to minimize budget and
ensure every available dollar of funding translates into bricks and mortar.
REPRESENTING CORRELATION BETWEEN RISKS
A third major opportunity is the exploration of the role and implementation of
correlation between risks. While the proposed methodology allows for multiple risks to
affect one cost line item, it does not address the issue of correlation. In Monte Carlo
simulation two risk PDFs are sampled in each iteration, however it is ‘equally’ likely that
a “high” value will be chosen for one risk and a “low” value chosen for the other risk.
However if the two risks are actually correlated to some degree, then in real life a high
value for one risk tends to be correspondingly reflected in the other risk. Without
correlation, the effects of these risks may cancel eachother out to some degree when in
fact, their effects should be additive in nature. Conversely it is possible for risks to be
negatively correlated, in which a high value in one risk tends to occur with a low value
for the other risk. Whether risks are positively or negatively correlated, explicitly
building correlation into the risk model has the advantage of generating a project cost
curve that more accurately reflects the true effects of risks on the project. There are
downsides of course: without reasonably accurate benchmark data on risks, the
establishment of correlations is just one more point at which subjectivity is introduced
into the model. It is therefore uncertain, in the face of correlations unsupported by
data, whether the introductions of correlations actually does make the simulation more
accurate. Second, and most simply, at the present time, introducing correlations
without empirical data to back them up introduces a level of complexity that the UCDSB
is not ready for. As a result, correlations are relegated to the category of significant
issues for further study.
INTEGRATED SCHEDULE AND COST RISK ASSESSMENT
The final subject for further study that bears mention is the impact of schedule risk on
project costs. Using tools like Palisade’s @Risk for Microsoft Project it is possible to treat

APRJ-699 A Methodology for Setting Contingency Reserves Using Probabilistic Cost Risk Analysis in
Small To Medium Construction Projects
60
schedules associated with a Work Breakdown structure in the exact same way as cost
risks associated with a risk breakdown structure. In other words, the schedules for an
individual task package can be described with a probability curve based upon the risks
to the schedule for that task package. In the UCDSB, it is intuitively understood that
schedule risk has an impact on project costs. As an example, the later into the
“construction season” that the tender for a project goes out, the less competitive the
environment and therefore, bids can be assumed to be generally higher. This type of
association between schedule and cost risk is possible to build into the proposed
methodology, but as there used to be a separation between analysis of risks and
analysis of costs, schedule risks and cost risks tend to be managed and analyzed
separately. As a result, this final major area for further study would first seek to find a
way to describe schedule risk using a similar approach as proposed here and second, to
integrate schedule risk analysis with cost risk analysis so time and financial
contingencies can be allocated in an integrated process.

APRJ-699 A Methodology for Setting Contingency Reserves Using Probabilistic Cost Risk Analysis in
Small To Medium Construction Projects
61
RECOMMENDATIONS
At the highest level, the principal recommendation arising from this paper is the
implementation of the proposed contingency allocation methodology for school construction
projects in the UCDSB. However, more specifically, there are some highlights that merit
mention.
1. Standard Risk Management Framework: While a more informed approach to setting
contingency reserves is a worthwhile goal unto itself, contingency reserves are but one
of a repertoire of risk management tactics that should be employed, particularly for
large scale projects. It is evident, however, from even the small scale subjective test of
the methodology undertaken for this paper, that the practice of risk identification and
quantification is a competency that demands attention and practice. As a result, even if
the full-blown probabilistic methodology never sees wide adoption, the implementation
of a standard risk management framework for all projects and the commitment to the
discipline of risk management is an essential prerequisite for any level of further
sophistication.
2. Data Collection: In order to develop a risk management approach that represents a
meaningful quantitative tool for focusing effort and informing tactics, it is essential that
risk probabilities and impacts are quantified as accurately as possible. With little internal
experience in risk analysis, it will be imperative that as much data as possible is collected
on project costs and risks so that ultimately, risk forecasts are informed by actual
empirical data or at least tangible experience. This will be a crucial prerequisite for the
refinement of risk management tactics and improved accuracy in cost forecasts and
contingency reserves.
3. Further Study: Though it may appear to be a superfluous addition, the subjects outlined
in the section “Subjects for Further Study” represent crucial areas of additional learning
in order to even further improve the refinement of risk analysis. In some cases, such as
that of correlation among risks, it will be essential for developing a risk profile that is
more reflective of reality; in the case of examining contingency drawdown procedures,
it represents an issue of pragmatic importance to an organization that cannot afford to
carry millions of dollars of contingency reserves to cover risks that no longer have any
potential to materialize.
APRJ-699 A Methodology for Setting Contingency Reserves Using Probabilistic Cost Risk Analysis in
Small To Medium Construction Projects
62
CONCLUSIONS
Though typical school construction projects wouldn’t be considered to be ‘large construction
projects’ in the league of dams, highways or airports, in a k-12 school district they represent by
far, the largest non-salary expenditures in the budget and therefore a source of considerable
risk to the organization. Contingency reserves assigned to these projects, typically using a
blanket percentage model, often represent the only explicit risk management tactic for these
initiatives and even as such, are not readily understood by district staff and decision-makers. At
the historical rate of allocation – 5% to 10% of project cost – contingency reserves can amount
to millions of dollars and yet the underlying rationale for their magnitude and the appropriate
role for contingencies is not well understood.
The methodology proposed in this paper attempts to rectify that situation by first developing a
systematic approach to identifying and quantifying risk using a risk breakdown structure (RBS).
This step alone is significant in that it will provide management with a comprehensive overview
of risk in construction projects that will allow for a repertoire of risk-management tactics
designed to complement contingency reserves. Second, this model compensates for the lack of
data about project risks and large construction projects in general by addressing uncertainty
through a probabilistic cost model. While other proposed methods for quantifying risk rely on
probabilistic tools, they often require large data sets that the UCDSB doesn’t have – rather, the
proposed approach of Monte Carlo simulation allows ‘expert’ judgment to be used without the
need for large data sets. Finally, the proposed contingency reserve setting model generates a
cumulative probability curve that illustrates the forecasted, risk-adjusted project cost at a
variety of cost levels. Using this curve, the magnitude of the contingency reserve is the
difference between the risk-adjusted project cost at a given level of confidence and the base
point estimate. In this way, risks are explicitly characterized, mapped to individual cost lines
and a contingency is set that is driven directly by actual risks and also that is consistent with the
organization’s prevailing risk tolerance.
A limited test of this methodology has shown promise – both in its simplicity and its general
alignment to the qualitative nature of overall project risk. Further work, remains, however to
completely validate the methodology, which principally would consist of a test to determine
the accuracy of the risk assessment components; if contingencies are proposed to be sized
based upon individual project risks, then the accuracy of the risk assessment will be the critical
driver in right-sizing the contingency reserve. As a result, the methodology should be applied to
as many projects as possible so that suitable risk data can be collected, staff competency with
risk assessment can be developed and further refinements implemented. These refinements
will include quantitatively introducing correlations between individual risks; developing an

APRJ-699 A Methodology for Setting Contingency Reserves Using Probabilistic Cost Risk Analysis in
Small To Medium Construction Projects
63
approach for contingency drawdown as the project progresses and finding an approach for
integrating schedule and cost risk assessments so the cost implications of schedule uncertainty
can be accurately represented.
To conclude, at its most basic, the principal challenge with contingency reserves in the UCDSB
and more widely, is that they are not founded on an understanding of risk. Organizations like
school districts have simply become acclimatized to reserving large sums of money in projects
without any connection between the sum and the risk profile of the project. The proposed
approach to rectifying this begins, at heart, with developing a suitably simple, but thorough
understanding of the risks facing a project and provides decision-makers with the promise of
making an informed decision consistent with their actual level of risk tolerance. The result
ultimately will not simply be “right-sized” contingency reserves, but more successful projects.

APRJ-699 A Methodology for Setting Contingency Reserves Using Probabilistic Cost Risk Analysis in Small To Medium Construction
Projects
64
APPENDIX 1: DETAILED RISK BREAKDOWN STRUCTURE FOR LARGE CONSTRUCTION PROJECTS Risk Driver Risk Type Event
Estimator’s Capability and Experience
Unfamiliarity with design
V Uncertainty is introduced in the cost estimate because the estimator has limited familiarity with the proposed design
Lack of Independence
V Uncertainty is introduced in the cost estimate because the estimator is not fully independent (ie is either client, architect or constructor)
Lack of Capability or Experience
V Uncertainty is introduced to estimate because estimator is lacking critical skills need to understand the proposed project, key components or general cost drivers like local market conditions, etc
Project Scope and Specification
Incomplete specification
V Uncertainty arises in the cost estimate because the project is only partially specified.
Technical Requirements Change
F Uncertainty in estimate due to the potential for technical requirements (building code, fire code, environmental regulations, etc).
Voluntary changes to scope or specification
F Changes in cost (including deletions) arising from discretionary, owner driven changes to scope or specification
Complexity of the Project
Project Type F Additional cost uncertainty that arises in projects like additions or renovations where technical requirements depend on a building that is already in place. Types may include Greenfield construction, renovation or addition
Site Conditions V Cost uncertainty associated with the topography of the site; uncertainty about subsurface conditions of the site and uncertainty about environmental conditions of the site (e.g. contamination)
Connections to Services – Water
V Uncertainty that may be introduced into cost due to the requirement for a well or for uncertainty around capacity or connections to existing water systems
Connections to Services – Sanitary
V Uncertainty in cost due to the requirement for a septic system or due to potential complexity of sanitary connections, including required upgrades
Connections to Services – Hydro
V Uncertainty in cost due to complexity of hydro connections, including potential for upgrade requirements
Connections to Services – Heating Fuel Type
V Uncertainty in cost due to heating fuel type, complexity of connections and additional costs due to chosen approach.
Connections – V Uncertainty that additional costs will be incurred to support municipal traffic

APRJ-699 A Methodology for Setting Contingency Reserves Using Probabilistic Cost Risk Analysis in Small To Medium Construction
Projects
65
Risk Driver Risk Type Event
Transportation requirements (curbs, sidewalks, intersections, etc)
Environment V Uncertainty in cost due to incompletely understood requirement to meet environmental regulations for stormwater management, etc.
Technology V Uncertainty in cost that arises due to the application of new, novel or untested technology or approaches to construction
Partnerships F Uncertainty in overall project cost that may arise due significant stakeholders or partners that may either alter project specifications or delay it. This represents a “catch all” to encompass schedule risks and costs due to external stakeholders (not Board, Ministry, Municipality, Architect, Contractor, etc)
Demolition F Uncertainty in cost estimate arising from the potential for unforeseen conditions in demolition (if applicable) like asbestos or other environmental concerns.
Security and Site Management
V Uncertainty in cost that may arise due to complexity of controlling traffic flow, safety and security of the site
Land Acquisition F Uncertainty in overall cost that may arise due the need for and means of, acquiring land. This risk does not apply to the cost of land itself, but from the uncertainty that will impact the overall specification and configuration of the building itself. (e.g. we don’t know exactly where the school will be built, which introduces much uncertainty)
Unforseen Events Errors and Omissions – Estimate
V Uncertainty in the estimate that arises because the cost estimate contains errors or omissions that would change the estimate
Errors and Omissions- During Construction
V Cost implications of architect or contractor errors and omissions that must be borne by the Client
Damage due to Act of God
F Cost implications of damages to the school (while under construction) due to Act of God
Damage due to Vandalism
F Cost implications of damages to the school while under construction, due to Vandalism
Damage or Other Loss – General
V Cost implications of all other damages or losses
Weather Related Costs
V Uncertainty in costs due to additional costs related to accommodating unanticipated weather
Contractor Insolvency
F Uncertainty in costs arising from GC or Subtrade insolvency, including additional costs incurred to replace a contractor
Other V Additional catch all for uncertainty related to other force majeure type unforeseen
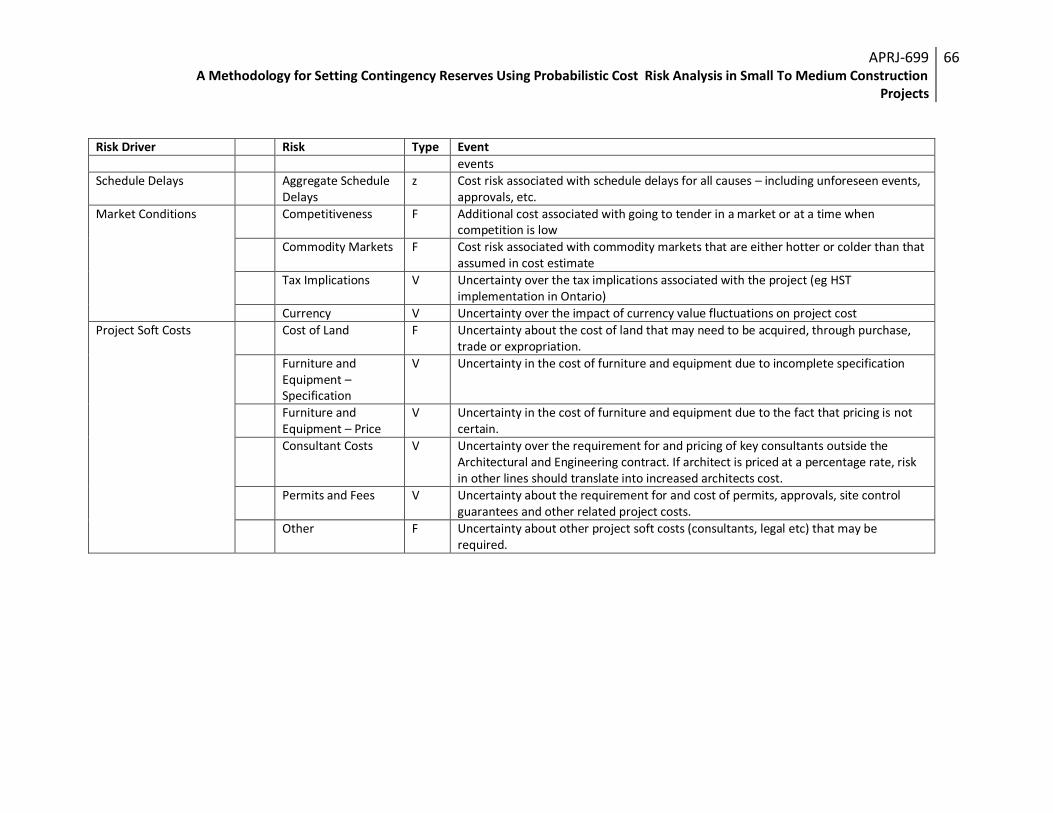
APRJ-699 A Methodology for Setting Contingency Reserves Using Probabilistic Cost Risk Analysis in Small To Medium Construction
Projects
66
Risk Driver Risk Type Event
events
Schedule Delays Aggregate Schedule Delays
z Cost risk associated with schedule delays for all causes – including unforeseen events, approvals, etc.
Market Conditions Competitiveness F Additional cost associated with going to tender in a market or at a time when competition is low
Commodity Markets F Cost risk associated with commodity markets that are either hotter or colder than that assumed in cost estimate
Tax Implications V Uncertainty over the tax implications associated with the project (eg HST implementation in Ontario)
Currency V Uncertainty over the impact of currency value fluctuations on project cost
Project Soft Costs Cost of Land F Uncertainty about the cost of land that may need to be acquired, through purchase, trade or expropriation.
Furniture and Equipment – Specification
V Uncertainty in the cost of furniture and equipment due to incomplete specification
Furniture and Equipment – Price
V Uncertainty in the cost of furniture and equipment due to the fact that pricing is not certain.
Consultant Costs V Uncertainty over the requirement for and pricing of key consultants outside the Architectural and Engineering contract. If architect is priced at a percentage rate, risk in other lines should translate into increased architects cost.
Permits and Fees V Uncertainty about the requirement for and cost of permits, approvals, site control guarantees and other related project costs.
Other F Uncertainty about other project soft costs (consultants, legal etc) that may be required.

APRJ-699 A Methodology for Setting Contingency Reserves Using Probabilistic Cost Risk Analysis in
Small To Medium Construction Projects
67
APPENDIX 2: RISK IDENTIFICATION TABLE FOR TEST CASE (VANKLEEK HILL
COLLEGIATE INSTITUTE)
Overall
Risk PDF Type OccuringNot
Occuring
Risk-Adjusted
Probability of
Occurence
LowMost
LikelyHigh
Risk-
Adjusted
Impact
Risk
1 Unfami l iari ty with des ign Trigen V 100.0% 0.0% 100% -0.03 0.02 0.03 0.27% 0.27%
2 Lack of Independence Trigen V 100.0% 0.0% 100% -0.01 0.01 0.02 0.50% 0.50%
3 Lack of Capabi l i ty or Experience Trigen V 100.0% 0.0% 100% -0.02 0.00 0.01 -0.43% -0.43%
4 Incomplete speci fication Trigen V 100.0% 0.0% 100% -0.10 0.00 0.15 2.15% 2.15%
5 Technica l Requirements Change Trigen F 10.0% 90.0% 0% -0.05 0.00 0.01 -1.73% 0.00%
6 Voluntary changes to scope or speci fication Trigen F 30.0% 70.0% 0% 0.01 0.05 0.07 4.14% 0.00%
7 Project Type Trigen F 100.0% 0.0% 100% -0.02 0.00 0.04 0.86% 0.86%
8 Site Conditions Trigen V 100.0% 0.0% 100% -0.05 0 0.10 2.15% 2.15%
9 Connections to Services – Water Trigen V 100.0% 0.0% 100% -0.01 0 0.02 0.43% 0.43%
10 Connections to Services – Sanitary Trigen V 100.0% 0.0% 100% -0.01 0 0.02 0.43% 0.43%
11 Connections to Services – Hydro Trigen V 100.0% 0.0% 100% -0.01 0 0.01 0.00% 0.00%
12 Connections to Services – Heating Fuel Type Trigen V 100.0% 0.0% 100% -0.01 0 0.015 0.21% 0.21%
13 Connections – Transportation Trigen V 100.0% 0.0% 100% 0 0.01 0.05 2.30% 2.30%
14 Environment Trigen V 100.0% 0.0% 100% 0 0.01 0.05 2.30% 2.30%
15 Technology Trigen V 100.0% 0.0% 100% -0.01 0 0.02 0.43% 0.43%
16 Partnerships Trigen F 10.0% 90.0% 0% -0.02 0 0.01 -0.43% 0.00%
17 Demol i tion Trigen F 100.0% 0.0% 100% -0.01 0 0.4 17.22% 17.22%
18 Securi ty and Si te Management Trigen V 100.0% 0.0% 100% 0 0.01 0.02 1.00% 1.00%
19 Land Acquis i tion Trigen F 100.0% 0.0% 100% -0.4 0 1 25.85% 25.85%
20 Errors and Omiss ions – Estimate Trigen V 100.0% 0.0% 100% -0.015 0 0.03 0.65% 0.65%
21 Errors and Omiss ions- During Construction Trigen V 100.0% 0.0% 100% 0 0.01 0.03 1.43% 1.43%
22 Damage due to Act of God Trigen F 0.5% 99.5% 0% 0 0.005 0.01 0.50% 0.00%
23 Damage due to Vandal ism Trigen F 5.0% 95.0% 0% 0 0.005 0.01 0.50% 0.00%
24 Damage or Other Loss – Genera l Trigen V 100.0% 0.0% 100% 0 0.002 0.005 0.24% 0.24%
25 Weather Related Costs Trigen V 100.0% 0.0% 100% 0 0.01 0.015 0.78% 0.78%
26 Contractor Insolvency Trigen F 1.0% 99.0% 0% 0 0.02 0.05 2.43% 0.00%
27 Other Trigen V 100.0% 0.0% 100% -0.001 0 0.002 0.04% 0.04%
Schedule Delays 28 Aggregate Schedule Delays Trigen F 30.0% 70.0% 0% 0 0.02 0.1 4.60% 0.00%
29 Competi tiveness Trigen V 100.0% 0.0% 100% 0 0.02 0.1 4.60% 4.60%
30 Commodity Markets Trigen V 100.0% 0.0% 100% -0.02 0 0.05 1.29% 1.29%
31 Tax Impl ications Trigen V 100.0% 0.0% 100% -0.08 0.01 0.09 0.57% 0.57%
32 Currency Trigen F 0.0% 100.0% 0% 0 0 0 0.00% 0.00%
33 Cost of Land Trigen F 100.0% 0.0% 100% -0.5 0 2 64.89% 64.89%
34 Furniture and Equipment – Speci fication Trigen V 100.0% 0.0% 100% -0.01 0 0.15 6.14% 6.14%
35 Furniture and Equipment – Price Trigen V 100.0% 0.0% 100% -0.1 0 0.15 2.15% 2.15%
36 Consultant Costs Trigen V 100.0% 0.0% 100% 0 0.1 0.15 7.85% 7.85%
37 Permits and Fees Trigen V 100.0% 0.0% 100% -0.01 0 0.01 0.00% 0.00%
38 Other Trigen F 0.0% 100.0% 0% 0 0.01 0.1 4.49% 0.00%
Unforseen Events
Market Conditions
Project Soft Costs
Risk Probability Risk ImpactRisk Description
Estimator’s
Capability and
Experience
Project Scope and
Specification
Project Complexity

APRJ-699 A Methodology for Setting Contingency Reserves Using Probabilistic Cost Risk Analysis in
Small To Medium Construction Projects
68
WORKS CITED
Baccarini, D. (2004). Accuracy in estimating project cost contingency - a statistical analysis.
COBRA 2004. Leeds: Royal Institution of Chartered Surveyors.
Baccarini, D. (2002). Estimating project cost contingency - beyond the 10% syndrome.
Baccarini, D. (2006). The Maturing Concept of Estimating Project Cost Contingency - A Review.
AUBEA Conference. Sydney: University of Technology, Sydney.
Carr, M. J., Konda, S. L., Monarch, I., Ulrich, C. R., & Walker, C. F. (1993). Taxonomy-Based Risk
Identification. Carnegie-Mellon University. Software Engineering Institute.
Chang Hak, K., Sang Bok, J., Yang Kue, L., Seo Young, P., & Hyun Suk, M. (2008). Risk
Management Model of Construction Projects Using WBS Generator Linked to 4D CAD.
Chapman, R. J. (2001). The controlling influences on effective risk identification and assessment
for construction design management. International Journal of Project Management , 147-160.
Chau, K. (1995). Monte Carlo simulation of construction costs using subjective data.
Construction Management and Economics , 369-383.
Cook, J. J., Thal, A. E., & White III, E. D. Estimating required contingency funds for construction
using multiple linear regression.
Crepin-Swift, C. (2009, 07 1). Project Risk Identification Process. Retrieved 3 16, 2010, from
Suite101.com: http://business-project-
management.suite101.com/article.cfm/project_risk_identification_process
Cullen, S. (2008, September 25). Risk management. Retrieved January 2, 2010, from Whole
Building Design Guide: www.wbdg.org/project/riskmanage.php
Gunhan, S., & Arditi, D. (2007, January). Avoiding Change Orders in Public School Construction.
Journal of Professional Issues in Engineering Education and Practice , 67-73.
Gunhan, S., & Arditi, D. (2007, July). Budgeting Owner's Construction Contingency. Journal of
Construction Engineering and Management , 429-497.
Heon Han, S., & Hyung-Keun, P. (2004, March). Categorical relationship approach as an
alternative risk analysis for predicting cost contingency. Journal of Civil Engineering , 173-180.

APRJ-699 A Methodology for Setting Contingency Reserves Using Probabilistic Cost Risk Analysis in
Small To Medium Construction Projects
69
Hillson, D. D., & Hulett, D. D. (2004). Assessing risk probability: Alternative approaches. PMI
Global Conference Proceedings (pp. 1-7). Prague: Project Management Institute.
Hillson, D. (2002). Use a risk breakdown structure (RBS) to understand your risks. Proceedings
of the Project Management Institute Annual Seminars and Symposium. San Antonio: Project
Management Institute.
Hollman, J. K. (2008). AACE International Recommended Practice No. 40R-08: Contingency
Estimating - General Principles. Association for the Advancement of Cost Engineering.
Hollman, J. K. (2009). AACE International Recommended Practice No. 44R-08: Risk Analysis and
Contingency Estimation Using Expected Value. Association for the Advancement of Cost
Engineering.
Hollman, J. K. (2007). The Monte Carlo Challenge: A Better Approach. AACE International
Transactions (pp. 3-7). Morgantown, WV: AACE International.
Hulett, D. T. (2002). Project cost risk analysis. Retrieved 03 01, 2010, from
www.ProjectRisk.com:
http://www.projectrisk.com/Welcome/White_Papers/Project_Cost_Risk_Analysis.pdf
Hulett, D. T., Hornbacher, K., & Whitehead, W. T. (2008). White Papers. Retrieved Feb 13, 2010,
from Hulett & Associates:
http://www.projectrisk.com/Welcome/White_Papers/ProjCostRiskAnal_RiskPrio_Risk_Driver_
Method.pdf
Humphreys, D. K. (2008). AACE International Recommended Practice No 41-R-08: Risk analysis
and contingency determination using range estimating. Association for the Advancement of
Cost Engineering.
Isidore, L. J., Back, W. E., & Fry, G. T. (2001). Integrated probabilistic schedules and estimates
from project simulated data. Construction Management and Economics , 19, 417-426.
Kamalesh, P., Ahmed, S. M., & Ogunlana, S. O. (2009). Contingency Estimation for Construction
Projects Through Risk Analysis. International Journal of Construction Education and Research , 5
(2), 79-94.
Kennedy, R. N. (2007). Risk in Construction Estimating.
Lind, D. A., Marchal, W. G., & Wathen, S. A. (2005). Statistical Techniques in Business and
Economics (12th Edition ed.). New York, NY: McGraw-Hill.

APRJ-699 A Methodology for Setting Contingency Reserves Using Probabilistic Cost Risk Analysis in
Small To Medium Construction Projects
70
Mak, S., & Picken, D. (2000). Using risk analysis to determine construction project
contingencies. Journal of Construction Engineering and Management , 126 (2), 130-136.
Moselhi, D. O. (1997). Risk Assessment and Contingency Estimating. AACE International
Transactions (p. 6). Association for the Advancement of Cost Engineering.
Noor, D. I. (2002). Contingency misuse and other risk management pitfalls.
Panthi, K., Ahmed, S. M., & Ogulana, S. O. (2009). Contingency Estimation for Construction
Projects Through Risk Analysis. International Journal of Construction Education and Research ,
79-94.
Patrascu, A. (1988). Construction cost engineering handbook. New York: M. Dekker.
Picardi, A. E. (1972). Closing the Credibility Gap in Construction Cost Estimating. INBEX Annual
Meeting. Louisville.
Project Management Institute. (2000). A guide to the project management body of knowledge
(PMBoK) (2000 Ed. ed.). Newtown Square, PA, United States: Project Management Institute.
Rowe, J. F. (2005). Construction Cost Contingency Tracking System. AACE International
Transactions (p. 6). Association for the Advancement of Cost Engineering.
Salling, K. B. (n.d.). Risk analysis and monte carlo simulation within transport appraisal.
Retrieved 3 17, 2010, from www.systemicplanning.com:
http://www.systemicplanning.dk/Risk_Analysis_-_Technical_note.pdf
Smith, N. J., Merna, T., & Jobling, P. (2006). Managing Risk in Construction Projects. Malden:
Blackwell Publishing.
Sonmez, R., Ergin, A., & Birgonul, M. T. (2007, January). Quantitative Methodology for
Determining Contingency in International Projects. Journal of Management in Engineering , 35-
39.
Touran, A. (2003). Probabilistic Model for Cost Contingency. Journal of Construction Engineering
and Management , 280-284.
Wall, D. M. (1997). Distributions and Correlations in Monte Carlo Simulation. Construction
Management and Economics , 15, 241-258.

APRJ-699 A Methodology for Setting Contingency Reserves Using Probabilistic Cost Risk Analysis in
Small To Medium Construction Projects
71
Yeo, K. (1990). Risks, classification of estimates, and contingency management. Journal of
Management in Engineering , 6 (4), 458-470.
Zacharias, O., Panapooulos, D., & Askounis, D. T. (2008). Large scale program risk analysis using
a risk breakdown structure. European Journal of Economics, Finance and Administrative
Sciences (12), 170-180.


![Winter Contingency Plan 2019 - PDMA Contingency... · 2020. 12. 24. · [KHYBER PAKHTUNKHWA WINTER CONTINGENCY PLAN 2019-20] Winter Contingency Plan 5 | Page utilizing PAF strategic](https://cdn.vdocuments.us/doc/165x107/611400065caf3c03a80f7591/winter-contingency-plan-2019-pdma-contingency-2020-12-24-khyber-pakhtunkhwa.jpg)
