
International Journal of Academic Research in Business and Social Sciences Vol. 7, Special Issue - 4th International Conference on Educational Research and Practice 2017
ISSN: 2222-6990
245 www.hrmars.com
A Measure of Students Motivation, Attitude and Parental Influence towards Interest in STEM Career
among Malaysian Form Four Science Stream Student
Fazilah Razali, Othman Talib, Umi Kalthom Abdul Manaf and Siti Aishah Hassan
Faculty of Educational Studies, Universiti Putra Malaysia, 43400 UPM Serdang, Selangor, Malaysia
DOI: 10.6007/IJARBSS/v7-i14/3665 URL: http://dx.doi.org/10.6007/IJARBSS/v7-i14/3665
Abstract There is an increasing demand for STEM-based careers. The awareness of the importance of STEM-based careers should be instilled in students, as early as secondary school level. The formation of students’ interest should begin by understanding the needs of students and identifying factors that can encourage students’ interest in STEM careers. The purpose of this study is to identify clearly, factors that influence the formation of students’ interest in STEM careers, among science-stream students. The descriptive regression research design uses a questionnaire versions, that have been modified, which are the Science Motivation Questionnaire II (SMQ), the Student Attitude towards STEM (S-STEM) and the Interest in STEM Career and Parental Authority Questionnaire (PAQ). Overall, students are influenced by attitude, motivation and parental influence in the formation of interest in STEM careers. Motivation to learn science and parental influence is clearly seen as influencing students’ interest in STEM careers, with a high reliability of .913 dan .918, respectively. Additional studies on students in other STEM fields such as Agricultural Science, Computer Science, Home Economics, Sports Science, Design and Technical studies, need to be carried out to identify the formation of interest in STEM careers on a broader scale. Keywords: STEM Career, Form Four Science Stream, Science Curriculum, Interest, Science Education Introduction In a twenty-first century world, steps to renew the curriculum at school level have already been initiated. One of the changes is in STEM Education (Science, Technology, Engineering & Mathematics) approaches to ensure students of high quality who will be capable to propel the country towards excellence and progress. Many definitions from different countries have become points of reference and have been publicised, to establish the importance of STEM, in the global education system and the labour industry. Bryan, Moore, Johnson, and Roehrig (2016), have defined STEM as “The teaching and learning of content as well as practice of knowledge in the Science and Mathematics curriculum, with the integration of Engineering and Design Engineering through Technology, for future readiness.” The goal of STEM is to blend the
International Journal of Academic Research in Business and Social Sciences Vol. 7, Special Issue - 4th International Conference on Educational Research and Practice 2017
ISSN: 2222-6990
246 www.hrmars.com
integration of Science, Technology, Engineering and Mathematics in the teaching and facilitation process (PdPc), beginning at school level ,to inculcate interest in the new generation in STEM, in comparison with non-STEM related studies and careers (KPM, 2015). STEM has garnered attention from global education systems since its introduction in 1990 by the National Science Foundation (NSF). The field of STEM is of high demand from the global industrial sector, and is capable of bringing significant economic changes to the country (Fouad & Santana, 2017; Wiswall, Stiefel, Ellen, & Boccardo, 2014). Therefore, the Ministry of Education of Malaysia has established its goal to produce increased labour skilled in STEM, as specified in the Education Blueprint of Malaysia 2013-2025 (PPPM 2013-2025). The Education Blueprint is the benchmark for the education system. The main focus of the Blueprint is to raise achievement levels in Science and Mathematics with the integration of STEM, among students especially at secondary level, as well as to raise parents’ involvement through activities that increase their role in the acculturalization of STEM. Thus, the Ministry of Education has taken steps to implement STEM in the school curriculum, by introducing the Standard Curriculum for Secondary School, in 2017. This curriculum has fine-tuned the implementation of STEM for the science curriculum, by building a curriculum framework through six core elements, one of which is STEM being the core element in construction and implementation (Curriculum Development Centre, 2016a). Thus, this study will measure the relevant instruments, to ensure valid and reliable constructs, that can influence students’ interest in STEM related careers. Hence, the purpose of this study is to document the construction and validation of the instrument chosen, to be adapted to the students’ learning environment and the science curriculum in Malaysia. The Science Curriculum and the Need for STEM The need for STEM arose when the demand for career fields involving STEM exceeded other fields. 80% of the needs of the work sector in America involves STEM fields and have to be fulfilled in order to guarantee the strengthening and the progress of the economy (U.S. Department of Commerce, 2015). The increase in the demand for the need of labour, skilled in STEM is also observed in Malaysia, with an more than 1 million members of the work force skilled in STEM, needed for 2020 (MOSTI, 2015). The need to fill the vacuum in the industrial sector is a critical issue at global level, when there is a consistent decrease in students’ participation in the Science Stream, beginning at secondary school level. (Blankenburg, Höffler, & Parchmann, 2016; Ismail, Samsudin, & Zain, 2014). The initiative to strengthen the Science curriculum with the integration of STEM, is one of the 100 initiatives in the Education Blueprint 2013-2025, in order to provide career opportunities for the future and as the nation’s preparation to face the Fourth Industrial Revolution. From the angle of implementation of the Science curriculum, the Ministry has taken steps, among them, to broaden the students’ view of the Science curriculum and the application of science and technology in life and careers. (KPM, 2015). Besides this, there is the absorption of various

International Journal of Academic Research in Business and Social Sciences Vol. 7, Special Issue - 4th International Conference on Educational Research and Practice 2017
ISSN: 2222-6990
247 www.hrmars.com
information related to Science and STEM, in order for the students to see its relation to the working world. The absorption and awareness of STEM is student–centred and the teacher instead, is a facilitator to build the students’ inclination and interest towards Science, as a result of the teaching-learning session. (Blankenburg et al., 2016). Students are given priority in the process of translating the science curriculum and in the fine tuning of STEM, for every learning and facilitation session (PdPc) (Butler, Marsh, Slavinsky, & Baraniuk, 2014). Thus, the need to identify students’ interest towards STEM is the priority, so that every effort that is planned and executed is fruitful. According to Eisner (1979), meeting students’ needs consists of three elements necessary in every school curriculum, which are Extrinsic, Intrinsic and Null curriculum. An Extrinsic curriculum refers to the written curriculum, and is the main tool for formal teaching and encompasses curriculum documents, text books and teaching materials designed for the effective implementation of learning and facilitation (PdPc). On the other hand, an Intrinsic Currriculum is a curriculum that facilitates the learning process and knowledge which is connected to the student’s prior knowledge which is used to build on new knowledge. The Intrinsic curriculum has to be given attention by the teacher, as every student has different learning experiences, and the student is able to connect his or her learning experience to the current learning in process. The Extrinsic and Intrinsic Curriculum are equally important and usually taught both by parents and teachers to help students obtain high achievement levels in their studies. However,according to Eisner (1979), a Null curriculum refers to a curriculum which is not taught in school but has equal importance as the Extrinsic and Intrinsic curriculum, in producing students of high quality and to achieve the true purpose of a planned curriculum. A Null curriculum refers to attitudes, knowledge value, expectations, emotions and students’ readiness for every curriculum that is taught. The Null curriculum complements the Extrinsic and Intrinsic curriculum as it widens the students’ knowledge about the application of Science in life and careers in STEM fields (Nugent et al., 2015). Therefore, the combination of the three curricula provides the package or the success of each student to increase the enrolment of skilled labour, to fulfill global needs in STEM careers, that are expected to increase by the year 2024 (Fayer, Lacey, & Watson, 2017). In relation to this, the framework of the theory constructed is based on the important constructs in the instruments chosen in this study (Figure 1). Figure 1 combines 2 theories, which are Eisner’s Curriculum Theory (1979), which requires students to complete the school curriculum by combining Eisner’s three curricula, Extrinsic, Intrinsic and Null, to ensure that the planned curriculum can be achieved in a meaningful way. On the other hand, the Social Career Cognitive Theory (SCCT) (2013 is formed based on the Bandura’s Social Cognitive Theory (1986). This theory has been formed to suit the current learning situation or climate, as well as the

International Journal of Academic Research in Business and Social Sciences Vol. 7, Special Issue - 4th International Conference on Educational Research and Practice 2017
ISSN: 2222-6990
248 www.hrmars.com
needs of future learning outcomes. This theory was propounded by Len and Brown in 2013, and emphasises learning for lifelong use.
Figure 1: Theoritical Framework Interest Towards STEM Careers STEM and the Student Past studies state that besides having a stable curriculum and an interactive planned teaching that integrates the elements of STEM, the readiness of students towards cognitive needs (Förtsch, Werner, Dorfner, von Kotzebue, & Neuhaus, 2016), behaviour (Herrera López, Romera Félix, Ortega Ruiz, & Ortiz, 2016) and awareness of the needs of the environment (Shernoff et al., 2015), is necessary to create interest of students towards STEM-based careers. Hence, it is important to examine each factor separately in order to identify the key to activate the absorption of STEM and influence the students’ consistency in choosing STEM-based careers. The cognitive factor that influence the students’ readiness to learn Science meaningfully is the student’ attitude towards Science. A positive attitude is usually influenced by students’ high achievement in Science, and effective learning of Science will help sudents readiness to be assessed (Lipnevich & Gjicali, 2016). Attitude should be complemented by students’ behaviour, which gives an early indication of input from knowledge and output from environmental needs. Hence, motivation was the choice in past studies as a behavioural factor (Bandura, 1991; Herrera López et al., 2016) and gave maximum impact to students’ attitude towards Science and the perseverence of their interest in STEM –related careers (Elias, Mustafa, Roslan, & Noah,
Students` needs
Interest Towards
STEM Careers BEHAVIOUR
ENVIRONMENT
COGNITIVE
Ext
rin
sic
cur
ric
ulu
m Null curriculum
Intr
insi
c
cur
ric
ulu
m
International Journal of Academic Research in Business and Social Sciences Vol. 7, Special Issue - 4th International Conference on Educational Research and Practice 2017
ISSN: 2222-6990
249 www.hrmars.com
2010; Hamjah, Ismail, Rasit, & Rozali, 2011; Wust-Ackermann, Randler, Vollmer, & Itzek-greulich, 2016). However, low motivation will influence students’ attitude towards Science and it is important to raise students’ motivation levels in order for them to be ready to face challenges and to be able to compete. According to Ubale & Abdullah (2015), parents’ involvement could help to raise motivation levels and help students’ in making the right decisions as parents have better prediction skills regarding the students’ learning, and can also act as maximum support agents to students, regardless of the field they have chosen. Identifying attitude, motivation and parental influence in building students’ interest towards Science and the consistency of students’ in choosing STEM-based careers in future, is important to guarantee the Ministry of Education’s intention to produce productive human capital who will act as the driving force in strengthening the country’s economy (Bahagian Pembangunan Kurikulum, 2016b). Hence, this study measures the reliability of the questionnaire related to attitude, motivation and parental influence towards career interest of students’ in the science stream. Instruments Used in the Construction of STEM-Related Career Interest Instrument This study uses instruments to measure attitudes and careers, Student Attitudes toward Science, Technology, Engineering, and Math (S-STEM) and interest in STEM careers. S- STEM has 2 constructs consisting of attitudes towards STEM and STEM career interest. Motivation levels towards Science and interest in STEM careers are measured with Science Motivation Questionnaire II (SMQ-II). Prior achievement is measured from marks/ achievement grades of students in the PT3, whereas parental authority is measured using Parental Authority Questionnaire (PAQ), from the students’ perspective.
• Student Attitudes toward Science, Technology, Engineering, and Math (S-STEM) and interest in STEM careers.
This questionnaire is divided into two parts. The first part measures students’ attitude towards STEM and the second measures STEM career interest of students. Part 1 covers the measurement of students’ self-confidence towards Science, Technology, Engineering and Mathematics (STEM) The questionnaire for this part contains 12 items which consist of 4 constructs, which are attitudes towards Science, Mathematics, Technology and Engineering. The measurement uses an interval scale (scale 1-10, Strongly Disagree – Strongly Agree) Part 2 are related to the measurement of students’ career interest in STEM fields. This questionnaire uses an interval scale (scale 1 – 10, Strongly Disagree – Strongly Agree), to measure the level of career interest in the field they wish to enter.
• Science Motivation Questionnaire II (SMQ-II) This questionnaire measures students’ confidence to study science and understand the career scope. This questionnaire consists of 18 items and 5 constructs, which four items for each
International Journal of Academic Research in Business and Social Sciences Vol. 7, Special Issue - 4th International Conference on Educational Research and Practice 2017
ISSN: 2222-6990
250 www.hrmars.com
construct (self-efficacy, self-determination, achievement grades and career) The questionnaire uses an interval scale (scale 1- 10, Strongly Disagree – Strongly Agree), to measure students’ motivation which influences consistency in choosing STEM careers.
• Parental Authority Questionnaire (PAQ) PAQ is designed to measure parental influence on motivation to study science and students’ career interest. The questionnaire is from the students’ perspective and has been adapted according to the objective of the study PAQ consists of 12 items and an interval scale (scale 1 – 10, Strongly Disagree – Strongly Agree) Methodology In this section, technical and systematic processors are used to develop and validate students’ STEM Career questionnaires. Research questionnaire was developed from three questionnaires namely Student Attitudes toward Science, Technology, Engineering, and Math (S-STEM) to measure the influence of attitude constructs, Science Motivation Questionnaire II (SMQ-II) to measure the influence of student motivation constructs, Parental Authority Questionnaire (PAQ) to measure the constructs of parent's influence and STEM's career interests by using the Your Future questionnaire. The questionnaire was adapted into Malay and modifications were made for each questionnaire for adaptation to the scope of the study to identify the influence of attitudes, motivations and parental influence on student STEM careers. The sample selection for this study was carried out using Multi-Stage Cluster sampling method and random selection (Bartlett, Kotrlik, & Chardwick, 2001). The sample of the study was the Form Four Science Stream students of the Secondary School in Selangor, Malaysia. Research Finding Instruments of the study are tools to measure, observe and document quantitative data (Creswell, 2012). For this purpose, the study instrument used must also be suitable for the needs of the study. The instruments in this study are divided into four parts whereby each part refers to the instrument chosen for adaptation and modification. The four parts, which are Part B (Science Motivation Questionnaire II (SMQ II)), is related to students’ motivation to choose the science stream in line with career interest in STEM. Part C (Student Attitude towards STEM Survey (S-STEM)) is related to students’ attitude towards science in line with career interest in STEM and Part D (Parental Authority Questionnaire (PAQ)) is the construct to measure parental influence on students in the science stream to choose careers in the STEM fields. The final part, Part F (S-STEM from the construct, Your Future) is related to students’ interest in STEM fields. This study has adapted instruments that were constructed by previous researchers, and modified certain statements to accommodate the study being conducted. According to Awang 2012 & Hoque et al., 2016, if the researcher adapts the existing instruments and modifies

International Journal of Academic Research in Business and Social Sciences Vol. 7, Special Issue - 4th International Conference on Educational Research and Practice 2017
ISSN: 2222-6990
251 www.hrmars.com
statements into new items, the researcher has to carry out the Exploratory Factor Analysis (EFA) procedure as a different field of study could possibly render some items being unsuitable for the current study in question. Besides, the Internal Reliability of the instrument, which is measured by the Cronbach’s Alpha value, could also differ from previous studies (Awang, 2012; Hoque et al., 2016). Thus, this study is necessary to test the instrument in order to ensure that the questionnaire is understood by the respondents and that there are no ambiguities in language or measurement. Items which are not understood and are not suitable, have to be discarded, to ensure validity and reliability of the items in the instruments used in the study (Sekaran, 2013). Motivational Construct Analysis The Motivational Construct is measured from the Science Motivation Questionnaire II (SMQ II), using 18 items labelled as B1 to B18. Each statement in the item is measured using an Interval Scale from 1 to 10. The mean score value and the standard deviation for each item measuring the construct is shown in Table 1. Table 1: Min and Standard Deviation Motivation Items
Descriptive Statistics
Mea
n
Std. Deviatio
n Analys
is N
B1 6.35 2.037 100
B2 7.34 1.897 100
B3 7.43 2.147 100
B4 6.73 1.836 100
B5 7.49 1.761 100
B6 6.77 1.734 100
B7 8.65 1.833 100
B8 7.50 2.368 100
B9 6.54 2.032 100
B10 6.36 2.181 100
B11 7.91 1.646 100
B12 5.07 2.396 100
B13 7.44 1.777 100
B14 7.52 1.823 100
B15 7.23 1.896 100
B16 7.72 1.764 100
B17 6.46 2.091 100
B18 7.27 1.969 100

International Journal of Academic Research in Business and Social Sciences Vol. 7, Special Issue - 4th International Conference on Educational Research and Practice 2017
ISSN: 2222-6990
252 www.hrmars.com
The Exploratory Factor Analysis (EFA) Procedure, using the Principal Component Analysis (PCA) with Varimax Rotation, was conducted on the 18 items used to measure the motivation construct. The findings in Table 2 show a significant value for the Bartlet Test (P-Value < 0.05). At the same time, the value for the Measure of Sampling Adequacy by Kaiser-Meyer-Olkin (KMO), is 0.864, which exceeds the minimum value of 0.6 (Awang, 2010; 2012; Hoque et al., 2016). These two values, (significance in the Bartlet Test, and the value KMO> 0.6) proves that the data is suitable is for the subsequent procedure in the Exploratory Factor Analysis (EFA). Table 2: Value of KMO and Barlett Test
Table 3 shows the total variance value estimated by the items used to measure the Motivation Construct. Table 3 shows that the Motivation Construct was measured using 4 components. Component 1 measured the construct at 24.530%, whereas Component 2 measured the construct at 20.350%. Component 3 measured the construct at 14.696% and the final Component measured the construct at 8.835%. The total estimated variance for the MotivationConstruct was 68.411%. This value is acceptable as it exceeds the minimum requirement of 60% (Awang, 2012; Hoque et al., 2016). Table 3: Total Variance Value Estimated
Total Variance Explained
Component
Extraction Sums of Squared Loadings Rotation Sums of Squared Loadings
Total % of
Variance Cumulative
% Total % of
Variance Cumulative
%
1 7.924 44.020 44.020 4.415 24.530 24.530
2 1.911 10.619 54.639 3.663 20.350 44.880
3 1.361 7.561 62.199 2.645 14.696 59.576
4 1.118 6.212 68.411 1.590 8.835 68.411
Extraction Method: Principal Component Analysis.
Table 4 shows the distribution of items for the two components that measure the Motivation construct. Items B1, B2, B3, B4 and B9 measured Component 1, whereas item B8, B11, B12, B13, B15 dan B16 measure Componen 2. Subsequently, items B5, B6, B14 dan B18 measure Component 3, whereas Component 4 is represented by B9, B16 and B17. All the items in
KMO and Bartlett's Test
Kaiser-Meyer-Olkin Measure of Sampling Adequacy.
0.864
Bartlett's Test of Sphericity
Approx. Chi-Square 1145.357
df 153
Sig. 0.000

International Journal of Academic Research in Business and Social Sciences Vol. 7, Special Issue - 4th International Conference on Educational Research and Practice 2017
ISSN: 2222-6990
253 www.hrmars.com
Components 1, 2, 3 and 4 have Factor Loading values which exceed the minimum value of 0.6 (Hoque et al., 2016). Table 4: Items to Measure the Motivation Constructs
Rotated Component Matrixa
Component
1 2 3 4
B1 .799
B2 .732
B3 .759
B4 .790
B5 .849
B6 .699
B7 .750
B8 .631
B9 .717
B10 .649
B11 .714
B12 .722
B13 .740
B14 .682
B15 .610
B16 .831
B17 .755
B18 .893
Extraction Method: Principal Component Analysis. Rotation Method: Varimax with Kaiser Normalization.a
a. Rotation converged in 18 iterations.
The instrument for measuring reliability, which is consistent and often used is Cronbach’s Alpha. Therefore, the evaluation of Cronbach’s Alpha is used in this study, to measure consistency of instruments for each construct. The value for Cronbach’s Alpha for an instrument should exceed 0.7, in order to be acceptable in subsequent studies. A Cronbach’s Alpha value of 0.7 and above shows that the instrument has high reliability standards (Hair, Black, Babin, & Anderson, 2010). Table 5 shows that the Cronbach’s Alpha value for the Science Motivation Questionnaire II (SMQ II) instrument, has high reliability as the Cronbach’s Alpha value was 0.913.

International Journal of Academic Research in Business and Social Sciences Vol. 7, Special Issue - 4th International Conference on Educational Research and Practice 2017
ISSN: 2222-6990
254 www.hrmars.com
Table 5: Instrument Reliability Value (SMQ II)
Reliability Statistics
Cronbach's Alpha
Cronbach's Alpha Based
on Standardized
Items N of Items
.913 .919 18
Attitude Construct Analysis Attitude Construct is measured by Student Attitude towards STEM Survey (S-STEM) instrument. Item labelled as a C1 to C12 (Table 6). Each statement in the item is measure using an Inerval scale from 1 to 10. The mean score value and the standard deviation for each item measuring the construct is shown in Table 6. Table 6: Min and Standard Deviation Attitude Items
Descriptive Statistics
Mean Std.
Deviation Analysis N
C1 8.02 1.964 100
C2 7.56 2.007 100
C3 7.23 2.059 100
C4 6.82 1.731 100
C5 8.20 1.729 100
C6 7.79 1.748 100
C7 7.26 1.796 100
C8 6.22 1.710 100
C9 7.53 2.368 100
C10 6.89 2.374 100
C11 5.04 2.378 100
C12 5.79 2.332 100
The Exploratory Factor Analysis Procedure (EFA) using Principal Component Analysis (PCA) with Varimax Rotation has been carried out on 12 items that measure Construct Attitude. The findings in Table 7 show that the Bartlett Test value is significant (P-Value <0.05). Meanwhile,

International Journal of Academic Research in Business and Social Sciences Vol. 7, Special Issue - 4th International Conference on Educational Research and Practice 2017
ISSN: 2222-6990
255 www.hrmars.com
Measure of Sampling Adequacy by Kaiser-Meyer-Olkin (KMO) is 0.718 which is above the minimum value of 0.6. Both of these achievements (significant Bartlett Test, and KMO value> 0.6) reflect the item is feasible for the next procedure in the Exploration Factor Analysis (EFA) (Awang, 2012; Hoque et al., 2016). Table 7: Value of KMO and Barlett Test
KMO and Bartlett's Test
Kaiser-Meyer-Olkin Measure of Sampling Adequacy.
0.718
Bartlett's Test of Sphericity
Approx. Chi-Square 491.283
df 55
Sig. 0.000
The total variance of the estimated variance (Total Variance Explained) is important to know the percentage of items constructed can measure a study construct. Table 8 shows the total value of the variance estimated by the items used to measure Construct Attitude. Table 8 shows the attitude constructs measured using only four components. The total variance estimates (Total Variance Explained) for Construct Attitude are 72.630%. This value is good and acceptable because it exceeds the minimum requirement of 60% (Awang, 2012; Hoque et al., 2016). Table 8: Total Variance Estimates
Total Variance Explained
Component
Extraction Sums of Squared Loadings Rotation Sums of Squared Loadings
Total % of Variance Cumulative % Total % of Variance Cumulative %
1 4.449 40.446 40.446 2.683 24.390 24.390
2 1.308 11.890 52.336 2.441 22.191 46.581
3 1.220 11.091 63.427 1.711 15.556 62.137
4 1.012 9.202 72.630 1.154 10.493 72.630
Extraction Method: Principal Component Analysis.
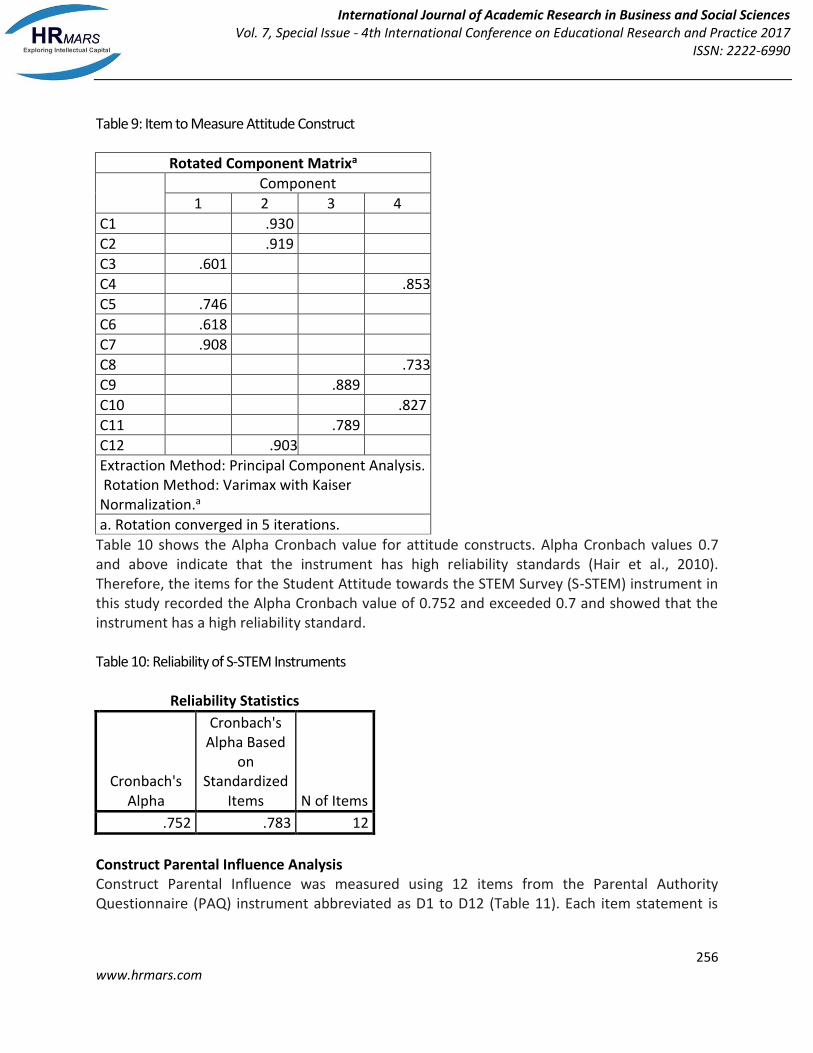
Table 9 shows items selected to measure Construct Attitude. It is noted that all items have Factor Loading exceeds the minimum limit of 0.6 and are acceptable for further analysis.
International Journal of Academic Research in Business and Social Sciences Vol. 7, Special Issue - 4th International Conference on Educational Research and Practice 2017
ISSN: 2222-6990
256 www.hrmars.com
Table 9: Item to Measure Attitude Construct
Rotated Component Matrixa
Component
1 2 3 4
C1 .930
C2 .919
C3 .601
C4 .853
C5 .746
C6 .618
C7 .908
C8 .733
C9 .889
C10 .827
C11 .789
C12 .903
Extraction Method: Principal Component Analysis. Rotation Method: Varimax with Kaiser Normalization.a
a. Rotation converged in 5 iterations.
Table 10 shows the Alpha Cronbach value for attitude constructs. Alpha Cronbach values 0.7 and above indicate that the instrument has high reliability standards (Hair et al., 2010). Therefore, the items for the Student Attitude towards the STEM Survey (S-STEM) instrument in this study recorded the Alpha Cronbach value of 0.752 and exceeded 0.7 and showed that the instrument has a high reliability standard. Table 10: Reliability of S-STEM Instruments
Reliability Statistics
Cronbach's Alpha
Cronbach's Alpha Based
on Standardized
Items N of Items
.752 .783 12
Construct Parental Influence Analysis Construct Parental Influence was measured using 12 items from the Parental Authority Questionnaire (PAQ) instrument abbreviated as D1 to D12 (Table 11). Each item statement is

International Journal of Academic Research in Business and Social Sciences Vol. 7, Special Issue - 4th International Conference on Educational Research and Practice 2017
ISSN: 2222-6990
257 www.hrmars.com
measured using the Interval Scale of 1 to 10. The mean score and the standard deviation obtained for each item measuring the constructs are shown in Table 11. Table 11: Min and Standard Deviation of Parental Influence
Descriptive Statistics
Mean Std.
Deviation Analysis N
D1 8.84 1.785 100
D2 7.40 2.314 100
D3 8.04 2.010 100
D4 8.74 1.643 100
D5 5.23 2.662 100
D6 7.18 2.236 100
D7 8.06 2.164 100
D8 8.55 1.828 100
D9 7.27 2.313 100
D10 7.51 2.172 100
D11 8.43 1.533 100
D12 8.24 1.700 100
The Exploratory Factor Analysis (EFA) Procedure using the Component Principle Analysis (PCA) with Varimax Rotation has been conducted on 14 items that measure the Influence of Parental Influence. The findings in Table 12 show that the Bartlett Test value is significant (P-Value <0.05). Whereas, Measure of Sampling Adequacy by Kaiser-Meyer-Olkin (KMO) is 0.896 which is above the minimum value of 0.6. Both of these achievements (Significant Bartlett Test, and KMO value> 0.6) reflect data is feasible for further procedures in the Analysis of Exploration Factor (EFA) (Awang, 2012; Hoque et al., 2016). Table 12: Value of KMO and Barlett Test
KMO and Bartlett's Test
Kaiser-Meyer-Olkin Measure of Sampling Adequacy.
0.896
Bartlett's Test of Sphericity
Approx. Chi-Square 693.919
df 91
Sig. 0.000
Table 13 shows the total value of the variance estimated by item items used to measure the Influence of Parents Influence. The reading from Table 13 found that the Influence of Parent Influence was measured using three components. Estimated variance for component 1 is 45.702%, while component 2 is occupied by 9.101% and component 3 estimated variance is

International Journal of Academic Research in Business and Social Sciences Vol. 7, Special Issue - 4th International Conference on Educational Research and Practice 2017
ISSN: 2222-6990
258 www.hrmars.com
8.828%. The total budget variance for the Parent Influence construct was 63.631%. This value is good and acceptable because it exceeds the minimum requirement of 60% (Awang, 2012; Hoque et al., 2016). Table 13: Value of Variance Estimated
Total Variance Explained
Component
Extraction Sums of Squared Loadings Rotation Sums of Squared Loadings
Total % of
Variance Cumulative
% Total % of
Variance Cumulative %
1 8.566 62.897 63.631 8.398 63.631 63.631
Extraction Method: Principal Component Analysis.
Researchers also want to know which items to choose can measure the Influence of Parents. Table 14 shows the items that measure the influence of Parental Influence. All items D1 to D14 have factor weighting factor (Factor Loading) exceeds the minimum limit 0.6 (Awang, 2012; Hoque et al., 2016). However, D2 items for components 2 and D5 for component 3 need to be removed because only one item represents each component and cannot make further analysis (Hair et al., 2010). Therefore, the number of items retained is 12 items and from 1 component. Table 14: Item to Measure Parental Influence Construct
Rotated Component Matrixa
Component
1
D1 .745
D2 .838
D3 .779
D4 .789
D5 .917
D6 .709
D7 .620
D8 .707
D9 .733
D10 .610
D11 .667
D12 .772
D13 .809
D14 .769
Extraction Method: Principal Component Analysis.
a. 1 components extracted.

International Journal of Academic Research in Business and Social Sciences Vol. 7, Special Issue - 4th International Conference on Educational Research and Practice 2017
ISSN: 2222-6990
259 www.hrmars.com
The measure of internal reliability of an instrument is estimated through Alpha Cronbach value. Alpha Cronbach values 0.7 and above indicate that the instrument has high reliability standards (Hair et al., 2010). Table 15 shows the Alpha Cronbach value for the construct. Items that measure the construct have Alpha Cronbach values exceeding 0.7 and can be applied in this study. Table 15: Reliability Parent Instrument Authority Questionnaire (PAQ)
Reliability Statistics
Cronbach's Alpha
Cronbach's Alpha Based
on Standardized
Items N of Items
.918 .922 14
STEM career construct analysis STEM career constructs are measured using the 12 items selected from Your Future construct in the S-STEM instrument abbreviated as F1 to F12 (Table 16). Each item statement is measured using the Interval Scale between 1 to 10. The mean score and the standard deviation available for each item that measures the constructs are shown in Table 16. Table 16: Min and Standard Deviation of Career Items
Descriptive Statistics
Mean Std.
Deviation Analysis N
F1 4.56 2.610 100
F2 6.67 2.663 100
F3 5.07 2.520 100
F4 5.47 2.414 100
F5 6.07 2.618 100
F6 5.80 2.247 100
F7 5.50 2.468 100
F8 5.35 2.587 100
F9 5.33 2.719 100
F10 5.61 2.331 100
F11 5.93 2.430 100
F12 5.94 2.436 100
International Journal of Academic Research in Business and Social Sciences Vol. 7, Special Issue - 4th International Conference on Educational Research and Practice 2017
ISSN: 2222-6990
260 www.hrmars.com
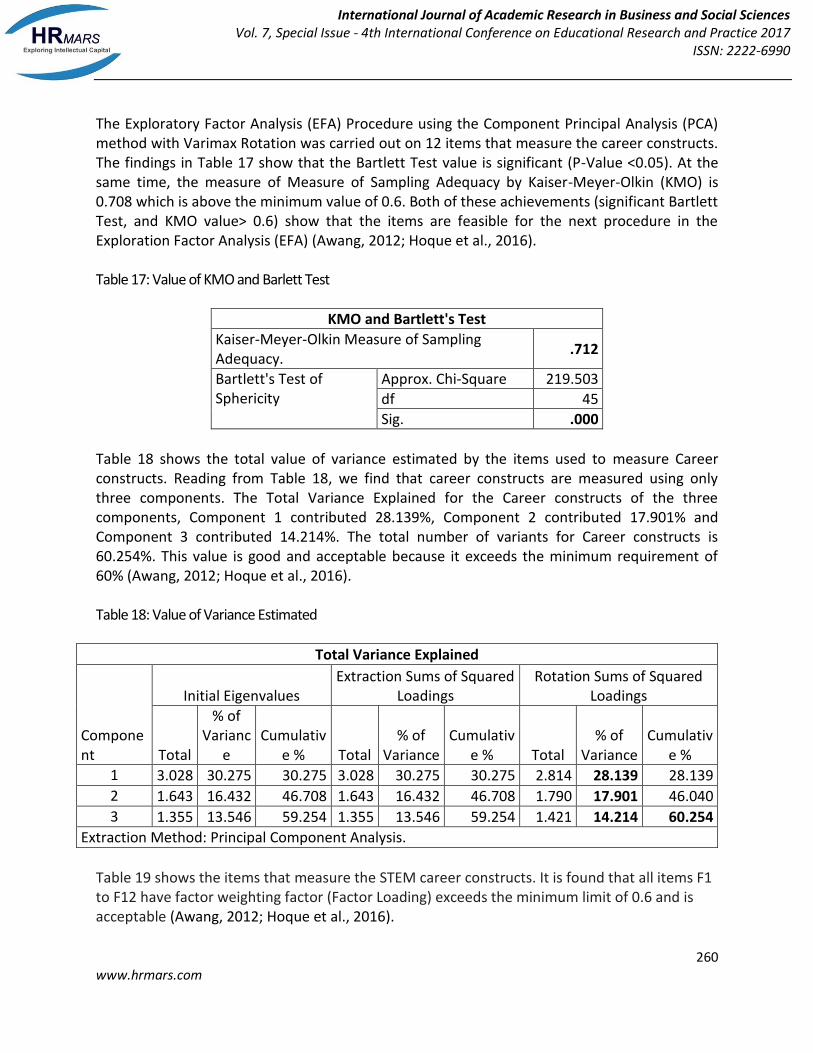
The Exploratory Factor Analysis (EFA) Procedure using the Component Principal Analysis (PCA) method with Varimax Rotation was carried out on 12 items that measure the career constructs. The findings in Table 17 show that the Bartlett Test value is significant (P-Value <0.05). At the same time, the measure of Measure of Sampling Adequacy by Kaiser-Meyer-Olkin (KMO) is 0.708 which is above the minimum value of 0.6. Both of these achievements (significant Bartlett Test, and KMO value> 0.6) show that the items are feasible for the next procedure in the Exploration Factor Analysis (EFA) (Awang, 2012; Hoque et al., 2016). Table 17: Value of KMO and Barlett Test
KMO and Bartlett's Test
Kaiser-Meyer-Olkin Measure of Sampling Adequacy.
.712
Bartlett's Test of Sphericity
Approx. Chi-Square 219.503
df 45
Sig. .000
Table 18 shows the total value of variance estimated by the items used to measure Career constructs. Reading from Table 18, we find that career constructs are measured using only three components. The Total Variance Explained for the Career constructs of the three components, Component 1 contributed 28.139%, Component 2 contributed 17.901% and Component 3 contributed 14.214%. The total number of variants for Career constructs is 60.254%. This value is good and acceptable because it exceeds the minimum requirement of 60% (Awang, 2012; Hoque et al., 2016). Table 18: Value of Variance Estimated
Total Variance Explained
Component
Initial Eigenvalues Extraction Sums of Squared
Loadings Rotation Sums of Squared
Loadings
Total
% of Varianc
e Cumulativ
e % Total % of
Variance Cumulativ
e % Total % of
Variance Cumulativ
e %
1 3.028 30.275 30.275 3.028 30.275 30.275 2.814 28.139 28.139
2 1.643 16.432 46.708 1.643 16.432 46.708 1.790 17.901 46.040
3 1.355 13.546 59.254 1.355 13.546 59.254 1.421 14.214 60.254
Extraction Method: Principal Component Analysis.
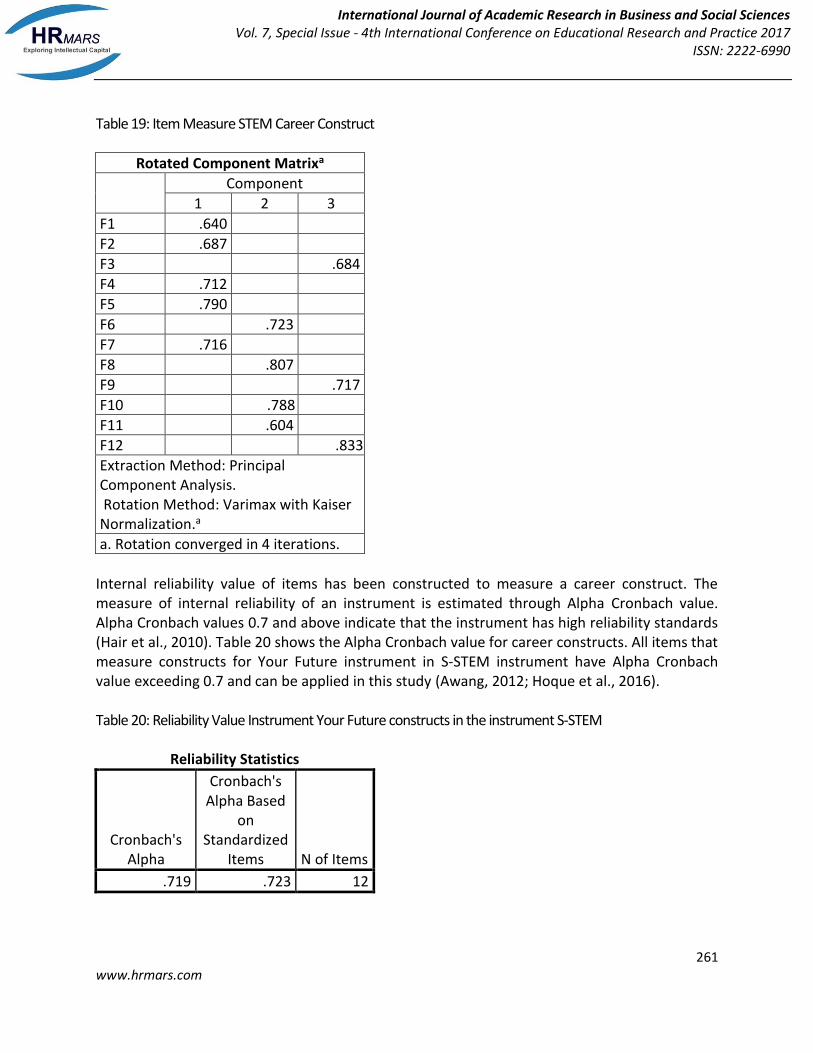
Table 19 shows the items that measure the STEM career constructs. It is found that all items F1 to F12 have factor weighting factor (Factor Loading) exceeds the minimum limit of 0.6 and is acceptable (Awang, 2012; Hoque et al., 2016).
International Journal of Academic Research in Business and Social Sciences Vol. 7, Special Issue - 4th International Conference on Educational Research and Practice 2017
ISSN: 2222-6990
261 www.hrmars.com
Table 19: Item Measure STEM Career Construct
Rotated Component Matrixa
Component
1 2 3
F1 .640
F2 .687
F3 .684
F4 .712
F5 .790
F6 .723
F7 .716
F8 .807
F9 .717
F10 .788
F11 .604
F12 .833
Extraction Method: Principal Component Analysis. Rotation Method: Varimax with Kaiser Normalization.a
a. Rotation converged in 4 iterations.
Internal reliability value of items has been constructed to measure a career construct. The measure of internal reliability of an instrument is estimated through Alpha Cronbach value. Alpha Cronbach values 0.7 and above indicate that the instrument has high reliability standards (Hair et al., 2010). Table 20 shows the Alpha Cronbach value for career constructs. All items that measure constructs for Your Future instrument in S-STEM instrument have Alpha Cronbach value exceeding 0.7 and can be applied in this study (Awang, 2012; Hoque et al., 2016). Table 20: Reliability Value Instrument Your Future constructs in the instrument S-STEM
Reliability Statistics
Cronbach's Alpha
Cronbach's Alpha Based
on Standardized
Items N of Items
.719 .723 12

International Journal of Academic Research in Business and Social Sciences Vol. 7, Special Issue - 4th International Conference on Educational Research and Practice 2017
ISSN: 2222-6990
262 www.hrmars.com
Discussion Each construct can successfully explain STEM career interest population and instruments for measuring STEM-related career interest, also shows consistent measurement for each item and ensures reliability of each construct, in measuring the influence of the construct on Stem- related career interest. The results of the study also prove the importance of STEM–related career interest in the learning of Science [i.e. Stem-related career interest is the main focus in the science curriculum (Badri et al., 2016)], and the resulting science curriculum targetted [i.e. the target for the education initiative is to positive effect in students’ interest in science and STEM-based careers (KPM, 2015)]. Therefore, this study focusses on the key influences on STEM based carrer interest, which are attitude, motivation and parental influence. Conclusion In this study, the presentation will focus on combining 3 instruments by using a few constructs for each instrument, to be adapted to students’ learning and the Science curriculum in Malaysia. This instrument is useful to measure attitude, motivation and parental influence in deciding students’ inclination to be interested in Science and STEM based careers. The instruments involved are easy to comprehend in relation to the students’ learning environment. The instrumen is not only limited for use for students in the Science stream but may be used for other streams of study such as Agricultural Science, Computer Science, Home Economics, Sports Science, Design and Technical studies, as all these streams are related to STEM fields, as outlined in the KSSM (Curriculum Development Centre, 2016). References Awang, Z. (2012). Research methodology and data analysis. Penerbit Universiti Teknologi MARA
Press. Badri, M., Alnuaimi, A., Mohaidat, J., Al Rashedi, A., Yang, G., & Al Mazroui, K. (2016). My
science class and expected career choices—a structural equation model of determinants involving Abu Dhabi high school students. International Journal of STEM Education, 3(1), 12. http://doi.org/10.1186/s40594-016-0045-0
Bahagian Pembangunan Kurikulum. (2016). Panduan Pelaksanaan Sains, Teknologi, Kejuruteraan dan Matematik (STEM) dalam Pengajaran dan Pembelajaran (Mac). Bahagian Pembangunan Kurikulum.
Bahagian Pembangunan Kurikulum. (2016). Panduan Pelaksanaan Sains, Teknologi, Kejuruteraan dan Matematik dalam Pengajaran dan Pembelajaran. Kuala Lumpur.
Bandura, A. (1991). Social cognitive theory of self-regulation. Organizational Behavior and Human Decision Processes, 50(2), 248–287. http://doi.org/10.1016/0749-5978(91)90022-L
Bartlett, J. E., Kotrlik, J. W., & Chardwick, C. C. (2001). Organizational research : Determining appropriate sample size in survey research. Information Technology, Learning, and Performance Journal, 19(1), 43–49.
Blankenburg, J. S., Höffler, T. N., & Parchmann, I. (2016). Fostering Today What is Needed Tomorrow: Investigating Students’ Interest in Science. Science Education, 100(2), 364–391. http://doi.org/10.1002/sce.21204
International Journal of Academic Research in Business and Social Sciences Vol. 7, Special Issue - 4th International Conference on Educational Research and Practice 2017
ISSN: 2222-6990
263 www.hrmars.com
Bryan, L. A., Moore, T. J., Johnson, C. C., & Roehrig, G. H. (2015). Integrated STEM education. In C. C. Johnson, E. E. Peters-Burton, & T. J. Moore (Eds.), STEM roadmap: A framework for integration (pp. 23–37). London: Taylor & Francis. Butler, A. C., Marsh, E. J., Slavinsky, J. P., & Baraniuk, R. G. (2014). Integrating Cognitive Science
and Technology Improves Learning in a STEM Classroom. Educational Psychology Review, 26(2), 331–340. http://doi.org/10.1007/s10648-014-9256-4
Creswell, J. W. (2012). Educational research: Planning, conducting, and evaluating quantitative and qualitative research. Educational Research (Vol. 4). http://doi.org/10.1017/CBO9781107415324.004
Eisner, E. W. (1979). The Three Curicula That All Schools Teach. In E. W. Eisner (Ed.), The Educational Imagination (Third, pp. 87–107). New York: Macmillian Publishing.
Elias, H., Mustafa, S. M. S., Roslan, S., & Noah, S. M. (2010). Examining potential relationships between flow and motivational forces in Malaysian secondary school students. Procedia - Social and Behavioral Sciences, 9, 2042–2046. http://doi.org/10.1016/j.sbspro.2010.12.443
Fayer, S., Lacey, A., & Watson, A. (2017). STEM Occupations : Past , Present , And Future. U.S. Bureau Of Labor Statistics.
Förtsch, C., Werner, S., Dorfner, T., von Kotzebue, L., & Neuhaus, B. J. (2016). Effects of Cognitive Activation in Biology Lessons on Students’ Situational Interest and Achievement. Research in Science Education, 26(5), 1–20. http://doi.org/10.1007/s11165-016-9517-y
Fouad, N. A., & Santana, M. C. (2017). SCCT and Underrepresented Populations in STEM Fields : Moving the Needle. Journal of Career Assessment, 25(1), 24–39. http://doi.org/10.1177/1069072716658324.
Hair J. F., Black, W. C., Babin, B. J., & Anderson, R. E. (2010). multivariate data analysis (7th ed.). Pearson Prentice Hall.
Hamjah, S. H., Ismail, Z., Rasit, R. M., & Rozali, E. A. (2011). Methods of increasing learning motivation among students. Procedia - Social and Behavioral Sciences, 18, 138–147. http://doi.org/10.1016/j.sbspro.2011.05.021
Herrera López, M., Romera Félix, E. M., Ortega Ruiz, R., & Ortiz, O. G. (2016). Influence of social motivation, self-perception of social efficacy and normative adjustment in the peer setting. Psicothema, 28(1), 32–39. http://doi.org/10.7334/psicothema2015.135
Hoque, A. S. M. M., & Awang, Z. (2016). The Exploratory Factor Analysis (EFA) of Entrepreneurial Marketing Scale - Development and Validation. Tourism Conference 20-22 APRIL 2016 (p. 22).
Ismail, M., Samsudin, M., & Zain, A. (2014). A Multilevel Study on Trends in Malaysian Secondary School Students? Science Attitude: Evidence from TIMSS 2011. International Journal of Asian, 4(5), 572–584.
KPM. (2015). Annual Report 2015 MALAYSIA EDUCATION BLUEPRINT 2013-2025. Malaysia. KPM. (2013). Pelan Pembangunan Pendidikan Malaysia 2013 - 2025. Kementerian Pelajaran
Malaysia (Vol. 27). Lipnevich, A. A., & Gjicali, K. (2016). Understanding Attitudes In Education. In Non-cognitive
Skills and Factors in Educational Attainment (pp. 111–127). Sense Publishers. Ministry of Science, Technology and Innovation (2015). Sains dan Inovasi Pemacu Transformasi.

International Journal of Academic Research in Business and Social Sciences Vol. 7, Special Issue - 4th International Conference on Educational Research and Practice 2017
ISSN: 2222-6990
264 www.hrmars.com
Nugent, G., Barker, B., Welch, G., Grandgenett, N., Wu, C., & Nelson, C. (2015). A model of factors contributing to STEM learning and career orientation. International Journal of Science Education, 37(7), 1–22. http://doi.org/10.1080/09500693.2015.1017863
Sekaran, U. (2013). Research Methods for Business A Skill Building Approach. (J. C. Marshall, Ed.), Research methods for business (Fourth, Vol. 65). John Wiley & Sons, Inc. http://doi.org/10.1017/CBO9781107415324.004
Shernoff, D. J., Kelly, S., Tonks, S. M., Anderson, B., Cavanagh, R. F., Sinha, S., & Abdi, B. (2015). Student engagement as a function of environmental complexity in high school classrooms. Learning and Instruction, 43, 52–60. http://doi.org/10.1016/j.learninstruc.2015.12.003
Ubale, A. Z., & Abdullah, A. H. (2015). A Relationship between Parental Involvement and Intrinsic Motivation on Learning Islamic Education. Art and Social Sciences Journal, 5(7), 325–337. http://doi.org/10.6007/IJARBSS/v5-i7/1744
U.S. Department of Commerce. (2015). The Competitiveness and Innovative Capacity of the United States. Department of Commerce (Vol. 1).
Wiswall, M., Stiefel, L., Schwartz, A. E., & Boccardo, J. (2014). Does attending a STEM high school improve student performance? Evidence from New York City. Economics of Education Review, 40, 93–105. http://doi.org/10.1016/j.econedurev.2014.01.005
Wust-Ackermann, P., Randler, C., Vollmer, C., & Itzek-greulich, H. (2016). Learning Achievement and Motivation in an Out-of- School Setting — Visiting Amphibians and Reptiles in a Zoo Is More Effective than a Lesson at School. Research in Science Education, (January). http://doi.org/10.1007/s11165-016-9513-2


