
1
A leading financial services conglomerate
1
2 Aditya Birla Capital Copyright © 2017 Aditya Birla Capital
Key Highlights 3 – 5
Business-wise Performance 6 – 15
Financials and other Annexures 16 – 27
Note 1 : The financials of Aditya Birla Capital Limited are consolidated financials prepared as per Indian GAAP unless otherwise specified
Note 2 : The financial figures in this presentation have been rounded off to the nearest ` 1 Crore
Glossary
CY – Current Year
FY – Financial Year (April-March)
PY – Corresponding period in Previous Year
PQ – Previous Quarter
Q1– April-June
YTD – Year to date
LAS – Loan against Shares
NIM – Net Interest Margin
DPD – Days past due
CAB – Corporate Agents and Brokers
AAUM – Quarterly Average Assets under Management
FYP – First Year Premium Income
Banca - Bancassurance
NIM – Net Interest Margin
2
3 Aditya Birla Capital Copyright © 2017 Aditya Birla Capital
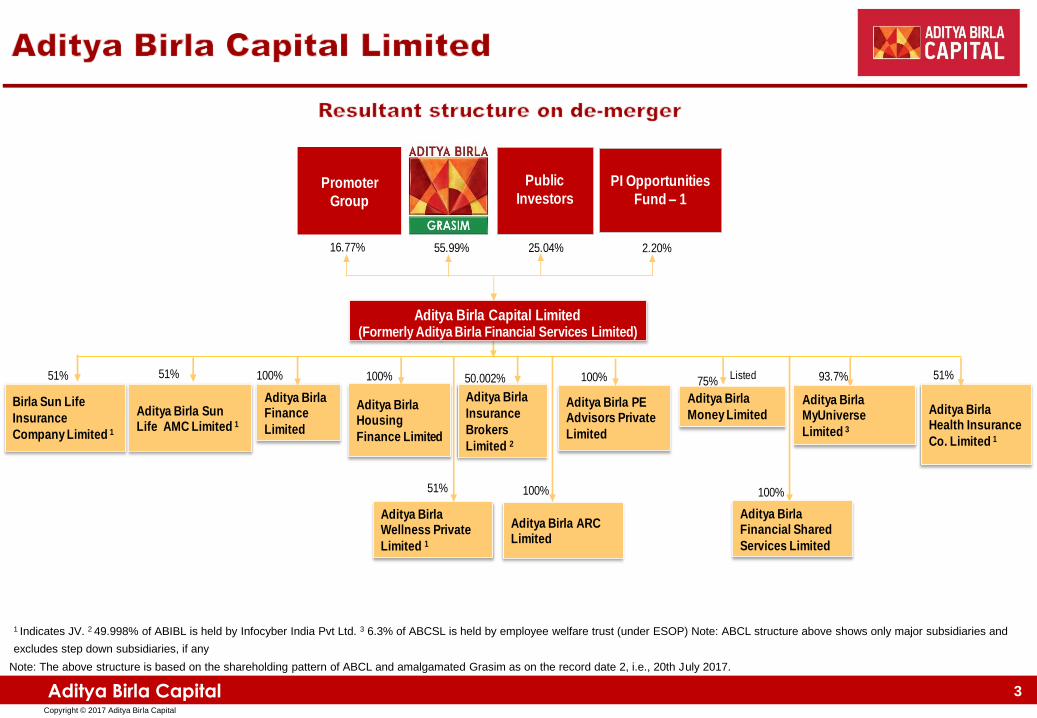
1 Indicates JV. 2 49.998% of ABIBL is held by Infocyber India Pvt Ltd. 3 6.3% of ABCSL is held by employee welfare trust (under ESOP) Note: ABCL structure above shows only major subsidiaries and
excludes step down subsidiaries, if any
3
Aditya Birla Sun Life AMC Limited 1
Aditya Birla Finance
Limited
Aditya Birla PE Advisors Private
Limited
Aditya Birla Housing
Finance Limited
Aditya Birla Health Insurance
Co. Limited 1
51% 100% 100%
Aditya Birla
Money Limited
75%51%Listed
Aditya Birla
Insurance
Brokers
Limited 2
50.002% 100%
Aditya Birla Financial Shared
Services Limited
100%
Aditya Birla MyUniverse
Limited 3
93.7%
Birla Sun Life
Insurance
Company Limited 1
Aditya Birla ARC Limited
Aditya Birla Wellness Private
Limited 1
100%51%
51%
55.99%
Public
Investors
25.04%
Promoter
Group
16.77%
PI Opportunities
Fund – 1
2.20%
Aditya Birla Capital Limited(Formerly Aditya Birla Financial Services Limited)
Note: The above structure is based on the shareholding pattern of ABCL and amalgamated Grasim as on the record date 2, i.e., 20th July 2017.
4 Aditya Birla Capital Copyright © 2017 Aditya Birla Capital
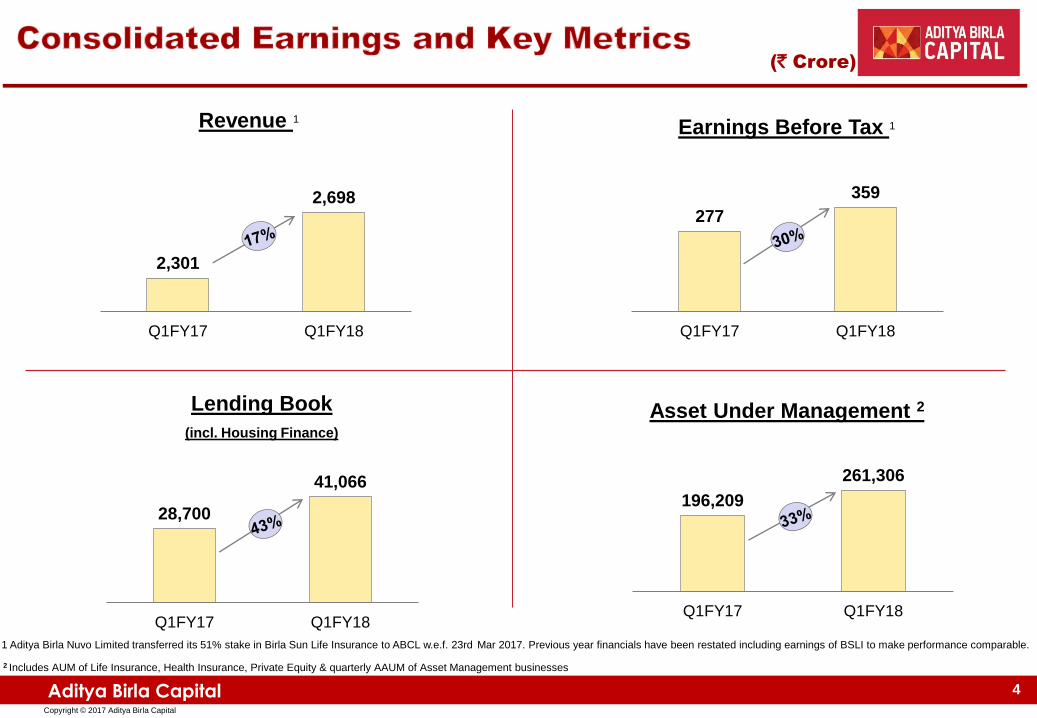
2,301
2,698
Q1FY17 Q1FY18
Revenue 1
277
359
Q1FY17 Q1FY18
28,700
41,066
Q1FY17 Q1FY18
Lending Book
(incl. Housing Finance)
196,209
261,306
Q1FY17 Q1FY18
Asset Under Management 2
(` Crore)
Earnings Before Tax 1
1 Aditya Birla Nuvo Limited transferred its 51% stake in Birla Sun Life Insurance to ABCL w.e.f. 23rd Mar 2017. Previous year financials have been restated including earnings of BSLI to make performance comparable.
2 Includes AUM of Life Insurance, Health Insurance, Private Equity & quarterly AAUM of Asset Management businesses
4

5 Aditya Birla Capital Copyright © 2017 Aditya Birla Capital
Revenue
Q1 FY17 Q1FY18 ∆% (` Crore)
EBT Q1 FY17 Q1 FY18 ∆%
Remarks
795 1,027 29% NBFC 189 258 37% Higher lending book (38%↑ y-o-y)
1,175 1,149 2% Life Insurance1 13 29 119% New business growth, cost optimization
and improvement in quality metrics
204 271 32% Asset Management 93 104 11% Growth in AUM (38%↑ y-o-y)
38 47 24% General Insurance Advisory 19 19 Higher premium placement (46%↑ y-o-y)
27 34 24% Broking (1) 2 Higher revenue (23%↑ y-o-y)
5 3 30% Private Equity 1 (0) Funds being wound down through exits
(4) (18) Others / Elimination (1) (12)
2,240 2,513 12% Established businesses 312 398 28%
61 185 New Businesses (36) (39) Housing Finance, MyUniverse & Health
Insurance are in the investment phase
2,301 2,698 17% Total 277 359 30%
Note 1: Aditya Birla Nuvo Limited transferred its 51% stake in Birla Sun Life Insurance to ABCL w.e.f. 23rd Mar 2017. Previous year financials have been restated including earnings of BSLI to make performance comparable.
5

6 Aditya Birla Capital Copyright © 2017 Aditya Birla Capital
Performance highlights : Q1 FY 2017-18
6
7 Aditya Birla Capital Copyright © 2017 Aditya Birla Capital
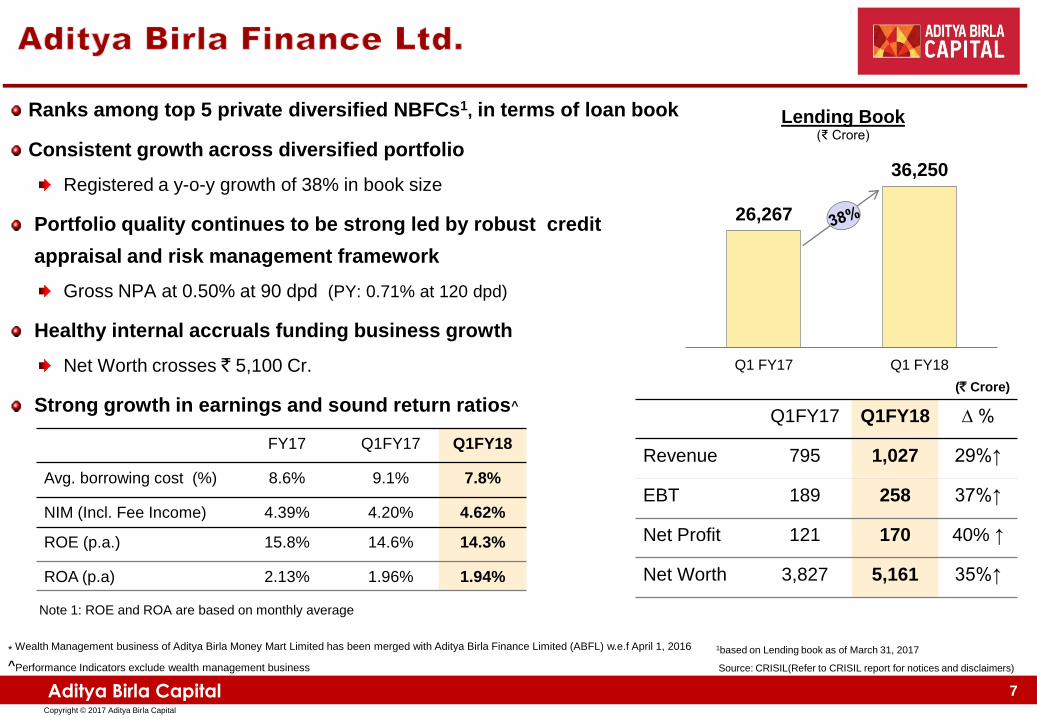
Ranks among top 5 private diversified NBFCs1, in terms of loan book
Consistent growth across diversified portfolio
Registered a y-o-y growth of 38% in book size
Portfolio quality continues to be strong led by robust credit
appraisal and risk management framework
Gross NPA at 0.50% at 90 dpd (PY: 0.71% at 120 dpd)
Healthy internal accruals funding business growth
Net Worth crosses ` 5,100 Cr.
Strong growth in earnings and sound return ratios^
* Wealth Management business of Aditya Birla Money Mart Limited has been merged with Aditya Birla Finance Limited (ABFL) w.e.f April 1, 2016
(` Crore)
Q1FY17 Q1FY18 ∆ %
Revenue 795 1,027 29%↑
EBT 189 258 37%↑
Net Profit 121 170 40% ↑
Net Worth 3,827 5,161 35%↑
26,267
36,250
Q1 FY17 Q1 FY18
Lending Book (₹ Crore)
1based on Lending book as of March 31, 2017
7
Note 1: ROE and ROA are based on monthly average
Source: CRISIL(Refer to CRISIL report for notices and disclaimers)
FY17 Q1FY17 Q1FY18
Avg. borrowing cost (%) 8.6% 9.1% 7.8%
NIM (Incl. Fee Income) 4.39% 4.20% 4.62%
ROE (p.a.) 15.8% 14.6% 14.3%
ROA (p.a) 2.13% 1.96% 1.94%
^Performance Indicators exclude wealth management business

8 Aditya Birla Capital Copyright © 2017 Aditya Birla Capital
LAS 8%
Project Loan 15%
Structured Finance 8%
TL / WCDL 17%
Cons Fin 4%
Project Loan 1%
Structured Finance 5%
TL / WCDL 6%
Digital & Unsecured 2%
LAP 4%
LAS 1%
Broker 1%
LAP 7%
LRD 6%
Supply Chain 3%
TL / WCDL 8%
Retail
7%
Loan Book Mix
` 36,250 Cr.
(Jun ’17)
Promoter & Ultra - HNI
8%
Large Corporate
40%
Mid Corporate
16%
SME
25%
Others
4%
8
9 Aditya Birla Capital Copyright © 2017 Aditya Birla Capital
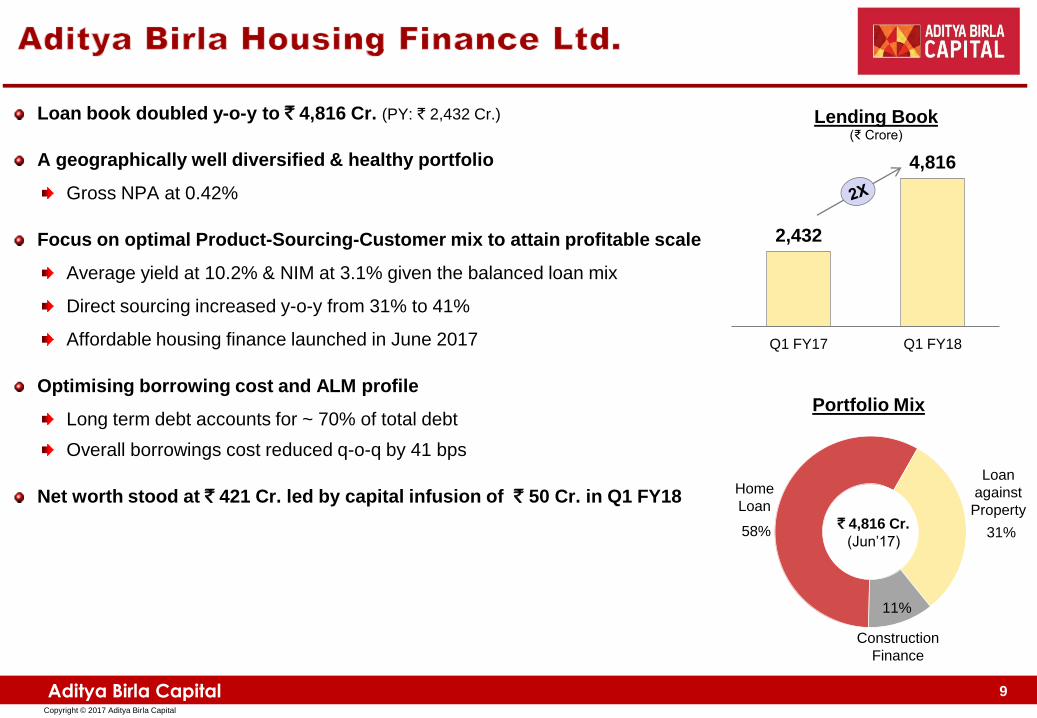
Loan book doubled y-o-y to ` 4,816 Cr. (PY: ` 2,432 Cr.)
A geographically well diversified & healthy portfolio
Gross NPA at 0.42%
Focus on optimal Product-Sourcing-Customer mix to attain profitable scale
Average yield at 10.2% & NIM at 3.1% given the balanced loan mix
Direct sourcing increased y-o-y from 31% to 41%
Affordable housing finance launched in June 2017
Optimising borrowing cost and ALM profile
Long term debt accounts for ~ 70% of total debt
Overall borrowings cost reduced q-o-q by 41 bps
Net worth stood at ` 421 Cr. led by capital infusion of ` 50 Cr. in Q1 FY18
58% 31%
11%
Construction
Finance
Loan
against
Property
Home
Loan
Portfolio Mix
` 4,816 Cr.
(Jun’17)
2,432
4,816
Q1 FY17 Q1 FY18
Lending Book (₹ Crore)
9
10 Aditya Birla Capital Copyright © 2017 Aditya Birla Capital
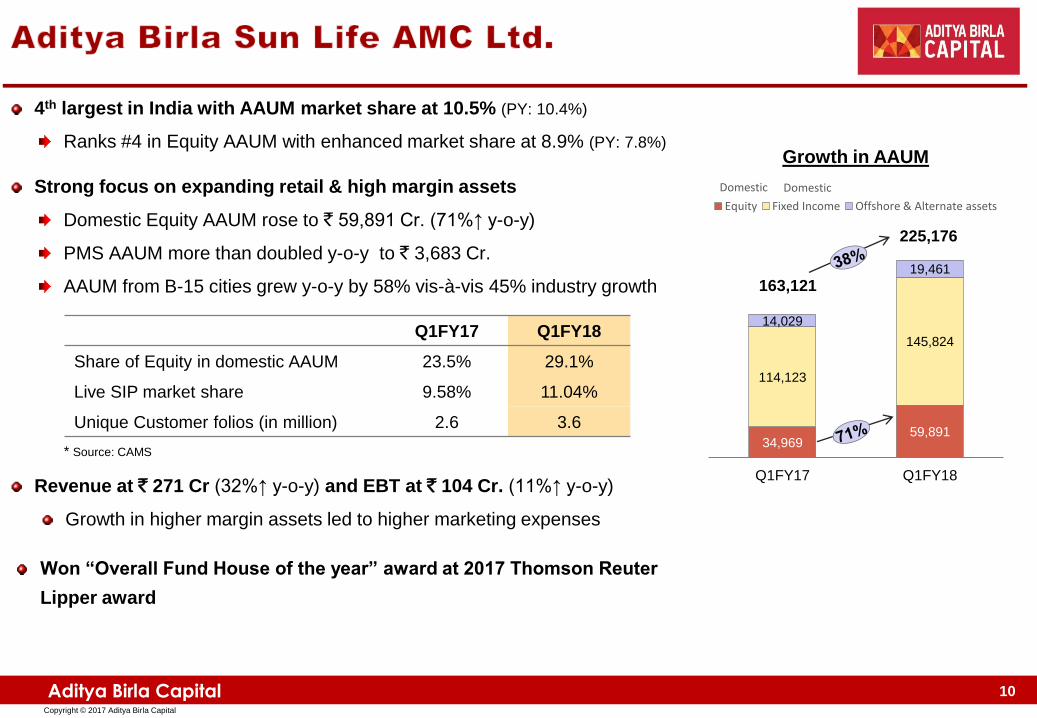
4th largest in India with AAUM market share at 10.5% (PY: 10.4%)
Ranks #4 in Equity AAUM with enhanced market share at 8.9% (PY: 7.8%)
Strong focus on expanding retail & high margin assets
Domestic Equity AAUM rose to ` 59,891 Cr. (71%↑ y-o-y)
PMS AAUM more than doubled y-o-y to ` 3,683 Cr.
AAUM from B-15 cities grew y-o-y by 58% vis-à-vis 45% industry growth
Revenue at ` 271 Cr (32%↑ y-o-y) and EBT at ` 104 Cr. (11%↑ y-o-y)
Growth in higher margin assets led to higher marketing expenses
Won “Overall Fund House of the year” award at 2017 Thomson Reuter
Lipper award
* Source: CAMS
Q1FY17 Q1FY18
Share of Equity in domestic AAUM 23.5% 29.1%
Live SIP market share 9.58% 11.04%
Unique Customer folios (in million) 2.6 3.6
10
34,969 59,891
114,123
145,824
14,029
19,461
Q1FY17 Q1FY18
Growth in AAUM
Equity Fixed Income Offshore & Alternate assets
Domestic Domestic
163,121
225,176
11 Aditya Birla Capital Copyright © 2017 Aditya Birla Capital
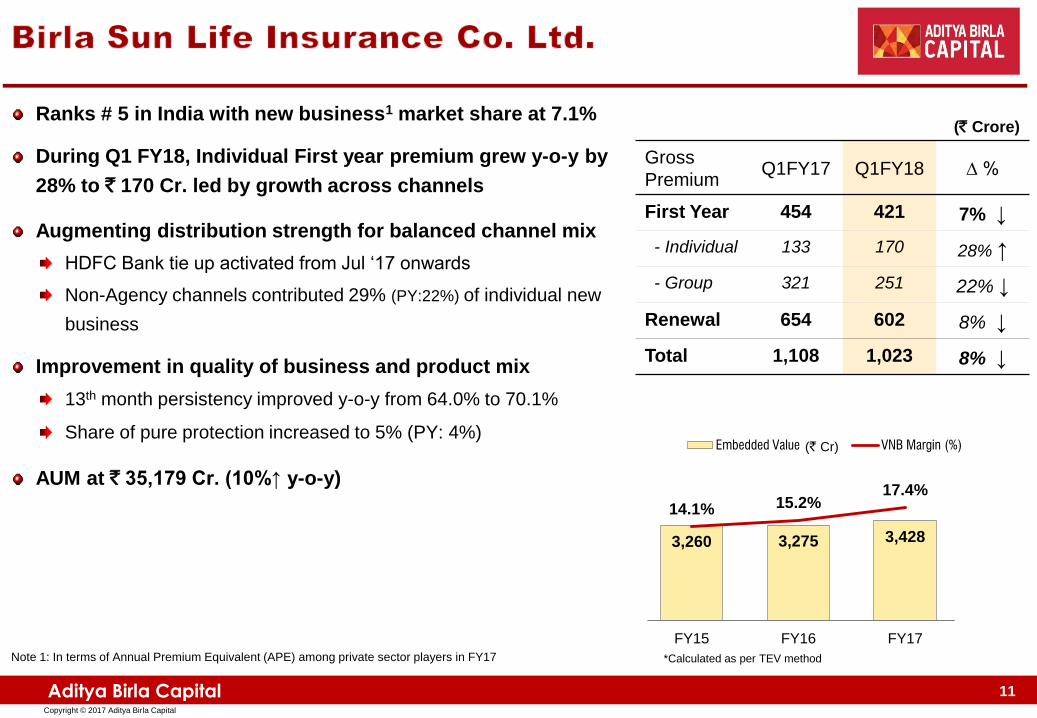
Ranks # 5 in India with new business1 market share at 7.1%
During Q1 FY18, Individual First year premium grew y-o-y by
28% to ` 170 Cr. led by growth across channels
Augmenting distribution strength for balanced channel mix
HDFC Bank tie up activated from Jul ‘17 onwards
Non-Agency channels contributed 29% (PY:22%) of individual new
business
Improvement in quality of business and product mix
13th month persistency improved y-o-y from 64.0% to 70.1%
Share of pure protection increased to 5% (PY: 4%)
AUM at ` 35,179 Cr. (10%↑ y-o-y)
3,260 3,275 3,428
14.1% 15.2% 17.4%
-2.0%
3.0%
8.0%
13.0%
18.0%
FY15 FY16 FY17
Embedded Value VNB Margin (%)
(` Crore)
Gross
Premium Q1FY17 Q1FY18 ∆ %
First Year 454 421 7% ↓
- Individual 133 170 28% ↑
- Group 321 251 22% ↓
Renewal 654 602 8% ↓
Total 1,108 1,023 8% ↓
(` Cr)
*Calculated as per TEV method Note 1: In terms of Annual Premium Equivalent (APE) among private sector players in FY17
11
12 Aditya Birla Capital Copyright © 2017 Aditya Birla Capital
Health insurance business with unique offerings including Chronic Care and
Incentivized Wellness
Move from “Buy & Forget” to “Buy & Engage” with philosophy of Health First
In Q1 FY18, Gross Premium written at ` 62 Cr and covering 4.2 lacs lives as on date
Multi channel distribution model activated
Activated 4 Banca tie ups - HDFC Bank, DCB, RBL & Deutsche Bank
Empanelled ~4,800 direct selling agents & ~ 200 brokers
Tied up with 1,900+ hospitals across 300 cities
Launched first brand and product campaign to the masses with 2 product propositions
Digital Ecosystem
‘Activ Health’ APP for empowering customer for self servicing and increased usage
launched in Q1 FY18
Awards and Recognition
Received multiple awards across categories for Product, Campaigns and Digital
innovation
12

13 Aditya Birla Capital Copyright © 2017 Aditya Birla Capital
ABIBL’s share in industry’s premium placement has grown to 2.75%
In Q1 FY18, ABIBL’s premium placement rose y-o-y by 46% to ` 916 Cr. while
general insurance industry’s premium grew by 22%.
Quarterly revenue at ` 47 Cr. (24%↑ y-o-y) and EBT at ` 19 Cr.
Reduction in average brokerage rate and change in product mix led to
lower margin
Aditya Birla Insurance Brokers Ltd.
Aditya Birla PE Advisors Pvt. Ltd.
Managing two funds with AUM at ` 1,179 Cr. (gross) and ` 727 Cr. (net after distributions)
Sector agnostic growth Funds, invested in 18 companies
Commenced Exits across both funds: 6 full exits and 5 partial exits. The Multiple of Cost (MOC) ranges are:
MOC over 3x 2 exits MOC 2x-3x 5 exits MOC 1.5x-2x 2 exits
2.30% 2.75%
Q1 FY17 Q1 FY18
Industry Premium Share
13
14 Aditya Birla Capital Copyright © 2017 Aditya Birla Capital
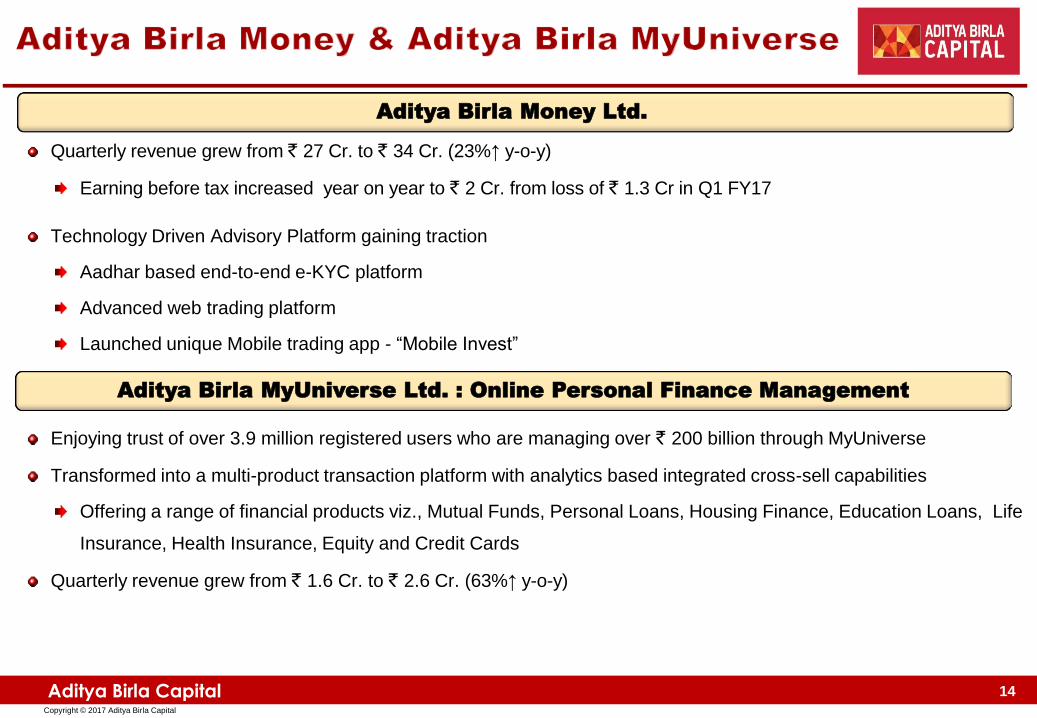
Quarterly revenue grew from ` 27 Cr. to ` 34 Cr. (23%↑ y-o-y)
Earning before tax increased year on year to ` 2 Cr. from loss of ` 1.3 Cr in Q1 FY17
Technology Driven Advisory Platform gaining traction
Aadhar based end-to-end e-KYC platform
Advanced web trading platform
Launched unique Mobile trading app - “Mobile Invest”
Enjoying trust of over 3.9 million registered users who are managing over ` 200 billion through MyUniverse
Transformed into a multi-product transaction platform with analytics based integrated cross-sell capabilities
Offering a range of financial products viz., Mutual Funds, Personal Loans, Housing Finance, Education Loans, Life
Insurance, Health Insurance, Equity and Credit Cards
Quarterly revenue grew from ` 1.6 Cr. to ` 2.6 Cr. (63%↑ y-o-y)
Aditya Birla Money Ltd.
Aditya Birla MyUniverse Ltd. : Online Personal Finance Management
14
15 Aditya Birla Capital Copyright © 2017 Aditya Birla Capital
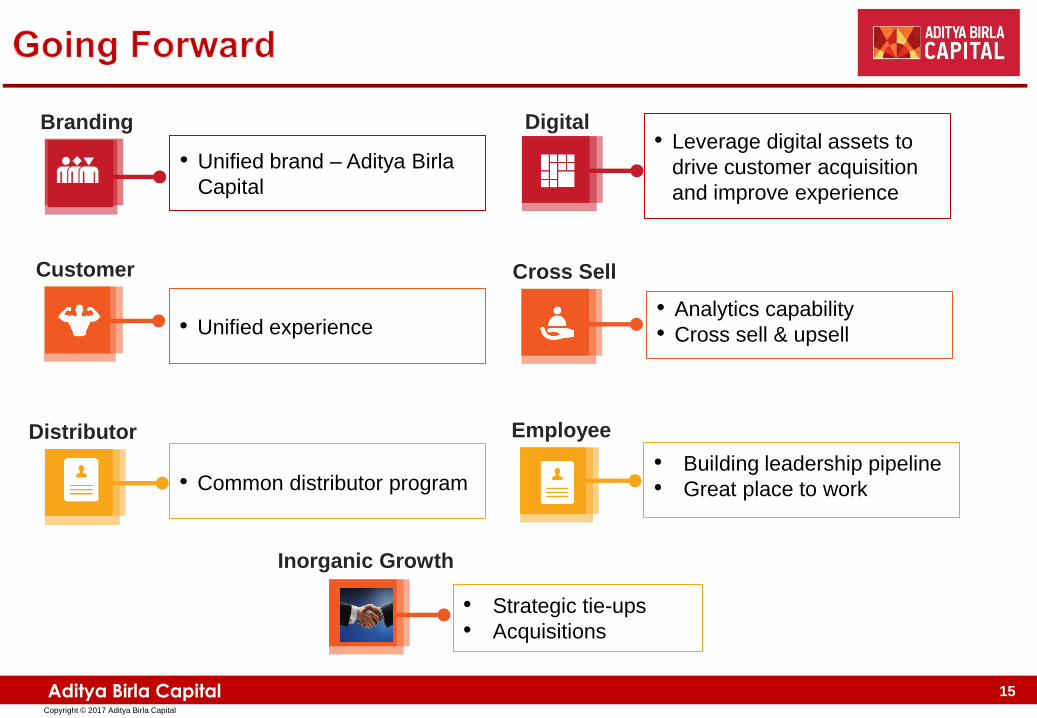
Customer Cross Sell
Distributor Employee
• Unified brand – Aditya Birla
Capital
• Unified experience
• Common distributor program
• Leverage digital assets to
drive customer acquisition
and improve experience
• Analytics capability
• Cross sell & upsell
• Building leadership pipeline
• Great place to work
Branding Digital
• Strategic tie-ups
• Acquisitions
Inorganic Growth
15

16 Aditya Birla Capital Copyright © 2017 Aditya Birla Capital
16
17 Aditya Birla Capital Copyright © 2017 Aditya Birla Capital
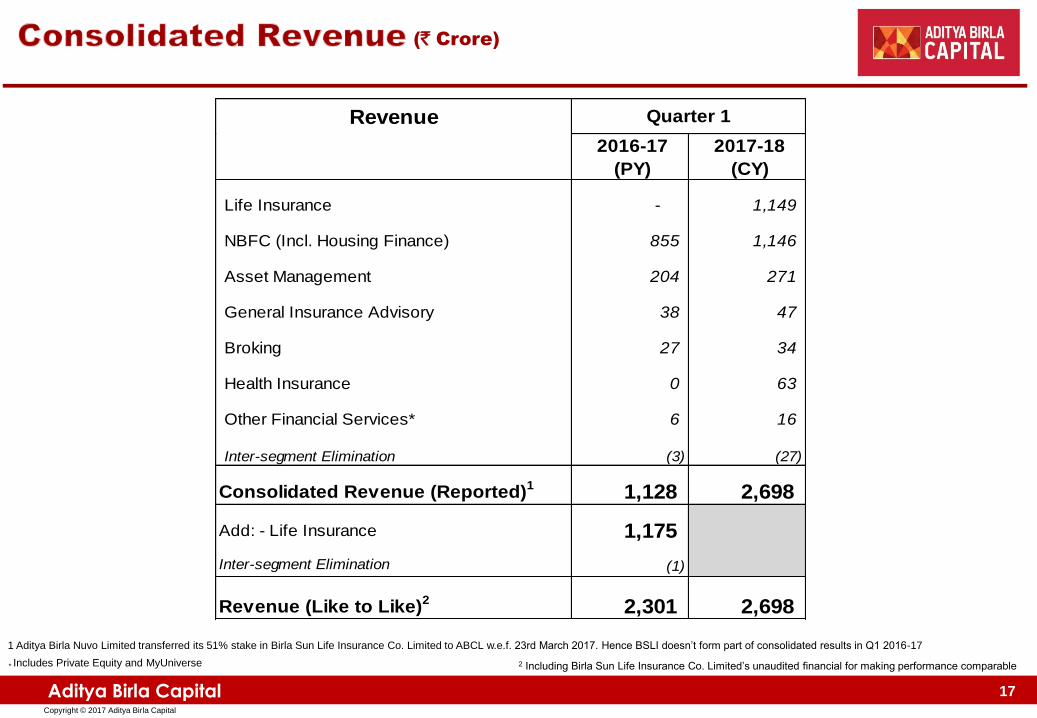
(` Crore)
* Includes Private Equity and MyUniverse
1 Aditya Birla Nuvo Limited transferred its 51% stake in Birla Sun Life Insurance Co. Limited to ABCL w.e.f. 23rd March 2017. Hence BSLI doesn’t form part of consolidated results in Q1 2016-17
17
2 Including Birla Sun Life Insurance Co. Limited’s unaudited financial for making performance comparable
Revenue
2016-17
(PY)
2017-18
(CY)
Life Insurance - 1,149
NBFC (Incl. Housing Finance) 855 1,146
Asset Management 204 271
General Insurance Advisory 38 47
Broking 27 34
Health Insurance 0 63
Other Financial Services* 6 16
Inter-segment Elimination (3) (27)
Consolidated Revenue (Reported)1 1,128 2,698
Add: - Life Insurance 1,175
Inter-segment Elimination (1)
Revenue (Like to Like)2 2,301 2,698
Quarter 1
18 Aditya Birla Capital Copyright © 2017 Aditya Birla Capital
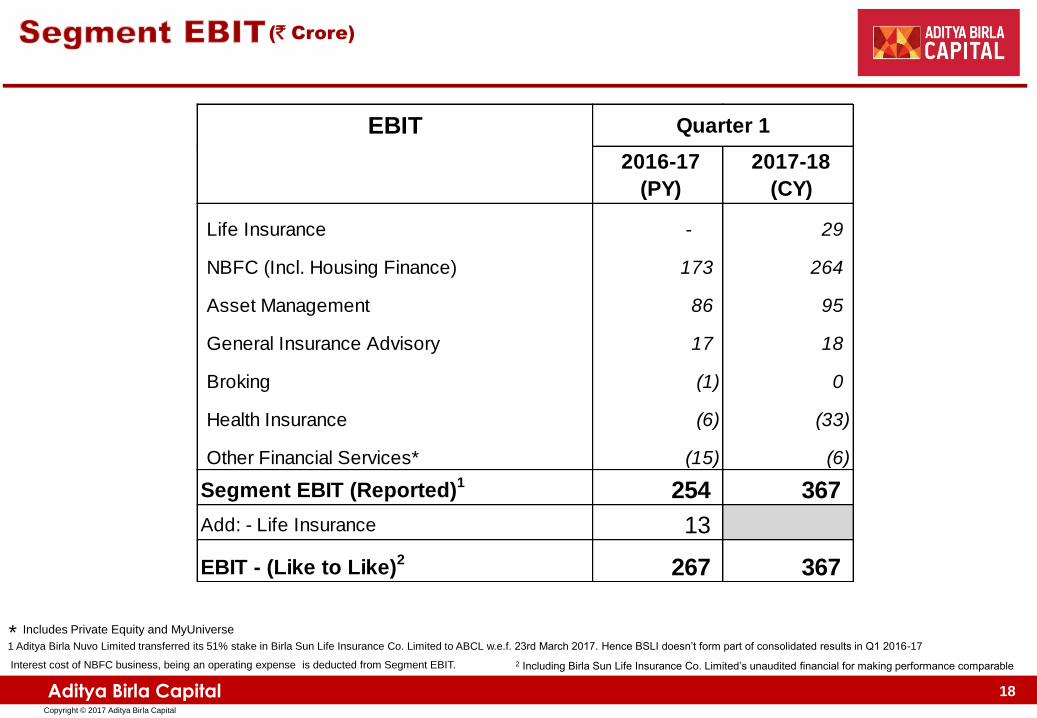
(` Crore)
* Includes Private Equity and MyUniverse
1 Aditya Birla Nuvo Limited transferred its 51% stake in Birla Sun Life Insurance Co. Limited to ABCL w.e.f. 23rd March 2017. Hence BSLI doesn’t form part of consolidated results in Q1 2016-17
Interest cost of NBFC business, being an operating expense is deducted from Segment EBIT.
18
EBIT
2016-17
(PY)
2017-18
(CY)
Life Insurance - 29
NBFC (Incl. Housing Finance) 173 264
Asset Management 86 95
General Insurance Advisory 17 18
Broking (1) 0
Health Insurance (6) (33)
Other Financial Services* (15) (6)
Segment EBIT (Reported)1 254 367
Add: - Life Insurance 13
EBIT - (Like to Like)2 267 367
Quarter 1
2 Including Birla Sun Life Insurance Co. Limited’s unaudited financial for making performance comparable
19 Aditya Birla Capital Copyright © 2017 Aditya Birla Capital
(` Crore)
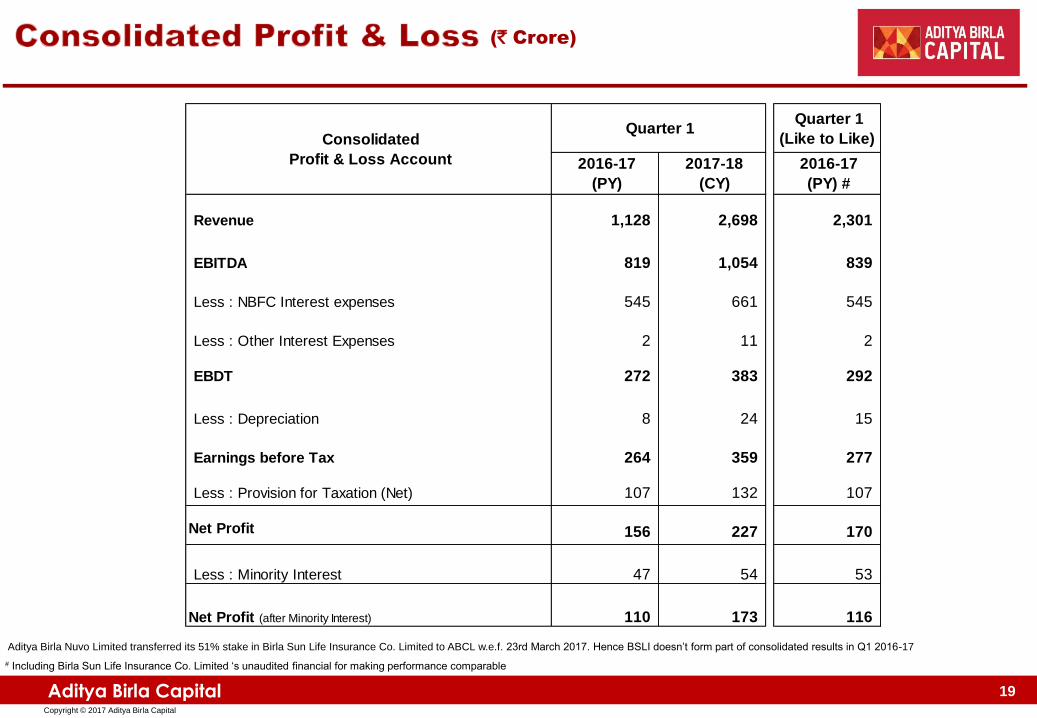
19
Aditya Birla Nuvo Limited transferred its 51% stake in Birla Sun Life Insurance Co. Limited to ABCL w.e.f. 23rd March 2017. Hence BSLI doesn’t form part of consolidated results in Q1 2016-17
# Including Birla Sun Life Insurance Co. Limited ‘s unaudited financial for making performance comparable
Quarter 1
(Like to Like)
2016-17
(PY)
2017-18
(CY)
2016-17
(PY) #
Revenue 1,128 2,698 2,301
EBITDA 819 1,054 839
Less : NBFC Interest expenses 545 661 545
Less : Other Interest Expenses 2 11 2
EBDT 272 383 292
Less : Depreciation 8 24 15
Earnings before Tax 264 359 277
Less : Provision for Taxation (Net) 107 132 107
Net Profit 156 227 170
Less : Minority Interest 47 54 53
Net Profit (after Minority Interest) 110 173 116
Consolidated
Profit & Loss Account
Quarter 1

20 Aditya Birla Capital Copyright © 2017 Aditya Birla Capital
20

21 Aditya Birla Capital Copyright © 2017 Aditya Birla Capital
Optimising borrowings cost and ALM profile
Long term debt accounts for ~70% of total debt
Long term / Short term credit rating at AA+ / A1+
Perpetual debt credit rating at AA
Strong performance across key parameters
Term Loans 29%
CC 6%
CP's 24%
NCD's 36%
Sub Debt 5%
Borrowings Mix (As on 30th Jun’17)
# Key Ratios & Spread Analysis are excluding wealth management business
Spread Analysis# Q1FY17 Q1FY18
Total Income (Excl. DCM & Syndication Fees) /
Avg. Loan Book12.0% 11.4%
Interest Cost / Avg. Loan Book 7.8% 6.7%
Net Interest Income (incl. fee income) 4.2% 4.6%
Opex / Avg Loan Book 0.8% 1.2%
NPA Prov, Diminution & Write Off /
Average Loan Book0.22% 0.35%
ROA 1.96% 1.94%
Key Ratios# Q1FY17 Q1FY18
Capital Adequacy Ratio 16.3% 17.6%
- Out of which Tier I 13.8% 13.8%
Average Borrowing Cost (%) 9.1% 7.8%
Closing Leverage (x) 5.8 5.9
Average Leverage (x) 5.8 5.8
No. of Employees 523 793
21

22 Aditya Birla Capital Copyright © 2017 Aditya Birla Capital
Focus on increasing geographical presence
Targeting to add 15 new branches to reach to 36 markets
(through 55 branches) by Mar ‘18 from current 34 markets
(though 41 branches in 16 states)
Strong performance across key parameters
Direct, 41%
Channel Partners, 59%
Sourcing Mix (%)
Key Ratios Q1FY17 Q1FY18
Capital Adequacy Ratio 13.9% 15.7%
- Out of which Tier I 13.3% 10.2%
Yield (%) 10.7% 10.2%
Average Borrowing Cost (%) 9.4% 7.8%
Net Interest Margin (%)
(Excl. Fee Income & DSA) 2.8% 3.1%
Segment-wise Loan book (EOP) Jun'16 Mar'17 Jun'17
Housing Loan 1,412 2,316 2,790
LAP/LRD 852 1,325 1,494
Construction Finance 168 495 532
Total 2,432 4,136 4,816
22
2016-17
(PY)
2017-18
(CY)
Revenue 60 119
Earnings before tax (17) 4
Net Worth 286 421
Closing Leverage (x) 7.5x 10.3x
Average Leverage (x) 7.2x 9.7x
Quarter 1
` Crore
23 Aditya Birla Capital Copyright © 2017 Aditya Birla Capital
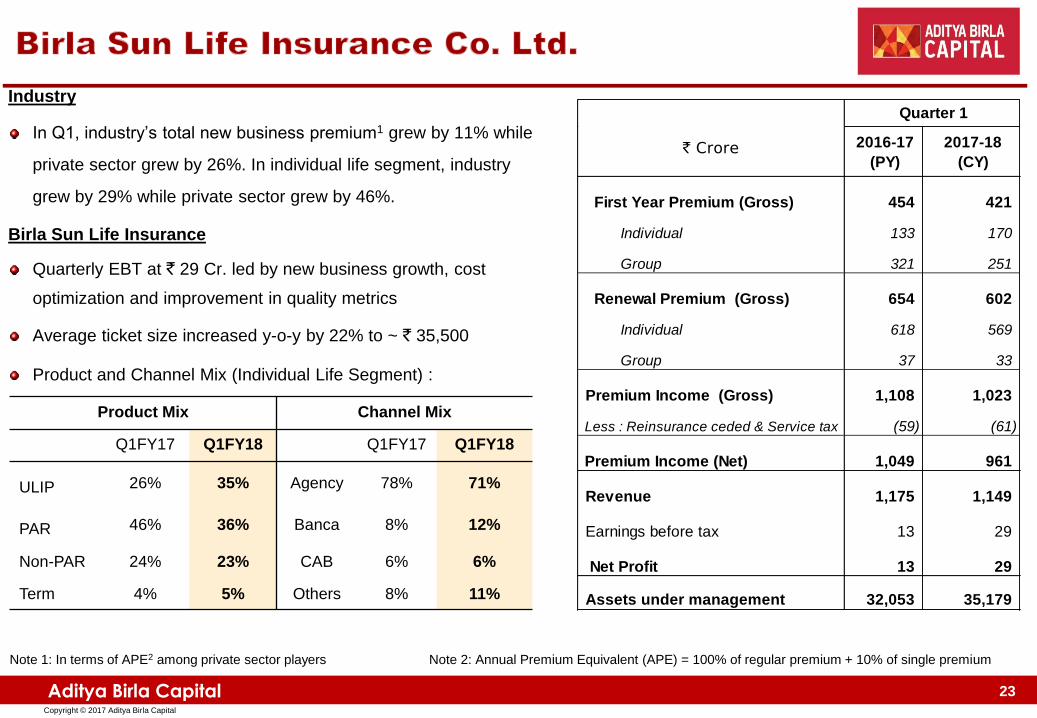
Industry
In Q1, industry’s total new business premium1 grew by 11% while
private sector grew by 26%. In individual life segment, industry
grew by 29% while private sector grew by 46%.
Birla Sun Life Insurance
Quarterly EBT at ` 29 Cr. led by new business growth, cost
optimization and improvement in quality metrics
Average ticket size increased y-o-y by 22% to ~ ` 35,500
Product and Channel Mix (Individual Life Segment) :
Note 1: In terms of APE2 among private sector players Note 2: Annual Premium Equivalent (APE) = 100% of regular premium + 10% of single premium
Product Mix Channel Mix
Q1FY17 Q1FY18 Q1FY17 Q1FY18
ULIP 26% 35% Agency 78% 71%
PAR 46% 36% Banca 8% 12%
Non-PAR 24% 23% CAB 6% 6%
Term 4% 5% Others 8% 11%
2016-17
(PY)
2017-18
(CY)
First Year Premium (Gross) 454 421
Individual 133 170
Group 321 251
Renewal Premium (Gross) 654 602
Individual 618 569
Group 37 33
Premium Income (Gross) 1,108 1,023
Less : Reinsurance ceded & Service tax (59) (61)
Premium Income (Net) 1,049 961
Revenue 1,175 1,149
Earnings before tax 13 29
Net Profit 13 29
Assets under management 32,053 35,179
Quarter 1
` Crore
23
24 Aditya Birla Capital Copyright © 2017 Aditya Birla Capital
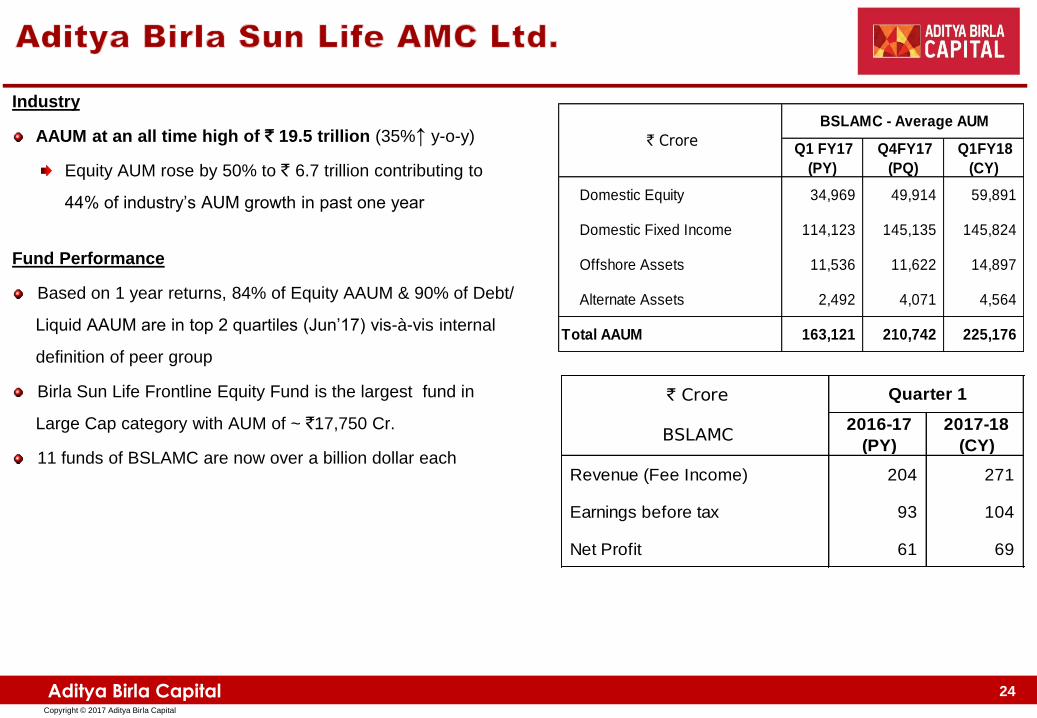
Industry
AAUM at an all time high of ` 19.5 trillion (35%↑ y-o-y)
Equity AUM rose by 50% to ` 6.7 trillion contributing to
44% of industry’s AUM growth in past one year
Fund Performance
Based on 1 year returns, 84% of Equity AAUM & 90% of Debt/
Liquid AAUM are in top 2 quartiles (Jun’17) vis-à-vis internal
definition of peer group
Birla Sun Life Frontline Equity Fund is the largest fund in
Large Cap category with AUM of ~ `17,750 Cr.
11 funds of BSLAMC are now over a billion dollar each
Q1 FY17
(PY)
Q4FY17
(PQ)
Q1FY18
(CY)
Domestic Equity 34,969 49,914 59,891
Domestic Fixed Income 114,123 145,135 145,824
Offshore Assets 11,536 11,622 14,897
Alternate Assets 2,492 4,071 4,564
Total AAUM 163,121 210,742 225,176
` Crore
BSLAMC - Average AUM
` Crore
BSLAMC 2016-17
(PY)
2017-18
(CY)
Revenue (Fee Income) 204 271
Earnings before tax 93 104
Net Profit 61 69
Quarter 1
Revenues
24
25 Aditya Birla Capital Copyright © 2017 Aditya Birla Capital
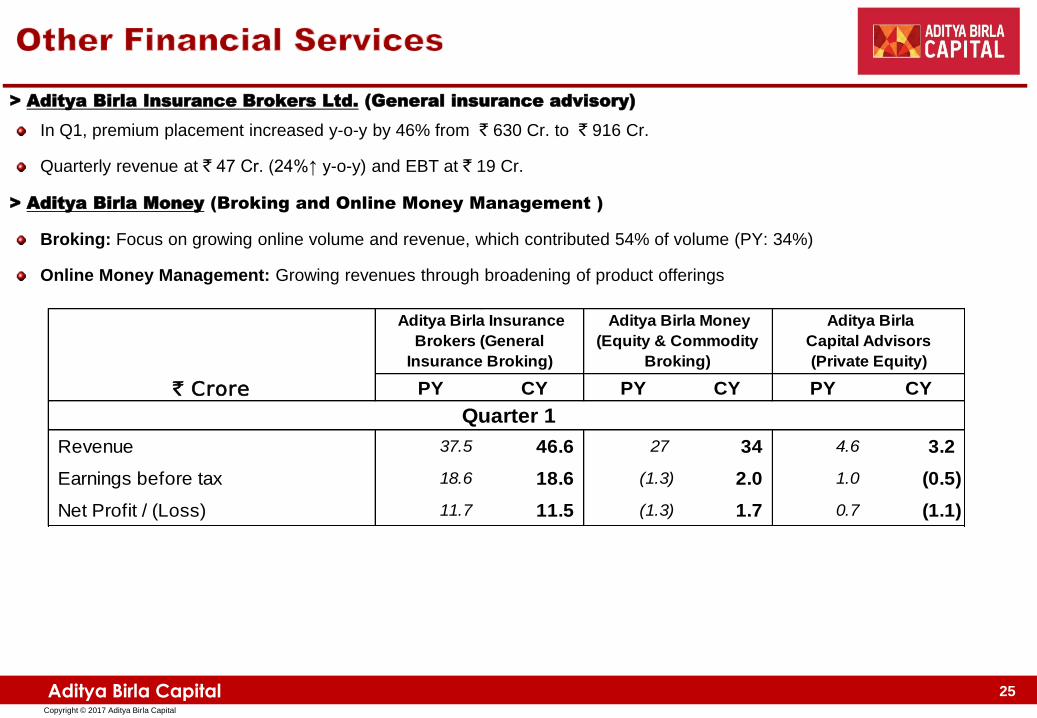
> Aditya Birla Insurance Brokers Ltd. (General insurance advisory)
In Q1, premium placement increased y-o-y by 46% from ` 630 Cr. to ` 916 Cr.
Quarterly revenue at ` 47 Cr. (24%↑ y-o-y) and EBT at ` 19 Cr.
> Aditya Birla Money (Broking and Online Money Management )
Broking: Focus on growing online volume and revenue, which contributed 54% of volume (PY: 34%)
Online Money Management: Growing revenues through broadening of product offerings
PY CY PY CY PY CY
Revenue 37.5 46.6 27 34 4.6 3.2
Earnings before tax 18.6 18.6 (1.3) 2.0 1.0 (0.5)
Net Profit / (Loss) 11.7 11.5 (1.3) 1.7 0.7 (1.1)
Aditya Birla
Capital Advisors
(Private Equity)
Aditya Birla Insurance
Brokers (General
Insurance Broking)
Quarter 1
Aditya Birla Money
(Equity & Commodity
Broking)
` Crore
25

26 Aditya Birla Capital Copyright © 2017 Aditya Birla Capital
Contact Us
CIN: U67120GJ2007PLC058890
Regd. Office: Indian Rayon Compound, Veraval – 362 266, Gujrat
Corporate Office: One Indiabulls Centre, Tower 1, Jupiter Mills Compound, 841, Senapati Bapat Marg, Elphinstone Road, Mumbai – 400 013
Website: www.adityabirlacapital.com
Aditya Birla Capital Limited
26

27 Aditya Birla Capital Copyright © 2017 Aditya Birla Capital
The information contained in this presentation is provided by Aditya Birla Capital Limited (“ABCL or the Company”), formerly known as Aditya Birla Financial Services Limited, to you solely for your
reference. This document is being given solely for your information and for your use and may not be retained by you and neither this presentation nor any part thereof may be (i) used or relied upon
by any other party or for any other purpose; (ii) copied, photocopied, duplicated or otherwise reproduced in any form or by any means; or (iii) re-circulated, redistributed, passed on, published in any
media, website or otherwise disseminated, to any other person, in any form or manner, in part or as a whole, without the prior written consent of the Company. This presentation does not purport to
be a complete description of the markets conditions or developments referred to in the material. Any reference herein to "the Company" shall mean Aditya Birla Capital Limited, together with its
subsidiaries / joint ventures.
Although care has been taken to ensure that the information in this presentation is accurate, and that the opinions expressed are fair and reasonable, the information is subject to change without
notice, its accuracy, fairness or completeness is not guaranteed and has not been independently verified and no express or implied warranty is made thereto. You must make your own assessment of
the relevance, accuracy and adequacy of the information contained in this presentation and must make such independent investigation as you may consider necessary or appropriate for such
purpose. Neither the Company nor any of its directors, officers, employees or affiliates nor any other person assume any responsibility or liability for, the accuracy or completeness of, or any errors or
omissions in, any information or opinions contained herein, and none of them accept any liability (in negligence, or otherwise) whatsoever for any loss howsoever arising from any use of this
presentation or its contents or otherwise arising in connection therewith. Any unauthorised use, disclosure or public dissemination of information contained herein is prohibited. The distribution of this
presentation in certain jurisdictions may be restricted by law. Accordingly, any persons in possession of the aforesaid should inform themselves about and observe such restrictions. The statements contained in this document speak only as at the date as of which they are made, and the Company expressly disclaims any obligation or undertaking to supplement, amend or
disseminate any updates or revisions to any statements contained herein to reflect any change in events, conditions or circumstances on which any such statements are based. By preparing this
presentation, neither the Company nor its management undertakes any obligation to provide the recipient with access to any additional information or to update this presentation or any additional
information or to correct any inaccuracies in any such information which may become apparent. This document is for informational purposes and private circulation only and does not constitute or
form part of a prospectus, a statement in lieu of a prospectus, an offering circular, offering memorandum, an advertisement, and should not be construed as an offer to sell or issue or the solicitation of
an offer or an offer document to buy or acquire or sell securities of the Company or any of its subsidiaries or affiliates under the Companies Act, 2013, the Securities and Exchange Board of India
(Issue of Capital and Disclosure Requirements) Regulations, 2009, both as amended, or any applicable law in India or as an inducement to enter into investment activity. No part of this document
should be considered as a recommendation that any investor should subscribe to or purchase securities of the Company or any of its subsidiaries or affiliates and should not form the basis of, or be
relied on in connection with, any contract or commitment or investment decision whatsoever. This document is not financial, legal, tax, investment or other product advice. The Company, its shareholders, representatives and advisors and their respective affiliates also reserves the right, without advance notice, to change the procedure or to terminate negotiations at any
time prior to the entry into of any binding contract for any potential transaction. This presentation contains statements of future expectations and other forward-looking statements which involve risks
and uncertainties. These statements include descriptions regarding the intent, belief or current expectations of the Company or its officers with respect to the consolidated results of operations and
financial condition, and future events and plans of the Company. These statements can be recognised by the use of words such as “expects,” “plans,” “will,” “estimates,” or words of similar meaning.
Such forward-looking statements are not guarantees of future performance and actual results, performances or events may differ from those in the forward-looking statements as a result of various
factors and assumptions. You are cautioned not to place undue reliance on these forward looking statements, which are based on the current view of the management of the Company on future
events. No assurance can be given that future events will occur, or that assumptions are correct. The Company does not assume any responsibility to amend, modify or revise any forward-looking
statements, on the basis of any subsequent developments, information or events, or otherwise.
This presentation is not an offer of securities for sale in the United States or in any other jurisdiction. Securities may not be offered or sold in the United States absent registration or an exemption from
registration under the U.S Securities Act of 1933, as amended.
27


